Testing the Means of the Grouped Data
The results presented below were calculated using two-sample t-tests
on distributions of potassium (K), uranium (eU), and thorium (eTh) measured
for the soil samples. The data were grouped based on the classification
results of the airborne data from Duval (2005)
and the groups were identified as Goliad Formation (Tg), Beaumont Formation
(Qb), Lissie Formation (Ql) and/or dune sand (Qds), and recent alluvium
(Qal) as interpreted by Duval (2005).
One additional group is denoted as "Alt" and corresponds to
areas where Duval (2005)
indicates that the airborne data are questionable.
The results of the two-sample t-tests are presented in tables (e.g.
Table 2) that list the number of samples, mean
values, and standard deviations for potassium, uranium, and thorium concentrations
in the samples followed by graphs (e.g. Figure 7)
that show box-whisker plots (refer to the glossary for more information)
as well as histograms and calculated normal probability curves. The t-test
results are listed separately in tables (e.g. Table
2.1) below the figures. For each test we are separately comparing
the mean values of one of the radioactive elements for two groups. The
results provided consider the variances independently and pooled. In either
case the information includes the difference in the mean values, the range
of differences for a 95 percent confidence interval, the calculated value
of t, the degrees of freedom, and the probability value. If the probability
values (p) are less than 0.05, the data values are considered to represent
different populations at a 95 percent confidence level.
The results of these calculations show that the group interpreted as
soils of the Goliad Formation (Tg) is distinct from the soils associated
with the Beaumont Formation (see Goliad vs Beaumont),
from the Lissie Formation and/or dune sand (see Goliad
vs Lissie), and from recent alluvium (see Goliad
vs Alluvium) at a 95 percent confidence level. The soil samples associated
with the recent alluvium (Qal) form a group that is distinct from those
associated with the Beaumont Formation (see Alluvium
vs Beaumont) and from the Lissie Formation and/or dune sand (see Alluvium vs Lissie),
Although alluvium soils are distinct from the Lissie soils based upon
all three radioactive elements, the potassium distributions are not significantly
different (refer to Table 5.1). The samples associated with the Beaumont
Formation (Qb) are distinct from the Lissie samples but only at a confidence
level somewhat greater than 90 percent and less than 95 percent (refer
to Table 11.1). Figure 17
is a 3-dimensional view of the estimated means values of K, eU, and eTh
for the groups and shows that the sample groups are distinct. Figure 18 plots the mean values with the standard
deviations and indicates significant overlap among the sample analyses.
The comparisons of the four samples denoted as Alt indicate that the
Alt group is distinct from the Beaumont (refer to Table
7.1) and alluvium (refer to Table 9.1) groups
at a 95 percent confidence level and from the (refer to Table
8.1) Lissie group at a confidence level somewhat greater than 90 percent
but less than 95 percent. The Alt group is not distinct from the Goliad
group (refer to Table 10.1). Because these calculations
are made using mean values and standard deviations from only four samples,
maximum likelihood estimates were used to determine to which of the other
groups the four samples should be assigned. The maximum likelihood calculations
indicate that samples ST-142 and ST-143 are members of group Goliad. Sample
ST-189 could be a member of group alluvium or Lissie and sample ST-211
is a member of Beaumont.
Two-sample t-tests for
Goliad versus alluvium
Table 2. Listing of the mean values and standard
deviations of K, eU, and eTh for Goliad versus alluvium.
|
|
|
Potassium |
Uranium |
Thorium |
|
Group |
N |
Mean |
SD |
Mean |
SD |
Mean |
SD |
|
alluvium |
39 |
1.75 |
0.27 |
2.7 |
0.6 |
7.7 |
1.9 |
|
Goliad |
36 |
1.46 |
0.15 |
1.3 |
0.2 |
3.8 |
0.8 |
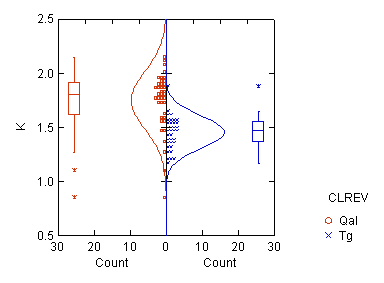 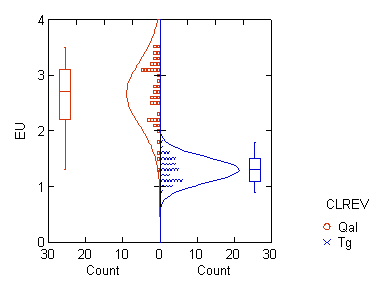 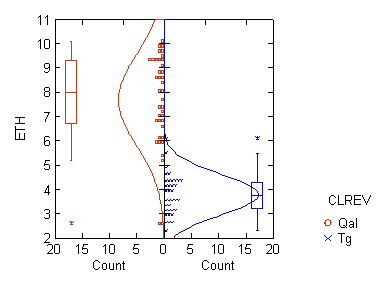
Figure 7. Graphs comparing the distributions
of K, eU, and eTh for Goliad vs alluvium.
Table 2.1.
Listing of t-test results for the hypothesis that the mean values of the
radioelement distributions for groups Goliad and alluvium are equal.
|
|
Potassium |
Uranium |
Thorium |
|
|
Separate variance |
Pooled variance |
Separate variance |
Pooled variance |
Separate variance |
Pooled variance |
|
Difference in means |
0.30 |
0.30 |
1.4 |
1.4 |
3.9 |
3.9 |
|
95.00% CI |
0.20 to 0.39 |
0.19 to 0.40 |
1.2 to 1.6 |
1.2 to 1.6 |
3.2 to 4.5 |
3.2 to 4.6 |
|
t |
5.9 |
5.8 |
13.7 |
13.3 |
11.9 |
11.6 |
|
df |
60.2 |
73 |
49.9 |
73 |
53.5 |
73 |
|
p-value |
0.0 |
0.0 |
0.0 |
0.0 |
0.0 |
0.0 |
Two-sample t-tests for
Goliad versus Beaumont
Table 3. Listing of the mean values and standard
deviations of K, eU, and eTh for Goliad versus Beaumont.
|
|
|
Potassium |
Uranium |
Thorium |
|
Group |
N |
Mean |
SD |
Mean |
SD |
Mean |
SD |
|
Beaumont |
14 |
1.92 |
0.23 |
2.1 |
0.4 |
6.6 |
1.1 |
|
Goliad |
36 |
1.46 |
0.15 |
1.3 |
0.2 |
3.8 |
0.8 |
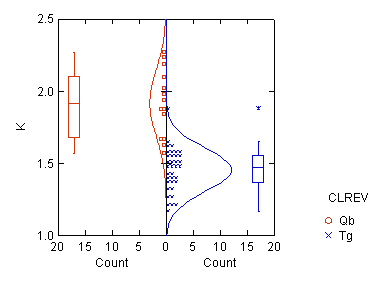 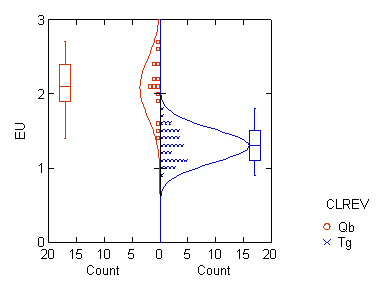 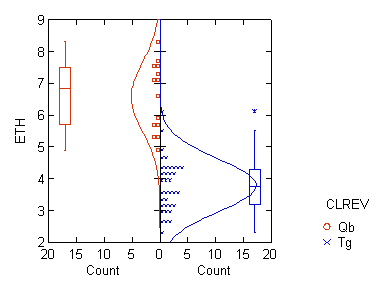
Figure 8. Graphs comparing the distributions
of K, eU, and eTh for Goliad vs Beaumont.
Table
3.1. Listing of t-test results for the hypothesis that the mean values
of the radioelement distributions for groups Goliad and Beaumont are equal.
|
|
Potassium |
Uranium |
Thorium |
|
|
Separate variance |
Pooled variance |
Separate variance |
Pooled variance |
Separate variance |
Pooled variance |
|
Difference in means |
0.47 |
0.47 |
0.79 |
0.79 |
2.8 |
2.8 |
|
95.00% CI |
0.33 to 0.60 |
0.35 to 0.58 |
0.6 to 1.0 |
0.6 to 1.0 |
2.1 to 3.5 |
2.2 to 3.4 |
|
t |
7.0 |
8.5 |
7.1 |
9.0 |
8.7 |
9.8 |
|
df |
17.4 |
48 |
16.5 |
48 |
19.2 |
48 |
|
p-value |
0.0 |
0.0 |
0.0 |
0.0 |
0.0 |
0.0 |
Two-sample t-tests for
Goliad versus Lissie
Table 4. Listing of the mean values and standard
deviations of K, eU, and eTh for Goliad versus Lissie.
|
|
|
Potassium |
Uranium |
Thorium |
|
Group |
N |
Mean |
SD |
Mean |
SD |
Mean |
SD |
|
Lissie |
13 |
1.72 |
0.29 |
1.8 |
0.4 |
5.6 |
1.3 |
|
Goliad |
36 |
1.46 |
0.15 |
1.3 |
0.2 |
3.8 |
0.8 |
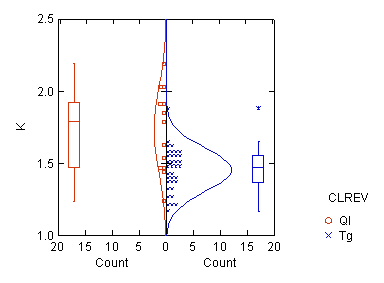 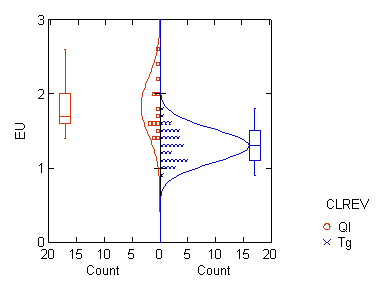 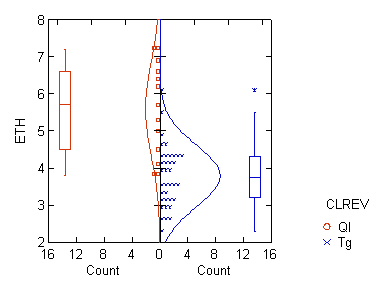
Figure 9. Graphs comparing the distributions
of K, eU, and eTh for Tg vs Lissie.
Table
4.1. Listing of t-test results for the hypothesis that the mean values
of the radioelement distributions for groups Goliad and Lissie are equal.
|
|
Potassium |
Uranium |
Thorium |
|
|
Separate variance |
Pooled variance |
Separate variance |
Pooled variance |
Separate variance |
Pooled variance |
|
Difference in means |
0.28 |
0.28 |
0.5 |
0.5 |
1.8 |
1.8 |
|
95.00% CI |
0.10 to 0.46 |
0.15 to 0.40 |
0.3 to 0.8 |
0.4 to 0.7 |
1.0 to 2.6 |
1.2 to 2.4 |
|
t |
3.3 |
4.4 |
4.7 |
6.0 |
4.8 |
5.9 |
|
df |
14.4 |
47 |
15.1 |
47 |
16.0 |
47 |
|
p-value |
0.01 |
0.0 |
0.0 |
0.0 |
0.0 |
0.0 |
Two-sample t-tests for
alluvium versus Lissie
Table 5. Listing of the mean values and standard
deviations of K, eU, and eTh for alluvium versus Lissie.
|
|
|
Potassium |
Uranium |
Thorium |
|
Group |
N |
Mean |
SD |
Mean |
SD |
Mean |
SD |
|
alluvium |
39 |
1.750 |
0.268 |
2.674 |
0.579 |
7.679 |
1.855 |
|
Lissie |
13 |
1.732 |
0.287 |
1.831 |
0.384 |
5.600 |
1.254 |
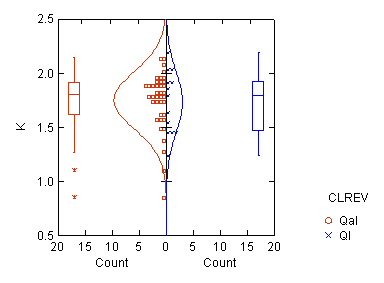 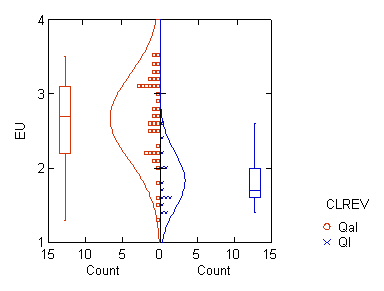 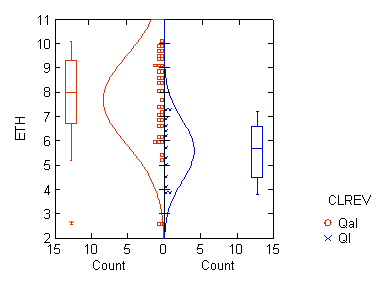
Figure 10. Graphs comparing the distributions
of K, eU, and eTh for alluvium vs Lissie.
Table
5.1. Listing of t-test results for the hypothesis that the mean values
of the radioelement distributions for groups Lissie and alluvium are equal.
|
|
Potassium |
Uranium |
Thorium |
|
|
Separate variance |
Pooled variance |
Separate variance |
Pooled variance |
Separate variance |
Pooled variance |
|
Difference in means |
0.02 |
0.02 |
0.8 |
0.8 |
2.1 |
2.1 |
|
95.00% CI |
-0.17 to 0.21 |
-0.16 to 0.19 |
0.6 to 1.1 |
0.5 to 1.2 |
1.1 to 3.0 |
1.0 to 3.2 |
|
t |
0.2 |
0.2 |
6.0 |
4.9 |
4.5 |
3.8 |
|
df |
19.5 |
50 |
31.2 |
50 |
30.7 |
50 |
|
p-value |
0.85 |
0.84 |
0.0 |
0.0 |
0.0 |
0.0 |
Two-sample t-tests for
alluvium versus Beaumont
Table 6. Listing of the mean values and standard
deviations of K, eU, and eTh for alluvium versus Beaumont.
|
|
|
Potassium |
Uranium |
Thorium |
|
Group |
N |
Mean |
SD |
Mean |
SD |
Mean |
SD |
|
alluvium |
39 |
1.750 |
0.268 |
2.674 |
0.579 |
7.679 |
1.855 |
|
Beaumont |
14 |
1.920 |
0.230 |
2.086 |
0.388 |
6.571 |
1.084 |
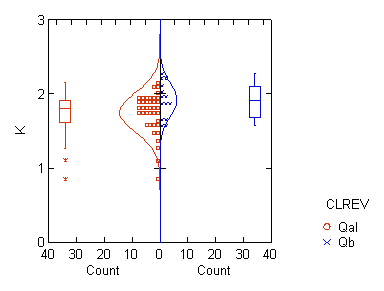 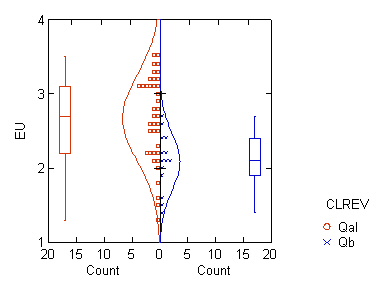 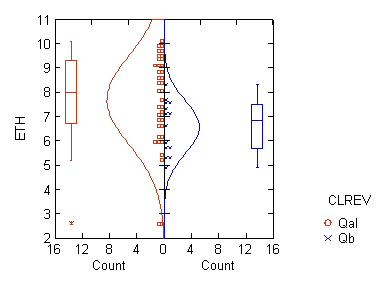
Figure 11. Graphs comparing the distributions
of K, eU, and eTh for alluvium vs Beaumont.
Table
6.1. Listing of t-test results for the hypothesis that the mean values
of the radioelement distributions for groups Beaumont and alluvium are
equal.
|
|
Potassium |
Uranium |
Thorium |
|
|
Separate variance |
Pooled variance |
Separate variance |
Pooled variance |
Separate variance |
Pooled variance |
|
Difference in means |
-0.17 |
-0.17 |
0.6 |
0.6 |
1.1 |
1.1 |
|
95.00% CI |
-0.32 to -0.02 |
-0.33 to -0.01 |
0.3 to 0.9 |
0.3 to 0.9 |
0.3 to 1.9 |
0.1 to 2.2 |
|
t |
-2.3 |
-2.1 |
4.2 |
3.5 |
2.7 |
2.1 |
|
df |
26.6 |
51 |
34.6 |
51 |
39.7 |
51 |
|
p-value |
0.03 |
0.04 |
0.0 |
0.0 |
0.01 |
0.04 |
Two-sample t-tests for
Alt versus Beaumont
Table 7. Listing of the mean values and standard
deviations of K, eU, and eTh for Alt versus Beaumont.
|
|
|
Potassium |
Uranium |
Thorium |
|
Group |
N |
Mean |
SD |
Mean |
SD |
Mean |
SD |
|
Alt |
4 |
1.305 |
0.293 |
1.325 |
0.359 |
3.875 |
1.297 |
|
Beaumont |
14 |
1.920 |
0.230 |
2.086 |
0.388 |
6.571 |
1.084 |
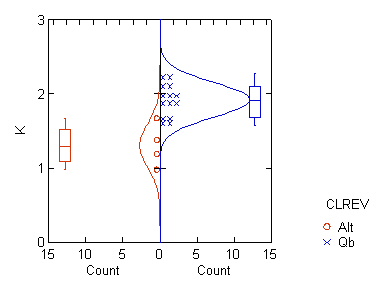 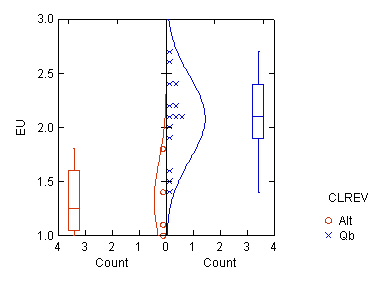 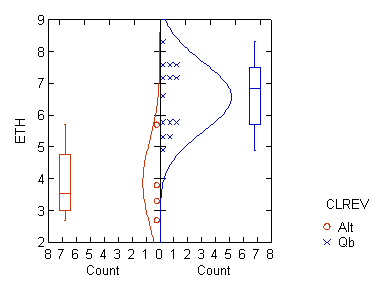
Figure 12. Graphs comparing the distributions
of K, eU, and eTh for Alt vs Lissie.
Table
7.1. Listing of t-test results for the hypothesis that the mean values
of the radioelement distributions for groups Alt and Lissie are equal.
|
|
Potassium |
Uranium |
Thorium |
|
|
Separate variance |
Pooled variance |
Separate variance |
Pooled variance |
Separate variance |
Pooled variance |
|
Difference in means |
-0.62 |
-0.62 |
-0.8 |
-0.8 |
-2.7 |
-2.7 |
|
95.00% CI |
-1.05 to -0.18 |
-0.91 to -0.32 |
-1.3 to -0.2 |
-1.2 to -0.3 |
-4.6 to -0.8 |
-4.1 to -1.3 |
|
t |
-3.9 |
-4.5 |
-3.7 |
-3.5 |
-3.8 |
-4.2 |
|
df |
4.1 |
16 |
5.2 |
16 |
4.3 |
16 |
|
p-value |
0.02 |
0.0 |
0.01 |
0.0 |
0.02 |
0.0 |
Two-sample t-tests for
Alt versus Lissie
Table 8. Listing of the mean values and standard
deviations of K, eU, and eTh for Alt versus Lissie.
|
|
|
Potassium |
Uranium |
Thorium |
|
Group |
N |
Mean |
SD |
Mean |
SD |
Mean |
SD |
|
Alt |
4 |
1.305 |
0.293 |
1.325 |
0.359 |
3.875 |
1.297 |
|
Lissie |
13 |
1.732 |
0.287 |
1.831 |
0.384 |
5.600 |
1.254 |
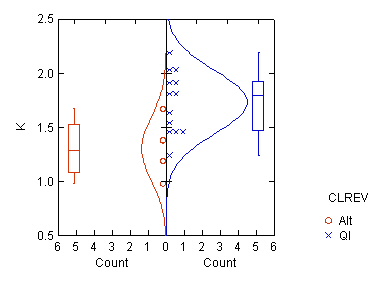 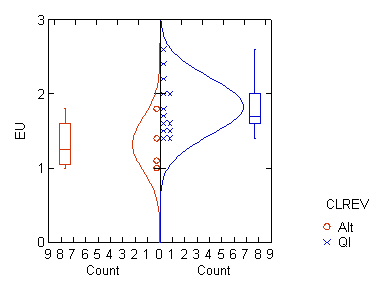 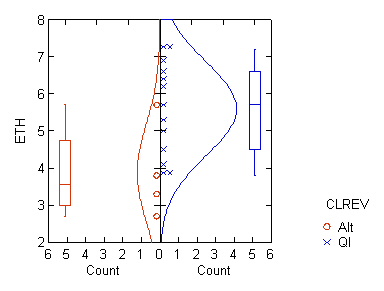
Figure 13.
Graphs comparing the distributions of K, eU, and eTh for Alt vs Lissie.
Table
8.1. Listing of t-test results for the hypothesis that the mean values
of the radioelement distributions for groups Alt and Lissie are equal.
|
|
Potassium |
Uranium |
Thorium |
|
|
Separate variance |
Pooled variance |
Separate variance |
Pooled variance |
Separate variance |
Pooled variance |
|
Difference in means |
-0.43 |
-0.43 |
-0.5 |
-0.5 |
-1.7 |
-1.7 |
|
95.00% CI |
-0.86 to 0.00 |
-0.78 to -0.08 |
-1.0 to 0.0 |
-1.0 to -0.0 |
-3.6 to 0.2 |
-3.3 to -0.2 |
|
t |
-2.56 |
-2.59 |
-2.4 |
-2.3 |
-2.3 |
-2.4 |
|
df |
4.9 |
15 |
5.3 |
15 |
4.9 |
15 |
|
p-value |
0.05 |
0.02 |
0.06 |
0.03 |
0.07 |
0.03 |
Two-sample t-tests for
Alt versus alluvium
Table 9 Listing of the mean values and standard
deviations of K, eU, and eTh for Alt versus alluvium.
|
|
|
Potassium |
Uranium |
Thorium |
|
Group |
N |
Mean |
SD |
Mean |
SD |
Mean |
SD |
|
Alt |
4 |
1.305 |
0.293 |
1.325 |
0.359 |
3.875 |
1.297 |
|
alluvium |
39 |
1.750 |
0.268 |
2.674 |
0.579 |
7.679 |
1.855 |
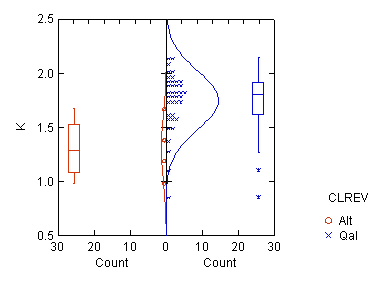 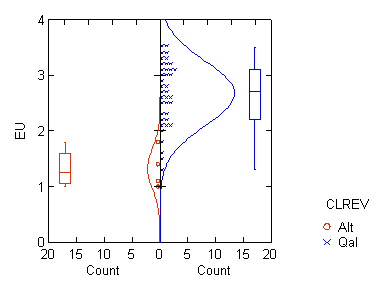 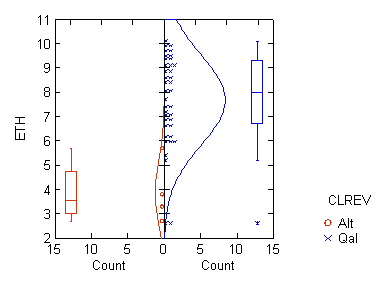
Figure 14.
Graphs comparing the distributions of K, eU, and eTh for Alt vs alluvium.
Table
9.1. Listing of t-test results for the hypothesis that the mean values
of the radioelement distributions for groups Alt and alluvium are equal.
|
|
Potassium |
Uranium |
Thorium |
|
|
Separate variance |
Pooled variance |
Separate variance |
Pooled variance |
Separate variance |
Pooled variance |
|
Difference in means |
-0.45 |
-0.45 |
-1.3 |
-1.3 |
-3.8 |
-3.8 |
|
95.00% CI |
-0.89 to -0.00 |
-0.73 to -0.16 |
-1.9 to -0.8 |
-2.0 to -0.7 |
-5.7 to -1.9 |
-5.7 to -1.9 |
|
t |
-2.9 |
-3.1 |
-6.7 |
-4.5 |
-5.3 |
-4.0 |
|
df |
3.5 |
41 |
4.8 |
41 |
4.4 |
41 |
|
p-value |
0.05 |
0.0 |
0.0 |
0.0 |
0.0 |
0.0 |
Two-sample t-tests for
Alt versus Tg
Table 10. Listing of the mean values and
standard deviations of K, eU, and eTh for Alt versus Tg.
|
|
|
Potassium |
Uranium |
Thorium |
|
Group |
N |
Mean |
SD |
Mean |
SD |
Mean |
SD |
|
Alt |
4 |
1.305 |
0.293 |
1.325 |
0.359 |
3.875 |
1.297 |
|
Goliad |
36 |
1.455 |
0.148 |
1.300 |
0.224 |
3.789 |
0.830 |
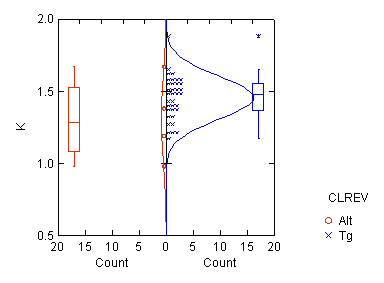 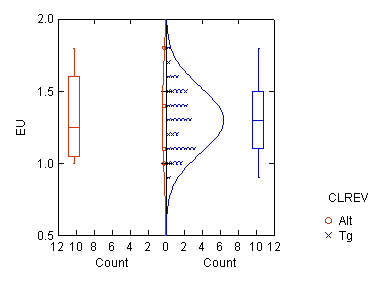 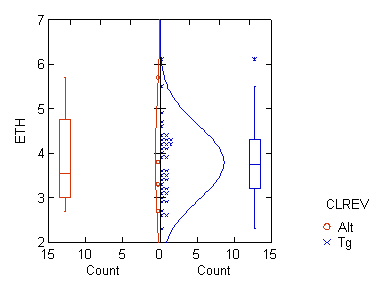
Figure 15.
Graphs comparing the distributions of K, eU, and eTh for Alt vs Tg.
Table
10.1. Listing of t-test results for the hypothesis that the mean values
of the radioelement distributions for groups Alt and Tg are equal.
|
|
Potassium |
Uranium |
Thorium |
|
|
Separate variance |
Pooled variance |
Separate variance |
Pooled variance |
Separate variance |
Pooled variance |
|
Difference in means |
-0.15 |
-0.15 |
0.0 |
0.0 |
0.1 |
0.1 |
|
95.00% CI |
-0.61 to 0.31 |
-0.33 t o 0.03 |
-0.5 to 0.6 |
-0.2 to 0.3 |
-1.9 to 2.1 |
-0.8 to 1.0 |
|
t |
-1.0 |
-1.7 |
0.14 |
0.2 |
0.1 |
0.2 |
|
df |
3.2 |
38 |
3.3 |
38 |
3.3 |
38 |
|
p-value |
0.38 |
0.09 |
0.90 |
0.84 |
0.90 |
0.85 |
Two-sample t-tests for Beaumont versus Lissie
Table 11. Listing of the mean values and
standard deviations of K, eU, and eTh for alluvium versus Lissie.
|
|
|
Potassium |
Uranium |
Thorium |
|
Group |
N |
Mean |
SD |
Mean |
SD |
Mean |
SD |
|
Beaumont |
14 |
1.920 |
0.230 |
2.086 |
0.388 |
6.571 |
1.084 |
|
Lissie |
13 |
1.732 |
0.287 |
1.831 |
0.384 |
5.600 |
1.254 |
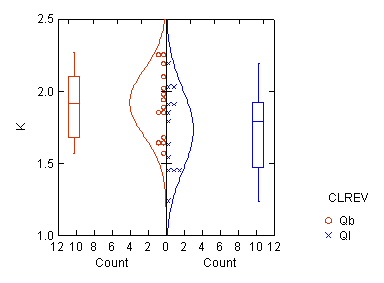 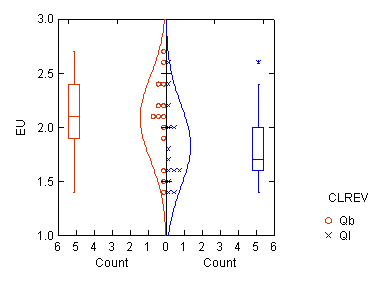 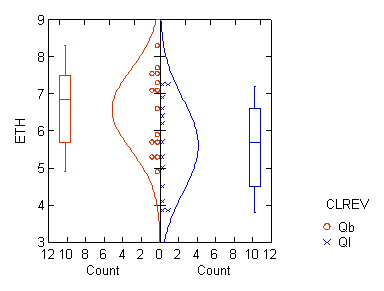
Figure 16.
Graphs comparing the distributions of K, eU, and eTh for Beaumont vs Lissie.
Table
11.1. Listing of t-test results for the hypothesis that the mean values
of the radioelement distributions for groups Beaumontand Lissie are equal.
|
|
Potassium |
Uranium |
Thorium |
|
|
Separate variance |
Pooled variance |
Separate variance |
Pooled variance |
Separate variance |
Pooled variance |
|
Difference in means |
0.19 |
0.19 |
0.3 |
0.3 |
1.0 |
1.0 |
|
95.00% CI |
0.02 to 0.40 |
0.02 to 0.39 |
-0.1 to 0.6 |
-0.1 to 0.6 |
0.0 to 1.9 |
0.0 to 1.9 |
|
t |
1.9 |
1.9 |
1.7 |
1.7 |
2.1 |
2.2 |
|
df |
23.0 |
25 |
34.9 |
25 |
23.8 |
25 |
|
p-value |
0.08 |
0.07 |
0.10 |
0.10 |
0.04 |
0.04 |
Figure 17. 3-dimensional graph of estimated mean values for groups of
samples.
Figure 18. Graphs of the estimate mean values of K, eU, and eTh for
the groups of samples. Horizontal lines represent the standard deviations.
|


