Open-File Report 2006-1381
![]() Title |
Figures |
1-Introduction |
2-Data Collection and Processing |
3- Geologic Interpretation |
4-References |
5-Maps |
Spatial Data |
Acknowledgments
Title |
Figures |
1-Introduction |
2-Data Collection and Processing |
3- Geologic Interpretation |
4-References |
5-Maps |
Spatial Data |
Acknowledgments
 |
||
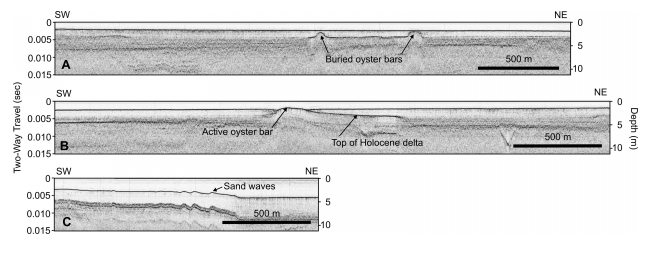
Figure 15. Seismic profiles showing (A) oyster mounds that accumulated on an older, sandy-delta surface, and were subsequently buried by younger mud, (B) an oyster bar that accumulated on a sandy-delta surface and remains exposed at the sea floor, and (C) sand waves in the eastern part of St. George Sound. The full extent of the sand waves is shown on figure 10. Vertical scales for the seismic profile are provided in milliseconds (two-way travel time) and approximate depth in meters (assuming a seismic velocity of 1500 m/s). Profile locations are shown on figure 13. | ||

![]() U.S. Department of the Interior |
U.S. Geological Survey
U.S. Department of the Interior |
U.S. Geological Survey
URL: http://pubsdata.usgs.gov/pubs/of/2006/1381/html/fig15.html
Page Contact Information: GS Pubs Web Contact
Page Last Modified: Thursday, 15-Aug-2024 15:11:44 EDT
