U.S. Geological Survey Open-File Report 2008-1206
Coastal Change Along the Shore of Northeastern South Carolina: The South Carolina Coastal Erosion Study
Return to: Title and Abstract » Table of Contents » Section 1 » Section 2 » Section 3 » Section 4 » Section 5 » Section 6 » Acknowledgments » References » List of Figures » Acronymns » Glossary |
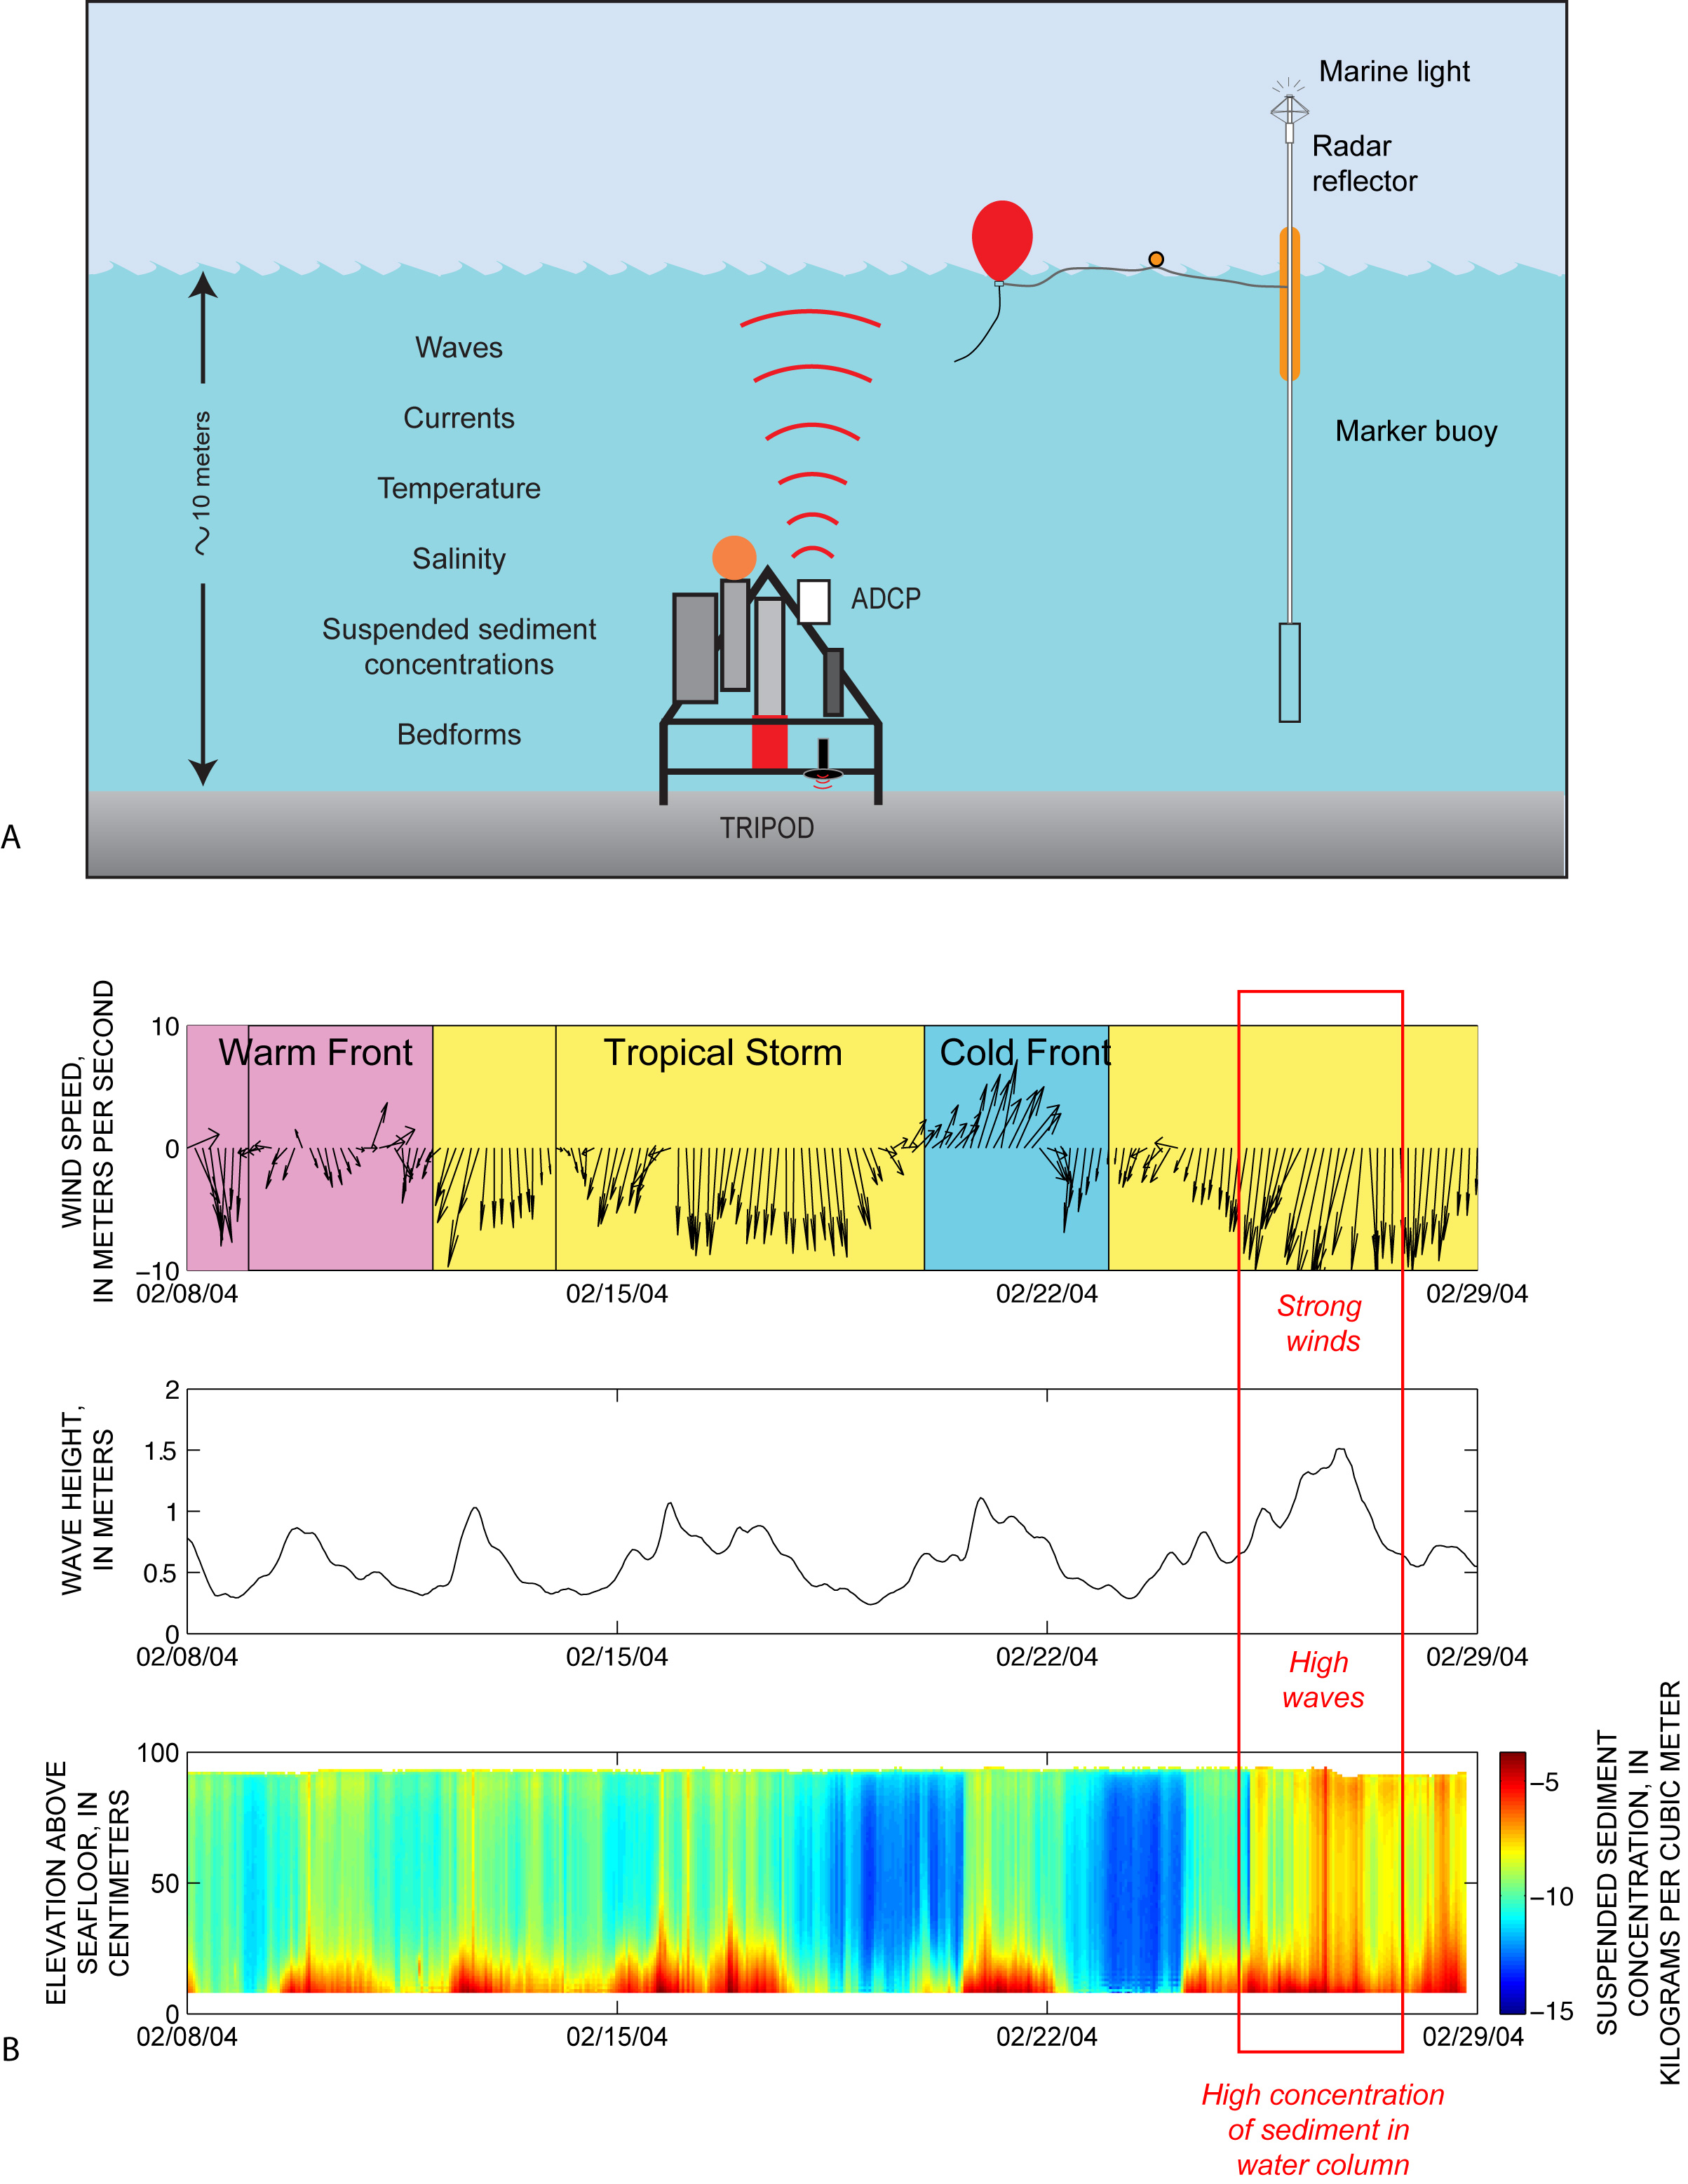
Figure 2.11. A) Schematic diagram showing oceanographic instruments deployed offshore of Myrtle Beach as part of the South Carolina Coastal Erosion Study (SCCES). The tripod frame and instruments were anchored to the seafloor, collecting data at regular intervals over a six-month period. ADCP, Acoustic Doppler current profiler. Modified from Bothner and Butman (2007). B) Graphs showing data for wind speed and direction (top), wave height (center), and suspended sediment concentrations in the water column (bottom). Red box indicates a period of strong winds and high waves on February 26-27, 2004, which mobilized abundant sediment from the seafloor and suspended it in the water column. [Click here for high-resolution image.] |
 |

 U.S. Department of the Interior |
U.S. Geological Survey
U.S. Department of the Interior |
U.S. Geological Survey
[an error occurred while processing this directive]
URL: https://pubsdata.usgs.gov
Page Contact Information: Publishing Service Center
Page Last Modified: Wednesday, 07-Dec-2016 21:39:18 EST
