U.S. Geological Survey Open-File Report 2008-1206
Coastal Change Along the Shore of Northeastern South Carolina: The South Carolina Coastal Erosion Study
Return to: Title and Abstract » Table of Contents » Section 1 » Section 2 » Section 3 » Section 4 » Section 5 » Section 6 » Acknowledgments » References » List of Figures » Acronymns » Glossary |
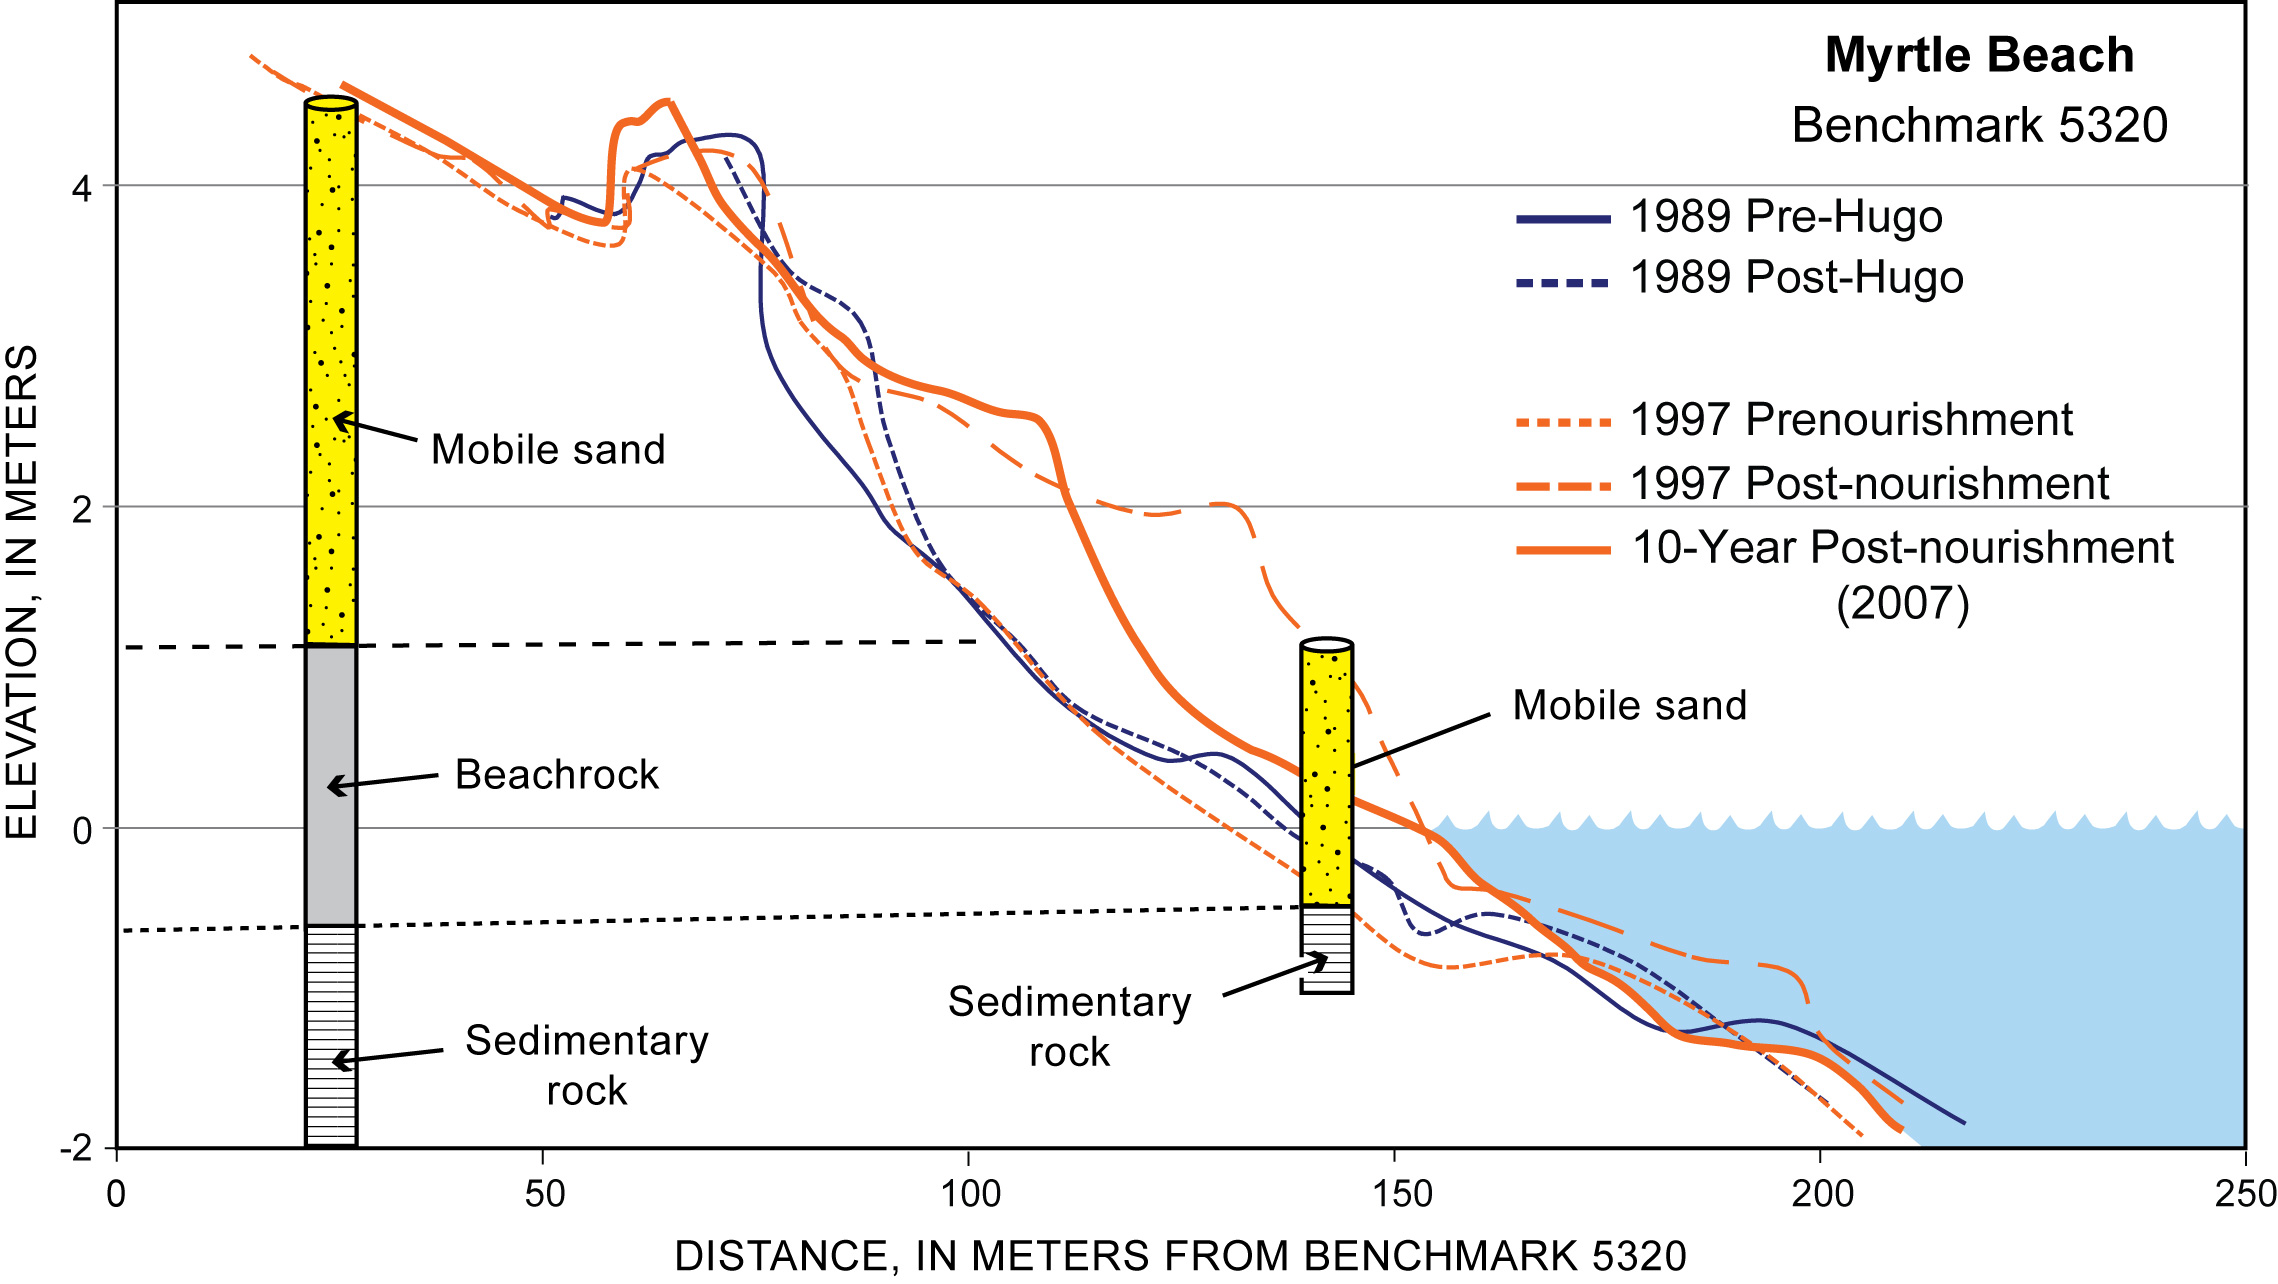
Figure 2.8. Beach profiles collected at Myrtle Beach over a 10-year period showing changes in beach shape. Blue lines represent the beach before and after Hurricane Hugo struck in 1989, causing extensive erosion. The 1997 pre-nourishment profile shows limited amounts of mobile sediment overlying beachrock and sedimentary rock, which commonly were exposed along the beach and shoreface. Later that year, a large amount of new sediment was pumped onto the beach and buried the rocky outcrops beneath a wide, sandy berm. Ten years after the nourishment, the beach fill has eroded but continues to cover the rocks. See Figure 4.5 for location. [Click here for high-resolution image.] |
 |

 U.S. Department of the Interior |
U.S. Geological Survey
U.S. Department of the Interior |
U.S. Geological Survey
[an error occurred while processing this directive]
URL: https://pubsdata.usgs.gov
Page Contact Information: Publishing Service Center
Page Last Modified: Wednesday, 07-Dec-2016 21:39:23 EST
