U.S. Geological Survey Open-File Report 2008-1206
Coastal Change Along the Shore of Northeastern South Carolina: The South Carolina Coastal Erosion Study
Return to: Title and Abstract » Table of Contents » Section 1 » Section 2 » Section 3 » Section 4 » Section 5 » Section 6 » Acknowledgments » References » List of Figures » Acronymns » Glossary |
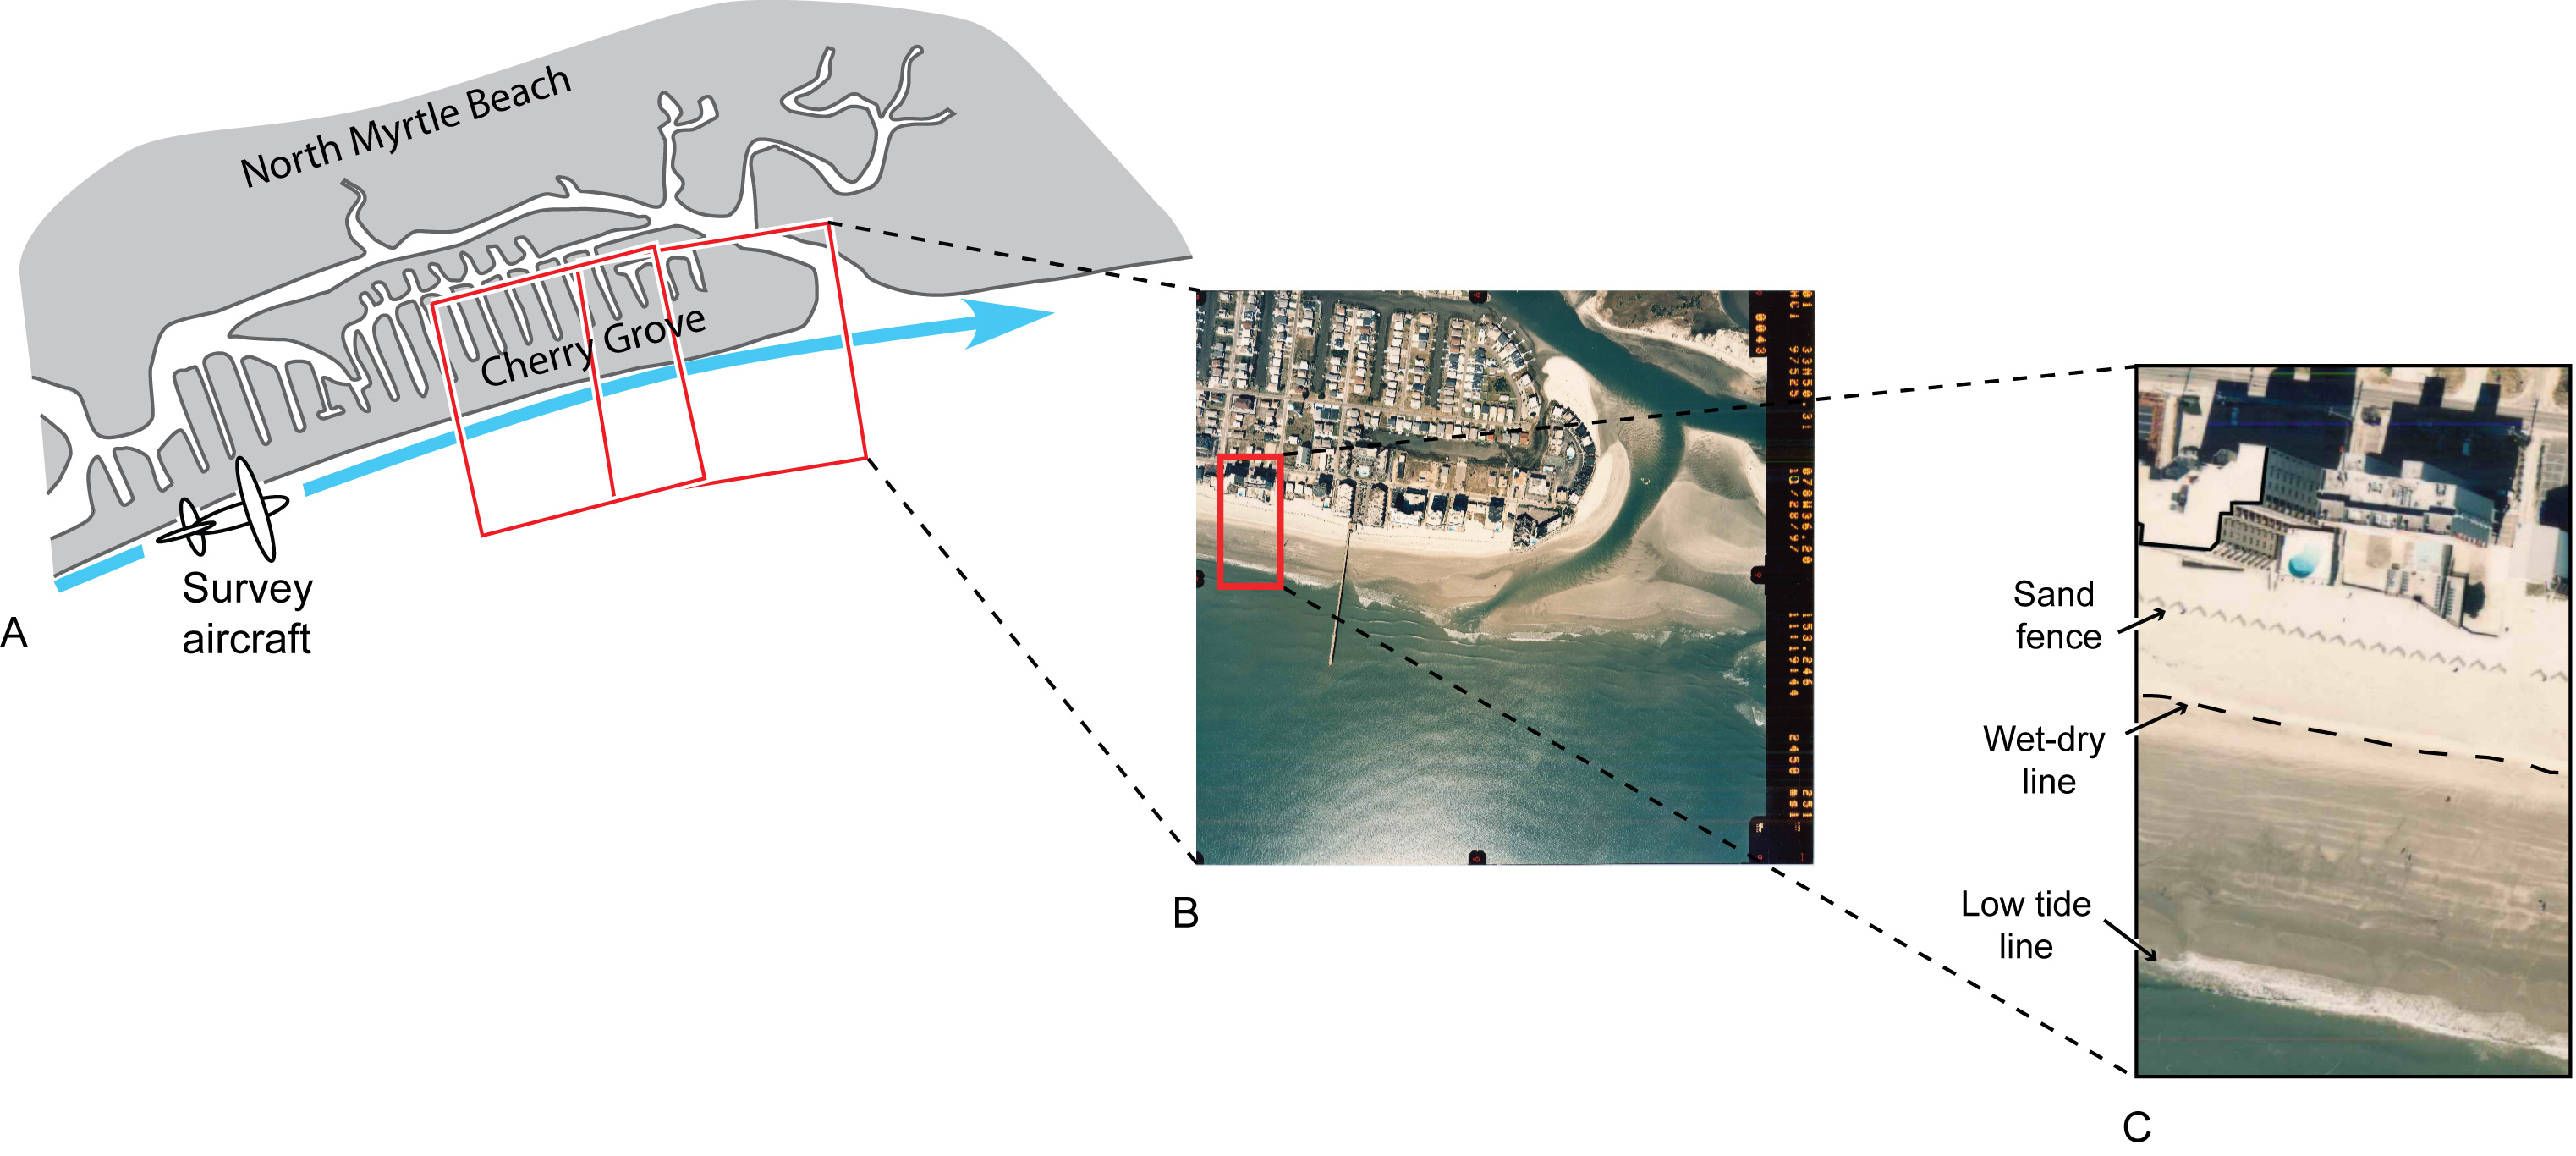
Figure 2.9. A) Schematic showing the flight path of an aerial photographic survey that follows the coastline in North Myrtle Beach. Surveys are conducted at low tide with adjacent, overlapping photographs to allow for continuous coverage. B) Example of aerial photograph showing coastal development and shoreline morphology at Cherry Grove. C) Enlarged area of the photograph showing prominent features such as the sand fence, wet-dry line and low-tide line. The wet-dry line is typically used to delineate shoreline position on aerial photographs. Shorelines delineated from successive surveys are compared to assess change in position over time. [Click here for high-resolution image.] |
 |

 U.S. Department of the Interior |
U.S. Geological Survey
U.S. Department of the Interior |
U.S. Geological Survey
[an error occurred while processing this directive]
URL: https://pubsdata.usgs.gov
Page Contact Information: Publishing Service Center
Page Last Modified: Wednesday, 07-Dec-2016 21:39:23 EST
