U.S. Geological Survey Open-File Report 2008-1206
Coastal Change Along the Shore of Northeastern South Carolina: The South Carolina Coastal Erosion Study
Return to: Title and Abstract » Table of Contents » Section 1 » Section 2 » Section 3 » Section 4 » Section 5 » Section 6 » Acknowledgments » References » List of Figures » Acronymns » Glossary |
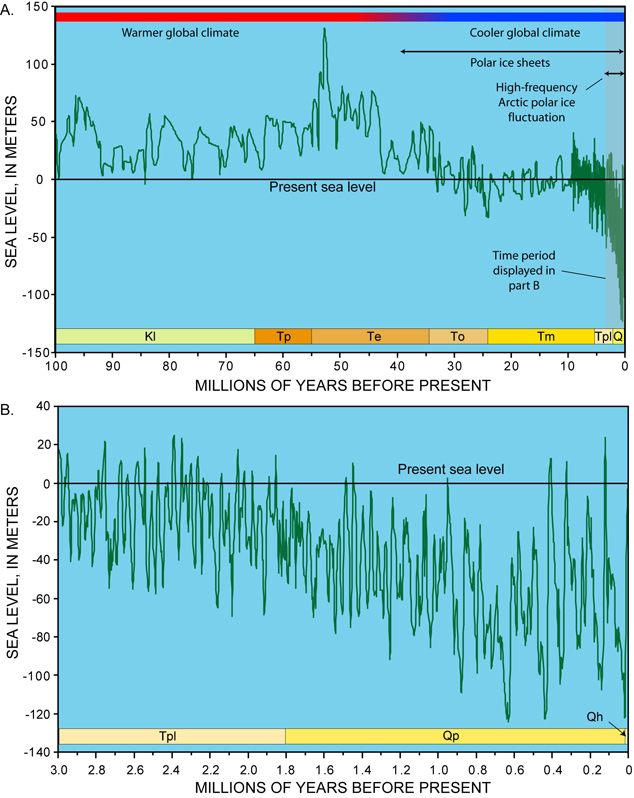
Figure 3.7. A) Global sea level and general climate conditions over the past 100 million years. Grey box indicates ongoing period of high-frequency sea-level changes due to ice-volume fluctuations over the past 3 million years. B) Section showing sea level over the last 3 million years enlarged from the graph in part A. Sea-level curves simplified from Miller and others (2005); climate and glacial ice-information generalized from Moran and others (2006). Color coded bars along the bottom of each part indicate geologic time: Kl = Late Cretaceous, Tp = Paleocene, Te = Eocene, To = Oligocene, Tm = Miocene, Tpl = Pliocene, Q = Quaternary, Qp = Pleistocene, and Qh = Holocene. [Click here for high-resolution image.]
 |