U.S. Geological Survey Open-File Report 2008-1206
Coastal Change Along the Shore of Northeastern South Carolina: The South Carolina Coastal Erosion Study
Return to: Title and Abstract » Table of Contents » Section 1 » Section 2 » Section 3 » Section 4 » Section 5 » Section 6 » Acknowledgments » References » List of Figures » Acronymns » Glossary |
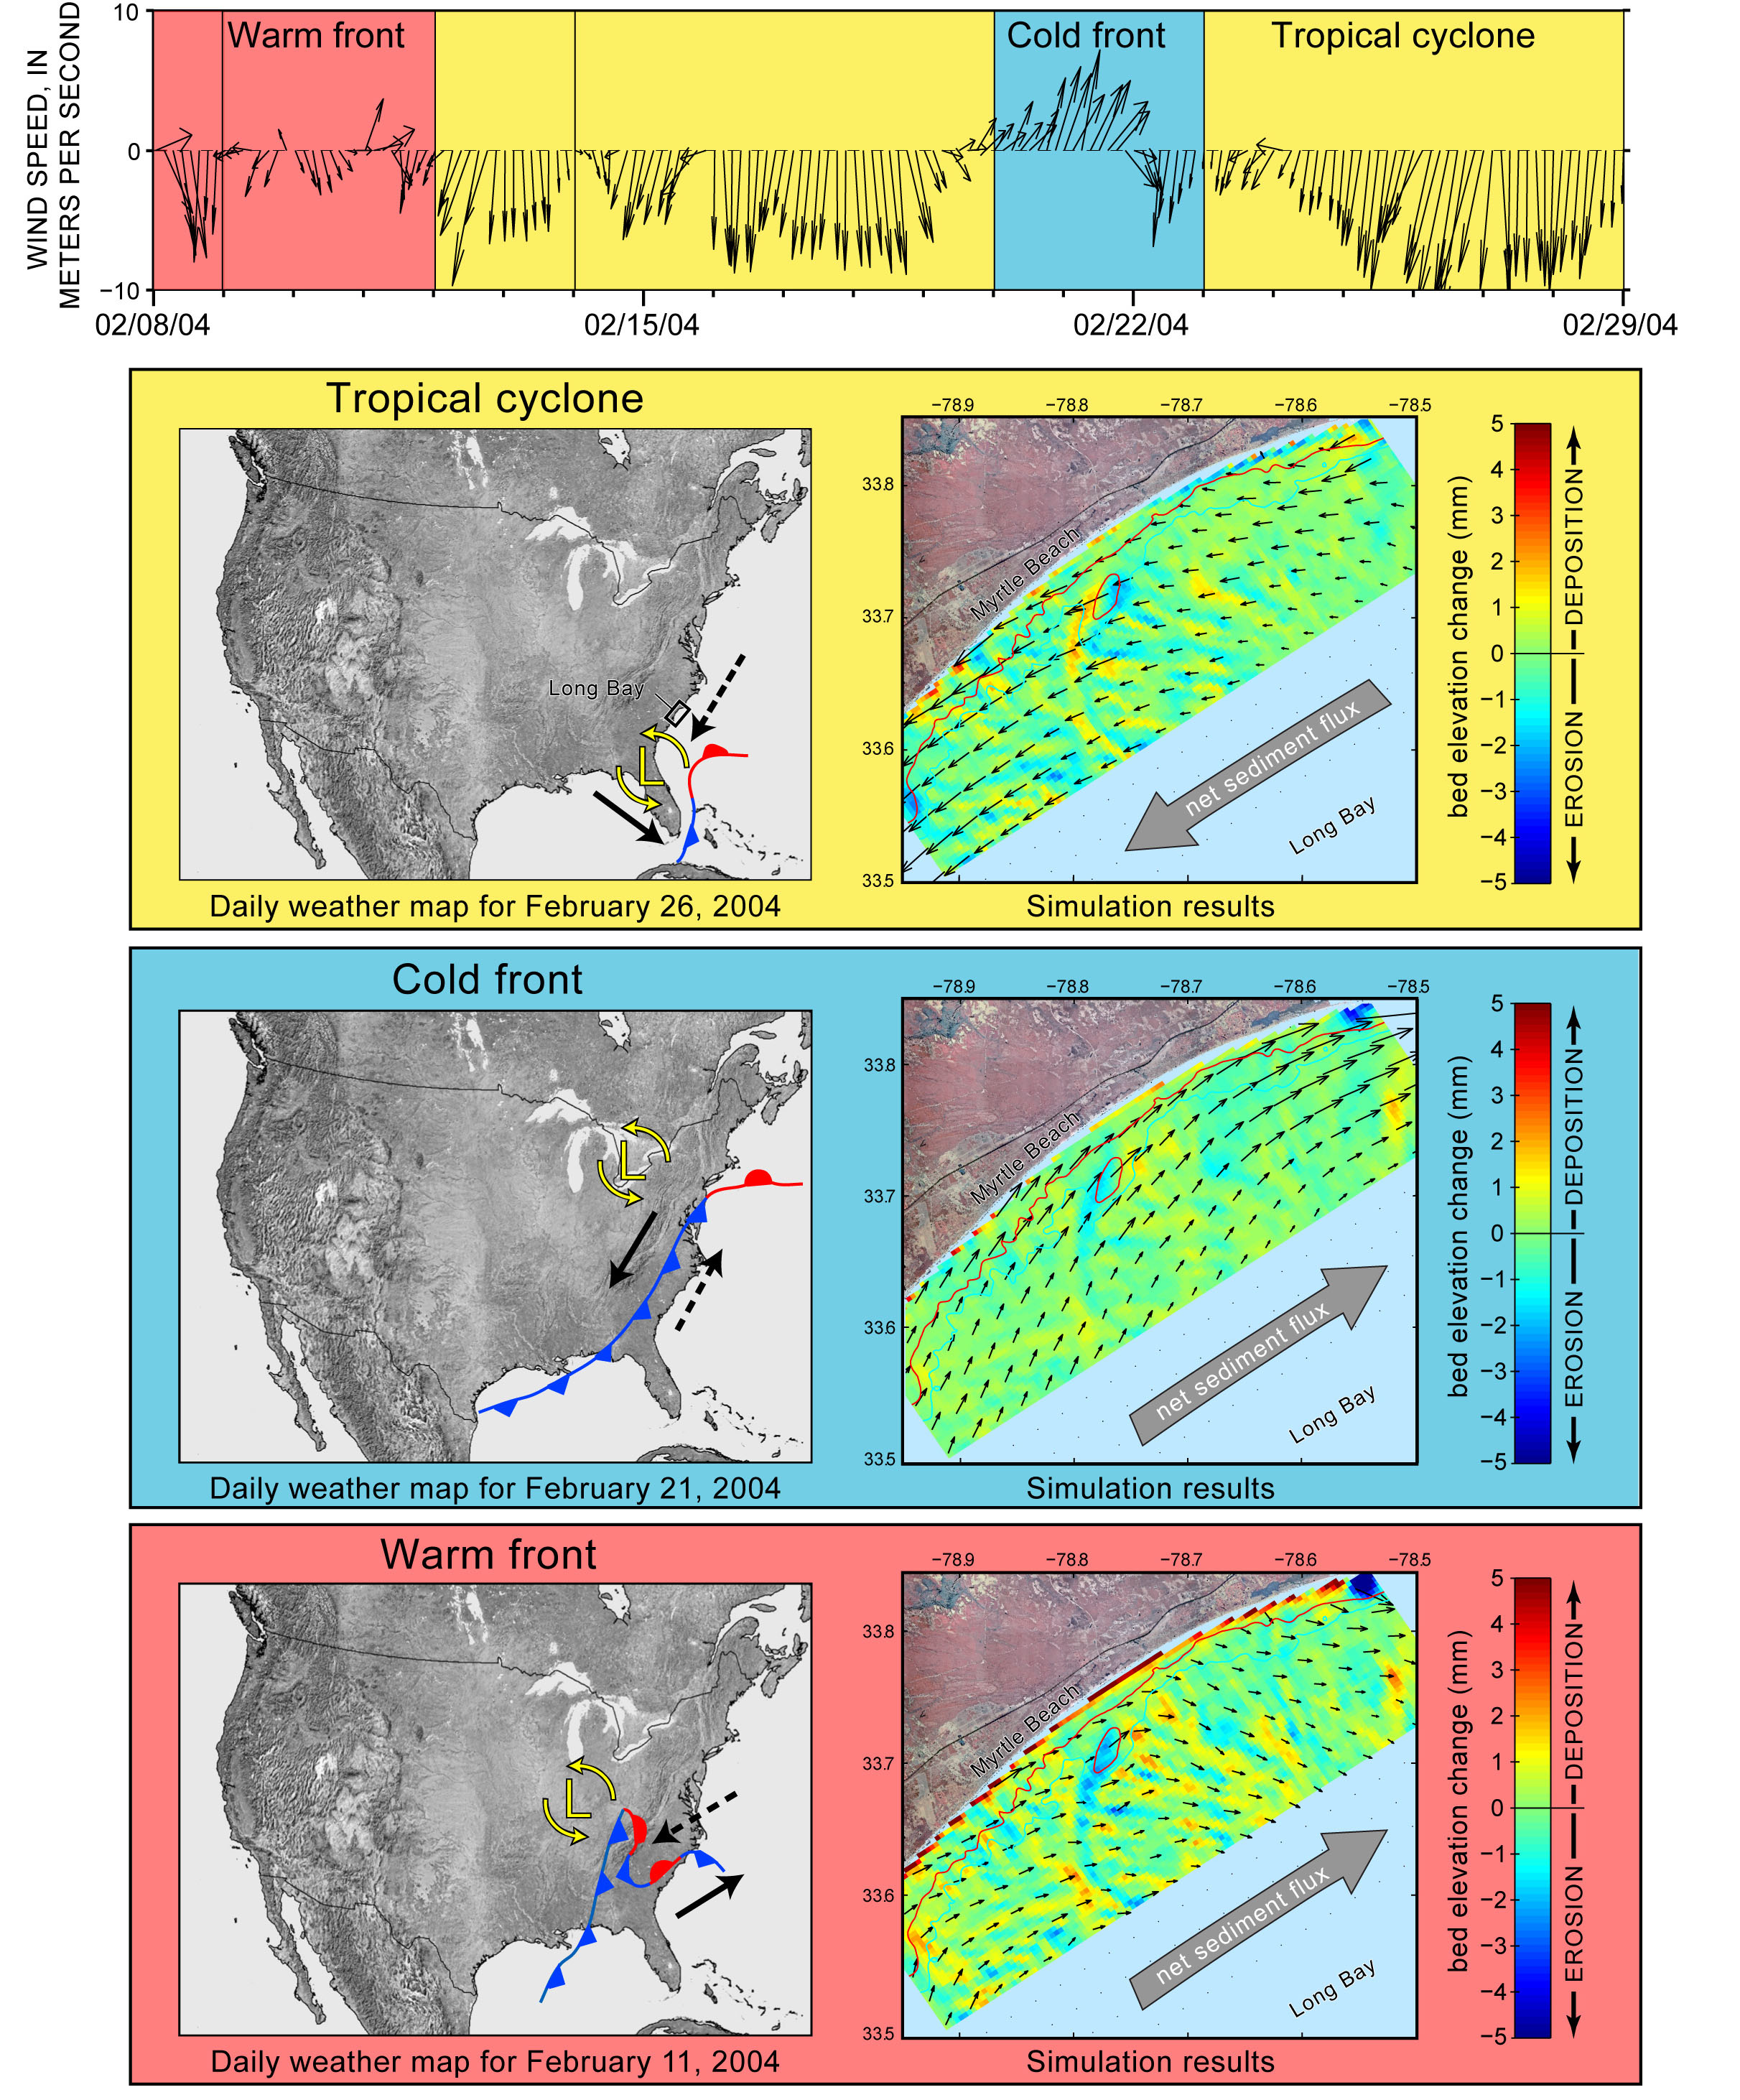
Figure 5.6. Measurements of wind speed and direction (top) collected offshore of Myrtle Beach from February 8–29, 2004. Additional data for this time period are shown in Figure 2.11B. Weather maps in bottom panels show three different storm patterns crossing the region. Simulation results for each storm show the general direction of sediment transport (arrows) and predicted areas of sediment erosion and deposition on the inner shelf (colors). The 8m bathymetric contour is displayed in red within the simulation results. See main text for description of storms and predicted movement of shelf sediment. [Click here for high-resolution image.]
 |

 U.S. Department of the Interior |
U.S. Geological Survey
U.S. Department of the Interior |
U.S. Geological Survey
[an error occurred while processing this directive]
URL: https://pubsdata.usgs.gov
Page Contact Information: Publishing Service Center
Page Last Modified: Wednesday, 07-Dec-2016 21:39:35 EST
