U.S. Geological Survey Open-File Report 2008-1288
Geophysical Data Collected off the South Shore of Martha's Vineyard, Massachusetts
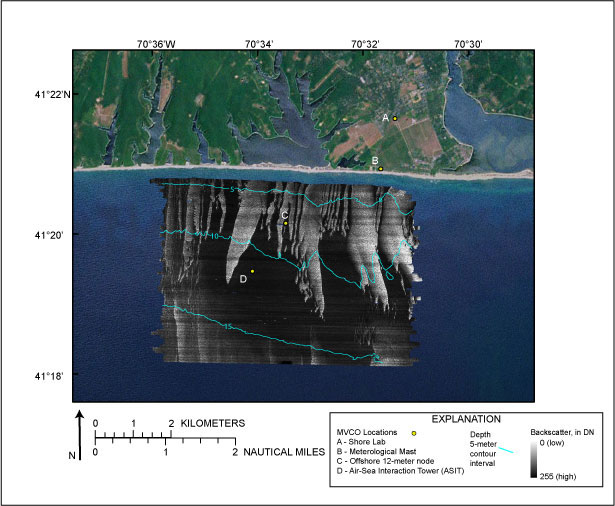 |
Figure 6. Sidescan-sonar mosaic collected by the USGS during Cruise 07011. Sidescan-sonar backscatter values (relative strength of return) are displayed as digital numbers (DN), on a relative scale, high-backscatter is represented by light tones within the image and low backscatter is represented by dark tones. The locations of the Martha's Vineyard Coastal Observatory (MVCO) (yellow dots) and 5-m bathymetric contours are also displayed. Environmental Systems Research Institute (ESRI) USA Prime Imagery is used as background image.
|

![]() U.S. Department of the Interior |
U.S. Geological Survey
U.S. Department of the Interior |
U.S. Geological Survey
URL: https://pubsdata.usgs.gov/pubs/of/2008/1288/html/imagepages/figure6.html
Page Contact Information: Contact USGS
Page Last Modified: Wednesday, 07-Dec-2016 21:27:22 EST
