 |
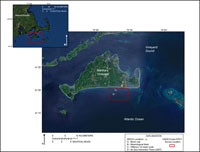
| Figure 1. Location map showing the USGS Cruise 07011 survey bounds and the Woods Hole Oceanographic Institute (WHOI) Martha's Vineyard Coastal Observatory (MVCO) locations. Environmental Systems Research Institute (ESRI) USA Prime Imagery is used as background image (I-cubed, 2009). Click on figure for larger image. |
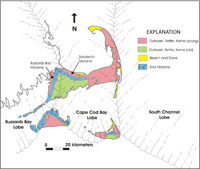 |
| Figure 2. Geologic map of Cape Cod and the Islands, superimposed with maximum extent of ice lobes (after Oldale, 1992). Click on figure for larger image. |
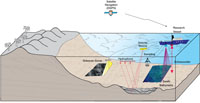 |
| Figure 3. Illustration of the geophysical systems used to characterize the seafloor during USGS Cruise 07011. Sidescan-sonar, swath bathymetric, and seismic-reflection systems were used to define the surficial sediment distribution, depth, and underlying geology. Sampling systems were used to collect direct samples of the seafloor sediment. A Differential Global Positioning System (DGPS) was used to navigate the sidescan-sonar and swath bathymetric systems, while a Global Positioning System (GPS) was used to navigate the seismic-reflection system. Click on figure for larger image. |
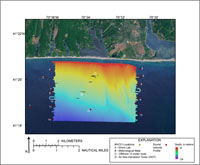 |
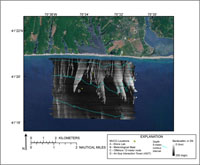
| Figure 4. Color shaded-relief image of bathymetric data collected by the USGS during Cruise 07011. Depth is in meters and ranges from approximately 6 to 24 meters water depth. No data were collected in the gray regions, where moored instruments and structures were located. The locations of Martha's Vineyard Coastal Observatory (MVCO) (yellow dots) and sound velocity profiles (red dots) collected during USGS Cruise 07011 are also displayed. Environmental Systems Research Institute (ESRI) USA Prime Imagery is used as background image. Click on figure for larger image. |
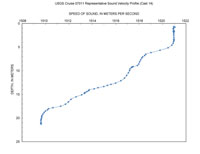 |
| Figure 5. Representative sound velocity profile (SVP) displaying the speed of sound in the water column, in meters per second, versus water depth, in meters. These data were collected at SVP location 14 during USGS Cruise 07011. The data reveal the characteristic negative gradient, with presumably warmer surface waters overlying relatively cooler sub-surface waters. Click on figure for larger image. |
 |
| Figure 6. Sidescan-sonar mosaic collected by the USGS during Cruise 07011. Sidescan-sonar backscatter values (relative strength of return) are displayed as digital numbers (DN), on a relative scale, high backscatter is represented by light tones within the image and low backscatter is represented by dark tones. The locations of Martha's Vineyard Coastal Observatory (MVCO) (yellow dots) and 5-meter bathymetric contours are also displayed. Environmental Systems Research Institute (ESRI) USA Prime Imagery is used as background image. Click on figure for larger image. |
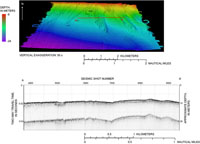 |
| Figure 7. TOP: North-looking oblique view of color shaded-relief image of swath bathymetric data collected during USGS Cruise 07011. Depth is displayed in meters and ranges from approximately 6 to 24 meters water depth. Vertical exaggeration is 50 times. Sun illumination is from the northeast. Location of seismic-reflection line is displayed. BOTTOM: seismic-reflection data collected during USGS Cruise 07011. See top image for location. Depth is displayed as two-way travel time. Approximate depth is displayed in meters and assumes a speed of sound of 1,500 meters per second. Seismic shot number is indicated along the top of the profile. Several features are visible within the seismic image. At shot 5000, a sub-surface channel is visible within the seismic record, and reflections from shots 7000 to 9000 reveal an unconformity underlying low-relief bedforms. The bedforms are visible within the swath bathymetric image. Click on figure for larger image. |
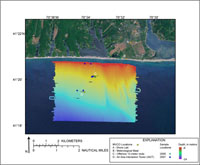 |
| Figure 8. Color shaded-relief image of swath bathymetric data collected by the USGS during Cruise 07011. Depth is in meters and ranges from approximately 6 to 24 meters water depth. No data were collected in the gray regions, where moored instruments and structures were located. The locations of Martha's Vineyard Coastal Observatory (MVCO) (yellow dots) and beach and seafloor sediment samples collected in 2005 (green dots) and 2007 (blue dots) are also displayed. Environmental Systems Research Institute (ESRI) USA Prime Imagery is used as background image. Click on figure for larger image. |

