
|
Figures
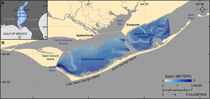 |
Figure 1. (A) Inset map of the Florida Bight and Panhandle region including surrounding portions of Alabama and Georgia. (B) Apalachicola Bay is protected from the Open Gulf of Mexico by three barrier islands: Little Saint George Island, Saint George Island, and Saint Vincent Island. |
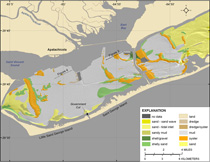 |
Figure 2. Surficial geology of Apalachicola Bay highlighting the distribution of oyster growth (orange) within the bay (modified from Twichell and others, 2007). Seismic-reflection-profile locations for Figure 3 and Figure 4 are also shown. |
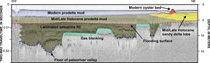 |
Figure 3. Interpreted seismic profile showing the stratigraphic intervals underlying Apalachicola Bay. The deepest horizon imaged is the floor of a Pleistocene paleovalley. This valley was filled during the Early and Middle Holocene by estuarine deposits (modified from Twichell and others, 2007). |
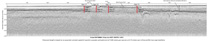 |
Figure 4. Seismic profile showing the high-amplitude reflection beneath the oyster beds. |
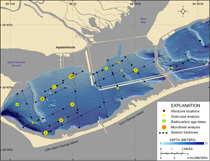 |
Figure 5. Vibracore locations where samples were collected for grain-size analyses, radiocarbon-age date analyses, microfossil analyses, and associated seismic lines. |
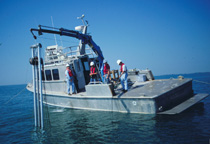 |
Figure 6. Rossfelder electric vibracore system deployed from the R/V Gilbert. U.S. Geological Survey photo. |
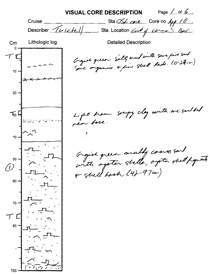 |
Figure 7. First page (representing a vertical distance of 1-m) of vibracore field sheet from Core Site App-10. |
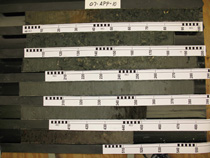 |
Figure 8. Vibracore photograph from Core Site App-10. |
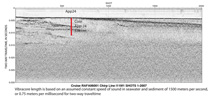 |
Figure 9. Seismic-reflection profile with adjacent vibracore App-24. |
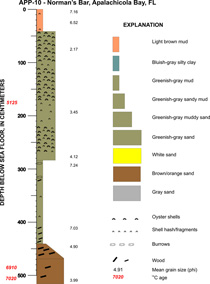 |
Figure 10. Vibracore summary sheet from Core Site App-10. |
Tables
| Table 1. List of vibracores, subsample analyses, and thumbnail images. Click on the core name to view the field log in PDF format. Click on a thumbnail image to see a larger version of the core photo, core summary, or adjacent seismic-reflection profile. Click on subsample symbol to view analysis data in XLS format. C14, radiocarbon-age analysis; Φ, grain-size analysis; M, microfossil analysis. |
| Table 2. List of microfossils identified in vibracore samples. |
|

