U.S. Geological Survey Open-File Report 2010–1007
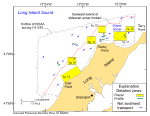
Sea-Floor Geology and Character Offshore of Rocky Point, New York
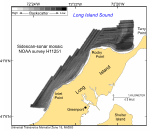
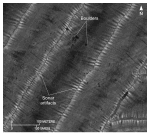
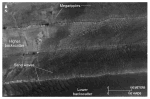
Distinctive tonal patterns revealed on the sidescan-sonar mosaic (fig. 24) include (1) complex patches of high and low backscatter with individual high-backscatter targets (objects), (2) alternating bands of high and low backscatter in a tiger-stripe pattern, (3) areas of relatively high backscatter (light tones), and (4) areas of relatively low backscatter (dark tones). Boundaries between patterns are commonly gradational, and backscatter is not uniform throughout these areas. Complex patches of high and low backscatter with individual high-backscatter targets delineate rocky, bouldery areas (figs. 16, 25). The high backscatter component is produced by the sides of boulders facing the sidescan source; the low backscatter component results from the boulder's shadow. Bouldery areas on the mosaic are prevalent along the shoreline and in a swath extending north-northwestward off Rocky Point. In places, turbulent currents flowing around boulders have produced comet structures. The tails of these structures are commonly composed of higher backscatter, suggesting coarser grained sediment, current scour, and erosion. Areas characterized by alternating bands of high and low backscatter include Orient Shoal northeast of Rocky Point, a northeast-trending band off Inlet point, and small patches around the study area (fig. 26). This tiger-stripe pattern, which is produced by sand waves and megaripples, results from a combination of topographic changes affecting the angle of incidence of the sidescan sonar and the differences in sediment texture commonly present between crests and troughs of sand waves (Reineck and Singh, 1980). Areas of the sea floor characterized by relatively higher backscatter are concentrated off the western-facing shoreline southwest of Rocky Point and on the northeastern flank of Orient Shoal (fig. 26). The areas of higher backscatter are produced by coarser grained sediments, typically medium to coarse sand and gravelly sand, and indicate higher energy environments. Patches characterized by relatively lower backscatter are present in the deeper areas along the western edge of the mosaic and in the nearshore area between Rocky Point, Terry Point, and the southern flank of Orient Shoal that is relatively protected from strong storm- and tidally-driven currents (fig. 26). These areas coincide with lower energy environments and finer grained Holocene marine sediment composed primarily of fine sand. |

![]() U.S. Department of the Interior |
U.S. Geological Survey
U.S. Department of the Interior |
U.S. Geological Survey
URL: https://pubsdata.usgs.gov/pubs/of/2010/1007/html/sonar.html
Page Contact Information: Contact USGS
Page Last Modified: Wednesday, 07-Dec-2016 22:38:26 EST