 |
Figure 1. Location of the bathymetric and backscatter surveys completed in Long Island Sound. Surveys by the NOAA ships Thomas Jefferson and Rude are shown in light gray and include H11043—Poppe and others (2004, 2006a); H11044—McMullen and others (2005); and H11045—Beaulieu and others (2005); H11255—Poppe and others (2006c); H11250—Poppe and others (2006b, 2007a); H11252/H11361—Poppe and others (2007b, 2008); H11441/H11442/H11224/H11225—Poppe and others (2010); H11445—McMullen and others (2010). Sites of USGS sidescan-sonar surveys are shown in dark gray and include Norwalk—Twichell and others (1997); Milford—Twichell and others (1998); New Haven Harbor and New Haven Dumping Grounds—Poppe and others (2001); Roanoke Point—Poppe and others (1999a); Falkner Island—Poppe and others (1999b); Hammonasset—Poppe and others (1997); Niantic Bay—Poppe and others (1998c); New London—Lewis and others (1998), Zajac and others (2000, 2003); Fishers Island Sound—Poppe and others (1998b). |
 |
Figure 2. Locations of prominent points along the north shore of Long Island east of Port Jefferson, the Harbor Hill-Roanoke Point-Orient Point Moraine, and National Oceanic and Atmospheric Administration survey H11251. |
 |
Figure 3. Port-side view of the National Oceanic and Atmospheric Administration Ship Thomas Jefferson at sea. The 8.5-m survey launch normally stowed on this side of the ship has been deployed. |
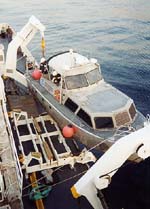 |
Figure 4. The National Oceanic and Atmospheric Administration (NOAA) Launch 3102 being deployed from the NOAA Ship Thomas Jefferson. |
 |
Figure 5. Starboard-side view of the National Oceanic and Atmospheric Administration Launch 3102 at sea. |
 |
Figure 6. A Klein 5000 sidescan-sonar system hull-mounted to a National Oceanic and Atmospheric Administration launch. |
 |
Figure 7. The RESON SeaBat 8101 hull-mounted to the National Oceanic and Atmospheric Administration Launch 3102. |
 |
Figure 8. The RESON SeaBat 8125 hull-mounted to the National Oceanic and Atmospheric Administration Launch 3101. |
 |
Figure 9. Sea-Bird Electronics, Inc. SEACAT conductivity-temperature-depth (CTD) profiler. Data derived from frequent deployments of this device were used to correct sound velocities for the multibeam data. |
 |
Figure 10. A port-side view of the U.S. Geological Survey research vessel Rafael, which was used to collect bottom photography and sediment samples in the vicinity of Rocky Point, New York. |
 |
Figure 11. The small Seabed Observation and Sampling System (SEABOSS), a modified Van Veen grab sampler equipped with still and video photographic systems, mounted on the aft starboard side of the research vessel Rafael. Note the winch mounted on the davit (left) and the take-up reel for the video-signal and power cable (right). |
 |
Figure 12. Locations of stations at which bottom samples and photographs were taken during cruise 09059 of research vessel Rafael to verify bathymetric and backscatter data. |
 |
Figure 13. Correlation chart showing the relationships among phi sizes, millimeter diameters, size classifications (Wentworth, 1922), and American Society for Testing and Materials and Tyler sieve sizes. Chart also shows the corresponding intermediate diameters, grains per milligram, settling velocities, and threshold velocities for traction. |
 |
Figure 14. Sediment-classification scheme from Shepard (1954), as modified by Schlee (1973). |
 |
Figure 15. Digital terrain model of the sea floor produced from the multibeam bathymetry collected during National Oceanic and Atmospheric Administration survey H11251 and gridded to 2 m. Image is sun-illuminated from the north and vertically exaggerated 5X. Warmer colors are shallower areas; cooler colors are deeper areas. See key for depth ranges. |
 |
Figure 16. Locations of detailed planar views of the digital terrain model and sidescan-sonar mosaic (yellow polygons) and profiles of sand-wave symmetry (green lines). Seaward extent of the sidescan-sonar data (red line) and directions of net sediment transport (blue arrows) interpreted from obstacle marks and bedform asymmetry are included. Profiles A-E are shown in figures 22 and 23. |
 |
Figure 17. Detailed planar view of the bouldery sea floor off Rocky Point, New York, from the digital terrain model produced during National Oceanic and Atmospheric Administration survey H11251. Boulders rest on the winnowed upper surface of the submerged Harbor Hill-Roanoke Point-Orient Point moraine. Location of view is shown in figure 16. |
 |
Figure 18. Detailed planar view of the bouldery sea floor along the shoreline in the vicinity of Inlet Point from the digital terrain model produced during National Oceanic and Atmospheric Administration survey H11251. Location of view is shown in figure 16. |
 |
Figure 19. Interpretation of the digital terrain model and sidescan-sonar mosaic from National Oceanic and Atmospheric Administration survey H11251 off Rocky Point, New York. Areas characterized by boulders, large bedforms, and a shipwreck are shown. White areas within the study area are primarily nondescript reworked Holocene sediment. |
 |
Figure 20. Detailed planar view of obstacle marks from the digital terrain model produced during National Oceanic and Atmospheric Administration survey H11251 off Rocky Point, New York. Asymmetry in the scour indicated net sediment transport at this location is toward the northeast. Location of view is shown in figure 16. |
 |
Figure 21. Detailed planar view of Orient Shoal from the digital terrain model produced during National Oceanic and Atmospheric Administration survey H11251 off Rocky Point, New York. Blue arrows show direction of net transport interpreted from sand-wave asymmetry. Location of view is shown in figure 16. |
 |
Figure 22. Cross-sectional views of sand waves around Orient Shoal from the digital terrain model produced during National Oceanic and Atmospheric Administration survey H11251 off Rocky Point, New York. Sand-wave asymmetry in profiles A and B indicate net sediment transport is westward along the southern side of the shoal and eastward along the northwestward side in profile C. Locations of profiles are shown in figure 16. |
 |
Figure 23. Cross-sectional views of sand waves west of Rocky Point from the digital terrain model produced during National Oceanic and Atmospheric Administration survey H11251. Sand-wave asymmetry indicates net sediment transport is southwestward. Profile D crosses a barchanoid sand wave. Locations of profiles are shown in figure 16. |
 |
Figure 24. Sidescan-sonar imagery produced from data collected during National Oceanic and Atmospheric Administration survey H11251. Light tones indicate hard returns and generally coarser grained sediments; dark tones indicate softer returns and generally finer grained sediments. |
 |
Figure 25. Detailed planar view north of Rocky Point, New York, of the sidescan-sonar mosaic produced during National Oceanic and Atmospheric Administration survey H11251. High-backscatter targets with shadows are interpreted to be boulders. Lines with white cross hatches are sonar artifacts caused by nadir (the track directly under the vessel) not removed during sidescan-sonar processing. Location of view is shown in figure 16. |
 |
Figure 26. Detailed planar view of relatively straight to sinuous alternating bands of high and low backscatter from the sidescan-sonar mosaic produced during National Oceanic and Atmospheric Administration survey H11251 off Rocky Point, New York. Tiger-stripe pattern is indicative of transverse sand waves and megaripples. Location of view, which is northeast of Orient Shoal, is shown in figure 16. |
 |
Figure 27. Station locations used to verify the acoustic data, color-coded for sediment texture. Warmer colors are coarser grained sediments; cooler colors are finer grained sediments. See key for sediment classifications and data sources. |
 |
Figure 28. Sessile fauna and flora covering boulders at stations RP17 and RP26. These organisms are commonly absent from cobble-sized and smaller gravel that are mobile in high-energy environments. Station locations are shown in figure 12. |
 |
Figure 29. Gravel armors the sea floor in the high-energy environments at stations RP8 and RP24. Station 24 is in the trough of a large barchanoid sand wave. Station locations are shown in figure 12. |
 |
Figure 30. Bottom photographs from stations RP16 and RP14 of current-rippled sand that is prevalent in areas characterized by sedimentary environments of coarse-bedload transport. Note the concentration of detritus in the ripple troughs and the scour around obstacles. Station locations are shown in figure 12. |
 |
Figure 31. Bottom photograph from station RP25. Current ripples are fainter and burrows more common offshore of Rocky Point, New York, in the limited areas where lower energy environments are prevalent. Station locations are shown in figure 12. |
 |
Figure 32. Shell beds off Rocky Point, New York. The beds at station RP11 are composed of mussel shells; beds at station RP19 are composed of slippersnail (Crepidula) shells. Station locations are shown in figure 12. |


