U.S. Geological Survey Open-File Report 2010-1094
Continuous Resistivity Profiling Data from the Corsica River Estuary, Maryland
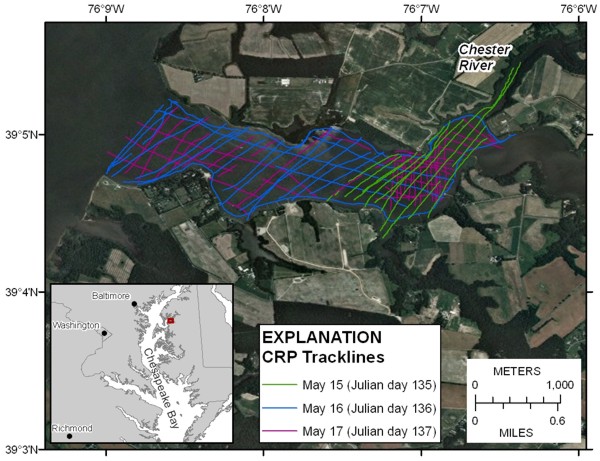 |
| Figure 1. Location map showing the continuous resistivity profile (CRP) survey tracklines. The different colors indicate different days of surveying. The background image is from ArcGIS Online, ESRI_Imagery_World_2D, accessed September 2010. Copyright 2009, ESRI, i-cubed, GeoEye. |


