Skip past header information
USGS - science for a changing world

U.S. Geological Survey Open-File Report 2010-1094

Continuous Resistivity Profiling Data from the Corsica River Estuary, Maryland


Summary

Skip past contents information

Click on figure for larger image.

Thumbnail image for Figure 1, location map showing the geophysical survey tracklines and link to larger image.

Figure 1.Location map showing the continuous resistivity profiling (CRP) survey tracklines. The different colors indicate different days of surveying. The background image is from ArcGIS Online, ESRI_Imagery_World_2D, accessed September 2010. Copyright 2009, ESRI, i-cubed, GeoEye.

Thumbnail image for Figure 4, a location map 3D perspective views the the -10 m CRP surface for a large area and a zoomed in area, and link to larger image.

Figure 4. Perspective views of a horizontal slice at 10 meters below zero elevation through a three-dimensional (3D) solid model created from the continuous resistivity profile (CRP) data in Dynamic Graphics' EarthVision software. Part A is a plan view map where the gray lines represent the CRP tracklines, the blue polygon represents the extent of the 3D model shown in part C, and the red box indicates the extent of the 3D model showin in part B. The color bar applies to both parts B and C, with resistivity values in ohm-meters. In each map, along the northern part, small black symbols outlined in white represent offshore piezometer sampling locations. The white dashed lines in part B approximate paleochannel margins.

Thumbnail image for Figure 5, a location map 3D equal resistivity (7 ohm-m) CRP surface for a large area and a zoomed in area, and link to larger image.

Figure 5. Perspective views of three-dimensional (3D) surface of equal resistivity (7 ohm-meters) derived from a solid model created from the continuous resistivity profile (CRP) data in Dynamic Graphics' EarthVision software. Part A is a plan view map where the gray lines represent the CRP tracklines, the blue polygon represents the extent of the 3D model shown in part C, and the red box indicates the extent of the 3D model showin in part B. The color bar applies to both parts B and C, with resistivity values in ohm-meters. In each map, along the northern part, small black symbols outlined in white represent offshore piezometer sampling locations. The white dashed lines in part B approximate paleochannel margins.

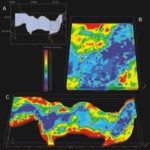
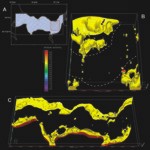
Based on the grid of 67.6 km of CRP data (fig. 1), low-salinity (high-resistivity) groundwater extended approximately 50-400 m offshore from estuary shorelines (fig. 4) at depths of 5 to >12 m below the sediment surface, likely beneath a confining unit (Bratton, 2007). A band of low-resistivity values along the axis of the estuary (fig. 5) indicated the presence of a sediment-filled paleochannel containing brackish groundwater. The meandering paleochannel likely incised through the confining unit during periods of lower sea level, allowing the low-salinity groundwater plumes originating from land to mix with brackish subestuarine groundwater along the channel margins and to discharge. Additional subsurface sampling, penetrating to greater depths and extending farther offshore, would be required to further characterize these offshore parts of the submarine groundwater system. Such investigations have been performed with barge- and hovercraft-mounted drilling rigs in other locations (Bratton and others, 2004; Manheim and others, 2004; Cross and others, 2008; Bratton and others, 2009). Age dating and nutrient analysis of groundwater collected beneath the Corsica River Estuary (John Bratton, NOAA, unpub. data, 2011) indicate that older groundwater recharged on land that may be discharging along the margins of the axial paleochannel beneath the estuary is unlikely to contain high concentrations of anthropogenic nutrients that would contribute to eutrophication. Recirculation of estuary surface water through sediments, however, likely contributes significant ammonium to surface water. Continued input of excess nitrogen through fertilizer application, wastewater disposal through septic systems, and atmospheric deposition of nitrogen to the watershed will eventually lead to increased anthropogenic nitrogen concentrations even in subestuarine groundwater discharging significant distances (>50m) from shore.

Skip USGS links group

Accessibility FOIA Privacy Policies and Notices

Take Pride in America logo USAGov logo U.S. Department of the Interior | U.S. Geological Survey
End of USGS links group