U.S. Geological Survey Open-File Report 2011-1041
Continuous Resistivity Profiling Data from Northport Harbor and Manhasset Bay, Long Island, New York
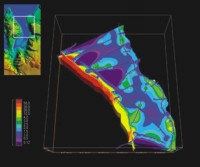
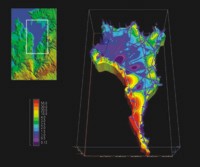
Continuous resistivity profiling (CRP) surveys showed that high-resistivity anomalies, interpreted as plumes or sheets of low-salinity groundwater, commonly extended 25 to 50 meters or more from the shoreline beneath both bays. The relative steepness of onshore topography around Northport Harbor, in combination with the large tidal range, seems to produce thick and extensive offshore high-resistivity anomalies (fig. 6). This is consistent with the presence of steep hydraulic gradients in onshore aquifers that overwhelm tidal forcing of saltwater moving against these gradients. Shoreline sediments in Northport Harbor generally consist of coarse sand to cobbles, especially in the northern half of the harbor. Fine-grained sediments only exist in the sheltered southern end of the harbor and likely in deeper water areas. Manhasset Bay resistivity anomalies are less widespread than those in Northport Harbor but still extend tens of meters offshore in some places (fig. 7). In some areas of both embayments, the presence of bulkheads or piling appears to limit the extent or prevalence of offshore anomalies, but these structures also required deviations in survey tracklines and commonly included metallic components that may have produced resistivity artifacts. Other studies have shown that manmade shoreline structures either can serve as barriers to groundwater flow from land to sea or can create preferential nearshore pathways for discharge of submarine groundwater, possibly by breaching shallow confining units (Rapaglia, 2005; Stieglitz and others, 2007). In general, the CRP survey data presented here give evidence that terrestrial groundwater interacts with saline groundwater over zones of varying width and thickness in these settings, with strong influence of hydrogeology, tides, and shoreline structures. It is likely that important chemical reactions affecting concentrations and speciation of nutrients and other pollutants take place in the submarine portions of these aquifers prior to discharge of groundwater to coastal bays such as these. |