U.S. Geological Survey Open-File Report 2011-1184
High-Resolution Geophysical Data From the Sea Floor Surrounding the Western Elizabeth Islands, Massachusetts
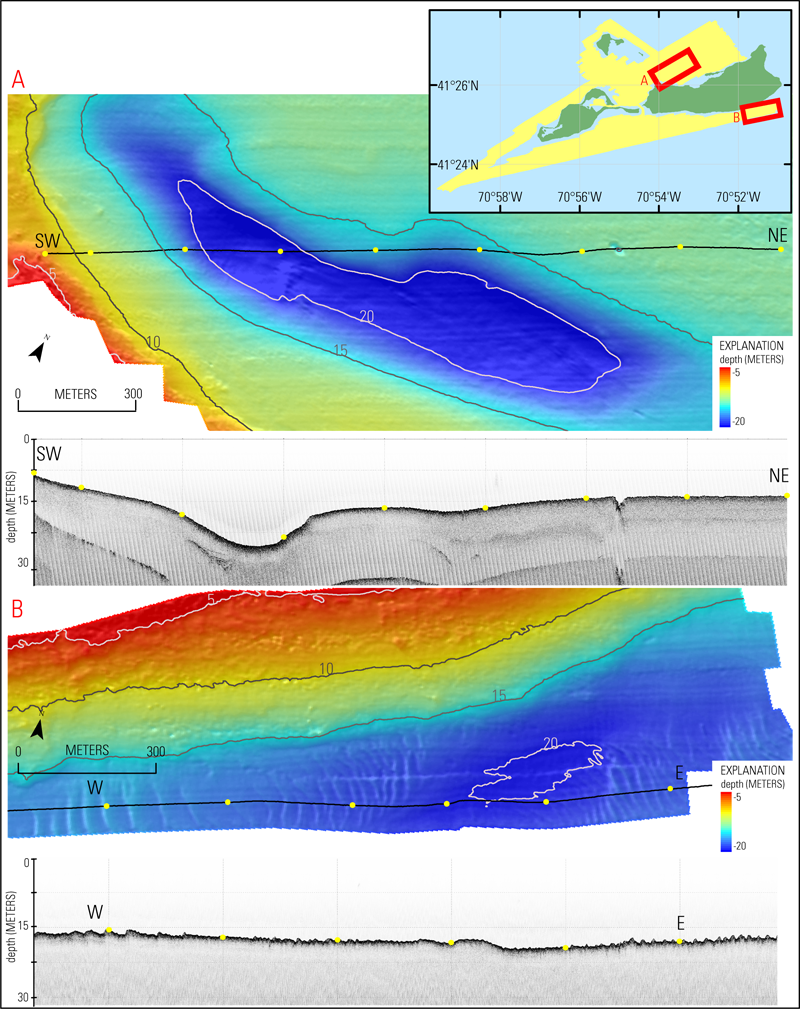
Figure 3. Maps and seismic-reflection profiles showing examples of sea floor features within the 2010-003-FA survey area. A, A large scour hole located in a muddy deposit is evident in bathymetric and seismic-reflection data. B, Sand waves south of Nashawena, Massachusetts are identifiable in bathymetric and seismic-reflection data. Contour intervals are 5 meters, and depths are relative to mean lower low water tidal datum. The yellow dots are marking 500-shot intervals and correspond to the dashed lines in the seismic-reflection profile below each map.


