U.S. Geological Survey Open-File Report 2011-1184
High-Resolution Geophysical Data From the Sea Floor Surrounding the Western Elizabeth Islands, Massachusetts

|
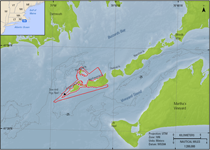
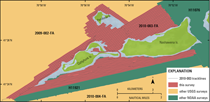
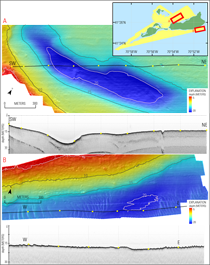
This data report contains high-resolution geophysical data from approximately 24.5 square-kilometers (km2) of the sea floor surrounding Cuttyhunk Island and western Nashawena Island, Massachusetts (fig. 1). Adding to the series of geophysical data reports published (Barnhardt and others, 2006, 2009, 2010; Ackerman and others, 2006; Andrews and others, 2010) through a cooperative mapping program (http://woodshole.er.usgs.gov/project-pages/coastal_mass/)between the U.S. Geological Survey (USGS) and the Massachusetts Office of Coastal Zone Management (CZM), this relatively small nearshore survey was conducted to fill gaps between existing hydrographic surveys conducted by the National Oceanic and Atmospheric Andministration (NOAA) (H11076 and H11921) and larger USGS geophysical surveys in Vineyard Sound and Buzzards Bay (for example, 2009-002-FA and 2010-004-FA; http://woodshole.er.usgs.gov/project-pages/coastal_mass/html/buzz_bay.html) (fig.2). This report contains processed bathymetry, acoustic-backscatter intensity, seismic-reflection, and navigation data along with the collection and processing methods used during USGS survey 2010-003-FA conducted during September 9-18, 2010 on board USGS research vessel (RV) Rafael. Products derived from these data are integrated within a geographic information system (GIS) and assist management decisions and form the foundation for interpretive geological maps for the region. The long-term goals of this mapping program are to provide a framework for scientific research and to develop geologic information to manage coastal and marine resources. High-resolution spatial data and detailed maps of sea floor geology are essential information for managers responsible for protecting fish habitat and delineating marine resources, and for researchers assessing environmental changes caused by natural or human impacts. The Elizabeth Islands trail off the southwestern corner of Cape Cod at Woods Hole, Mass., and divide Vineyard Sound from Buzzards Bay (fig. 1). The Elizabeth Islands are part of the Buzzards Bay Moraine that formed about 18,000 years BP during the waning stage of the last glaciation. As sea level rose throughout the Holocene following deglaciation, part of the Buzzards Bay Moraine that trends southwest from the western-end of Cape Cod became partially submerged separating the Elizabeth Islands from Cape Cod (Uchupi and others, 1996). The hummocky topography and submarine landscape that characterize this area are due to moraine, outwash plain, and other glacial sediments that were left behind after the ice retreated (Oldale and others, 1993). Glacial features are still preserved on much of the sea floor surrounding the western Elizabeth Islands. The boulders that cover much of Sow and Pigs Reef off the western end of Cuttyhunk, Mass., as well as nearshore areas around the islands define the surficial extent of the original moraine deposits. The sandy and rocky areas that characterize the deeper areas south of the islands appear to be outwash and reworked outwash deposits. Relative sea-level change has played a major role in redistributing the glacial sediments over the last 14,500 years. Strong tidal currents create sand waves where thick sand deposits lie and large scour holes in muddy deposits (fig. 3). |