U.S. Geological Survey Open-File Report 2011-1184
High-Resolution Geophysical Data From the Sea Floor Surrounding the Western Elizabeth Islands, Massachusetts

|
The following sections provide basic descriptions of shipboard acquisition and cruise processing of geophysical and geospatial data contained in this report. Detailed descriptions of acquisition parameters, postprocessing steps, and accuracy assessments for each data type are provided within the metadata files for geospatial data layers in the appendix (Geospatial Data). Field Program Approximately 24.5 km2 of the sea floor of the western Elizabeth Islands was surveyed by the RV Rafael in September 2010 (fig. 2 and fig. 4). Interferometric-sonar, sidescan-sonar, and chirp seismic-reflection systems were deployed simultaneously during the cruise. The RV Rafael can survey in water depths as low as 2 meters (m), so the data collected from the September 2010 survey fill gaps around the Elizabeth Islands where larger vessels used in Vineyard Sound and Buzzards Bay could not survey due to draft restrictions. Positioning for the ship, sub-bottom, and sidescan sonar was determined using a Communications Systems International, Inc. (CSI) LGBX Pro differential global positioning system (DGPS) antenna mounted above the cabin on the RV Rafael. Swath bathymetry, sound velocity at the sonar head, and attitude were determined using a CodaOctopus F180 DGPS antenna mounted on a rigid, vertical pole approximately 3 m above the swath transducers. A NovAtel DL-V3 real-time kinematic (RTK) antenna, also mounted above the swath transducers, was used to acquire water-level heights for tidal corrections. Ship positions were recorded to HYPACK, Inc. hydrographic survey software. During acquisition, the RV Rafael maintained speeds between 1.5 and 2.5 meters per second (m/s). Data were collected along tracklines spaced 100-m apart in the shore-parallel direction. Trackline spacing was designed to ensure overlap of adjacent sidescan-sonar swaths. The sidescan system produces a large swath width, typically around 150-m (75-m range). Interferometric-Sonar Bathymetry Bathymetric sounding data were collected with an SEA SWATHplus 234-kilohertz (kHz) interferometric sonar system. Vessel motion (heave, pitch, roll, and yaw) was recorded simultaneously with the swath data using a CodaOctopus F180 attitude and positioning system. The SWATHplus transducers and F180 were mounted on the bow of the RV Rafael on a rigid vertical pole, with the F180 mounted directly above the SWATHplus transducers, at a depth of approximately 0.5 m below the sea surface. The speed of sound at the transducer face was monitored continuously with an AML Oceanographic Micro SV velocimeter mounted at the sonar heads. Horizontal and vertical offsets between the antennae and the F180 and SWATHplus transducers were applied and recorded in the F180 and SWATHplus configuration files. DGPS navigation was used to record horizontal and vertical positions of the soundings during acquisition. Real-time kinematic corrections were transmitted to a DGPS receiver on the survey vessel once every second from a base station established at a warehouse facility. RTK vertical heights were used to correct tidal offsets during post-processing. Initial processing of bathymetric data was performed with SWATHplus acquisition and processing software. Vessel motion data recorded by the F180 were used to correct offsets resulting from heave, pitch, roll, and yaw of the vessel, and filters were applied to remove spurious soundings. Sound velocity profiles (SVP) of the water column were acquired with an AML Oceanographic SV Plus V2 hand deployed velocimeter. Profiles were collected at least once during each survey day, and multiple times per day when the data suggested significant stratification within the water column. Sound velocity profiles were applied within the SWATHplus software during processing to correct bathymetric soundings for errors resulting from changes in the speed of sound within the water column. Cast locations, graph images, and comma-delimited data files for each profile are available for download in the appendix (Geospatial Data). After processing in SWATHplus, soundings were imported into CARIS hydrographic information processing system (HIPS) software for further processing. RTK-corrected water level height values were applied to reference soundings to mean lower low water (MLLW), and remaining spurious soundings were removed by further filtering and manual editing. Continuous bathymetric surfaces were created at 2.5-m per pixel (mpp) grids and were exported from CARIS in ASCII format for import into Environmental Systems Research Institute (ESRI) GRID format. Corresponding color-shaded relief, interpolated, georeferenced TIFF (GeoTIFF) images of the bathymetry were created at 2.5-mpp resolution for use in data visualization and presentation (fig. 5). Sidescan Sonar Sidescan-sonar (acoustic-backscatter) data were acquired with a Klein 3000 dual-frequency (100 and 500 kHz) sidescan-sonar system, which was towed approximately 3 m astern from a davit located on the port side of the RV Rafael. Klein SonarPro acquisition software was used to log the data digitally at a sample rate that resulted in raw pixel resolutions of approximately 0.18 and 0.14 m in the across-track and along-track directions, respectively. Horizontal offset values between the sidescan fish and CSI DGPS antenna were recorded in SonarPro, which calculated fish position dynamically during acquisition. The Klein system produced usable data over swath widths of 150 m. XSonar/ShowImage software was used to correct for geometric and radiometric distortions in the raw sidescan data (Danforth, 1997), and PCI Geomatics software was used to create geospatially referenced (georeferenced) mosaics of the final, processed data. 8-bit gray-scale GeoTIFF images of the mosaics were produced at 0.5-mpp resolution. Sidescan-sonar data were acquired along approximately 253 kilometers (km) of trackline, yielding a total mosaic area of about 24.5 km2 (fig. 6). Chirp Seismic Reflection Approximately 253 km of high-resolution chirp seismic-reflection profiles was collected using an EdgeTech Geo-Star full spectrum sub-bottom (FSSB) system and SB-424 towfish . Data were acquired using a 4.0- to 24.0-kHz frequency sweep, a 10-millisecond (ms) pulse length, a 0.1667-second shot rate, a 23-microsecond sample interval, and a 130-ms record length. Chesapeake Technology Inc. SonarWiz.MAP +SBP acquisition software was used to control the Geo-Star topside unit and digitally log trace data in SEG-Y (revision 1) standard format (Norris and Faichney, 2002). The SB-424 towfish was towed from a starboard-side davit with 2 m of cable on the vessel. Navigation coordinates (in arc-seconds) were obtained from a DGPS antenna and logged to the SEG-Y trace headers. A total of 253 km of seismic data were collected. SIOSEIS and Seismic Unix (Stockwell and Cohen, 2007) software were used to process the raw chirp seismic-reflection data. Navigation data were inspected and edited, static corrections were applied to correct for fish depth beneath the sea surface, sea floor reflections were identified by peak amplitude, and time-varied gain was applied. Final trace data, plotted as PNG images, and geospatially located trackline files are presented in the appendix (Geospatial Data) of this report. |
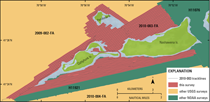
Figure 2. The 2010-0003-FA survey area is shown along with other USGS and NOAA survey areas around the Elizabeth Islands. This small boat survey was completed to fill gaps in the shallow water areas around the western Elizabeth Islands. Survey IDs for NOAA cruises begin with an 'H' all other survey IDs represent USGS cruises.
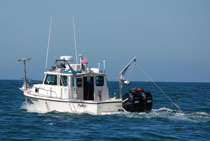
Figure 4. U.S. Geological Survey research vessel Rafael showing the configuration of acquisition equipment. The RTK GPS antennae and the swath interferometric sonar head are located off the bow, and the Klein 3000 sonar system and the Edgetech 424 bottom profiler are deployed from the port and starboard sides, respectively. Photograph by Dave Foster.
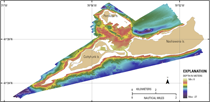
Figure 5. Map showing interpolated, shaded-relief bathymetry of the sea floor surrounding the western Elizabeth Islands, Massachusetts. Coloring and bathymetric contours represent depths in meters, relative to mean lower low water. The contour interval is 10 meters.
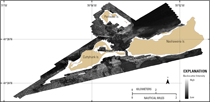
Figure 6. Map showing acoustic-backscatter intensity of the sea floorsurrounding the western Elizabeth Islands, Massachusetts. Backscatter intensity is an acoustic measure of the hardness and roughness of the sea floor. In general, higher values (light tones) represent rock, boulders, cobbles, gravel, and coarse sand. Lower values (dark tones) generally represent fine sand and muddy sediment. |