
|
Figures
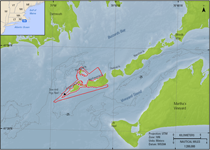 |
Figure 1. Location map of the western Elizabeth Islands, Massachusetts survey area (outlined in red). |
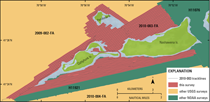 |
Figure 2. The 2010-0003-FA survey area is shown along with other U.S. Geological Survey and National Oceanic and Atmospheric Administration (NOAA) survey areas around the Elizabeth Islands. This small boat survey was completed to fill gaps in the shallow water areas around the western Elizabeth Islands, Massachusetts. Survey identification numbers (IDs) for NOAA cruises begin with an 'H'; all other survey IDs represent USGS cruises. |
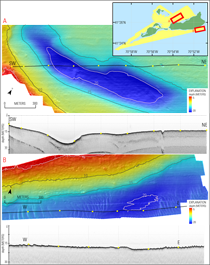 |
Figure 3. Maps and seismic-reflection profiles showing examples of sea floor features within the 2010-003-FA survey area. A, A large scour hole located in a muddy deposit is evident in bathymetric and seismic-reflection data. B, Sand waves south of Nashawena, Massachusetts, are identifiable in bathymetric and seismic-reflection data. Contour intervals are 5 meters, and depths are relative to mean lower low water tidal datum. The yellow dots are marking 500-shot intervals and correspond to the dashed lines in the seismic-reflection profile below each map. |
 |
Figure 4. U.S. Geological Survey research vessel Rafael showing the configuration of acquisition equipment. The RTK GPS antennae and the swath interferometric sonar head are located off the bow, and the Klein 3000 sonar system and the Edgetech 424 bottom profiler are deployed from the port and starboard sides, respectively. Photograph by Dave Foster. |
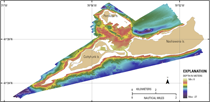 |
Figure 5. Map showing interpolated, shaded-relief bathymetry of the sea floor surrounding the western Elizabeth Islands, Massachusetts. Coloring and bathymetric contours represent depths in meters, relative to mean lower low water. The contour interval is 10 meters.
|
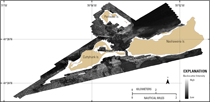 |
Figure 6. Map showing acoustic-backscatter intensity of the sea floor surrounding the western Elizabeth Islands, Massachusetts. Backscatter intensity is an acoustic measure of the hardness and roughness of the sea floor. In general, higher values (light tones) represent rock, boulders, cobbles, gravel, and coarse sand. Lower values (dark tones) generally represent fine sand and muddy sediment.
|
|


