Skip past header information
USGS - science for a changing world

U.S. Geological Survey Open-File Report 2011-1184

High-Resolution Geophysical Data From the Sea Floor Surrounding the Western Elizabeth Islands, Massachusetts


Skip past navigation menu to main textTitle Page / Contents / List of Figures / Conversion Factors and Datum / Abstract / Introduction / Data Collection and Processing / Acknowledgments / References Cited / Appendix


Figure 5 . Map showing the interpolated shaded-relief bathymetry of the seafloor surrounding the western Elizabeth Islands. Coloring and bathymetric contours represent depths in meters, relative to Mean Lower Low Water (MLLW).

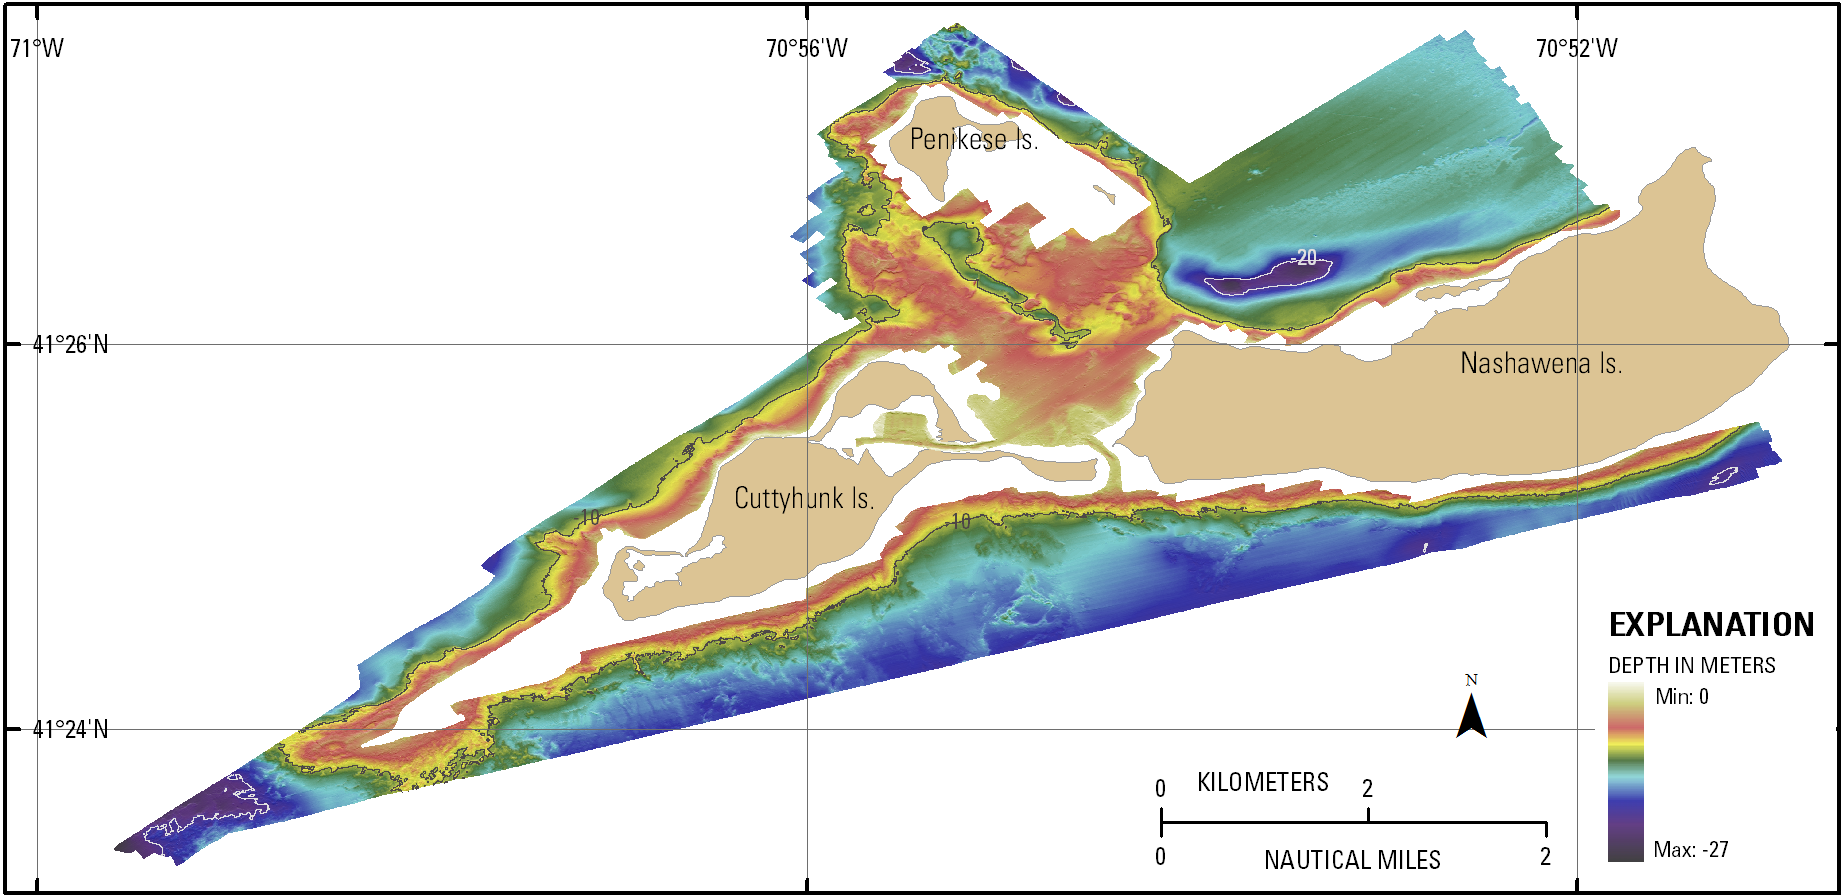
Figure 5. Map showing interpolated, shaded-relief bathymetry of the sea floor surrounding the western Elizabeth Islands, Massachusetts. Coloring and bathymetric contours represent depths in meters, relative to mean lower low water. The contour interval is 10 meters.

Skip USGS links group

Accessibility FOIA Privacy Policies and Notices

Take Pride in America logo USAGov logo U.S. Department of the Interior | U.S. Geological Survey
End of USGS links group