 |
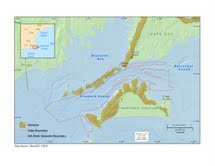
Figure 1. Map showing location of the Vineyard Sound survey area (outlined in red). Abbreviations on figure are explained in the Abbreviations. |
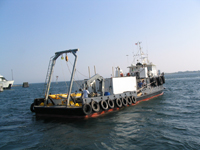 |
Figure 2a. Photograph of a vessel used for the geophysical mapping in this project, M/V Megan T. Miller (2009-0020-FA,and 2010-004-FA). Photograph by Christopher Polloni |
 |
Figure 2b. Photograph of a vessel used for the geophysical mapping in this project, M/V Scarlett Isabella (2011-004-FA). Photograph by David Foster |
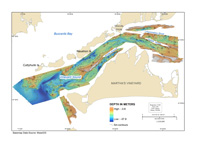 |
Figure 3. Map showing shaded-relief bathymetry of the seafloor in Vineyard Sound, Massachusetts. Coloring and bathymetric contours represent depth, in meters, relative to Mean Lower Low Water (MLLW) datum. Abbreviations on figure are explained in the Abbreviations. |
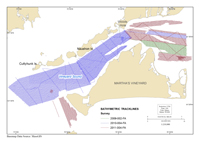 |
Figure 4. Map showing tracklines along which bathymetry data were collected in the Vineyard Sound, Massachusetts, survey area. Tracklines are color coded by U.S. Geological Survey (USGS) survey number. Abbreviations on figure are explained in the Abbreviations. |
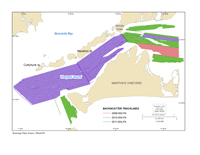 |
Figure 5. Map showing tracklines along which acoustic-backscatter data were collected in the Vineyard Sound, Massachusetts, survey area. Tracklines are color-coded by U.S. Geological Survey (USGS) survey number. Abbreviations on figure are explained in the Abbreviations. |
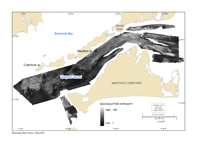 |
Figure 6. Map showing acoustic-backscatter intensity of the seafloor in the Vineyard Sound, Massachusetts, survey area. Backscatter intensity is an acoustic measure of reflectivity of the seafloor. In general, higher values (light tones) represent rock, boulders, cobbles, gravel, and coarse sand. Lower values (dark tones) generally represent fine sand and muddy sediment. Backscatter intensity scale values are relative digital number (DN) values based an 8-bit data range (0-255). Abbreviations on figure are explained in the Abbreviations. |
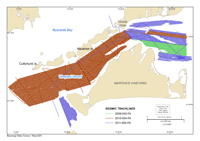 |
Figure 7. Map showing tracklines along which seismic-reflection profiles were collected in the Vineyard Sound, Massachusetts, survey area. Tracklines are color-coded by U.S. Geological Survey (USGS) survey number. Abbreviations on figure are explained in the Abbreviations. |


