U.S. Geological Survey Open-File Report 2012-1038
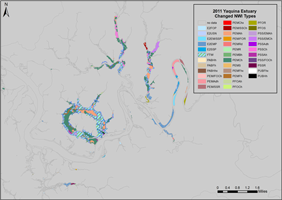
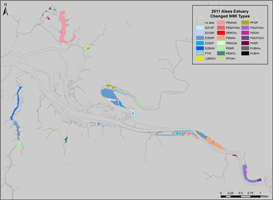
ResultsRecommended Revisions to Cowardin et al. (1979) ClassificationThe enhanced NWI shapefiles contain recommended revisions to the Cowardin et al. classification (system, subsystem, class, and/or modifiers) for 286 NWI polygons in the Yaquina estuary (1,133 acres) and 83 NWI polygons in the Alsea basin (322 acres) (figs. 4 and 5). Many of the changes consisted of adding the "diked" modifier to diked former tidal wetlands that are currently palustrine wetlands. For example, PEMC was changed to PEMCh for 514 acres in the Yaquina estuary, and PEMA was changed to PEMAh for 32 acres in the Alsea estuary (tables 5 and 6). Other common changes were the addition of a tidally influenced hydrologic modifier to palustrine wetlands, and a change from the palustrine to the estuarine class based on field measurements of salinity data. Substantial acreages of likely former tidal wetland were identified that are currently classified as upland in the NWI (tables 5 and 6; see section, "Likely Former Tidal Wetlands Classified as Upland in the NWI").
Table 5. Total area (acres) of recommended changes to NWI Cowardin et al. classification, by original NWI classification, Yaquina estuary, Oregon. [Table includes only those original or revised classifications that totaled more than 1 acre]
1 FTW is not a Cowardin et al. classification, but a designation indicating a likely Former Tidal Wetland, currently disconnected from tidal flow but with land surfaces at elevations within tidal range. Table 6. Total area (acres) of recommended changes to NWI Cowardin et al. classification, by original NWI classification, Alsea estuary, Oregon. [Table includes only those original or revised classifications that totaled more than 1 acre]
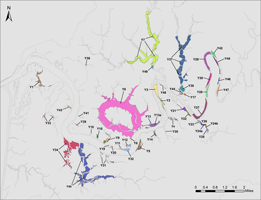
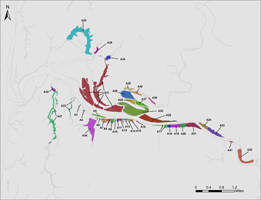
1 FTW is not a Cowardin et al. classification, but a designation indicating a likely Former Tidal Wetland, currently disconnected from tidal flow but with land surfaces at elevations within tidal range. Likely Former Tidal Wetlands Classified as Upland in the NWIAnalysis of LiDAR data revealed many likely former tidal wetlands that were classified as upland in the National Wetlands Inventory (64 NWI polygons totaling 441 acres in the Yaquina estuary, and 16 NWI polygons totaling 51 acres in the Alsea estuary) (figs. 4 and 5; tables 5 and 6). Cowardin et al. classification of these former tidal wetlands was beyond the scope of this project because field evaluation would have been needed to determine the hydrologic status of these areas. GIS Data for 1999 Prioritization SitesGIS datasets were created for the 1999 prioritization sites as well as for several new prioritization sites in each estuary (figs. 6 and 7). The GIS datasets contain 49 prioritization sites totaling 2,177 acres in the Yaquina estuary, and 39 prioritization sites totaling 1,045 acres in the Alsea estuary. The prioritization sites consisted of 494 and 192 underlying NWI polygons in the Yaquina and Alsea estuaries, respectively.
New Prioritization SitesPreviously described LiDAR-derived elevations and NWI classification analysis allowed us to identify tidal wetlands (or former tidal wetlands) that had not been described in the 1999 study. In most cases, these tidal wetlands were already classified as wetlands in the NWI, but they were not previously classified as tidal wetlands nor did they have special modifiers suggesting hydrologic alterations that would restrict tidal flows. In two cases, new sites were identified that were classified as upland in the NWI, but which were at elevations within tidal range. These two cases were prioritization sites A38 and A40, on land owned by U.S. Forest Service (USFS) and U.S. Bureau of Land Management (BLM), near the Drift Creek tidal wetland restoration project (prioritization site A26) (fig. 7). LiDAR data were used to digitize new prioritization site boundaries using the methods described in section, "Likely Former Tidal Wetlands Classified as Upland in the NWI". The new prioritization sites in each estuary are listed, with approximate acreages. Field visits by a knowledgeable wetland scientist are recommended to determine the state and federal regulatory status of these areas.
Revisions to Prioritization Site AttributesNew information on prioritization site characteristics (changes since 1999, or information not provided in 1999) was generated for 15 of 49 prioritization sites in the Yaquina estuary and 8 of 39 prioritization sites in the Alsea estuary. The new information can be found in the attribute tables of the prioritization site shapefiles (see section, "Downloadable Wetland Shapefiles"). Most of the new information relates to restoration activities or field observations since 1999. |
First posted May 10, 2013
For additional information contact: Part or all of this report is presented in Portable Document Format (PDF); the latest version of Adobe Reader or similar software is required to view it. Download the latest version of Adobe Reader, free of charge. |
||||||||||||||||||||||||||||||||||||||||||||||||||||||||||||||||||||||||||||||||||||||||||||||||||||||||||||||||||||||||||||||||||||||||||||||||||||||||||||||||||||||||||||||||||||||||||||||||||||||||||||||||||||||||||||||||||||||||||||||||||||||||||||||||||||||||||||||||||||||||||||||||||||||||||||||||||||||||||||||||||||||||||||||||||||||||||||||||||||||||||||||||||||||||||||||||||||||||||||||||||||||||||||||||||||||||||||||||||||||||||||||||||||||||||||||||||||||||||||||||||||||||||||||||||||||||||||||||||||||||||||||||||||||||||||||||||||||||||||||||||||||||||||||||||||||||||||||||||||||||||||||||||||||||||||||||||||||||||||||||||||||||||||||||||||||||||||||||||||||||||||||||||||||||||||||||||||||||||||||||||||||||||||||||||||||||||||||||||||||||||||||||||||||||||||||||||||||||||||

![]() U.S. Department of the Interior |
U.S. Geological Survey
U.S. Department of the Interior |
U.S. Geological Survey
URL: http://pubsdata.usgs.gov/pubs/of/2012/1038/results.html
Page Contact Information: GS Pubs Web Contact
Page Last Modified: Friday, 10-May-2013 12:37:28 EDT