Open-File Report 2012—1263
|
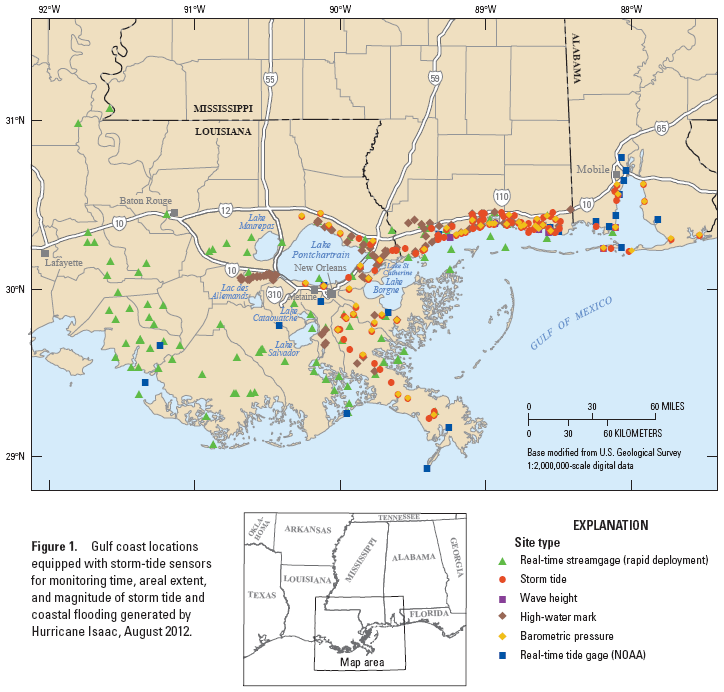
The U.S. Geological Survey (USGS) deployed a temporary monitoring network of water-level and barometric pressure sensors at 127 locations along the gulf coast from Alabama to Louisiana to record the timing, areal extent, and magnitude of hurricane storm tide and coastal flooding generated by Hurricane Isaac. This deployment was undertaken as part of a coordinated federal emergency response as outlined by the Stafford Act under a directed mission assignment by the Federal Emergency Management Agency. Storm tide, as defined by National Oceanic and Atmospheric Administration (NOAA; National Oceanic and Atmospheric Administration, 2008), is the water-level rise generated by a combination of storm surge and astronomical tide during a coastal storm. Hurricane Isaac initially made landfall on the coast of Louisiana in Plaquemines Parish on August 28, 2012, as a Category 1 hurricane on the Saffir–Simpson Hurricane Wind Scale (National Weather Service, 1974) and then stalled over southern Louisiana for several days, causing prolonged storm-tide impacts. A total of 188 water-level and wave-height sensors were deployed at 127 locations during August 27–28 prior to landfall. More than 90 percent of the sensors and all high-water marks (HWMs) were recovered and surveyed to North American Vertical Datum of 1988 (NAVD 88) within 7 days of the Isaac landfall. Only a handful of sensors in the Plaquemines Parish area of Louisiana could not be retrieved until weeks later due to prolonged flooding in the area. Data collected from this event can be used to evaluate the performance of storm-tide models for maximum and incremental water level and flood extent and the site-specific effects of storm tide on natural and anthropogenic features of the environment. Open the Internet mapping site to view map showing sensor site locations and view data and charts.
Table 1. Number of sites equipped to monitor Hurricane Isaac storm tide, by State.
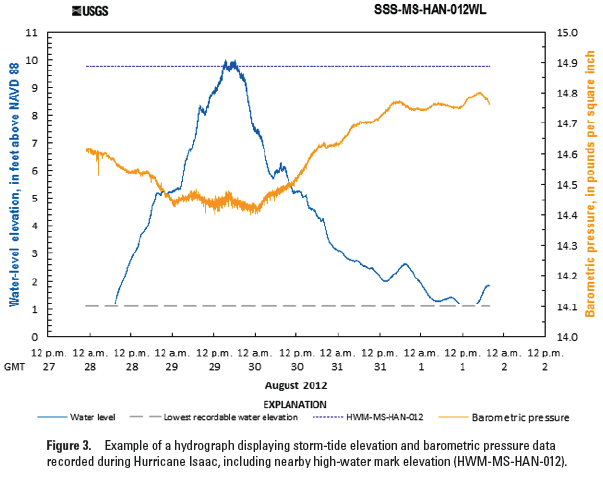
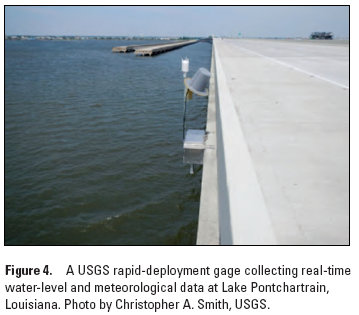
The locations of these water-level sensors were selected to augment existing tide-gage networks and to ensure adequate monitoring in areas forecasted to have significant storm tide. After Hurricane Isaac made landfall in Louisiana, the sustained winds from the stalled hurricane exacerbated storm-tide flooding along the Louisiana and Mississippi coasts, and caused significant backwater to occur far inland along the Mississippi and Atchafalaya Rivers, which were very low because of previous prolonged drought conditions upstream. Of the 127 locations monitored, 2 water-level sensors (1 storm-tide and 1 wave-height) were lost or malfunctioned during the storm, and 2 sensors (1 storm-tide and 1 wave-height) did not record storm tide either due to a lack of water-level rise or because the sensor was installed too high above the water. A typical sensor installation is shown in figure 2. Of the 127 monitored locations, 109 had sensors that were programmed to record water pressure at 30-second intervals, expressed as water level in feet above NAVD 88 following surveys completed during sensor recovery, and 55 locations had additional sensors to record barometric pressure at 30-second intervals, expressed in pounds per square inch (table 1). Water-level elevation and barometric pressure were recorded over time by the sensors during the storm, as shown in the example in figure 3, and a nearby HWM elevation was used to compare with the sensor data. Of the 127 monitored locations, 18 were instrumented with real-time water level sensors that recorded water-level elevations every 15 minutes during the hurricane and updated hourly to USGS Web pages (table 1; fig. 4). Wave-height sensors that were co-located at six of the monitored locations along the gulf coast from Bay St. Louis, Mississippi to Dauphin Island, Alabama measured every 2 seconds from midnight to noon on August 29 (Wednesday).
Data were collected and processed following protocols established by McGee and others (2006) and expanded upon by McCallum and others (2012), which included correcting water pressure for changes in barometric pressure and salinity. Quality-control checks were made by (1) deploying redundant sensors at a subset of sites, (2) comparing water levels computed from recorded pressure data to water levels recorded at nearby USGS streamgaging and NOAA tidal stations, and (3) to co-located high-water marks where possible. In the aftermath of the storm, 50 HWM locations were surveyed relative to NAVD 88 in Mississippi, 53 locations in Louisiana, and 1 in Alabama, where the impacts of the storm were the most pronounced.
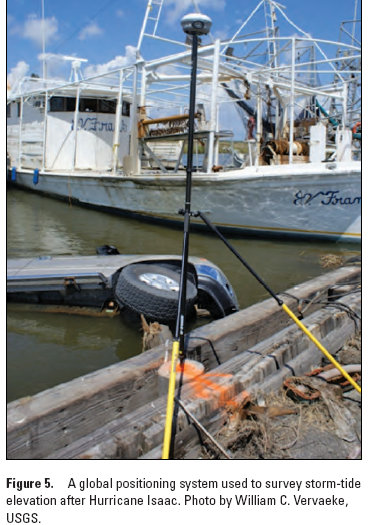
Elevation SurveysReference points were established on permanent objects near the water-level sensors in order to relate the recorded water-surface elevation to NAVD 88. Graduated steel tapes were used to relate the elevation of the reference points to the water-level sensors. Survey-grade Global Navigation Satellite Systems (GNSS) equipment (fig. 5) was used to determine the elevation above NAVD 88 of the reference points and HWMs, per USGS technical guidance in Rydland and Densmore (2012). GNSS equipment relies on GEOID models to determine elevations above NAVD 88. A new model, the GEOID12, was released in July 2012; however, errors in the model were soon discovered for the gulf coast region in checking the surveying accuracy at benchmarks (http://www.ngs.noaa.gov/web/news/GEOID12_Error_Notice.shtml). Following analysis of the control data and a number of corrections, the GEOID12A model was released on September 11, 2012 (National Geodetic Survey, 2012). However, because this model was in beta testing during the initial recovery effort of this study, the GEOID09 model was used for consistency within the deployment area, and all elevations in this report were derived using the GEOID09 model. National Geodetic Survey (NGS) benchmarks throughout the study area were surveyed for vertical control. Table 2 (back of report) lists the GNSS-derived elevations using both the GEOID09 and GEOID12A models for all NGS benchmarks surveyed during this study. Table 2 also lists the difference in the GNSS elevations for both models, and the published NGS elevations from the datasheets, which can be can be accessed at http://www.ngs.noaa.gov/cgi-bin/datasheet.prl.
Data PresentationThe data from the Hurricane Isaac storm-tide network constitute an extensive collection of continuous water-level records documenting a single, landfall hurricane. The data can be used to evaluate the performance of storm-tide models for maximum and incremental water level and flood extent and for site-specific effects of storm tide on natural and anthropogenic features of the environment. The data are available on a provisional basis in tab-delineated, ASCII format by site for each sensor by using a USGS interactive storm-tide mapper at http://wim.usgs.gov/isaacstormtidemapper/stormtidemapper.html. Digital photographs for selected locations are available on the interactive mapper. Data for each sensor include location, date, time, water level, and barometric pressure and the data-processing date are provided in the file header. Data for HWMs include location, description and quality of the mark, and elevation. A list of the 133 water-level and wave-height sensor locations and the peak elevation recorded at each are listed in table 3 (back of report). These temporary sensors were deployed to augment long-term monitoring networks operated by the USGS (table 4, back of report) and NOAA (table 5, back of report). All HWM data, both those co-located at a sensor and those independent of a sensor location, that were collected by the USGS immediately after Hurricane Isaac are listed in table 6 (back of report). The reference points and HWMs were surveyed to a vertical accuracy of 0.25 foot at the 95-percent confidence level and within 10 feet horizontally. All NOAA data are displayed to mean sea level. AcknowledgmentsThis report was prepared in cooperation with the Federal Emergency Management Agency. The data in this report are the result of the long hours and effort by numerous staff in the USGS Water Science Centers in Alabama, Mississippi, Louisiana, and Georgia. The USGS would like to recognize the assistance and access to the real-time network (RTN) along the gulf coast provided by the Center for Geoinformatics at no charge because of the public safety nature of this event. The authors particularly highlight the leadership and dedication of USGS employees in the Wisconsin Water Science Center who assisted with the Storm-Tide Mapper updates to deliver these valuable data to numerous stakeholders in a very timely and accurate manner. References CitedMcGee, B.D., Goree, B.B., Tollett, R.W., Woodward, B.K., and Kress, W.H., 2006, Hurricane Rita surge data, southwestern Louisiana and southeastern Texas, September to November 2005: U.S. Geological Survey Data Series 220, available at http://pubs.usgs.gov/ds/2006/220/. McCallum, B.E., Painter, J.A., and Frantz, E.R., 2012, Monitoring storm tide and flooding from Hurricane Irene along the Atlantic coast of the United States, August 2011: U.S. Geological Survey Open-File Report 2012–1022, available online at http://pubs.usgs.gov/of/2012/1022/. National Geodetic Survey, 2012, NOTICE: NGS update, September 11, 2012, GEOID12A model released: The NGS Geoid Page, available at http://www.ngs.noaa.gov/GEOID/. National Oceanic and Atmospheric Administration, 2008, Tides & currents: National Oceanic and Atmospheric Administration, accessed October 9, 2012, at http://tidesandcurrents.noaa.gov/index.shtml. National Weather Service, 1974, The Saffir–Simpson Hurricane Wind Scale [updated February 1, 2012]: National Hurricane Center, accessed October 10, 2012, at http://www.nhc.noaa.gov/aboutsshws.php. Rydlund, P.H., Jr., and Densmore, B.K., 2012, Methods of practice and guidelines for using survey-grade global navigation satellite systems (GNSS) to establish vertical datum in the United States Geological Survey: U.S. Geological Survey Techniques and Methods, book 11, chap. D1, 102 p. with appendixes, available at http://pubs.usgs.gov/tm/11d1/tm11-D1.pdf (PDF). |
First posted December 13, 2012 Excel data files:
For additional information contact: Part or all of this report is presented in Portable Document Format (PDF); the latest version of Adobe Reader or similar software is required to view it. Download the latest version of Adobe Reader, free of charge. |
Table 3. Hurricane Isaac peak storm-tide data for 133 U.S. Geological Survey temporarily-deployed sites, by State.
[NAVD 88, North American Vertical Datum of 1988; GMT, Greenwich meridian time; RDG, rapid-deployment gage]
Download Table 3 - Storm tides (Excel file)
| Site identification (Links to data file) |
State/County | Site type | Data recorded | Peak elevation, feet above NAVD 88/ Peak storm-tide, date and time (GMT) (Links to chart) |
|---|---|---|---|---|
| 302019088074181 | Alabama Mobile | real-time RDG | storm tide | none peak not recorded |
| SSS-AL-BAL-001WL | Alabama Baldwin | water level | storm tide | 3.52 8/29/2012 16:35:51 |
| SSS-AL-BAL-002WL | Alabama Baldwin | water level | storm tide | 3.18 8/29/2012 15:14:00 |
| SSS-AL-BAL-003WL | Alabama Baldwin | water level | storm tide | 4.72 8/28/2012 16:55:00 |
| SSS-AL-BAL-004WL | Alabama Baldwin | water level | storm tide | 4.94 8/29/2012 17:29:00 |
| SSS-AL-BAL-005WL | Alabama Baldwin | water level | storm tide | 4.97 8/29/2012 16:31:30 |
| SSS-AL-MOB-001WL | Alabama Mobile | water level | storm tide | 4.93 8/29/2012 14:36:30 |
| SSS-AL-MOB-002WV | Alabama Mobile | wave height | wave height | 7.43 8/29/2012 11:04:14 |
| SSS-AL-MOB-003WL | Alabama Mobile | water level | storm tide | 7.31 8/28/2012 20:54:30 |
| SSS-AL-MOB-004WL | Alabama Mobile | water level | storm tide | 5.28 8/29/2012 14:39:30 |
| SSS-AL-MOB-005WL | Alabama Mobile | water level | storm tide | 5.96 8/29/2012 16:06:00 |
| SSS-AL-MOB-006WV | Alabama Mobile | wave height | wave height | 5.86 8/29/2012 11:10:28 |
| SSS-AL-MOB-007WL | Alabama Mobile | water level | storm tide | 5.31 8/29/2012 16:35:30 |
| SSS-AL-MOB-008WL | Alabama Mobile | water level | storm tide | 5.45 8/29/2012 19:07:30 |
| SSS-AL-MOB-009WL | Alabama Mobile | water level | storm tide | 5.40 8/29/2012 19:44:30 |
| SSS-AL-MOB-010WL | Alabama Mobile | water level | storm tide | 5.48 8/29/2012 19:38:30 |
| 00004264 | Louisiana Jefferson | real-time RDG | storm tide | 4.28 8/30/2012 19:00:00 |
| 295020089411600 | Louisiana St Bernard | real-time RDG | storm tide | 7.96 8/29/2012 11:15:00 |
| 300413090084304 | Louisiana Jefferson | real-time RDG | storm tide | 7.41 GH 8/29/2012 13:15:00 |
| 3004510895507 | Louisiana Orleans | real-time RDG | storm tide | 0.27 8/30/2012 23:00:00 |
| 300830089515000 | Louisiana Orleans | real-time RDG | storm tide | 6.13 8/30/2012 8:15:00 |
| 301213894806 | Louisiana St Tammany | real-time RDG | storm tide | 56.01 GH 8/30/2012 2:30:00 |
| 301609089504016 | Louisiana St Tammany | real-time RDG | storm tide | 6.20 8/30/2012 5:45:00 |
| 301704090240655 | Louisiana Tangipahoa | real-time RDG | storm tide | 6.99 8/30/2012 10:45:00 |
| 301847089560989 | Louisiana St Tammany | real-time RDG | storm tide | 7.95 8/30/2012 5:45:00 |
| 302415090091465 | Louisiana St Tammany | real-time RDG | storm tide | 8.45 GH 8/30/2012 3:45:00 |
| SSS-LA-ORL-013WL | Louisiana Orleans | water level | storm tide | 4.05 8/30/2012 14:45:00 |
| SSS-LA-ORL-014WL | Louisiana Orleans | water level | storm tide | 6.41 8/30/2012 8:59:00 |
| SSS-LA-ORL-017WL | Louisiana Orleans | water level | storm tide | 7.79 8/29/2012 8:10:30 |
| SSS-LA-ORL-050WL | Louisiana Orleans | water level | storm tide | 6.30 8/30/2012 4:01:00 |
| SSS-LA-ORL-051WL | Louisiana Orleans | water level | storm tide | 6.72 8/29/2012 16:18:00 |
| SSS-LA-ORL-052WL | Louisiana Orleans | water level | storm tide | 10.13 8/29/2012 15:48:00 |
| SSS-LA-ORL-054WL | Louisiana Orleans | water level | storm tide | 5.82 8/30/2012 9:24:00 |
| SSS-LA-PLA-001WL | Louisiana Plaquemines | water level | storm tide | 11.62 8/29/2012 4:48:30 |
| SSS-LA-PLA-002WL | Louisiana Plaquemines | water level | storm tide | -0.26 8/29/2012 13:59:00 |
| SSS-LA-PLA-003WL | Louisiana Plaquemines | water level | storm tide | 11.97 8/29/2012 2:52:00 |
| SSS-LA-PLA-004WL | Louisiana Plaquemines | water level | storm tide | 14.41 8/29/2012 2:56:30 |
| SSS-LA-PLA-005WL | Louisiana Plaquemines | water level | storm tide | 13.29 8/29/2012 8:18:00 |
| SSS-LA-PLA-006WL | Louisiana Plaquemines | water level | storm tide | 13.49 8/29/2012 9:27:30 |
| SSS-LA-PLA-007WL | Louisiana Plaquemines | water level | storm tide | 7.12 8/29/2012 14:08:30 |
| SSS-LA-PLA-008WL | Louisiana Plaquemines | water level | storm tide | 8.10 8/29/2012 16:01:00 |
| SSS-LA-PLA-009WL | Louisiana Plaquemines | water level | storm tide | -0.43 8/28/2012 19:39:00 |
| SSS-LA-PLA-010WL | Louisiana Plaquemines | water level | storm tide | 6.37 8/29/2012 6:44:00 |
| SSS-LA-PLA-011WL | Louisiana Plaquemines | water level | storm tide | 4.58 8/29/2012 14:30:00 |
| SSS-LA-PLA-012WL | Louisiana Plaquemines | water level | storm tide | 7.27 8/29/2012 13:57:00 |
| SSS-LA-PLA-017WL | Louisiana Plaquemines | water level | none | none lost |
| SSS-LA-PLA-018WL | Louisiana Plaquemines | water level | storm tide | 14.07 8/29/2012 12:36:30 |
| SSS-LA-PLA-019WL | Louisiana Plaquemines | water level | storm tide | 13.89 8/29/2012 14:25:30 |
| SSS-LA-PLA-020WL | Louisiana Plaquemines | water level | storm tide | 14.00 8/29/2012 12:32:30 |
| SSS-LA-PLA-021WL | Louisiana Plaquemines | water level | storm tide | 13.53 8/29/2012 12:39:30 |
| SSS-LA-PLA-022WL | Louisiana Plaquemines | water level | storm tide | 13.71 8/29/2012 12:20:00 |
| SSS-LA-STB-003WL | Louisiana St Bernard | water level | storm tide | 2.00 8/29/2012 21:29:30 |
| SSS-LA-STB-024WL | Louisiana St Bernard | water level | storm tide | 11.57 8/29/2012 15:03:00 |
| SSS-LA-STB-025WL | Louisiana St Bernard | water level | storm tide | 10.18 8/29/2012 6:06:00 |
| SSS-LA-STB-026WL | Louisiana St Bernard | water level | storm tide | 11.45 8/29/2012 10:17:00 |
| SSS-LA-STB-027WL | Louisiana St Bernard | water level | storm tide | 10.77 8/29/2012 16:17:30 |
| SSS-LA-STT-007WL | Louisiana St Tammany | water level | storm tide | 8.50 8/30/2012 4:28:00 |
| SSS-LA-STT-008WL | Louisiana St Tammany | water level | storm tide | 8.28 8/30/2012 7:30:00 |
| SSS-LA-STT-009WL | Louisiana St Tammany | water level | none | none no surge recorded |
| SSS-LA-STT-010WL | Louisiana St Tammany | water level | storm tide | 7.91 8/30/2012 5:08:00 |
| SSS-LA-STT-011WL | Louisiana St Tammany | water level | storm tide | 10.04 8/30/2012 8:43:00 |
| SSS-LA-STT-012WL | Louisiana St Tammany | water level | storm tide | 9.35 8/30/2012 9:27:30 |
| SSS-LA-STT-100WL | Louisiana St Tammany | water level | storm tide | 9.32 8/29/2012 19:23:00 |
| SSS-LA-STT-101WL | Louisiana St Tammany | water level | storm tide | 7.50 8/29/2012 20:55:00 |
| SSS-LA-STT-102WL | Louisiana St Tammany | water level | storm tide | 9.70 8/29/2012 19:13:30 |
| SSS-LA-TAN-004WL | Louisiana Tangipahoa | water level | storm tide | 9.27 8/30/2012 8:55:30 |
| 02480605 | Mississippi Harrison | real-time RDG | storm tide | none peak not recorded |
| 02481299 | Mississippi Jackson | real-time RDG | storm tide | 6.96 8/29/2012 18:15:00 |
| 02481325 | Mississippi Harrison | real-time RDG | storm tide | 8.66 8/29/2012 19:30:00 |
| 0248152650 | Mississippi Harrison | real-time RDG | storm tide | 9.39 8/29/2012 17:00:00 |
| 02481667 | Mississippi Hancock | real-time RDG | storm tide | 9.69 8/29/2012 16:30:00 |
| 02481671 | Mississippi Hancock | real-time RDG | storm tide | 10.12 8/29/2012 17:45:00 |
| 02492670 | Mississippi Hancock | real-time RDG | storm tide | 7.78 8/29/2012 12:00:00 |
| SSS-MS-HAN-004WL | Mississippi Hancock | water level | storm tide | 10.73 8/29/2012 19:00:00 |
| SSS-MS-HAN-012WL | Mississippi Hancock | water level | storm tide | 10.00 8/29/2012 18:12:00 |
| SSS-MS-HAN-013WL | Mississippi Hancock | water level | storm tide | 8.78 8/29/2012 17:38:00 |
| SSS-MS-HAN-014WL | Mississippi Hancock | water level | storm tide | 10.90 8/29/2012 17:39:30 |
| SSS-MS-HAN-015WL | Mississippi Hancock | water level | storm tide | 11.60 8/29/2012 13:16:30 |
| SSS-MS-HAN-016WL | Mississippi Hancock | water level | storm tide | 10.09 8/29/2012 17:06:30 |
| SSS-MS-HAN-017WL | Mississippi Hancock | water level | storm tide | 9.52 8/29/2012 20:01:00 |
| SSS-MS-HAN-018WL | Mississippi Hancock | water level | storm tide | 9.99 8/29/2012 14:33:30 |
| SSS-MS-HAR-001WL | Mississippi Harrison | water level | storm tide | 9.24 8/30/2012 2:34:00 |
| SSS-MS-HAR-002WL | Mississippi Harrison | water level | storm tide | 8.13 8/29/2012 18:07:30 |
| SSS-MS-HAR-003WL | Mississippi Harrison | water level | riverine | 18.50 8/30/2012 1:31:30 |
| SSS-MS-HAR-004WL | Mississippi Harrison | water level | riverine | 12.43 8/30/2012 7:29:00 |
| SSS-MS-HAR-005WL | Mississippi Harrison | water level | storm tide | 8.79 8/29/2012 17:49:00 |
| SSS-MS-HAR-006WL | Mississippi Harrison | water level | storm tide | 9.19 8/29/2012 17:57:00 |
| SSS-MS-HAR-007WL | Mississippi Harrison | water level | storm tide | 8.26 8/29/2012 20:18:30 |
| SSS-MS-HAR-008WL | Mississippi Harrison | water level | storm tide | 8.15 8/29/2012 19:55:00 |
| SSS-MS-HAR-009WL | Mississippi Harrison | water level | storm tide | 8.78 8/29/2012 20:14:00 |
| SSS-MS-HAR-010WL | Mississippi Harrison | water level | storm tide | 9.51 8/29/2012 18:20:00 |
| SSS-MS-HAR-011WL | Mississippi Harrison | water level | storm tide | 9.41 8/29/2012 17:55:00 |
| SSS-MS-HAR-014WL | Mississippi Harrison | water level | storm tide | 9.37 8/29/2012 17:45:30 |
| SSS-MS-HAR-019WL | Mississippi Harrison | water level | storm tide | 7.46 8/29/2012 18:57:30 |
| SSS-MS-HAR-020WL | Mississippi Harrison | water level | storm tide | 9.19 8/29/2012 18:07:00 |
| SSS-MS-HAR-021WL | Mississippi Harrison | water level | storm tide | 9.41 8/29/2012 18:04:30 |
| SSS-MS-HAR-022WL | Mississippi Harrison | water level | storm tide | 9.32 8/29/2012 17:55:00 |
| SSS-MS-HAR-023WL | Mississippi Harrison | water level | storm tide | 10.15 8/29/2012 17:34:00 |
| SSS-MS-HAR-024WL | Mississippi Harrison | water level | storm tide | 9.87 8/29/2012 18:21:00 |
| SSS-MS-HAR-025WL | Mississippi Harrison | water level | storm tide | 11.00 8/29/2012 17:19:00 |
| SSS-MS-HAR-026WV | Mississippi Harrison | wave height | wave height | 9.48 8/29/2012 12:01:14 |
| SSS-MS-HAR-101WV | Mississippi Harrison | wave height | none | none lost |
| SSS-MS-JAC-012WL | Mississippi Jackson | water level | storm tide | 6.85 8/29/2012 18:53:00 |
| SSS-MS-JAC-013WL | Mississippi Jackson | water level | storm tide | 6.60 8/29/2012 19:12:30 |
| SSS-MS-JAC-014WL | Mississippi Jackson | water level | storm tide | 6.55 8/29/2012 16:56:00 |
| SSS-MS-JAC-015WL | Mississippi Jackson | water level | storm tide | 6.52 8/29/2012 16:43:30 |
| SSS-MS-JAC-016WL | Mississippi Jackson | water level | storm tide | 6.49 8/29/2012 17:19:00 |
| SSS-MS-JAC-017WL | Mississippi Jackson | water level | storm tide | 7.76 8/29/2012 15:45:00 |
| SSS-MS-JAC-018WL | Mississippi Jackson | water level | storm tide | 6.74 8/29/2012 17:15:30 |
| SSS-MS-JAC-019WL | Mississippi Jackson | water level | storm tide | 8.45 8/30/2012 4:18:00 |
| SSS-MS-JAC-020WL | Mississippi Jackson | water level | storm tide | 6.13 8/29/2012 16:42:00 |
| SSS-MS-JAC-021WL | Mississippi Jackson | water level | storm tide | 7.65 8/29/2012 16:11:30 |
| SSS-MS-JAC-022WL | Mississippi Jackson | water level | storm tide | 6.13 8/29/2012 16:31:00 |
| SSS-MS-JAC-023WL | Mississippi Jackson | water level | storm tide | 6.71 8/29/2012 17:18:30 |
| SSS-MS-JAC-024WL | Mississippi Jackson | water level | storm tide | 6.29 8/29/2012 17:18:30 |
| SSS-MS-JAC-030WL | Mississippi Jackson | water level | storm tide | 5.62 8/29/2012 19:00:30 |
| SSS-MS-JAC-031WL | Mississippi Jackson | water level | storm tide | 5.68 8/29/2012 17:53:30 |
| SSS-MS-JAC-032WL | Mississippi Jackson | water level | storm tide | 7.07 8/29/2012 17:42:00 |
| SSS-MS-JAC-033WL | Mississippi Jackson | water level | storm tide | 5.75 8/29/2012 16:18:30 |
| SSS-MS-JAC-034WL | Mississippi Jackson | water level | storm tide | 5.81 8/29/2012 16:18:00 |
| SSS-MS-JAC-035WL | Mississippi Jackson | water level | none | none no surge recorded |
| SSS-MS-JAC-036WL | Mississippi Jackson | water level | storm tide | 7.19 8/29/2012 19:04:00 |
| SSS-MS-JAC-037WL | Mississippi Jackson | water level | storm tide | 7.46 8/29/2012 19:06:30 |
| SSS-MS-JAC-038WL | Mississippi Jackson | water level | storm tide | 7.11 8/29/2012 21:18:00 |
| SSS-MS-JAC-039WV | Mississippi Jackson | wave height | wave height | 6.70 8/29/2012 11:34:36 |
| SSS-MS-JAC-040WV | Mississippi Jackson | wave height | none | none no surge recorded |
| SSS-MS-JAC-050WL | Mississippi Jackson | water level | storm tide | 5.00 8/29/2012 16:12:15 |
| SSS-MS-JAC-051WL | Mississippi Jackson | water level | storm tide | 5.42 8/29/2012 16:30:28 |
| SSS-MS-JAC-052WL | Mississippi Jackson | water level | storm tide | 6.15 8/29/2012 18:42:37 |
| SSS-MS-JAC-053WL | Mississippi Jackson | water level | storm tide | 7.55 8/29/2012 17:47:25 |
| SSS-MS-JAC-054WL | Mississippi Jackson | water level | storm tide | 6.06 8/29/2012 15:35:50 |
| SSS-MS-JAC-055WL | Mississippi Jackson | water level | storm tide | 6.32 8/29/2012 15:18:56 |
| SSS-MS-JAC-056WL | Mississippi Harrison | water level | storm tide | 7.49 8/29/2012 17:34:00 |
McCallum, B.E., McGee, B.D., Kimbrow, D.R., Runner, M.S., Painter, J.A., Frantz, E.R., and Gotvald, A.J., 2012, Monitoring storm tide and flooding from Hurricane Isaac along the Gulf Coast of the United States, August 2012: U.S. Geological Survey Open-File Report 2012–1263, 24 p. (Available online at http://pubs.usgs.gov/of/2012/1263/.)

![]() U.S. Department of the Interior |
U.S. Geological Survey
U.S. Department of the Interior |
U.S. Geological Survey
URL: http://pubsdata.usgs.gov/pubs/of/2012/1263/index.html
Page Contact Information: GS Pubs Web Contact
Page Last Modified: Monday, 11-Feb-2013 16:08:02 EST