 |
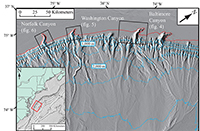
Figure 1. Map showing the study area in shaded relief. Illumination angle is 325 degrees. The red contour represents the 120-meter isobath, and blue contours represent isobaths at a 500-meter contour interval. The red box in the inset map shows the extent of relief map. Abbreviations: km-kilometers, m-meters. |
 |
Figure 2. Photograph showing the motor vessel Tiki XIV. Photograph by Chuck Worley, U. S. Geological Survey. |
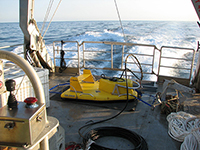 |
Figure 3. Photograph showing the EdgeTech 512i chirp subbottom profiler used to survey Baltimore, Washington, and Norfolk Canyons. Photograph taken during a different survey; courtesy of Jamie Austin, University of Texas Institute for Geophysics |
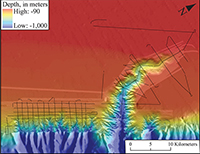 |
Figure 4. Tracklines of seismic-reflection data obtained in Baltimore Canyon superimposed upon depth-colored shaded bathymetry (see fig. 1 for extent). |
 |
Figure 5. Tracklines of seismic-reflection data obtained in Washington Canyon superimposed upon depth-colored shaded bathymetry (see fig. 1 for extent). |
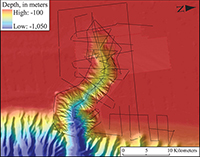 |
Figure 6. Tracklines of seismic-reflection data obtained in Norfolk Canyon superimposed upon depth-colored shaded bathymetry (see fig. 1 for extent). |

