Open-File Report 2014-1245
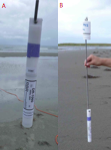
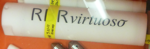
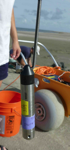
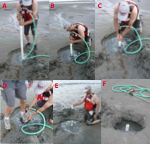
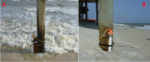
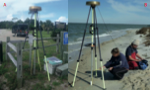
InstrumentationRBR DR1060 Pressure LoggerThe RBR DR1060 (fig. 2) is a small submersible pressure logger capable of recording more than 2 million samples at frequencies up to 1 hertz (Hz). These pressure loggers were temperature compensated and had pressure sensors with a depth rating of 10 meters (m). The manufacturer-specified accuracy was ±0.05 percent of full scale (about 0.005-m water depth) and resolution was 0.001 percent of full scale (about 0.0001-m water depth). Each RBR DR1060 was mounted on a rigid metal rod connected to the cap of a buried well jetted into the beach (described in “Well Installation”). The RBR DR1060s recorded pressure every 5 seconds. At this sample rate, the RBR DR1060s could sample for about 5 months before running out of memory. RBR Virtuoso D|waveThe RBR Virtuoso D|wave (fig. 3) is a small submersible pressure logger capable of sampling continuously or in burst mode at speeds up to 6 Hz and can store 30 million individual readings. This unit was temperature compensated and had a pressure sensor with a depth rating of 10 m. The manufacturer-specified accuracy was ±0.05 percent of full scale (about 0.005 m water depth) and resolution was 0.001 percent of full scale (about 0.0001 m water depth). The RBR Virtuoso D|wave was mounted on a rigid metal rod connected to the cap of a buried well jetted into the beach next to a piling of a residential porch (described in “Well Installation”). The well casing was secured to the porch piling with hose clamps and ratchet straps. The D|wave recorded pressure measurements continuously at 4 Hz from July 21, 2013, until its batteries died on October 24, 2013. Onset Hobo U20 Water-Level LoggerThe Onset Hobo U20 water-level logger (fig. 4) is a small submersible pressure logger capable of recording about 22,000 pressure and temperature samples at rates up to 1 Hz. Two models of Onset Hobo U20s were deployed: model U20–001–04 pressure sensors with ranges of 0 to 15 decibars (about 0–4 m water depth) were used as atmospheric and submersible sensors; and model U20–001–01 pressure sensors with ranges of 0 to 21 decibars (about 0–9 m water depth) were used as submerged sensors. The U20–001–04 sensor has a water-level accuracy of ±0.075 percent of full scale (about 0.003 m water depth) and water-level resolution of 0.001 m water depth. The U20–001–01 used as a submerged sensor has a water-level accuracy of 0.05 percent of full scale (about 0.005-m water depth) and water-level resolution of 0.002 m water depth. The U20–001–04 sensor used as an atmospheric sensor was mounted in a small white PVC tube with vents, and attached with hose clamps to the railing of a residential porch. The sensor was mounted about 4 m above ground level. The submerged Onset Hobo U20s were mounted on rigid metal rods connected to the cap of buried wells jetted into the beach (described in “Well Installation”). Each Onset Hobo U20 collected a pressure measurement every 600 seconds for the duration of the deployment. At this sample rate, the Onset Hobo U20s could sample for about 5 months before running out of memory. Well InstallationThe Onset Hobo and RBR DR1060 pressure sensors buried in the beach were encased in 4.8-centimeter (cm; outside diameter) schedule 80 polyvinyl chloride (PVC) slotted well screen. The RBR Virtuoso D|wave had a larger diameter and was encased in an 8.9-cm (outer diameter) schedule 80 PVC slotted well screen. The well casings were about 1.5 m long and were screened with 0.15-millimeter (mm)-wide slots along most of their length. A PVC well point with a 1.25 cm diameter hole drilled through its center (to allow a water jet to exit) was screwed on to the lower end of each well. Wells were installed by first digging a shallow hole (30 to 50 cm deep) and then using a 2.54-cm (1-inch) gasoline-powered water pump to jet the well into the sand until the top of the well was below the level of the beach (fig. 5). A pressure sensor was hung from a threaded rod attached to a PVC cap that screwed into the top of the well after jetting. The distance from the well cap to the pressure sensor is provided in table 1 and approximates the pressure-sensor depth below the sediment surface. Wells on the Gulf of Mexico side (mooring numbers 968, 970, and 971) were in an energetic surf zone setting (fig. 6A) and were jetted into the beach next to the pilings of waterfront residences and secured to the pilings with hose clamps and ratchet straps (fig. 6A and B). The elevation of the well cap was established using post-processed static Global Positioning System (GPS) data. A GPS base station was placed on the National Geodetic Survey (NGS) tidal benchmark PID BH1755 at the entrance into Fort Gains on the east end of Dauphin Island, and a GPS rover unit was used to survey the wells. The error between the base and the rover increased exponentially with distance from the base station (Waypoint Consulting Inc., 2005) as reflected by an increase in the root mean squared (RMS) error of the differentially corrected navigation data. All wells were within 12 kilometers of the base station. The GPS base station and the rover were duplicate systems with Ashtech Z-Xtreme GPS receivers, internal data recorders, Thales choke-ring antennae, and tripods (fig. 7A). After the wells were installed, the GPS rover was positioned and referenced to a dimple on the well cap (fig. 7B). Both receivers recorded the 12-channel full-carrier-phase positioning signals (L1/L2) from the satellites and recorded their positions concurrently at 1-second (s) intervals for at least 30 minutes (min). This 30-min GPS static occupation session was repeated when the wells were recovered months later. All GPS static sessions were processed using NovAtel GrafNet version 8.4 software, accounting for antenna height, antenna model, and GPS session type (rover or base). The NGS-published latitude, longitude, and ellipsoid height referenced to the North American Datum 1983 (NAD83) were transformed into World Geodetic System 1984 (WGS84; G1150) using the NGS Horizontal Time-Dependent Positioning (HTDP) version 3.2.3 utility for postprocessing purposes (table 2). The processed position heights were referenced to the top of the well cap and converted to NAD83 (CORS96) using the NGS HTDP utility. These processed heights were then processed through the NGS GEOID96 model to obtain geoid heights. The elevation of the pressure sensor was then determined by subtracting the distance from the well cap to the pressure sensor (table 1) from the cap elevation. The uncertainty of the elevation of the water-level sensor was estimated by using the square root of the sum of the squared individual error terms. The individual error terms included difference in surveyed well cap heights as measured upon deployment and recovery, the estimated error in the length of the threaded rods the sensors were suspended from, and the standard deviation of the GPS elevation measurements for a particular well. In addition, for wells on the Gulf of Mexico side of Dauphin Island that were strapped to porch pilings, the error in the measured distance from the well cap to a surveyed mark on the porch was included. The estimated uncertainty in the water-level sensor elevations ranged from 0.008 to 0.036 m (table 1).
|
|

![]() U.S. Department of the Interior |
U.S. Geological Survey
U.S. Department of the Interior |
U.S. Geological Survey
URL: http://pubsdata.usgs.gov/pubs/of/2014/1245/ofr2014-1245-instrumentation.html
Page Contact Information: GS Pubs Web Contact
Page Last Modified: Wednesday, 07-Dec-2016 20:05:47 EST