Skip past header information
USGS - science for a changing world

Open-File Report 2014-1245
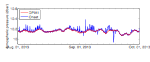
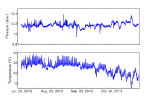
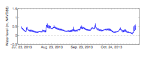
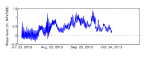
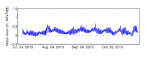
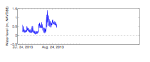
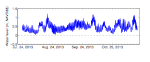
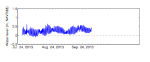
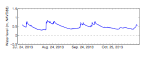
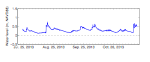
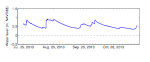
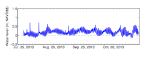

Water-Level Measurements in Dauphin Island, Alabama, From the 2013 Hurricane Season


Skip past contents information

Results

Atmospheric pressure data were collected continuously from July 22 to November 20, 2013, by the sensor mounted at site 965. The data appear to be of good quality but differ at times from data collected by the nearest land-based atmospheric pressure sensors. Specifically, the sensor at 965 shows larger variations in pressure than the sensors at National Oceanic and Atmospheric Administration (NOAA) gauge DPIA1, approximately 7 kilometers (km) east of site 965 (fig. 9). These pressure excursions may be real (for example, due to short-term pressure fluctuations caused by frontal passages) or they may be artifacts of sensor exposure to sun and wind. Figure 10 is a time-series plot of atmospheric pressure and temperature from site 965.

Pressure sensors encased in wells buried in the beach were deployed from July 2013 through November 2013 (table 1). All data from the wells were of very high quality with no evidence of error due to fouling or attenuation from burial. One sensor (at site 967) could not be located and was never recovered, so there are no data for that site. Three sensors stopped sampling early due to battery failure. The RBR D|wave sensor at site 968 stopped operating on October 24, the RBR DR1060 sensor at site 970 stopped operating on August 28, and the RBR DR1060 sensor at site 972 stopped operating on October 3.

Water levels were derived from the well pressure sensors by subtracting atmospheric pressure linearly interpolated (in time) from measurements taken every 60 minutes at NOAA gauge DPIA1. The corrected pressure data were converted from decibars to water depth using an assumed seawater density of 1022.3 kilograms per cubic meter (calculated from salinity of 34 practical salinity units and temperature of 26 degrees Celsius, a typical salinity and approximately the mean temperature) and adjusted to a common datum (North American Vertical Datum of 1988 [NAVD88]) using the surveyed cap elevation and the measured distance from the cap to the pressure sensor (table 1). Time series plots of water-level data from the buried wells are shown in figures 11 through 20. In the water-level plots, the reported water level is NAVD88 orthometric height referenced to the NGS GEOID96 datum.

Data from all instruments were converted to standard format for USGS time series (Montgomery and others, 2009) and stored in network common data format (netCDF) files. NetCDF files store data and associated metadata in a format that is compact and machine-independent. Documentation of the USGS Oceanographic Time-Series Measurement Database can be found in Open-File Report 2007–1194 (http://woodshole.er.usgs.gov/pubs/of2007-1194/). Details of instrumentation used for measurement of water levels, atmospheric pressure, and temperature are provided in table 3.


Click on figure for larger image.

Thumbnail image for Figure 9,  Atmospheric pressure time series from National Oceanic and Atmospheric Administration station DPIA1 and USGS measurements from an Onset Hobo U20 pressure sensor at site 965 on Dauphin Island, Alabama, in 2013.

Figure 9. Atmospheric pressure time series from National Oceanic and Atmospheric Administration station DPIA1 and USGS measurements from an Onset Hobo U20 pressure sensor at site 965 on Dauphin Island, Alabama, in 2013. Although the study covered from July 22 through November 20, 2013, this graph only shows August 1 through October 1, 2013, to highlight the difference between the two sensors. dbar, decibars.

Thumbnail image for Figure 10, Atmospheric pressure and temperature time series from an Onset Hobo U20 atmospheric pressure sensor mounted on a residential porch railing at site 965 on Dauphin Island, Alabama, in 2013.

Figure 10. Atmospheric pressure and temperature time series from an Onset Hobo U20 atmospheric pressure sensor mounted on a residential porch railing at site 965 on Dauphin Island, Alabama, in 2013. dbar, decibars; °C, degrees Celsius.

Thumbnail image for Figure 11, Water level time series

Figure 11. Water-level time series from an RBR DR1060 pressure logger mounted in a buried well at site 966 on Dauphin Island, Alabama, in 2013. m, meters; NAVD88, North American Vertical Datum of 1988.

Thumbnail image for Figure 12,  Water-level time series from an RBR Virtuoso D|wave pressure logger mounted in a buried well at site 968 on Dauphin Island, Alabama, in 2013.

Figure 12. Water-level time series from an RBR Virtuoso D|wave pressure logger mounted in a buried well at site 968 on Dauphin Island, Alabama, in 2013. m, meters; NAVD88, North American Vertical Datum of 1988.

Thumbnail image for Figure 13, Water-level time series from an Onset Hobo U20 pressure logger mounted in a buried well at site 969 on Dauphin Island, Alabama, in 2013. m, meters; NAVD88, North American Vertical Datum of 1988

Figure 13. Water-level time series from an Onset Hobo U20 pressure logger mounted in a buried well at site 969 on Dauphin Island, Alabama, in 2013. m, meters; NAVD88, North American Vertical Datum of 1988.

Thumbnail image for Figure 14, Water-level time series, site 970.

Figure 14. Water-level time series from an RBR DR1060 pressure logger mounted in a buried well at site 970 on Dauphin Island, Alabama, in 2013. m, meters; NAVD88, North American Vertical Datum of 1988.

Thumbnail image for Figure 15, Water-level time series, site 971

Figure 15. Water-level time series from an RBR DR1060 pressure logger mounted in a buried well at site 971 on Dauphin Island, Alabama, in 2013. m, meters; NAVD88, North American Vertical Datum of 1988.

Thumbnail image for Figure 16, Water-level time series, site 972.

Figure 16. Water-level time series from an RBR DR1060 pressure logger mounted in a buried well at site 972 on Dauphin Island, Alabama, in 2013. m, meters; NAVD88, North American Vertical Datum of 1988.

Thumbnail image for Figure 17, Water-level time series, site 973

Figure 17. Water-level time series from an Onset Hobo U20 pressure logger mounted in a buried well at site 973 on Dauphin Island, Alabama, in 2013. m, meters; NAVD88, North American Vertical Datum of 1988.

Thumbnail image for Figure 18, Water-level time series from an Onset Hobo U20 pressure  logger mounted in a buried well at site 974 on Dauphin Island, Alabama, in  2013. m, meters; NAVD88, North American Vertical Datum of 1988.

Figure 18. Water-level time series from an Onset Hobo U20 pressure logger mounted in a buried well at site 974 on Dauphin Island, Alabama, in 2013. m, meters; NAVD88, North American Vertical Datum of 1988.

Thumbnail image for Figure 19, Water-level time series from an Onset Hobo U20 pressure logger mounted in a buried well at site 975 on Dauphin Island, Alabama, in 2013. m, meters; NAVD88, North American Vertical Datum of 1988.

Figure 19. Water-level time series from an Onset Hobo U20 pressure logger mounted in a buried well at site 975 on Dauphin Island, Alabama, in 2013. m, meters; NAVD88, North American Vertical Datum of 1988.

Thumbnail image for Figure 20,  Water-level time series from an Onset Hobo U20 pressure logger mounted in a buried well at site 976 on Dauphin Island, Alabama, in 2013. m, meters; NAVD88, North American Vertical Datum of 1988.

Figure 20. Water-level time series from an Onset Hobo U20 pressure logger mounted in a buried well at site 976 on Dauphin Island, Alabama, in 2013. m, meters; NAVD88, North American Vertical Datum of 1988.


Accessibility FOIA Privacy Policies and Notices

Take Pride in America logo USA.gov logo U.S. Department of the Interior | U.S. Geological Survey
URL: http://pubsdata.usgs.gov/pubs/of/2014/1245/ofr2014-1245-results.html
Page Contact Information: GS Pubs Web Contact
Page Last Modified: Wednesday, 07-Dec-2016 20:05:49 EST