
Field Data Collection
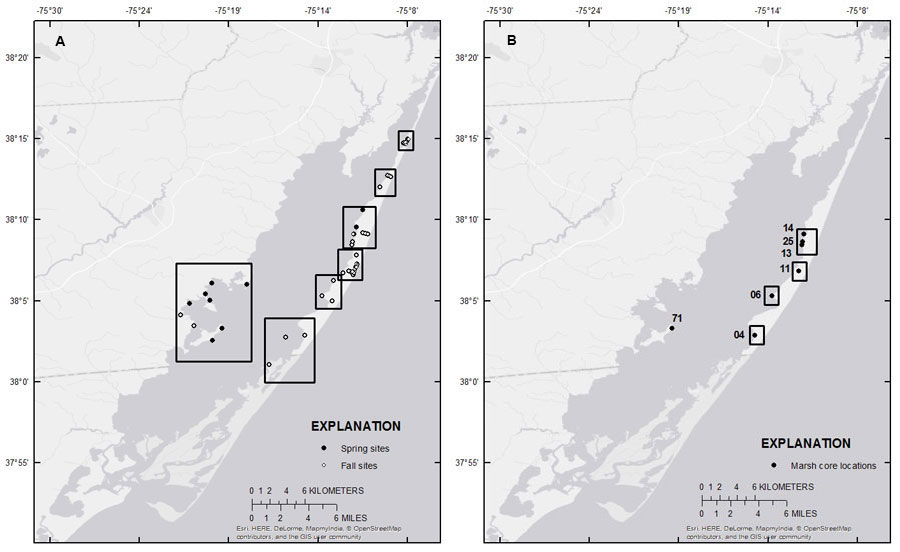
Figure 2. (A) Sediment sampling locations on Assateague Island and vicinity from March-April 2014 (black circles) and October 2014 (white circles). Click in black outlines for enlarged aerial imagery view of sample locations. (B) Location of marsh cores collected in March-April 2014. Click in black outlines for aerial imagery comparison of site location from 1966 to 2013.
Site Selection
Pre- and post-storm aerial imagery were used to identify areas of Assateague Island that were affected and unaffected (control sites) by Hurricane Sandy storm surge, overwash, and estuarine processes (Guy, 2015). Depositional environments targeted were mainland marsh/marsh island wetlands (hereafter referred to simply as mainland marshes), back-barrier marsh wetlands, and sparsely vegetated to bare sand environments that appeared to be the result of overwash (hereafter referred to as washover fans). Data collected included surface sediments (S), marsh cores (M), and peat auger cores (R) collected on two different occasions: March 26–April 4, 2014 (spring, USGS Field Activity Number (FAN): 2014-301-FA) and October 21–30, 2014 (fall, FAN: 2014-322-FA) (fig. 2A, B). Site locations are identified as 14CTB-XXX# where XXX is a consecutive number from 01 to 500 (01–200 for spring; 300–500 for fall) and # represents the type of sample or core collected (S, M, or R). The sites are abbreviated as (X)XX#. During the spring, a total of 43 samples were collected from 37 sites: 23 samples were collected from 19 back-barrier marsh wetlands, 10 samples were collected from 9 mainland marsh wetlands, and 10 samples were collected from 9 back-barrier washover fans. In the fall, 73 samples were collected from 59 sites. Of the original spring sites, 18 back-barrier marsh, 8 washover fan, and 2 mainland sites were revisited to examine temporal variability. The remainder samples were collected from washover fans.
Site Occupation
At each site, an accurate position and elevation were obtained using an Ashtech Z-Xtreme global positioning system (GPS) receiver and geodetic antenna with occupation times varying between 5 and 30 minutes. GPS data were recorded concurrently throughout the survey at multiple National Park Service (NPS) benchmarks using a similar instrument combination. The accuracy of both the GPS position and elevation at each site were increased by post-processing the data to the concurrent base station GPS data (details below). For each site, surface sediment was collected by scraping the upper 1 cm of sediment from the surface of the environment sampled. The sediment was separated into bags and vials for bulk sediment parameter, microfossil, and organic geochemical analyses. During the spring sampling trip, shallow push cores were collected using polycarbonate tubing of 10.2 cm diameter and 75 cm length. Core lengths varied from 32 to 68 cm, and compaction was generally less than 20 percent of the cored length. Cores were stored upright and cold with wet ice until they were sent to the USGS St. Petersburg Coastal and Marine Science Center (SPCMSC) laboratory for analysis. Additional Russian peat augers (R) were used at the push core locations (with the exception of site 11) to collect 50-cm undisturbed half-core samples. Site information and core specifics are included in the data downloads section.
Navigation Post-Processing
Base station data were post-processed through the National Geodetic Survey On-Line Positioning User Service (OPUS), and time-weighted average positions were calculated following SPCMSC standard procedures. The time-weighted average positions were compared with the NPS network control numbers for each base station; the time-weighted elevations for each base station occupation were within 2 standard deviations of the NPS control elevations. The NPS control coordinates were used for subsequent post-processing.
The base station coordinates were imported into GrafNav and GrafNet, version 8.4 (NovAtel Waypoint Product Group), and the data from the rover GPS (the GPS unit used to collect data at each sample site) were post-processed to the concurrent GPS session data at the nearest base station. All S sites (5-minute occupation) were post-processed in GrafNav v. 8.40, and all M sites (30-minute occupation) were post-processed in GrafNet v. 8.40. The final sample locations, including elevation, are the post-processed differential GPS (DGPS) coordinates based on processing to the nearest base station; baseline distances range from about 0.5 to 15 km. These data are provided in the data tables and are based on the post-processed DGPS coordinates.
