
Results and Discussion
| Click on figures to enlarge |
|---|
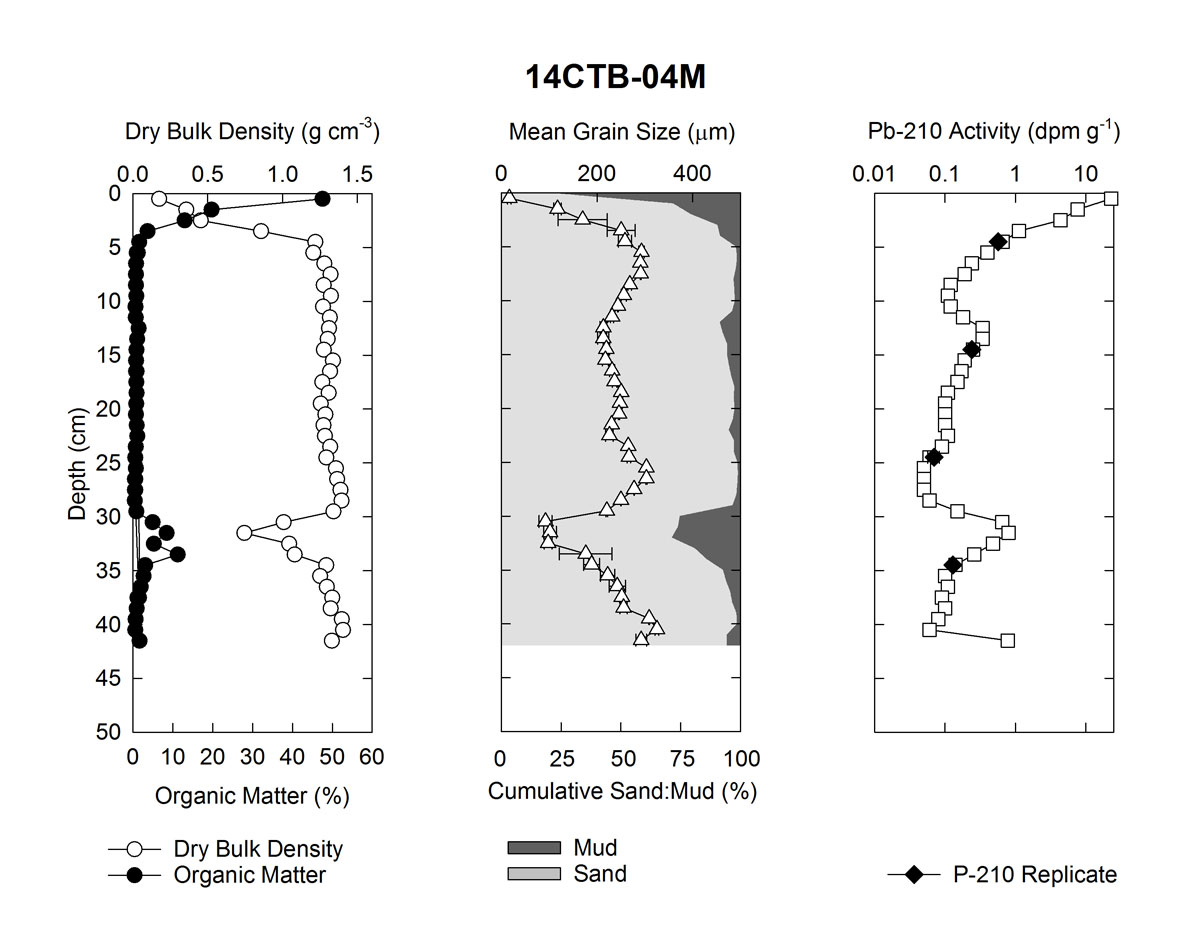 Figure 4. Down-core plots of sediment parameters, sediment texture, and total extracted Pb-210 for core 14CTB-04M. Mean grain size error bars represent one standard deviation of replicate analyses. Pb-210 activity error bars are the analytical counting error. |
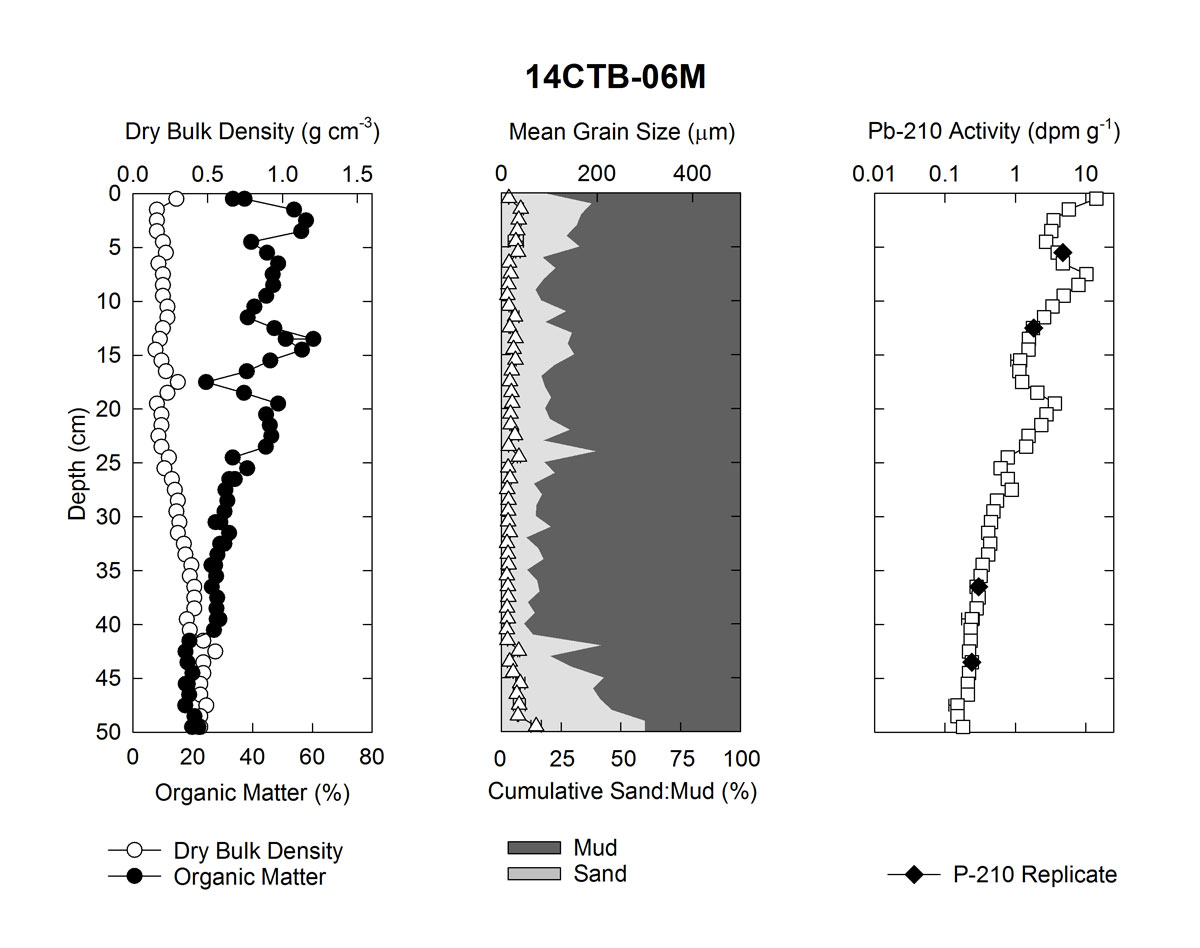 Figure 5. Down-core plots of sediment parameters, sediment texture, and total extracted Pb-210 for core 14CTB-06M. Mean grain size error bars represent one standard deviation of replicate analyses. Pb-210 activity error bars are the analytical counting error. |
 Figure 6. Down-core plots of sediment parameters, sediment texture, and total extracted Pb-210 for core 14CTB-11M. Mean grain size error bars represent one standard deviation of replicate analyses. Pb-210 activity error bars are the analytical counting error. |
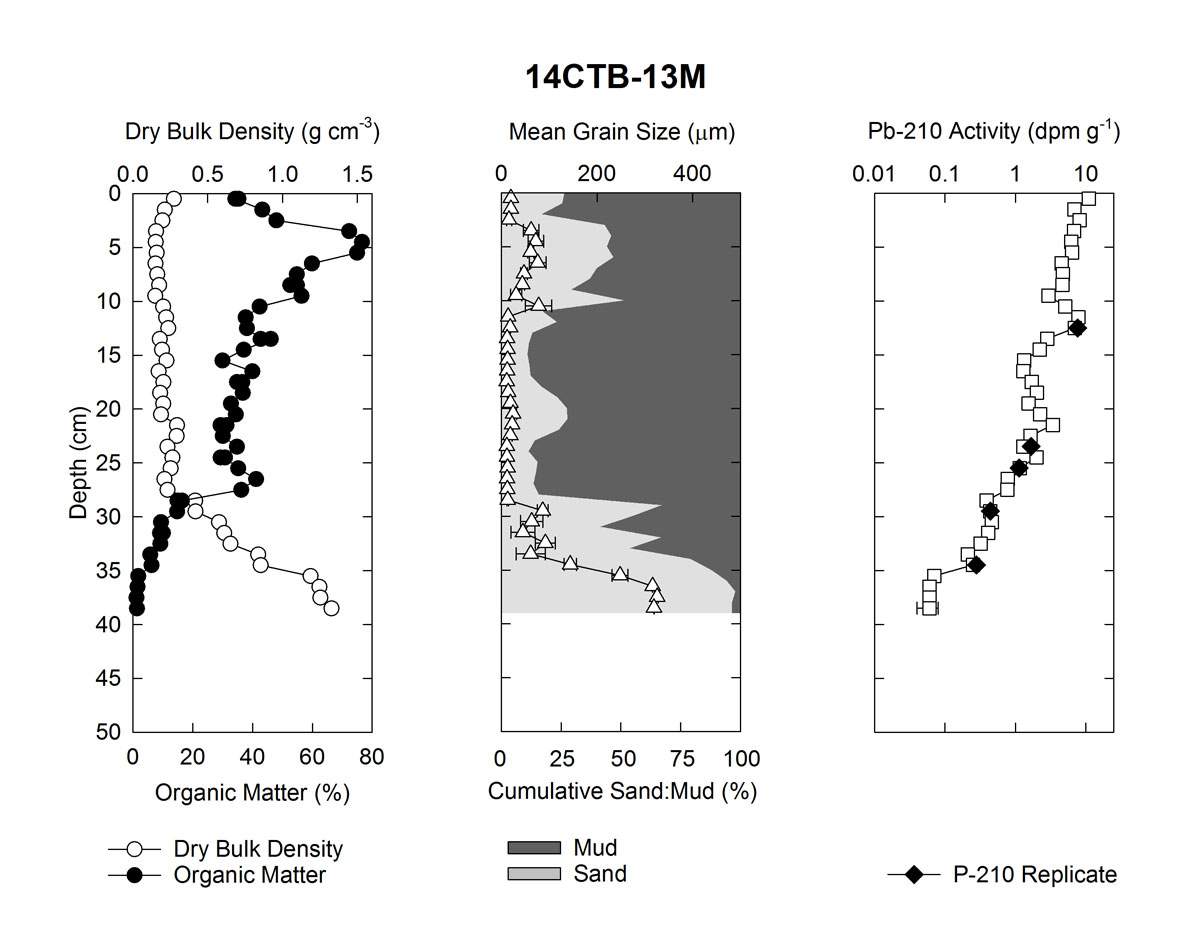 Figure 7. Down-core plots of sediment parameters, sediment texture, and total extracted Pb-210 for core 14CTB-13M. Mean grain size error bars represent one standard deviation of replicate analyses. Pb-210 activity error bars are the analytical counting error. |
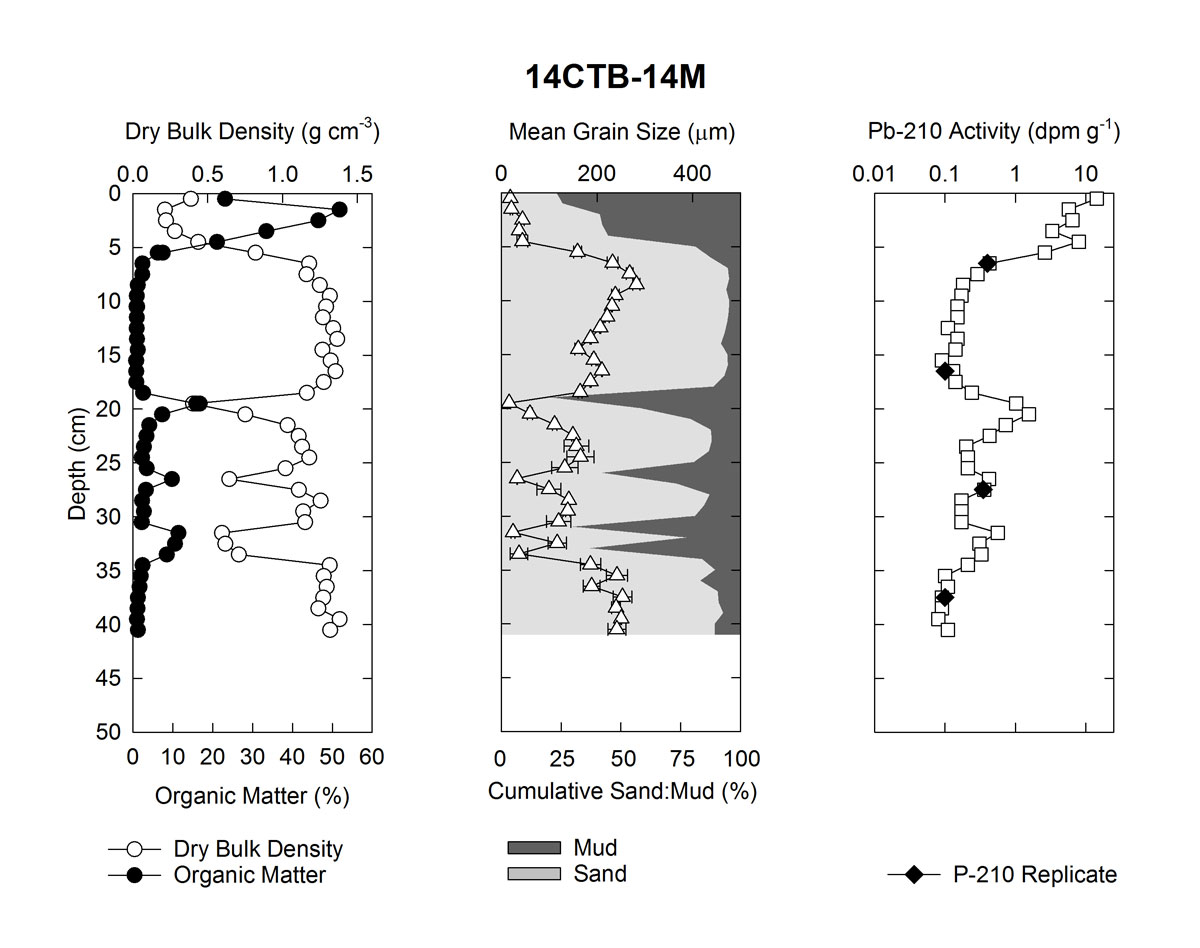 Figure 8. Down-core plots of sediment parameters, sediment texture, and total extracted Pb-210 for core 14CTB-14M. Mean grain size error bars represent one standard deviation of replicate analyses. Pb-210 activity error bars are the analytical counting error. |
_DataPlot_1200.jpg) Figure 9. Down-core plots of sediment parameters, sediment texture, and total extracted Pb-210 for core 14CTB-25M(A). Mean grain size error bars represent one standard deviation of replicate analyses. Pb-210 activity error bars are the analytical counting error. |
_DataPlot_1200.jpg) Figure 10. Down-core plots of sediment parameters, sediment texture, and total extracted Pb-210 for core 14CTB-25M(B). Mean grain size error bars represent one standard deviation of replicate analyses. Pb-210 activity error bars are the analytical counting error. |
 Figure 11. Down-core plots of sediment parameters, sediment texture, and total extracted Pb-210 for core 14CTB-71M. Mean grain size error bars represent one standard deviation of replicate analyses. Pb-210 activity error bars are the analytical counting error. |
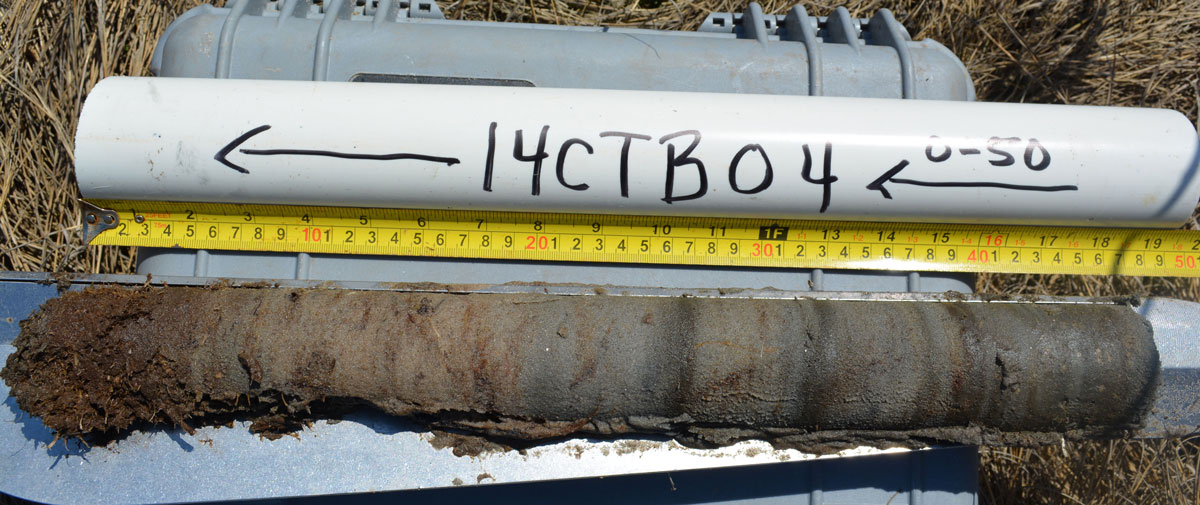 Figure 12. Field photograph of auger core 14CTB-04R. |
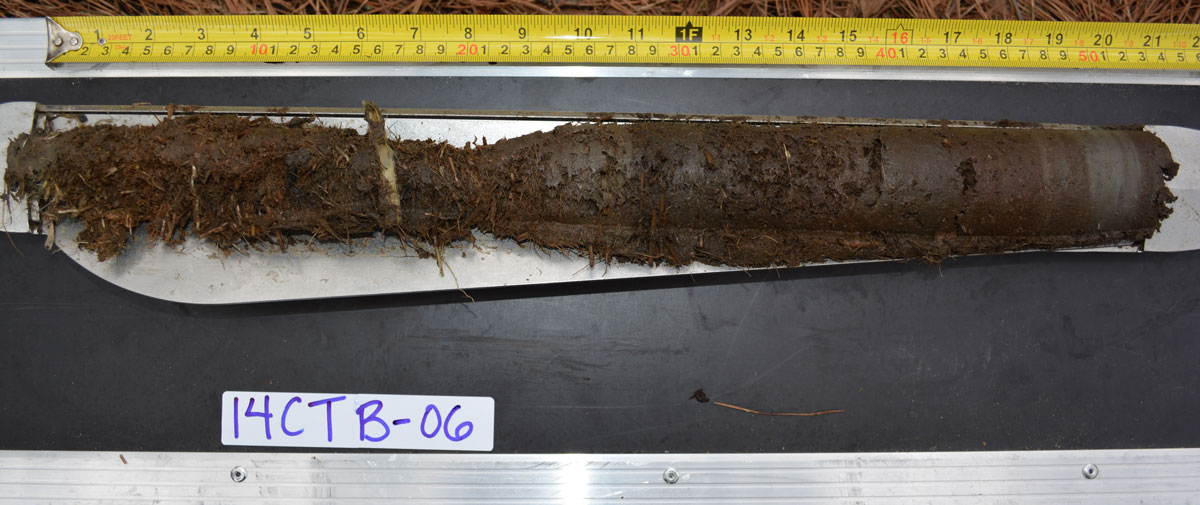 Figure 13. Field photograph of auger core 14CTB-06R. |
 Figure 14. Field photograph of auger core 14CTB-14R. |
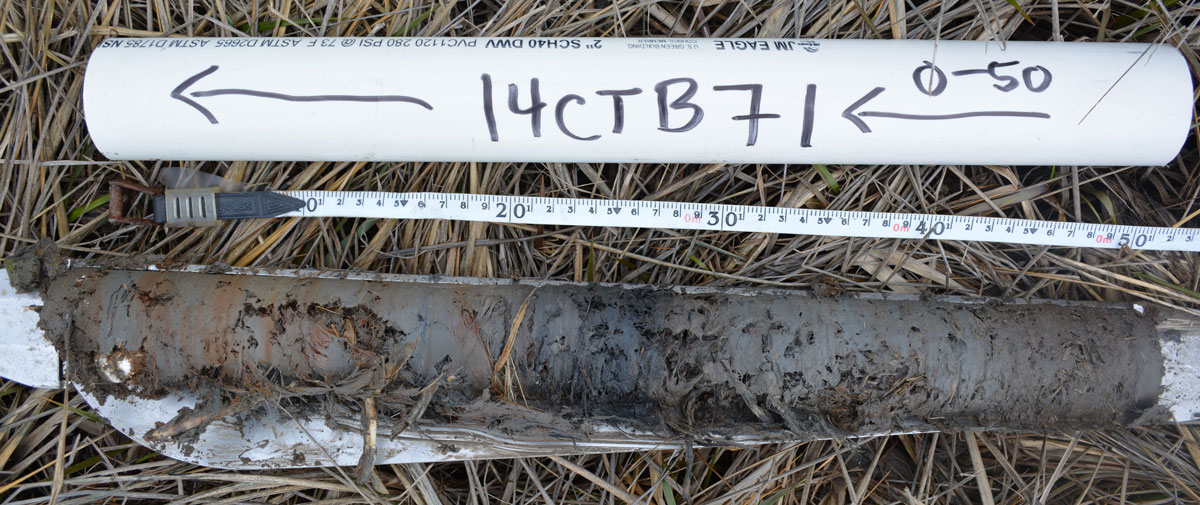 Figure 15. Field photograph of auger core 14CTB-71R. |
Surface sediments
A summary of textural parameters for the spring-2014 and fall-2014 sampling trips are presented in the physical parameters spreadsheet on the data downloads page. Overall, the textural data agree with the depositional environment sampled. Texture for the washover fan sediment is described as moderately well-sorted (1.5 ± 0.1 μm), medium sand (436 ± 51 μm) with little to no quantifiable organic matter (< 1.5 percent). Both the barrier island and mainland marsh wetland sediments are characterized as poorly sorted (4.8 ± 0.9 μm) medium silt (20 ± 10 μm). The marsh wetland samples are all multimodal as indicated by the quantitative sorting value (poorly sorted). There was no notable distinction between the mainland marsh samples and the barrier island marsh samples using sediment texture; however, the organic matter content of the mainland marshes was considerably lower (12 ± 6 percent) relative to the barrier island marshes (38 ± 12 percent). A statistical comparison (two-tail, t-test) of seasonal means for organic matter, mean grain size, and percentage mud abundance for the two groups was not statistically different (p > 0.05). Similarly, means for organic matter, grain size, sorting, and percentage mud for sites sampled during both spring and fall were not statistically different (p > 0.05, two-tailed, paired t-test). Three samples (11S/311S, 15S/315S, and 17S/317S) had a significant change (greater than an order of magnitude) in texture between the two sampling trips. However comparison of organic matter content indicates that the sediment sampled either changed between trips or there was offset of between 1 and 2 m in site locations when the site was reoccupied in the fall that captured another depositional environment.
Marsh stratigraphy
Back-barrier marshes of low-relief barrier islands
Cores from sites 04, 11, and 14 have a relatively thick sand deposit (figs. 4, 6, 8) at the base that grades into a thin (< 5 cm thick) organic-rich deposit. The lower sand unit is variable among the sites. In core 11M, the sediment is massively bedded, very well sorted, medium sand (no photograph available) with no organic matter (fig. 6). Descriptively, the sediment throughout much of core 11M (average mean grain size of 391 μm) is very similar to the washover fan deposits described above. This sand unit does not have any quantifiable Pb-210. In contrast, the sand unit of cores 04M/04R and 14M/14R is interbedded and comprises moderately well-sorted, fine sand and poorly sorted, coarse silt to very fine sand, respectively (figs. 4, 6, 8, 12, 14). The texture, even of the sandy fraction, is different than the washover fans or other surface environments observed in this study. Organic matter ranges from 10 to 20 percent in the fine-grain portions of the unit. Images of the peat augers show that the interbedded units often contain root fragments and plant debris comparable to the surface marsh unit (figs. 12, 14). The activity of Pb-210 also increases in these units. Although the high Pb-210 in the fine-grained beds is a direct result of increased clay/organic matter content, the activities observed (>1 dpm g-1) are quantitative and above the background activities (~0.3 dpm g-1) expected with this method and supported by the decay of radium-226.
The peat has organic matter content that ranges from 25 to 60 percent (by dry weight). Organic matter content in the peat is at the upper limits of the range of the marsh surface sediment examined. Dry bulk density averages 0.3 g cm-3 and fractional porosity averages 0.8. Like the marsh surface samples, sediment texture in the cores is complex with multimodal distribution and generally fine mean grain size (coarse silt and very fine sand). Within the peat unit at all sites, the Pb-210 decreases exponentially with depth from a maximum of 14 dpm g-1 at the surface to < 0.3 dpm g-1 at about 5 cm. However, organic matter and clay also have a decreasing exponential trend, which makes it difficult to determine whether the Pb-210 is tracking radioactive decay or simply a change in the fine-grained carrier (Ravichandran and others, 1995; Sanders and others, 2012).
The shallow stratigraphy (30–50 cm) obtained from sites 04, 11 and 14 suggests a relatively young marsh that continues to emerge from a previously high-energy environment. All three sites are within regions of the barrier island that are topographically low. Prior to the colonization of the marsh, the energy regime of the previous environment was notably different for the various locations on the basis of grain size and the characteristic bedding. At site 11, the massive sand that closely resembles washover sand is likely controlled by marine overwash. At the sites with interbedded sands and organic-containing silts, it is possible that multiple overwash events interrupted the development of the marsh. The origin of the fine sand of the interbedded units differs substantially from recent washover fans. Inspection of aerial imagery aids in the interpretation of the stratigraphy (Guy, 2015). For sites 04 and 14, the island is much wider and only connected to the nearshore during large storms that reactivate breach channels. Transport through these channels would result in a substantially different and more focused depositional product than widespread sheet overwash. Alternatively, the sediment could originate from Chincoteague Bay. Further investigation of Chincoteague Bay sediment may provide evidence that supports the latter hypothesis.
Protected back-barrier marshes
The four cores collected from sites 06, 13, and 25 contain a much thicker, continuous organic-rich (peat) deposit than is found at sites 04, 11, and 14 (fig. 5, 7, 9, 10). The thickness of the peat deposit ranges from 20 to 40 cm for the four cores. Core 06M has the thickest peat deposit at > 40 cm, and core 25M(B) has the thinnest (~20 cm); however, the base of the peat for core 25M(B) was not reached. Organic matter on average was 30 percent for all cores with an overall range within the marsh platform of 20 percent to more than 75 percent, similar to that observed in the surface sediment. Bulk density ranged from 0.15 to 0.35 g cm-3 within the organic-rich deposit with an average of 0.25 g cm-3. Like the previously described organic-rich surface sediments and peats, the detailed grain size data provide an overview of the sediment type. The peats were multimodal and thus very poorly sorted. Mean grain size classified the sediment as fine to medium silt. In cores 25M(A) and 13M, basal sand comparable to that found at the other sites was observed. The sand was relatively unimodal and classified as well-sorted medium sand. The thick peat deposit observed at these sites indicates a more stable marsh environment.
The hypothesis of a more stable back-barrier marsh is supported as all four cores have total Pb-210 profiles that decrease exponentially with depth and appear complete. For cores 25M(A) and 13M, the dependence of Pb-210 distribution with sediment texture was observed where the sediment transitioned from the organic-rich deposit to basal sand. Surface activities range between 5.7 and 11.8 dpm g-1 with a mean and standard deviation of 8.0 ± 2.3 dpm g-1. Several of the profiles have nuances in the down-core distribution that may indicate dilution of Pb-210 accumulation through time (for example, fig. 9). In core 06M at 13–18 cm, the total Pb-210 profile is depleted relative to the lower unit (fig. 5). This depletion correlates well with a large dip in organic matter and increase in bulk density; however, the mean grain size and sand-to-mud ratio hold constant. These data support that marshes at sites 06, 13, and 25 have been accumulating sediment with limited influence from marine overwash; however, inorganic sediment inputs are still suspect and conceivably could reflect estuarine inputs.
Sites 06, 13, and 25 have a more complex geomorphic configuration (that is, multiple topographic highs between the core site and the ocean; fig. 2B) relative to the previously described marsh sites. There is strong evidence that the inorganic sediment is not of marine or fore-barrier origin. Grain size is notably finer than any of the sandy subaerial environments sampled. Also, these cores have notable decreases in organic matter but a relatively constant sediment texture. Background inorganic sediment supplied to these marshes originates from Chincoteague Bay; therefore, the similar texture observed in low organic matter zones suggests a simple increase in the overall abundance of this inorganic material. Thus, evidence points to estuarine overwash as an important vector of inorganic sediment to relatively protected back-barrier marshes.Mainland marsh and marsh island
A single core was collected from the marsh island adjacent to the mainland (site 71; core 71M; fig. 11 and 15). Sediment at the marsh island site is notably finer-grained than that at the back-barrier marsh sites. In comparison with the cohort marsh surface sediment data, the core contained relatively low organic matter on average (12 ± 6 percent) with a relatively narrow range of 4–25 percent. The mean grain size was 12.0 ± 5.0 μm (fine silt) and very little sand was observed. Unlike the barrier island cores that showed a fining upward pattern, the marsh island demonstrated a coarsening upward pattern. The coarsest sediment was observed at the sediment surface with an increase in sand content of nearly 40 percent.
The total Pb-210 profile from core 71M is not exponential in nature (fig. 11). In the top 10–15 cm of the core, the profile is nearly inverted and has higher activity at depth than at the surface. This corresponds with the section of the core that shows coarsening upward. Such transition in the sediment texture and the inversion of Pb-210 details the dynamic nature of this system. The decrease in organic matter and increase in bulk density suggest that inorganic sediment delivery to the marsh may have increased through time. This would explain the down-core variability in the Pb-210 profile.
The marsh island site reiterates the importance of estuarine overwash as a process and a response to storm/hurricane forcing as well as potentially fair-weather conditions. The relatively low organic matter content throughout the marsh island core relative to the back-barrier marshes suggests frequent inorganic sediment delivery to the system. Because it is unlikely that hurricanes occur frequently enough to deliver inorganic sediment (that is, a four- to sixfold dilution of organic matter relative to the barrier marshes), it is feasible that fair-weather processes were the main source of the sediment deposition (fig. 15). Evaluating the relative contribution of these two processes is critical for assessing the vulnerability of these marsh types. Unfortunately, the dataset presented provides only preliminary evidence that fair-weather processes are influential, and additional work is needed to separate the non-storm versus storm-derived inorganic sediment delivery to these marsh types.
Impact of Hurricane Sandy
The impact of Hurricane Sandy along the back-barrier marshes and mainland/marsh island around Chincoteague Bay was spatially heterogeneous due to oceanographic, topographic, and geologic variability of the coastal system. These variations controlled the depositional patterns related to the connection to oceanic and estuarine processes influenced by the storm. For areas within meters to tens-of-meters of the core sites, remote sensing data verify limited cross-barrier overwash (Guy 2015). Deposition at these sites is undetectable using a variety of remote sensing resolutions. At multiple sites (06, 13, 14, 25 and 71), however, a thin, sediment layer (low organic matter) is observed in the upper few centimeters that may reflect multiple events (thickest at site 06). The layer has less organic matter and higher bulk density than sediment deeper in the peat; however, mean grain size and the sand-to-mud ratio are relatively unchanged. Thus, despite limited remote sensing evidence of storm impacts to the back-barrier marsh surfaces, there is notable deposition that occurred recently; however, the specific timing of the deposition is not well constrained.
While the slow movement of Hurricane Sandy up the mid-Atlantic coast allowed substantial local water-level increases in the ocean and estuary due to storm processes at sites throughout the region, the system passed to the north of Assateague Island in Maryland and Virginia. The passage of the system to the east and north of the study area suggests that much of the area saw substantial wind reversals from a northerly wind as it remained offshore and then westerly wind as it came ashore in New Jersey. Depositional patterns recorded in the sediment are, in some cases, ambiguously related to the Hurricane Sandy event, such as a potential overlap with Hurricane Irene 2011 deposition. Marine overwash due to elevated water levels in the ocean generally transports sediment from offshore shoals and bars, foredunes, or both. This process is evident, at least historically, in areas where the barrier island has remained topographically low (for example, sites 04, 11, and 14). All of the recent, surficial overwash deposits sampled during this study are quantitatively similar, characterized by medium sand with minimal clay-size particles. In contrast, the event sediment preserved in the upper layer of cores 06M and 13M as well as the marsh island core, 71M, is much finer-grained than these relict washover deposits. It is feasible that given the decrease in organic matter and increase in bulk density, the fine-grain texture, and the lack of sand deposition on the marshes as indicated by remote sensing, the sediment originated as estuarine overwash (that is, sediment re-suspended and advected from the estuary, tidal flats, or marsh edge and onto the marsh during storm conditions). Smith and others (2013) found similar characteristics in marshes on the periphery of Mobile Bay, Alabama. This process of storm-generated estuarine deposition is abundant in the literature (for example, Delaune and others, 1986; Nyman and others, 1995; Turner and others, 2006; Törnqvist and others, 2007; Smith, 2012). Ongoing work examining sediment characteristics (including grain size, A.M. Ellis, U.S. Geological Survey, written commun., August 3, 2015), microfossils (foraminifera), and biogeochemical signatures (metals, stable isotopes, or biomarkers) both within the bay and preserved in the cores may help refine the provenance of these sediments. These data suggest that estuarine overwash could be an important factor for use in assessing and predicting the effects of hurricanes on these marsh types.
