

Green Infrastructure in the Great Lakes—Assessment of Performance, Barriers, and Unintended Consequences
Links
- Document: Report (104 MB pdf) , HTML , XML
- Tables:
- NGMDB Index Page: National Geologic Map Database Index Page (html)
- Download citation as: RIS | Dublin Core
Acknowledgments
The authors would like to thank Danielle Green of the U.S. Environmental Protection Agency and William Shuster at Wayne State University (formerly U.S. Environmental Protection Agency Office of Research and Development) for supporting this research effort. The authors also would like to thank Nic Buer, Kathy Stenehjem, Caitlin Wienkes, Rob Darner, Stephanie Beeler, Chris Hoard, Cyndi Rachol, Charles Hart, Angela Brennan, Brett Hayhurst, Dave Owens, Don Bonville, Mike Antidormi, Dave Lampe, Paul Buszka, Ryan Adams, Amy Story, and Caleb Artz of the U.S. Geological Survey for contributing to the green infrastructure pilot studies in Fond du Lac, Wisconsin, Detroit, Michigan, Buffalo, New York, and Gary, Indiana. Without the cooperation and effort of these individuals and agencies this study would not have been possible. Funding was provided by the Great Lakes Restoration Initiative.
Abstract
The Great Lakes Basin covers around 536,393 square kilometers, and the Great Lakes hold more than 5,400 cubic miles of water, accounting for more than 20 percent of the world’s fresh surface water supply. The Great Lakes provide a source of drinking water to tens of millions of people in Canada and the United States and support one of the most diverse ecosystems in the world. Increasing urbanization combined with aging infrastructure and more extreme storm events because of changing weather patterns creates stormwater management challenges for communities across the Great Lakes region. A variety of green infrastructure (GI) practices, designed to decrease runoff and improve water quality, have been implemented throughout the region in response to these challenges; however, implementation often remains limited to local efforts and with little coordination among various levels of government because of, at least in part, a lack of clear standards for stormwater, limited funding, and a general uncertainty in the type and expected performance of these practices. City planners, engineers, and political leaders often see GI investment as riskier than other alternatives despite studies that determined, in most cases, practices can either reduce or not affect costs.
This report summarizes selected published reports and data sources from studies done in Great Lakes states and compares the measured effects of various GI practices and their applicability in different settings around the Great Lakes. By summarizing selected published reports and data sources from studies done in Great Lakes states, this report provides foundational information for U.S. Geological Survey scientists and their local and national partners to assess the ability of GI to reduce stormwater runoff in Great Lakes urban areas. GI includes a variety of stormwater management techniques designed to mimic natural hydrologic processes like infiltration and evapotranspiration, which can decrease the volume of water running into sewers and streams. It can also improve water quality by trapping sediment, nutrients, and other contaminants. A variety of landscape practices can be incorporated into urban areas as GI, but the discussion here is limited to vegetated basins, vegetated channels, permeable pavement, urban tree canopy, and green roofs. Other types of GI, such as downspout disconnection, rainwater harvesting, and wet and dry detention basins were not included because hydrologic function and associated components are not widely monitored or evaluated in literature.
Introduction
The Great Lakes contain more than 20 percent of the world’s fresh surface water supply, providing a source of drinking water to tens of millions of people in Canada and the United States (U.S. Environmental Protection Agency, 2021a) In addition, the Lakes support one of the most diverse ecosystems in the world and are a valuable ecological and economic resource for both countries. The number of people living in the Great Lakes Basin has increased by about 20 percent since the 1970s, resulting in substantial changes to land use (U.S. Environmental Protection Agency and Environment and Climate Change Canada, 2020). Pressure from increasing populations, warming temperatures, changing precipitation patterns, decreasing lake ice coverage, and greater fluctuations of water levels combine to further stress the environment and water quality (U.S. Environmental Protection Agency and Environment and Climate Change Canada, 2020).
Increased urbanization combined with aging infrastructure present challenges for stormwater management in communities across the Great Lakes Basin. As communities continue to develop, natural landscapes are replaced with impervious surfaces causing excess stormwater runoff, localized flooding and changes in streamflow. Increased surficial flow can carry suspended solids, phosphorus, road salt, and other contaminants to sewers and waterways (Great Lakes Commission, 2018). According to the U.S. Environmental Protection Agency (EPA), contaminated urban stormwater runoff impairs water quality in approximately 5,000 miles of estuaries, 1.4 million acres of lakes, and 30,000 miles of rivers in the United States. An assessment of 53,332 of 60,500 the total U.S. square miles of Great Lakes open waters was done by the surrounding states. The findings were that all but 62 square miles were reported as impaired for one or more designated use. The leading causes of impairment were polychlorinated biphenyls, dioxins, and mercury, with the leading probable sources including atmospheric deposition, legacy/historical pollution, and urban-related runoff/stormwater (U.S. Environmental Protection Agency, 2017a).
Traditional stormwater infrastructure carries water from developed areas through pipes and drainageways to either treatment facilities or directly into receiving waters; however, these systems are often overwhelmed during large precipitation events, and they fail to adequately protect communities from flooding and water-quality effects. Stormwater discharged to waterways may be high in suspended solids, nutrients, trash, and other pollutants, and pollutant concentrations may be amplified in areas where sanitary and storm-sewer systems are combined during high-flow events (Great Lakes Commission, 2018). Higher flows also can cause erosion in urban streams, which damages habitat, property, and infrastructure (U.S. Environmental Protection Agency, 2021b). In contrast, precipitation that falls in natural, undeveloped areas is absorbed and filtered by soil and plants, and thus runoff from these areas to nearby streams is cleaner and of lower volume.
Green infrastructure (GI) includes a variety of stormwater management techniques designed to mimic natural hydrologic processes like infiltration and evapotranspiration to help decrease the volume of water entering sewers and streams and improve water quality by trapping sediment and nutrients (Great Lakes Commission, 2018). Examples of GI include vegetated basins such as rain gardens and bioretention ponds, vegetated swales, permeable pavement, green roofs, and low-impact development. Increasing urban tree canopy and preserving existing natural wetlands or forests are also considered GI. By capturing and treating stormwater at or near its source, GI may be a key strategy in helping communities meet watershed goals; however, GI use across the Great Lakes Basin remains limited (Great Lakes Commission, 2018).
Purpose and Scope
This report summarizes selected published reports and data sources from studies done in Great Lakes states and compares the measured effects of various GI practices and their applicability in different settings around the Great Lakes (see app. 1, table 1.1 for a list of reports and data sources used to compile this report). Since 2010, the Great Lakes Restoration Initiative (GLRI; https://www.glri.us/projects) has sponsored several projects intended to reduce nonpoint source pollution effects on nearshore water health; however, high-quality data on the operational and performance characteristics of GI and other stormwater control measures are needed to assess their overall performance. GI practices continue to evolve as scientific research provides new information on optimizing selection, design, placement, and maintenance for desired outcomes; few studies document the performance of GI practices in multiple locations. By summarizing selected published reports and data sources from studies done in Great Lakes states, this report provides foundational information for U.S. Geological Survey (USGS) scientists and their local and national partners to assess the ability of GI to reduce stormwater runoff in Great Lakes urban areas. In addition, this report summarizes the factors affecting performance of GI practices, potential unintended consequences to human health and the environment associated with GI practices, and knowledge gaps and research needs for future GI studies.
Although a variety of landscape practices can be incorporated into urban areas as GI, the discussion here is limited to vegetated basins, vegetated channels, permeable pavement, urban tree canopy, and green roofs. Other types of GI, such as downspout disconnection, rainwater harvesting, and wet and dry detention basins are not included because hydrologic function and associated components are not widely monitored or evaluated in literature.
This report covers the area including all the states that border one or more of the Great Lakes (fig. 1). Although the Great Lakes Basin drains only a part of states adjacent to the lakes, all the adjacent states share similar environmental issues and demographic settings typical in the Midwest and likely exhibit similar responses when GI is implemented in these areas.
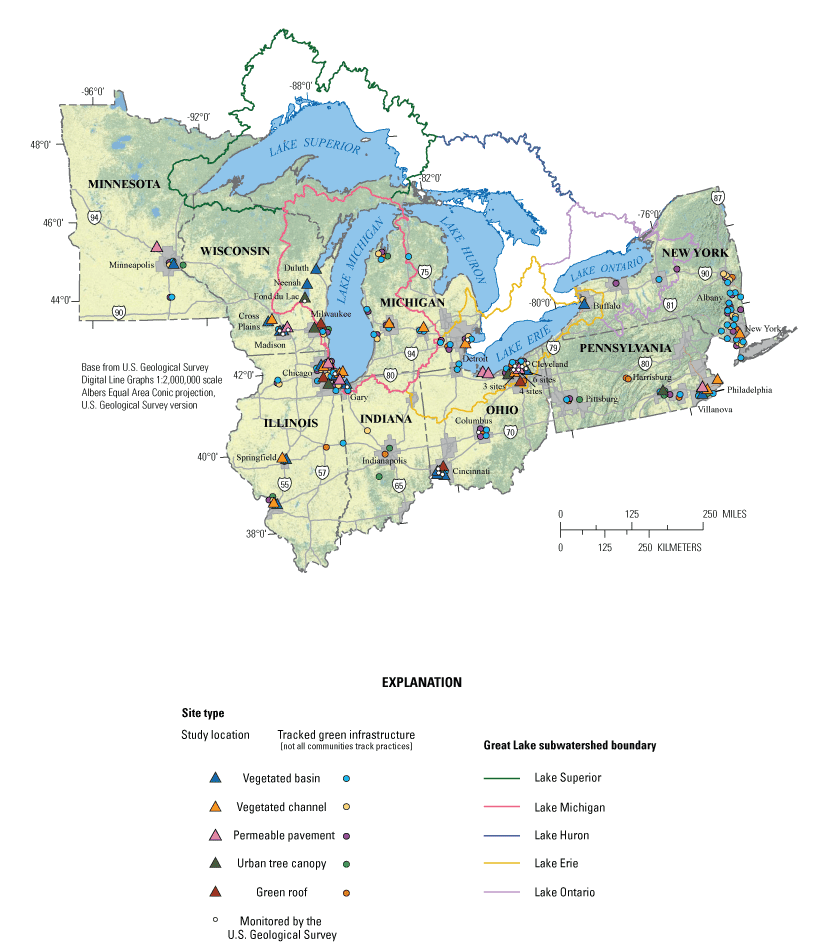
The extent of the Great Lakes area of interest.
Great Lakes Region
The Great Lakes Basin covers around 536,393 square kilometers (km2), with 291,080 km2 in the United States (Robertson and others, 2019). The population within the drainage basin is more than 30 million people, around 10 percent of the United States population and more than 30 percent of the Canadian population (U.S. Environmental Protection Agency, 2020a). Because of the large size of the basin, physical characteristics such as climate, soils, and topography vary across the region; however, most of the large urban areas are in the southern parts of the basin where it is wetter and warmer. Native unaltered soils vary widely throughout the Great Lakes region with highly permeable, well-drained sandy soils in much of Wisconsin and Michigan to very poorly drained high clay soils in Ohio and Indiana (fig. 2). The densely populated urban areas contain large expanses of developed and impervious areas contributing to several stormwater-management challenges.
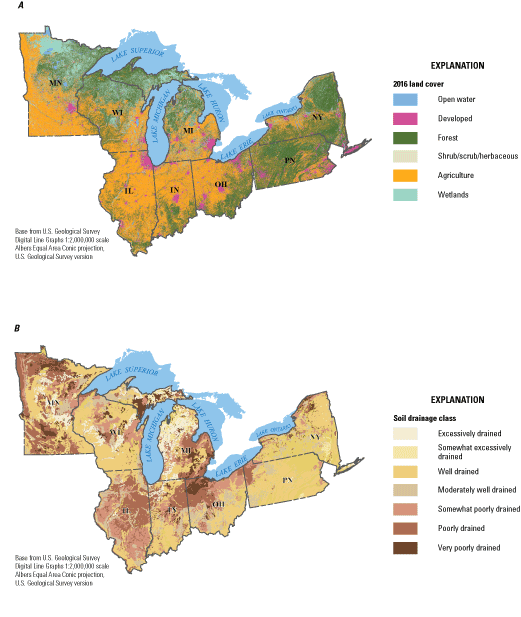
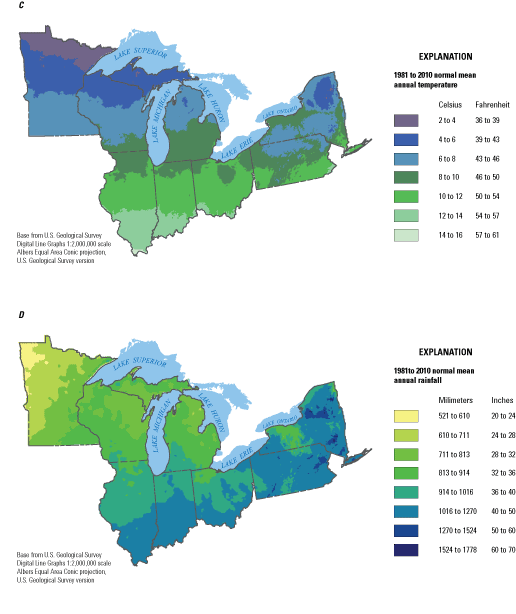
Land cover and physiographic characteristics of the Great Lakes region: A, 2016 land cover (Multi-Resolution Land Characteristics Consortium, 2020), B, soil drainage class (U.S. Department of Agriculture, 2019), C, 30-year normal annual mean temperature for the period 1981–2010 (PRISM Climate Group, 2020), and, D, 30-year normal annual precipitation for the period 1981–2010 (PRISM Climate Group, 2020).
The Problem with Urban Stormwater in the Great Lakes Region
Urban stormwater is rainfall or snowmelt that is not infiltrated into the subsurface, but rather flows off impervious surfaces such as roads, roofs, and parking lots (fig. 3) into stormwater conveyance systems that drain to a receiving water body like the Great Lakes. Stormwater runoff from urban areas is one of the largest contributors of flooding and point and nonpoint source pollution in the Great Lakes Basin (Great Lakes Law, 2010; Hand, 2010).
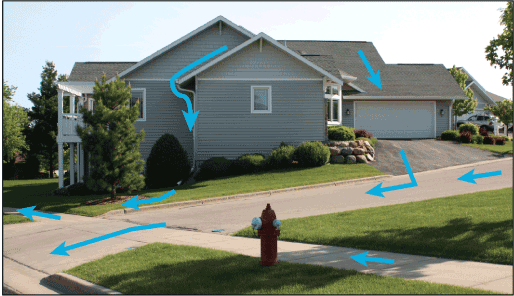
Flow routes of precipitation runoff from impervious surfaces. The blue lines represent the path stormwater would take as it flows off residential impervious surfaces (roofs, driveways, sidewalks, and roads). (Source: Courtesy of U.S. Geological Survey.)
Disruption of the Hydrologic Cycle
The overall effect of urban infrastructure is that the natural water cycle is disrupted, with large areas of impermeable surfaces that short circuit paths of runoff, infiltration, and evapotranspiration (fig. 4). During heavy rainfall, excess stormwater runoff can cause localized flooding and changes in streamflow. Urban flooding is prevalent in many Great Lakes cities, and although not unique to this region, communities near the Lakes may be at a greater risk of flooding, than in the past, because of climate change. The communities in the region are typically older with inadequate infrastructure and are not designed to minimize the effects on the receiving waters of the Lakes. A study of Cook County, Illinois, identified 177,000 property damage insurance claims during a 5-year period from 2007 to 2011 (Center For Neighborhood Technology, 2014). This is the equivalent of one in six properties in the county making a claim with total claims amounting to $660 million during the 5 years examined. Figure 5 shows where properties are at risk from flooding in the Great Lakes region and the predicted percent increase in the number of properties at risk in 30 years. Many areas adjacent to the lakes, like the greater Chicago, Ill., and Gary, Indiana areas, are particularly vulnerable, in part because of large expanses of impervious surfaces in these densely populated areas combined with predicted intensification of storms as a result of climate change (First Street Foundation, 2020; figs. 5 and 6).
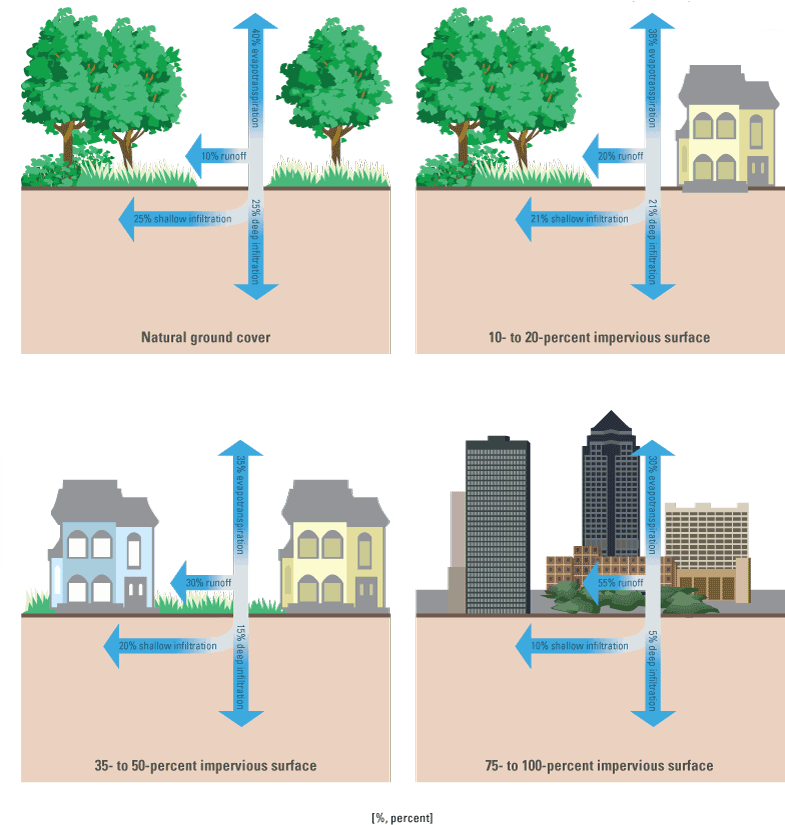
Runoff variability with increased impervious surfaces. Green infrastructure installations reduce runoff, increase evapotranspiration, and increase infiltration to shallow and deep groundwater transforming the landscape to mimic more natural conditions. (Source: Diagram modified from Federal Interagency Stream Restoration Working Group, 1998.)
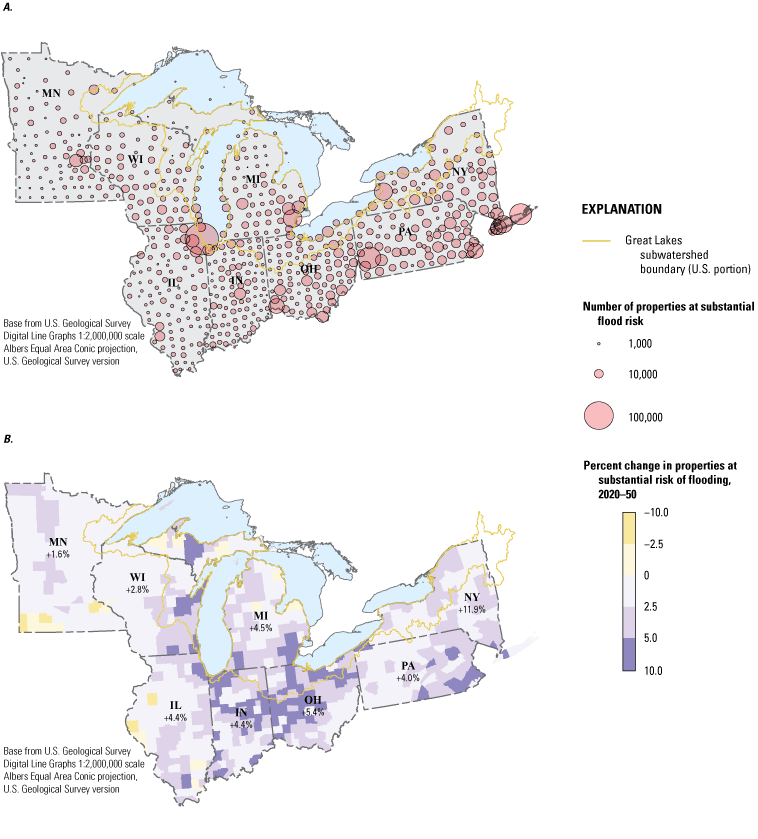
A, properties at substantial flood risk, and, B, predicted percent change in properties at substantial flood risk from 2020 to 2050 in the Great Lakes region. Substantial risk is calculated as inundation of 1 centimeter or more to the building in the 100-year return period (1 percent annual risk). (Source: First Street Foundation, 2020.)
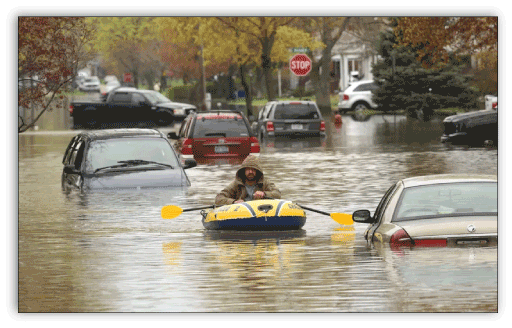
Flooding along a Detroit-area street in 2019. (Source: The Detroit News; Ramirez and others, 2019.)
Human and Ecological Beneficial Use Impairment
Despite their large area, the Great Lakes are sensitive to the effects of a wide range of pollutants including debris, oils, greases, and other substances that wash off from streets. Because outflows from the Lakes are relatively small (less than 1 percent per year) in comparison with the volume of water contained in them, contaminant discharges are retained in the system and become more concentrated with time (U.S. Environmental Protection Agency, 1995). Residence time varies widely from lake to lake, with the longest being Lake Superior at almost 200 years and the shortest, which varies depending on water levels, being in Lakes Erie and Ontario which is generally less than 20 years (Quinn, 1992).
Stormwater can transport a wide variety of contaminants such as metals, road salt, nutrients, bacteria, and organic compounds. In urban drainage basins, excess stormwater can also increase sedimentation, increase water temperature, reduce dissolved oxygen, degrade aquatic habitat structure, contribute to loss of fish and other aquatic populations, and decrease water quality in receiving waters (U.S. Environmental Protection Agency, 2016a). Most of the of 31 Great Lakes International Joint Commission designated Areas of Concern (AOCs) flow through densely populated areas (26 in the United States and 5 shared with Canada; fig. 7). In most of these AOCs, urban runoff contributed to the degradation of the ecosystems that led to their designation as AOC (U.S. Environmental Protection Agency, 2020).
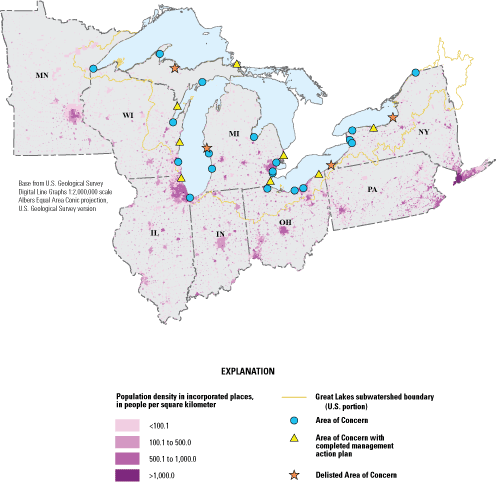
Population distribution and location of Areas of Concern in the Great Lakes region. (Source: U.S. Environmental Protection Agency, 2019.)
Runoff from impervious areas contributes accumulated plastics (like bottles, bags, synthetic clothing, and diapers) that are washed off streets into stormwater drains. In a study where water samples were collected from 29 tributaries to the Great Lakes, litter-related plastics (fragments, foams, and films) were found at higher concentrations in stream samples from drainage basins having a higher percentage of urban land use (Baldwin and others, 2016). Plastic litter is not only more prevalent in urban drainage basins than in areas with other land covers, but it also is more mobile because impervious surfaces and storm sewers facilitate conveyance of plastics to receiving water bodies during runoff-event conditions (figs. 8 and 9).
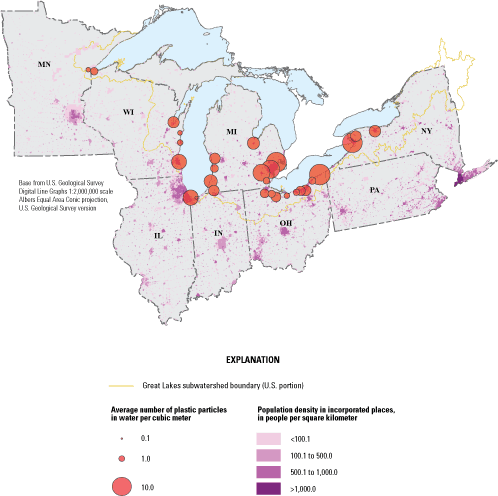
Average number of plastic particles found in water samples collected from 29 Great Lakes tributaries. (Source: Baldwin and others, 2016.)
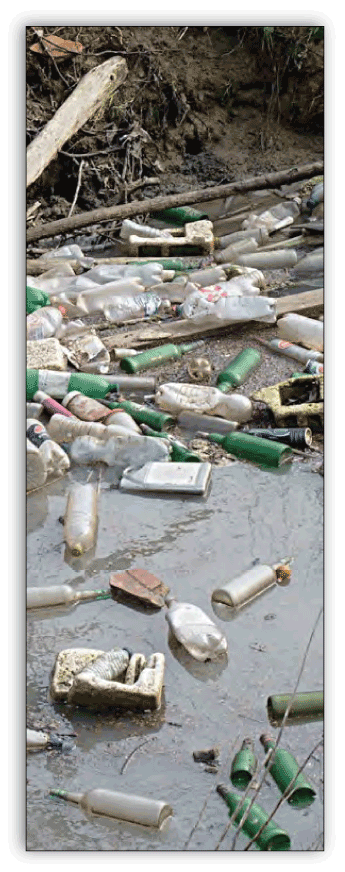
Plastic debris in stream. (Source: Capital Region Water, 2017.)
Chloride concentrations in streams in the northern United States have increased substantially, with average concentrations approximately doubling from 1990 to 2011, outpacing the rate of urbanization (Corsi and others, 2015). Deicing of roads and walkways in the seasonally cold Great Lakes “rust belt” region contributes to higher chloride (salts) in water and adds challenges specific to GI design. The effect of chloride on aquatic life increases with time; more than a quarter of stream sites studied by Corsi and others (2015) exceeded the concentration for the EPA chronic water-quality criteria of 230 milligrams per liter (mg/L) by an average of more than 100 individual days per year during 2006–11. Salts tend to mobilize certain metals in water and may transform metals to more bioavailable species (Schuler and Relyea, 2018). Lakes are particularly susceptible to long-term salinization because of their longer water residence time and their large drainage basins, which combine many salt sources (Dugan and others, 2020). For most midwestern lakes, especially those in urban areas or along highways, chloride concentrations were predicted to be greater than 20 mg/L with concentrations exceeding 230 mg/L for many of the lakes studied. Figure 10 shows the relative risk of chloride contamination to lakes in the region.
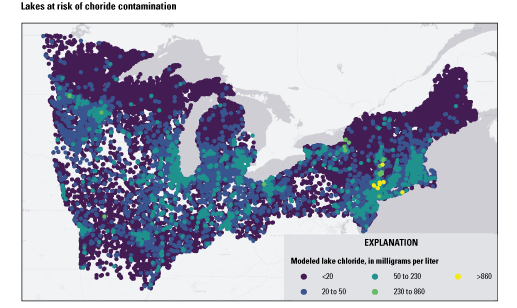
Modeled relative risk of anthropogenic chloride contamination in lakes. (Source: Dugan and others, 2020.)
How Does Green Infrastructure Help Mitigate Combined Sewer Overflows?
The Great Lakes receive nutrients from many tributaries draining areas ranging from pristine forests to intensively farmed areas and large urban centers (Robertson and Saad, 2011). Nutrients in runoff can cause excessive plant and algae growth in nearshore areas leading to degradation of water quality. Urban areas contribute nutrients to all the Great Lakes in numerous ways, including runoff from urban land and inputs from wastewater treatment facilities. Much of the nutrient loading from wastewater treatment happens in communities with combined sewer systems which are designed to collect and transmit wastewater and stormwater to publicly owned treatment works through a single network of pipes. Nearly 57 percent of phosphorus loading to Lake Ontario is from urban sources with wastewater treatment contributing about 41 percent and urban runoff about 16 percent (Robertson and others, 2019). Wastewater treatment also contributes a large proportion of nutrients to Lakes Michigan and Erie (fig. 11). Large precipitation events can cause combined sewer overflows (CSO) when the total volume of stormwater and wastewater entering the combined system exceeds the capacity of the wastewater treatment system, and as a result raw untreated sewage is released directly to waterbodies (U.S. Environmental Protection Agency, 2016a). CSO events can be detrimental to human health and the environment because they introduce pathogens, bacteria and other pollutants to receiving waters, causing beach closures, contaminating drinking water supplies, and impairing water quality (U.S. Environmental Protection Agency, 2016a). Fish and other aquatic populations also can be affected by the depleted oxygen concentrations that CSOs can cause (U.S. Environmental Protection Agency, 2016a).
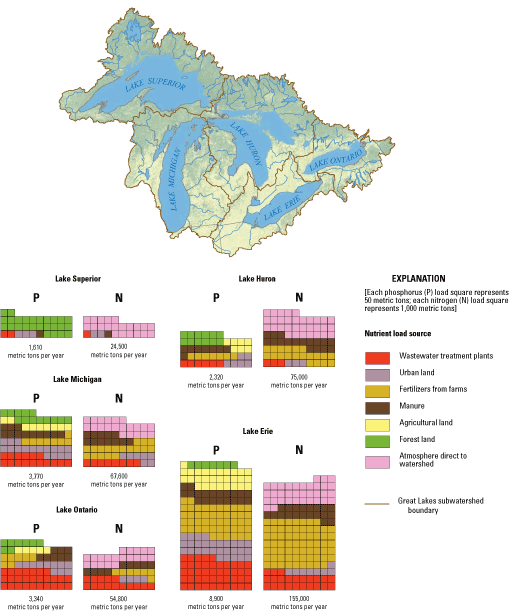
Annual estimated lake loading of phosphorus (P) and nitrogen (N), in metric tons, to each of the Great Lakes. (Source: table 5 from Robertson and others, 2019.)
There are 184 combined sewer systems in the Great Lakes Basin; in 2014 there were 1,482 events discharging an estimated 22 billion gallons of untreated wastewater into the Lakes (figs. 12 and 13; U.S. Environmental Protection Agency, 2016a). The greatest number of communities that discharge directly into the lake or into tributaries are in the Lake Erie (93) and Lake Michigan (72) Basins (fig. 12).
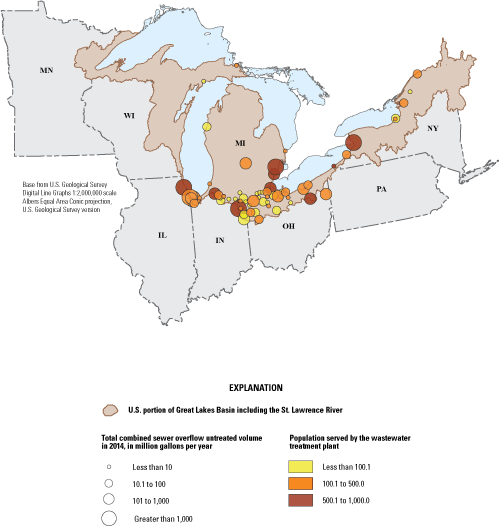
Location of municipalities in the U.S. parts of the Great Lakes Basin (including the St. Lawrence River) with combined sewer overflow systems. (Source: U.S. Environmental Protection Agency, 2016a.)
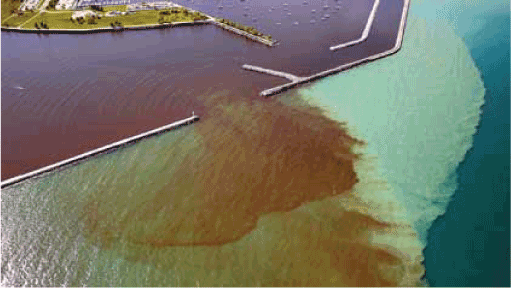
Combined sewer overflow event. (Source: Lyandres and Welch, 2012.)
Stormwater management is an increasing challenge for communities throughout the Great Lakes Basin. In areas where CSO systems exist, GI can slow down the rapid transfer of runoff from impervious surfaces that can quickly overwhelm the combined sewer network and lead to CSOs. The slowing down of runoff transfer is done primarily through retention and storage of water in soils; the water gradually infiltrates into shallow aquifers or transfer to the combined system through controlled release via subsurface drainage or underdrains. Therefore, GI can reduce the threat of excessive flows to combined sewers, and it can also improve water quality by trapping sediment and nutrients (Great Lakes Commission, 2018).
What are the Barriers to Adoption of Green Infrastructure?
The use of GI across the region often remains limited to local efforts and with little coordination among various levels of government despite promising GI solutions to stormwater management challenges (Great Lakes Commission, 2018). This is at least in part because of a lack of clear standards for stormwater, low funding, and a general uncertainty in the type and expected performance of GI infrastructure best suited for a given situation. Coordination among all levels of government along with clear management guidelines can reduce the barriers for municipalities to adopt GI and better manage stormwater regionally resulting in improved water quality in the Great Lakes.
Because stormwater challenges including funding and innovation are often local in nature, they are heavily dependent on Federal, State, and provincial policy (Great Lakes Commission, 2018). City planners, engineers, and political leaders often see investment in GI as riskier than other alternatives despite studies by both EPA and the American Society of Landscape Architects that found that, in most cases, GI either reduced or did not affect costs (Sinha and others, 2017). Policies that encourage or require municipalities to transition away from traditional “pipes and ponds” are lacking. The result is that for many communities the uncertainty of using new techniques often overshadows the benefits of GI (Chaffin and others, 2016).
Maintenance and long-term performance are often perceived to be the biggest barrier to GI implementation among stormwater management professionals (Basu and others, 2020). Installation and maintenance costs are also a major concern to municipalities. The next major barrier is political, including a lack of acceptance among local leaders, municipal staff, and practitioners, followed by conflicting codes and ordinances. Resistance from the regulatory community is considered the fourth largest barrier, and although not as large of a concern as the first three barriers to many municipalities, it remains a concern in some areas.
Green Infrastructure Practices
A variety of landscape practices can be incorporated into urban areas to capture runoff, infiltrate runoff, and provide opportunities for water-quality improvement (fig. 14). Although there are other nonstructural stormwater management practices, such as street sweeping, this paper focuses on landscape manipulations and physical structures that are installed on the urban landscape and which include hydrologic components that are widely monitored and evaluated. Each of the various types (table 1) are described in the following sections, beginning with vegetated basins.
Table 1.
Selected types of green infrastructure and their primary functions.[*, included for information purposes only and not discussed in this report]
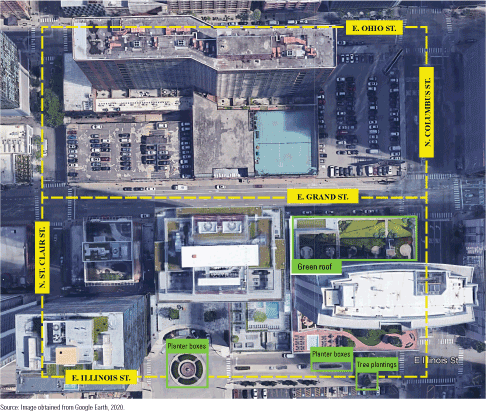
An example of two city blocks in Chicago, Illinois: one with mostly impervious area and no green infrastructure practices (the north block, between E Ohio Street and E Grand Street), and the other with green infrastructure covering about 18 percent of the surface area (the south block, between E Grand Street and E Illinois Street).
Vegetated Basins: Rain Gardens, Bioretention Ponds, and Planter Boxes
Rain gardens, bioretention ponds or cells, and planter boxes (collectively referred to as vegetated basins) are shallow depressions built to receive runoff generated from nearby impervious surfaces by providing a temporary holding basin while runoff infiltrates into the ground (U.S. Environmental Protection Agency, 2021c; fig. 15). Vegetated basins can range in size from small front yard gardens to large, vegetated ponds. Planter boxes are essentially rain gardens with vertical walls with either open or closed bottoms and are ideal for space-limited sites in dense urban areas and function also as a streetscaping element.
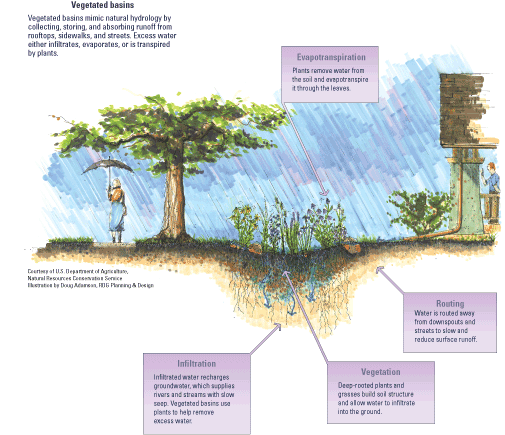
A vegetated basin and its interactions with the environment.
Vegetated basins mimic natural hydrology by collecting and absorbing runoff from rooftops, sidewalks, and streets and allowing excess water to either infiltrate, evaporate, or evapotranspire (U.S. Environmental Protection Agency, 2021c). Vegetated basins help manage storm water more sustainably by creating a hydrologically functional landscape that reduces flooding and improves water quality. Key components of vegetated basins include a substrate that allows infiltration and healthy growth of deep-rooted plants. Rain gardens are generally smaller than bioretention ponds, with both often requiring soil amendments to allow adequate percolation to the subsurface (U.S. Environmental Protection Agency, 2021c). Rain gardens typically manage water that falls on residential urban lots whereas bioretention ponds treat larger expanses of impervious surfaces like parking lots or streets. Bioretention ponds may have a gravel base that extends below the frost line with an embedded tile drain so that water can be released slowly along the tile as it moves down gradient to natural soils approximating natural hydrologic processes (U.S. Environmental Protection Agency, 2021c). In cases where the tile outlet drains to a storm sewer, the bioretention pond may behave hydrologically like a bioswale.
Vegetated basins are a very popular stormwater management practice because of relatively low cost and ease of installation. Many communities support the installation of rain gardens by hosting workshops and seminars or by having grant programs, making them more attainable to the general public. There are numerous rain garden and bioretention installations in the Great Lakes region, and several studies that have done extensive monitoring of soil moisture, and frequency of inflow, outflow, and overflow volume (fig. 16). Sidebar 1 highlights a USGS investigation that evaluates the hydrologic response to the installation of a rain garden in a parking lot that was previously continuous impervious cover.
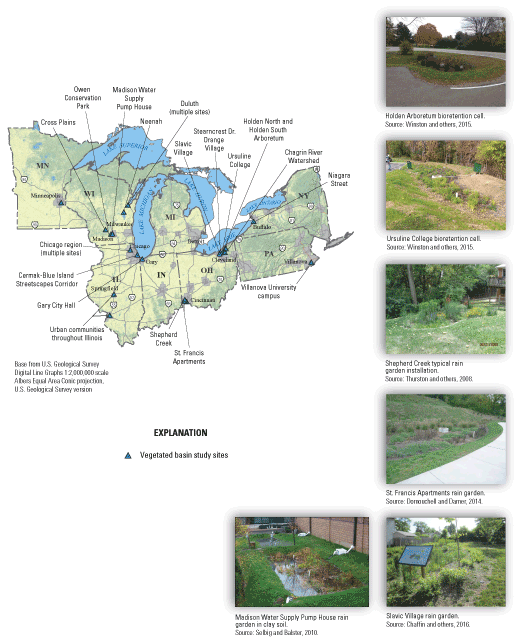
Locations of selected vegetated basin studies in the Great Lakes region with photos of some typical installations (see app. 1, table 1.1 for an overview of sites shown on this map). (Sources: Asleson and others, 2009; Chaffin and others, 2016; Darner and Dumouchelle, 2011; Dumouchelle and Darner, 2014; Illinois Sustainable Technology Center, 2012; Jaffe and others, 2010; Kumar and others, 2017; Roy and others, 2014; Selbig and Balster, 2010; Selbig and Bannerman, 2008; Traver, 2002; U.S. Geological Survey, 2021a, 2021b; Winston and others, 2015, 2016.)
Construction methods and native site characteristics play important roles in vegetated basin performance. Construction methods vary from a simple depression to a highly engineered basin with filtration substrates. Plants in vegetated basins may range from a monoculture of low vegetation like grass to a diverse variety of trees, shrubs, grasses, and ground covers. Generally, the more deep-rooted plants in the installation, the greater the benefit (U.S. Department of Agriculture, undated). Soil conditions vary widely across the region and often vary substantially within a single basin; therefore, soil analysis alone may not be a reliable way to predict the performance of the installation.
Sidebar 1. Rain Garden, Gary, Indiana City Hall
The city of Gary, Indiana, is on the southern-most shore of Lake Michigan and is representative of the Great Lakes’ coastal sandy soils and subsurface deposits that are conducive to infiltration. During 2016–17, the city of Gary redeveloped a parking lot south of city hall using Green Infrastructure (GI), a project supported by the Great Lakes Restoration Initiative. The redevelopment included the removal of impervious cover, installation of structures to redirect runoff from the storm-sewer system to a central rain garden, and the addition of peripheral grassed areas (fig. S1.1; U.S. Geological Survey, 2021a).
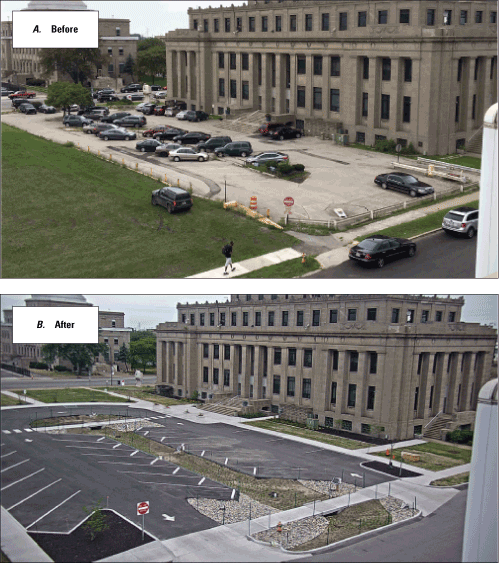
City Hall, Gary, Indiana, before and after installation of central rain garden and peripheral grassed areas.
The U.S. Geological Survey, in collaboration with the city of Gary and the Great Lakes Restoration Initiative, evaluated pre and postconstruction hydrologic conditions as a measure of the effectiveness of GI. Nearly continuous measurements were collected from 2016 to 2021 and included sewer flow, groundwater levels, soil moisture, runoff, and meteorological conditions (fig. S1.2). The hydrologic data were used to assess the water budget before and after installation of GI. Results from stormwater routing models will be compared with measured data and evaluated for their ability to accurately simulate the hydrologic variables. The results will also be applied to the design process of other GI sites. In addition, during 2019–21, chloride concentrations were measured in water to estimate the quantity of deicer that was captured in the GI facilities.
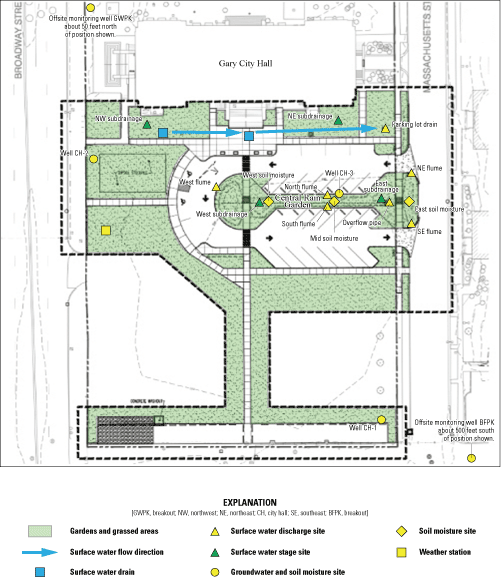
City Hall, Gary, Indiana, monitoring locations in the central rain garden and peripheral grassed areas.
Converting a part of the asphalt parking lot to a rain garden and monitoring runoff for three separate monitoring periods (May 11–September 7, 2016, June 15–November 6, 2017, and April 25–November 6, 2018) resulted in an 80.3 percent reduction in stormwater volume entering the nearby storm drain. The primary hydrologic processes responsible for such a dramatic reduction in volume were attributed to evapotranspiration, groundwater recharge, evaporation from paved surfaces, and temporary storage of water in the subsurface that was eventually removed from the system by groundwater recharge and evapotranspiration.
Sidebar 2. Assessing the Effectiveness of Green Infrastructure in the Niagara River Greenway (Buffalo, New York)
In Buffalo, New York, the U.S. Geological Survey (USGS) is partnering with the city of Buffalo and the Niagara River Greenway Project to assess the volume reduction of stormwater runoff and limit the risk of combined sewer overflows in the Niagara River Area of Concern after installation of green infrastructure (GI) practices. An area of 16 city blocks along Niagara Street is undergoing redevelopment to reconnect residential land use to the waterfront and implement a safer corridor for pedestrians and bicyclists (fig. S2.1). Instead of traditional development, GI replaced aging infrastructure and impervious surfaces in this 50-acre area. GI practices such as sand filters, planter boxes, and rain gardens installed in the Niagara Street redevelopment area have the potential to reduce the volume of stormwater runoff by 16 million gallons per year (fig. S2.2; U.S. Geological Survey, 2021b).
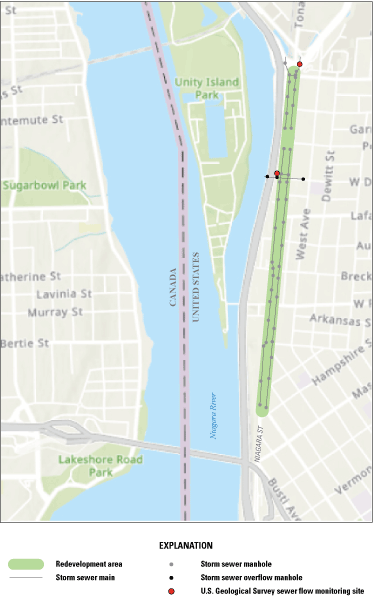
Locations of monitoring stations along the Niagara Street redevelopment area in Buffalo, New York.
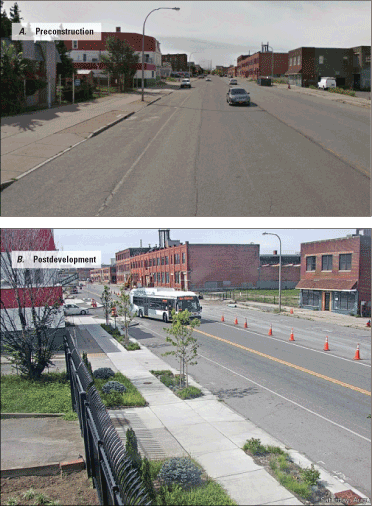
Preconstruction and postredevelopment segment of Niagara Street. (Courtesy of U.S. Geological Survey).
The city of Buffalo began to install GI stormwater control measures in 2018, and the work was complete in June 2021. The GI practices installed to reduce stormflow to the local storm sewers and the Niagara River include sand filters, stormwater planters, and rain gardens. The goal is to reduce stormwater runoff and chloride (during winter and spring melt). Storm sewer outlet monitoring provides an estimate of stormwater volume reduction at a much larger scale than is typical for GI projects.
The USGS began monitoring stormflow along the corridor in 2016 and is monitoring flow and specific conductance into and out of one set of four rain gardens and one sand filter, and at the outlet of the storm-sewer system at Delavan Avenue. Water-quality samples are also being collected at the inflow and outflow of each practice to compare with conductance measurements; the goal of these measurements is to establish a relation between chloride concentration and specific conductance at each site so that chloride concentration can be estimated at a 15-minute time step. Water-quality sampling is done primarily using automated samplers within the monitoring section and at Delavan Avenue. In addition, soil moisture and groundwater levels are being monitored within the rain garden site.
The primary objective of the study is to quantify changes in storm-sewer flows resulting from the installation of GI practices. Secondary goals are to improve the understanding of rainfall, runoff, and infiltration relations in an urban area; correlate meteorological variables such as precipitation depth and intensity, hydrologic fluxes, and antecedent moisture conditions to pre- and post-construction stormwater discharge and volume; and compare stormwater volume reductions predicted by the EPA stormwater calculator (U.S. Environmental Protection Agency, 2017b) to actual reductions measured at the Delvan Avenue storm sewer. In addition to natural storm flows, beginning in the fall of 2020 and continuing into 2021, a series of rainfall experiments were done to measure the effectiveness of the GI practices on attenuating flow and chloride concentrations under controlled conditions. This work was a collaborative effort with the State University of New York University at Buffalo and includes the Niagara Street site as one of five locations around the city to compare infiltration rates among variously aged rain gardens around the city.
In addition to natural storm flows, a series of rainfall experiments are being done to measure the effectiveness of the GI practices on attenuating flow and chloride concentrations under controlled conditions. This work is a collaborative effort with the State University of New York University at Buffalo. Preliminary data suggest that the rain gardens are attenuating a considerable amount of storm flow. Information from State University of New York University Buffalo research suggests that incorporating pebbles into rain garden soils may increase infiltration capacity for many years after installation and shallower rain gardens with shallower rooting depths will likely maximize evapotranspiration within the gardens (Milleville, 2021).
Vegetated Channels: Bioswales and Grassed Swales
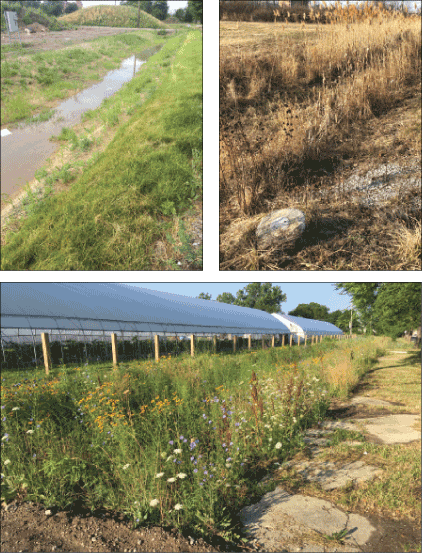
Vegetated channels including bioswales and grassed swales are designed to slow water flow so that some of the water has time to either infiltrate, evaporate, or transpirate as it is routed from one location to another (fig. 17). They are generally linear channels or swales that are vegetated or mulched. In contrast to vegetated basins that are designed to retain all runoff at a site, vegetated channels are often used to route runoff water from sidewalks, streets, or parking lots to storm sewers or natural channels.
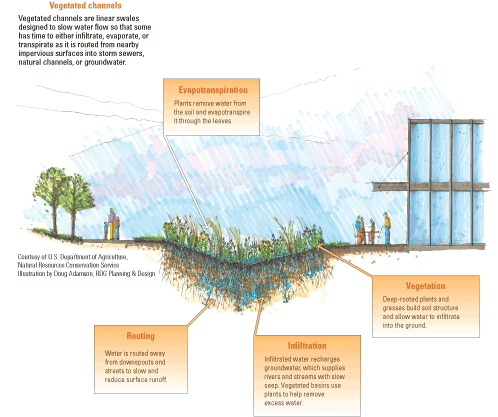
Bioswale and interactions with the environment.
Vegetated channels can be effective at infiltrating stormwater from a large impervious surface; channel performance is dependent on the permeability of underlying soils. Grassed swales are simple vegetated channels constructed over minimally engineered substrate, whereas bioswales are engineered with specific soil media mixtures and underdrains. Both types of swales are often used in conjunction with other structures such as detention ponds (Illinois Sustainable Technology Center, 2012).
Vegetated channels are sloped to move water through the system in an efficient manner, can range from a few feet to hundreds of feet long, can be wet or dry, and the surface can be covered with grass or other types of vegetation. Bioswales are sometimes covered with rocks instead of vegetation and are particularly useful along streets or in parking lots where runoff can be redirected from the curbside (U.S. Environmental Protection Agency, 2021c). Plants and soils help treat stormwater runoff to reduce flow and contaminants to storm sewers and may improve water quality in downstream creeks and streams. They can absorb low flows or carry runoff from heavy rains to storm sewer inlets or directly to surface waters. Vegetated channels can improve water quality by infiltrating the first flush of storm water runoff and filtering the large storm flows they convey (U.S. Environmental Protection Agency, 2010). In the Great Lakes region, vegetated channels are a common sight along roadways and parking lots (fig. 18).
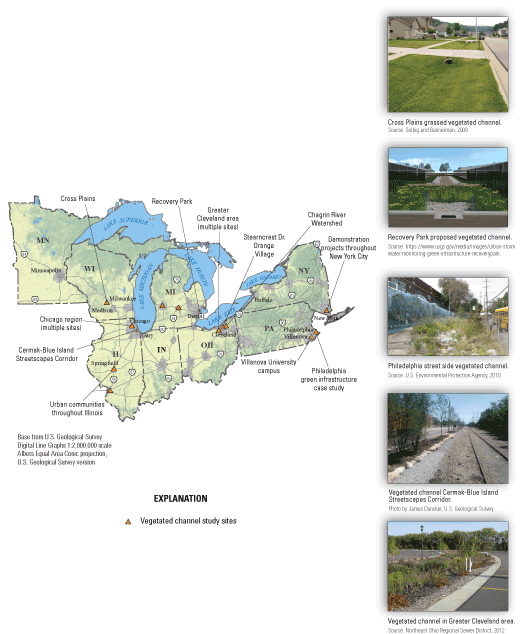
Locations of selected vegetated channel studies in the Great Lakes region with photos of some typical installations (see app. 1, table 1.1 for an overview of sites shown on this map). (Sources: Chaffin and others, 2016; Darner and Dumouchelle, 2011; Darner and others, 2015; Illinois Sustainable Technology Center, 2012; Jaffe and others, 2010; New York City Environmental Protection, 2012; New York City Environmental Protection, 2012; Northeast Ohio Regional Sewer District, 2012; Selbig and Bannerman, 2008; Traver, 2002; U.S. Environmental Protection Agency, 2010; U.S. Geological Survey, 2021c.)
Sidebar 3. Using Abandoned Urban Land for Stormwater Management, RecoveryPark, Detroit, Michigan
The effectiveness of green infrastructure (GI; including urban land conversion and bioswales) stormwater runoff reduction is being assessed at RecoveryPark, a redeveloped urban farm in Detroit, Michigan (U.S. Geological Survey, 2021c). Pre and postconstruction storm-sewer flow, groundwater levels, precipitation, and potential evapotranspiration are being monitored.
Throughout the metropolitan Detroit area, swaths of abandoned urban land have been identified as potential locations for the installation of GI to reduce or delay peak flows of stormwater runoff. One of these locations, RecoveryPark, is a 40-acre area about 2.5 miles northeast of downtown Detroit (fig. S3.1). Before this study, the city-owned land that comprises RecoveryPark was vacant, but the nonprofit RecoveryPark entered into a 5-year agreement with the city to purchase the land and convert it into an urban farm staffed by people with barriers to employment. Sustainable resource management, including stormwater management, is one of the goals for the successful implementation of RecoveryPark.
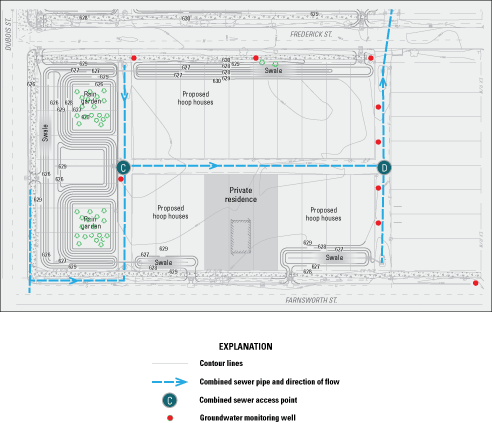
Site plan for a part of RecoveryPark, Detroit, Michigan, which incorporates green infrastructure as part of its redevelopment initiative to convert 40 acres of vacant land into an urban farm.
The RecoveryPark area gives researchers the opportunity to assess how stormwater control measures affect flow and water-budget dynamics in an urban setting with heavy clay soils (fig. S3.2). The U.S. Geological Survey, in collaboration with two program areas within the U.S. Environmental Protection Agency (Great Lakes National Program Office and Office of Research and Development) and the Detroit Water and Sewerage Department, is monitoring to quantify changes in stormwater flows resulting from the installation of GI with the following goals:
• improve the understanding of rainfall, runoff, and infiltration through collection of high-resolution data at water-level monitoring and sewer-flow monitoring sites;
• evaluate hydrologic and meteorological data to analyze the hydraulic performance of the stormwater control measures after implementation;
• develop a model that simulates observed hydrologic processes, quantifies elements of the local water budget, estimates the effectiveness of stormwater control measures, and helps identify gaps in our understanding of the hydrologic processes affected by the stormwater control measures; and
• monitor site hydrology and hydraulics to fully understand the effectiveness of the stormwater control measures and to provide the performance data needed to design future phases of the proposed stormwater capture system envisioned for RecoveryPark.
Vegetated swales and stormwater capture system installed in RecoveryPark, Detroit, Michigan. (Courtesy of U.S. Geological Survey).
The area of RecoveryPark that is being redeveloped covers approximately 10 city blocks (40 acres) and includes grassed swale installations. Assessment of the stormwater control measures implemented at RecoveryPark will consist of three phases:
1. Monitoring by the U.S. Geological Survey includes a weather station to collect data on precipitation and potential evapotranspiration plus 24 groundwater monitoring wells instrumented to collect groundwater levels, temperature, and specific conductance. Additionally, seven in-pipe flow meters were installed by Detroit Water and Sewerage Department to monitor flow within the sewer pipes.
2. Testing includes a feasibility assessment through measurement of soil moisture content around RecoveryPark and stage (water level) within the grass swales.
3. Modeling will help identify the processes that have the greatest effect on the observed water balance and the uncertainty associated with them.
This study addresses two major challenges facing the Great Lakes region: (1) mitigation of the adverse effects of stormwater runoff, and (2) urban revitalization and approaches to reclaim abandoned land in urban settings. Storm control measures are often proposed to mitigate stormwater runoff effects, yet, in practice, the hydraulic response of various types of stormwater control measures have not been well documented. This study will provide information necessary to make informed decisions about the effectiveness of the RecoveryPark approach to both challenges.
The data collected during this study also can be used to design other stormwater control projects in urban areas around the Great Lakes. The urban-site methods developed here could be implemented in other study areas and provide an opportunity to compare and contrast results of studies to monitor runoff in agricultural areas. The data produced may also help engineers improve the design and construction of storm control measures. Additional insights also might inform how aging urban infrastructure (for example, leaking sewer pipes) can affect conveyance of stormwater (Hoard and others, 2020).
Permeable Pavement
Permeable pavements allow water to infiltrate between spaces in the surface material, through layers of crushed rock, and then into soil and groundwater below (Winston and others, 2018). The purpose of the pavement is to infiltrate most of the stormwater onsite to reduce the amount of water and contaminants flowing into storm sewers or directly to rivers and streams (U.S. Environmental Protection Agency, 2021c; fig. 19). Permeable pavements may maintain more stable base flows in streams, reduce flood peaks, reduce stream bank erosion, and may help protect water quality (U.S. Department of Agriculture, 2009).
Permeable pavements can be installed in a variety of applications like parking lots, sidewalks or walking paths, or as an integral component in green streets and alleys. Because there is a high maintenance component associated with permeable pavement, one of the best applications may be at the periphery of less costly traditional paving so that the permeable part allows for infiltration of small, frequent rains and the first flush of larger storms which wash off most pollutants. Stormwater may leave the permeable pavement system through one or more of the following four hydrologic pathways: evaporation, exfiltration (infiltration into the underlying soil), underdrain discharge (if an underdrain is present), or surface runoff (fig. 19).
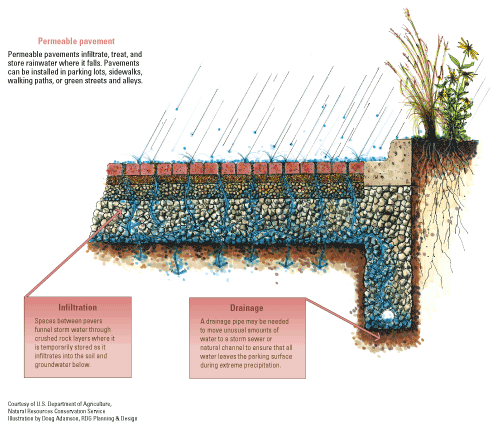
Permeable pavement design.
Permeable pavement consists of either porous paving, like concrete or asphalt, or interlocking modular paver blocks, typically of concrete or brick, that achieve porosity by virtue of the spacing between blocks or pores in pavement. Permeable pavers have been installed in several locations throughout the Great Lakes (fig. 20) and include experimental and permanent installations in a variety of environmental settings.
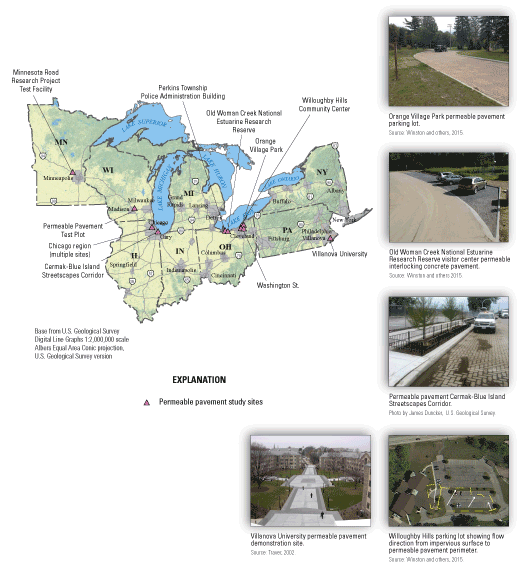
Locations of selected permeable pavement study sites in the Great Lakes region (see app. 1, table 1.1 for an overview of sites shown on this map). (Sources: Darner and Dumouchelle, 2011; Darner and others, 2015; Illinois Sustainable Technology Center, 2012; Kumar and others, 2017; Lebens and Troyer, 2012; Selbig and Buer, 2018; Traver, 2002; Winston and others, 2015; Winston and others, 2020.)
Sidebar 4. Permeable Pavement Testing in Madison, Wisconsin
Three permeable pavement surfaces were evaluated at a testing facility in Madison, Wisconsin, that was built to measure changes to the infiltrative capacity and water quality of stormwater runoff from a conventional asphalt parking lot (fig. S4.1; Selbig and Buer, 2018). Constructed in the summer of 2014, the permeable pavement test site is adjacent to a public parking lot on the northeast side of Madison, Wis. The traditional curb-and-gutter asphalt parking lot served as parking for City of Madison employees and patrons of a public dog park. The lot was modified with asphalt berms to create an impermeable area of 0.32 acre that drains towards the test site. There are more than 40 parking spaces and associated driving lanes in the parking lot that was approximately 25 years old at the time of the study. Vehicles used the parking lot but were prohibited from accessing the permeable surfaces and snow and ice were removed as needed by plows and a mixture of sand and salt when needed.
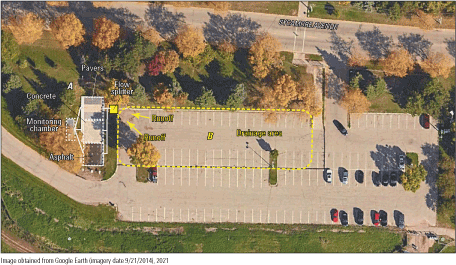
Aerial photograph showing permeable pavement research facility in Madison, Wisconsin, with schematic showing, A, location of test pavement and B, part of the parking lot which drains to the test pavement. (Source: adapted from Selbig and Buer, 2018.)
The test site was built with three sections of permeable pavement—permeable interlocking concrete pavers (PICP), pervious concrete (PC), and porous asphalt (PA; fig. S4.2). The surfaces were selected based on how commonly they are used and industry interest in learning more about the performance of each. Each type of pavement was a 500-square foot plot with 21 inches of base material over an impermeable membrane with a slope of 2 degrees (fig. S4.3). Undrains constructed of 6-inch diameter PVC pipe routed stormwater to a monitoring vault. Concrete walls separated each plot to prevent exfiltration between test plots.
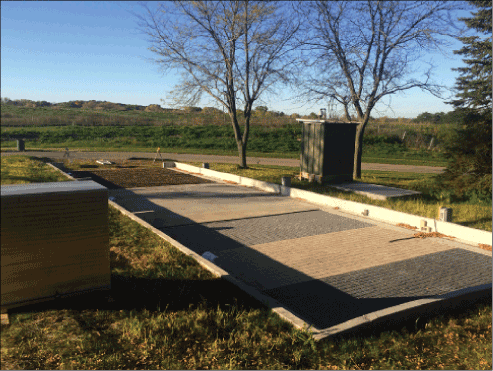
Permeable pavement testing facility in Madison, Wisconsin. (Source: Selbig and Buer, 2018.)
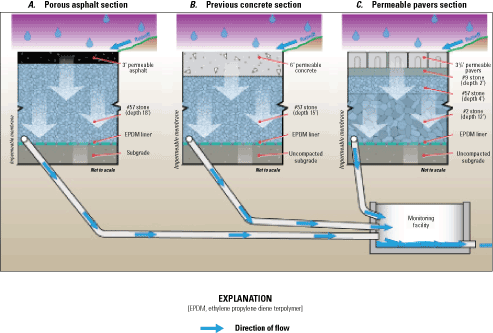
Cross-sectional profile of porous asphalt, pervious concrete, and permeable interlocking pavers test surfaces and aggregate base. Blue arrows indicate flow of infiltrated runoff from the underdrain towards the monitoring chamber. (Courtesy of County Materials Corporation.)
Runoff from the parking lot drained into a concrete structure designed to equally split runoff to each test plot (fig. S4.4). This configuration is unique in that it allows for measurement of the quantity and quality of runoff directly before it enters each permeable surface and again immediately after passing through each treatment section. Once delivered to the test plot, runoff was spread across a serrated weir plate for even distribution of water across the permeable surface. Stormwater then either filtered through the permeable surface or bypassed as overflow that was collected and conveyed separately to a concrete monitoring vault. Flow in and out of each treatment section was measured. Samples were taken and analyzed for selected contaminants and nutrients.
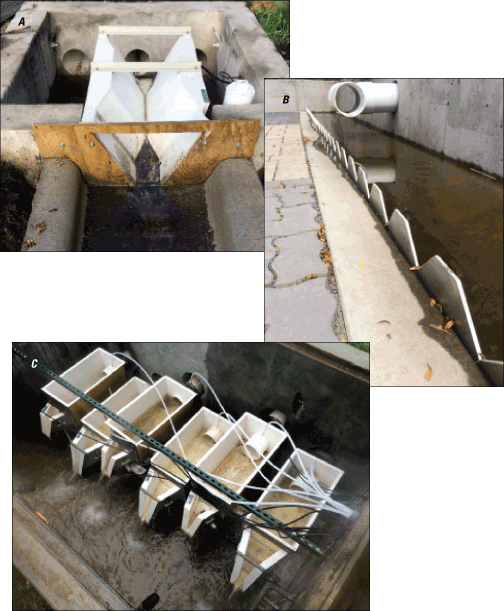
Hydraulic structures used to, A, measure and distribute the flow of runoff from the parking lot; B, uniformly spread runoff across the test surface; and, C, measure runoff that either passes through the underdrain of each permeable surface or bypasses as overflow. (Source: Selbig and Buer, 2018.)
The efficiency of capturing and retaining sediment in each surface led to a decline in infiltration rates that eventually resulted in more runoff flowing over, not through, the permeable layer. This led to decreased, but still functioning, treatment until the permeable surface was partially restored through maintenance practices to which PICP responded more dramatically than PC or PA (Danz and others, 2020). Clogging was found to be primarily because of winter sand application that led to high sediment load in spring runoff. Winter road salt application also resulted in high chloride load that was initially attenuated in all three permeable pavements but later released during subsequent spring runoff events.
Initial monitoring results from 2014 to 2016 indicated that cumulative loads of solids (total suspended solids and suspended sediment), total phosphorus, Escherichia coli (E. coli), and Enterococci were substantially reduced, with most of the reduction taking place through capture and retention in the void spaces of each permeable surface and aggregate base. Total suspended solids were reduced 80 percent in the PC, followed by 69 and 65 percent, respectively, in the PICP and PA.
Additional testing (Selbig and others, 2019) indicated total phosphorus load was reduced by nearly 20 percent for PICP and PA; however, these values were likely tempered by observed export of dissolved phosphorus. PC had greater capacity to remove total phosphorus (43 percent reduction) with no signs of dissolved phosphorus export that was observed in PICP and PA. Average removal efficiencies for metals were 40, 42, and 49 percent in PA, PICP, and PC, respectively. A higher pH in the effluent likely promoted enhanced chemical precipitation, which was used to explain elevated removal efficiencies of phosphorus and select metals in PC compared to PICP and PA (median of 10.2 compared to 7.5 and 7.8, respectfully).
Temperatures below each permeable surface generally followed changes in air temperature with a more gradual response observed in deeper layers (fig. S4.5). Therefore, permeable pavement may do little to mitigate heated runoff during summer. During winter, deeper layers remained above freezing even when air temperature was below freezing. Although temperatures were not high enough to melt snow or ice accumulated on the surface, temperatures below each permeable pavement did allow void spaces to remain open, which promoted infiltration of melted ice and snow as air temperatures rose above freezing. These open void spaces could potentially reduce the need for application of deicing agents in winter because melted snow and ice would infiltrate, thereby preventing refreezing of pooled water in what is known as the “black ice” effect. The environmental benefits and potential unintended consequences of stormwater practices like permeable pavement that use infiltration as a form of treatment warrant consideration in management of urban runoff.
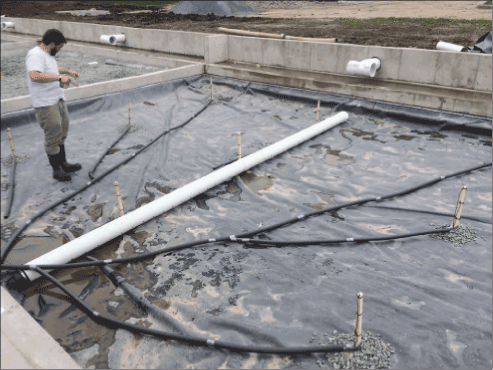
A network of temperature sensors placed in the porous asphalt test plot before installation of the aggregate base and asphalt surface. Attached to each wooden dowel placed in the three-by-three matrix were sensors spaced at about 0 (top), 6 (middle), and 12 (bottom) inches below the permeable surface. The pervious concrete and permeable interlocking pavers test plots had a similar configuration. (Source: Selbig and Buer, 2018.)
Urban Tree Canopy
Trees reduce and slow stormwater by intercepting precipitation in their leaves and branches (fig. 21). Many cities have programs to plant trees in areas where they were lost to development and thus restore some of the benefits of trees (fig. 22). According to the authors of a report on urban planning, “trees interact with the urban hydrologic cycle by intercepting incoming precipitation, removing water from the soil via transpiration, enhancing infiltration, and bolstering the performance of other GI technologies” (Berland and others, 2017, p. 167); however, the interactions of trees with the urban hydrologic cycle is not well understood, particularly at the spatial and temporal scales that are relevant to stormwater management. Therefore, the contribution trees can make on overall stormwater control depends on further research of how and to what extent trees interact with stormwater, as well as information on the location and best vegetation for a given geographical location.
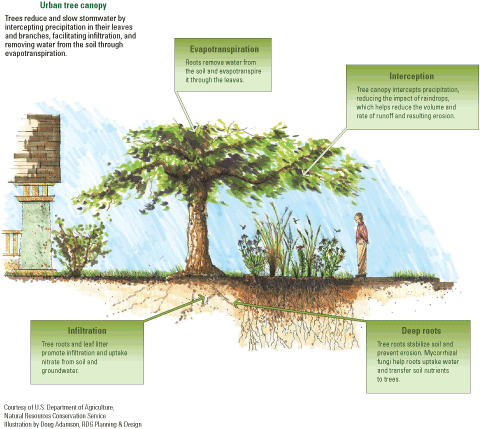
Urban tree interactions in the environment.
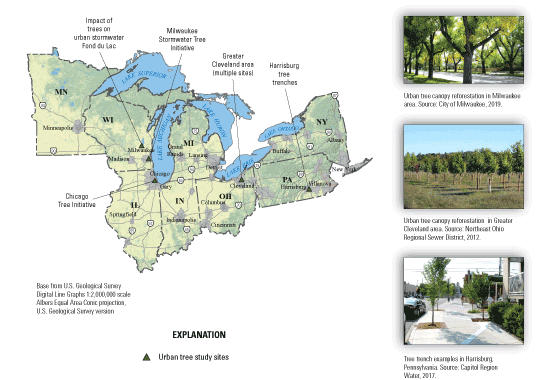
Locations of selected urban tree canopy studies (see app. 1, table 1.1 for an overview of sites shown on this map). (Sources: Capitol Region Water, 2017; Chicago Region Trees Initiative, 2022; City of Milwaukee, 2019; Northeast Ohio Regional Sewer District, 2012; U.S. Geological Survey, 2021d.)
Nongovernmental entities including homeowners, businesses, and community groups can also participate in planting and maintaining trees in urban areas. In some cities, engineered solutions have been developed that divert stormwater through systems designed to allow infiltration and uptake by trees and thus reduce runoff.
Urban tree canopies may be most effective when paired with engineering structures that capture and route stormwater runoff through the root systems of, for example, sidewalk trees; however, more study is needed to adequately understand these interactions especially at the spatial and temporal scales relevant to stormwater management (Berland and others, 2017).
Sidebar 5. Urban Tree Study, Fond du Lac, Wisconsin
The U.S. Geological Survey, U.S. Forest Service, U.S. Environmental Protection Agency Office of Research and Development, and the University of Wisconsin-Madison led a field scientific investigation that was designed to fill some of the data gaps identified by Kuehler and others (2017) and Berland and others (2017) on the role of trees in stormwater management (Selbig and others, 2021). Many of these gaps focus on the need for a more holistic understanding of urban tree canopy, understory, and subsurface effects on urban water cycles including, but not limited to: variation attributed to tree species, age, seasonality (leaf-on, leaf-off), regional climate, interactions with the immediate urban-suburban ecosystem, and the role of trees in the context of other green infrastructure practices (for example, trees planted in rain gardens). These knowledge gaps apply to trees throughout the urban ecosystem (in urban forest patches, private residential and commercial parcels, and the public right of way) not only because of needs regarding urban water budgets but also with respect to how these flows affect ecohydrological functions that relate to vegetation, public health, and the removal of pollutants in the air and water cycle among other ecosystem services.
The primary objective of the study was to quantify the effect of tree removal on the urban hydrologic cycle to measure the effect that trees have on stormwater runoff detention volume. The study used a paired catchment statistical design and analysis of a continuum of storm event hydrographs and additional monitoring data (for example, soil moisture and groundwater level) that characterized how water cycles with and without trees.
This study characterized the effect of street tree removal on stormwater runoff characteristics from two medium-density residential catchments in Fond du Lac, Wisconsin (figs. S5.1 and S5.2). Catchments were comparable in size and consist of single-family housing with approximately 0.25-acre parcels with trees interspersed along the right-of-way that flanks each street. Stormwater runoff was conveyed via curb and gutter to stormwater inlets as the entry point to the centralized storm sewer collection system.
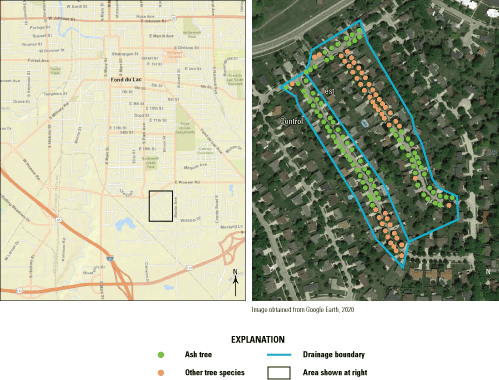
Urban-tree stormwater-reduction study location and catchments in Fond du Lac, Wisconsin.
Using the paired-catchment study design, one catchment was designated the ‘Control’ and the second catchment the ‘Test.’ Trees in the area (street trees and landscape trees) were similar in age and were likely planted during the time of housing construction in the late 1980s.
The primary abundance of tree species lining the streets of each study catchment include ash, maple, and Gleditsia triacanthos L. (honey locust). Approximately one-half of the street trees in the Test catchment were Fraxinus pennsylvanica Marsh. (green ash), a species of tree that is subject to disease through infestation by Agrilus planipennis (Fairmaire, 1888) (emerald ash borer). As such, the city of Fond du Lac plans to remove all ash trees before infestation can happen. All ash trees in the Control and Test catchments were in good health in October 2017 when the project began and were treated to prevent infestation during the study period. The removal of ash trees before infestation provides a unique scenario to quantify the effect that street trees can have on stormwater runoff volume. Data collection for this study was split into four principal components that characterize hydrologic inputs and outputs as part of a volumetric mass water balance: (1) climate inputs and losses, (2) surface runoff, (3) subsurface flows, and (4) arboricultural water use losses and irrigation.
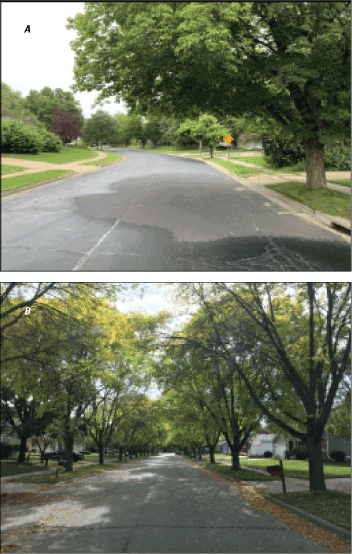
Photos showing, A, the effects of rainfall interception indicated by dry area underneath the canopy and, B, a tree lined street in Fond du Lac, Wisconsin. Trees intercept and store runoff and transfer water back to the atmosphere through evapotranspiration, reducing the volume of runoff. (Courtesy of U.S. Geological Survey.)
Monitoring during the calibration period began in early spring 2018 before leaf-on and continued through the fall of 2019. Researchers were able to establish a baseline water budget by measuring the hydrologic response of each catchment before removal of the ash trees. During the winter of 2019/2020, approximately 60 percent of ash trees lining the street in the Test catchment were removed.
Using a paired-catchment experimental design the project team analyzed storm sewer pipeflow hydrographs before and after tree removal. Results showed an estimated 198-cubic meter increase in surface runoff volume compared to the control catchment over the course of the study. This increase accounted for 4 percent of the total measured runoff after trees were removed. On a per-tree basis, 66 liters of rainfall per square meter of canopy was lost that would have otherwise been intercepted and stored. Runoff volume reduction benefit was estimated at 6,376 liters per tree. These values experimentally document per-capita retention services rendered by trees over a growing season with 42 storm events (Selbig and others, 2021).
In addition to the characterization of hydrologic processes, monitoring data will be used to verify, validate, and calibrate surface runoff and base flow simulations using the i-Tree suite of forest analysis models (i-Tree, 2020, https://www.itreetools.org/tools/hydro;). The i-Tree Hydro program computes surface runoff volume and baseflow groundwater contribution to surface water flow based on weather, soil conditions, impervious cover, and tree and other vegetation parameters. The U.S. Forest Service structured the i-Tree Hydro model to evaluate conditions in the Test catchment before and after tree removal scenarios and before and after future tree planting scenarios to help assess and improve tree planting designs to reduce runoff and improve water quality (Selbig and others, 2021). This effort will help scientists, resource managers, and communities better understand the role vegetation management can have in stormwater management not only in the treatment area but also in other Great Lakes drainage basins and beyond.
Green Roofs
According to the EPA, green roofs fit into a subcategory of on-site stormwater control measures, termed low-impact development (LID) technology (Berghage and others, 2009). Building roofs make up a sizable proportion of the impervious surfaces associated with urban development along with roads and parking lots (fig. 23). Green roofs thus have the potential to reduce the stormwater effects of development because they can detain and retain stormwater.
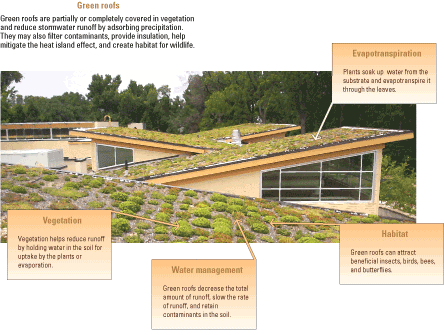
Example of green roof construction on an office building.
Like other GI, green roofs can be incorporated with other stormwater controls and included in a municipal stormwater management plan. Although green roofs retain and remove stormwater through evapotranspiration, excess runoff may add to stormwater control problems that many urban and suburban communities face. Implementation of other stormwater control measures in urban areas may not be practical in some circumstances because of small available surface area and other concerns. Location of example green roof studies is shown in figure 24.
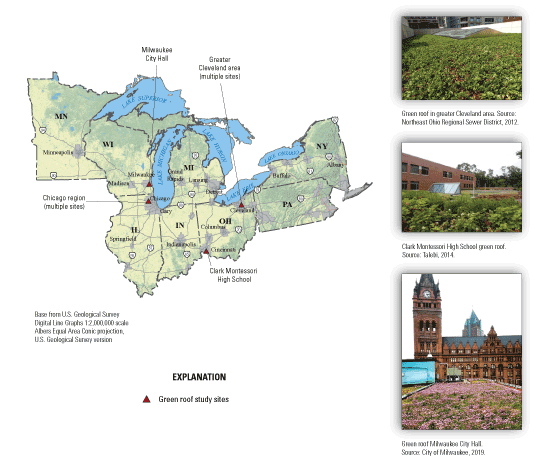
Location of example green roof sites (see app. 1, table 1.1 for an overview of sites shown on this map). (Sources: City of Milwaukee, 2019; Illinois Sustainable Technology Center, 2012; Northeast Ohio Regional Sewer District, 2012; Talebi, 2014.)
Restoration of Hydrologic Cycle
GI implementation is designed to restore natural hydrologic function that has been disrupted through native vegetation alteration, compaction of soils, building of impervious surfaces, change in water use, and introduction of water diversions. Each type of GI practice, whether it be vegetated basins and channels, permeable pavements, urban tree canopy or green roofs serve to restore components of the hydrologic cycle. Most GI practices are designed to reduce runoff by adding storage (often pervious) with the capacity to capture, evapotranspire, and infiltrate stormwater. Evaluating the effectiveness of each GI practice at restoring hydrologic function is a challenge, especially because studies often use their own metrics for determining success, making it difficult to contrast and compare results from different studies.
Vegetated Basins
One measure of determining the effectiveness of vegetated basins is the capacity of the installation to infiltrate a 100-year storm event from a contributing area six times larger than the rain garden or retention basin (Illinois Sustainable Technology Center, 2012). Often methods of evaluating the performance of vegetated basins include comprehensive monitoring of all components of the water cycle; however, it is prohibitive in cost and the effort to include an adequate number and range of intensity of storm events. For this reason, there are few studies reporting performance of vegetated basins (especially for rain gardens). Alternative methods of evaluating performance based on visual inspection, infiltration testing, and synthetic drawdown testing have been developed and tested by Gulliver and Anderson (2008) and Asleson and others (2009) and may be useful for rapidly assessing multiple installations. A whole water-cycle monitoring approach may be needed to fully assess the role of GI interventions on performance of inflows captured, duration of outflow drainage, hydrologic losses (because of evaporation and transpiration), and groundwater table dynamics that indicate deeper infiltration losses; however, low-cost monitoring strategies may be suitable for addressing selected monitoring objectives and design questions (Shuster and Darner, 2018).
Most studies indicate that rain gardens are an efficient, cost-effective way to reduce local runoff. A visual assessment of 70 vegetated basins in the Chicago region determined that all basins functioned to some degree and even the most poorly maintained looked as if they could be restored with routine weeding (Illinois Sustainable Technology Center, 2012). Shuster and others (2017) found that despite sediment loads clogging the rooting zone and overall lower-than-design infiltration rates, rain gardens maintained relatively high overall retention effectiveness. They found that 50 percent of total inflow was detained in the rain gardens, and overflow to the sewer system was delayed by an average of 5.5 hours during the 4-year study duration (Dumouchelle and Darner, 2014; St. Francis Apartments, fig. 16). Twelve rain gardens installed in the Slavic Village neighborhood, Cleveland, Ohio (fig. 16), provided considerable additional detention capacity to the sewershed and prevented or delayed some proportion of event stormwater from directly entering into the local combine sewer system (Shuster and Darner, 2018). Eight of 12 rain gardens in Minnesota that were evaluated by visual inspection performed well after several years. The other four rain gardens were determined to be nonfunctional based on (1) presence of ponded water, (2) presence of hydric soils, (3) presence of emergent wetland vegetation, and (4) failing vegetation, suggesting that lack of maintenance was the primary reason for failure, respectively (Asleson and others, 2009).
Soil drainage and provisions for subsurface drainage like an internal water storage zone (areas designed to store water at depth before slowly releasing to surrounding native soils or outlets), especially in areas with poorly drained soils or shallow water tables, are key design features for properly functioning vegetated basins (Shuster and others, 2007; Winston and others, 2016). Soil infiltration capacity was measured in 15 of 70 Chicago rain gardens with all but 1 estimated to be able to successfully infiltrate the water from a 100-year storm event (Illinois Sustainable Technology Center, 2012). Rain gardens constructed with engineered soils had higher infiltration capacity than native soils; however, almost all the native soil rain gardens performed better than would be predicted using U.S. Department of Agriculture Natural Resource Conservation Service soil survey data (Illinois Sustainable Technology Center, 2012). Generally, systems in sandy soils have higher infiltration rates than high clay soils. Selbig and Balster (2010) observed median infiltration rates that were an order of magnitude greater for rain gardens with sandy soils (Owen Conservation Park, fig. 16) than for those with clay (Madison Water Supply pump house, fig. 16) regardless of vegetation type; however, spatial variability was noted within rain gardens having similar soil conditions. Several studies have reported a high variability in infiltration rates within individual rain gardens, even those constructed of engineered soils where soil conditions are expected to be similar throughout the garden. Lower infiltration rates were observed near inflow and in the deepest locations of the rain gardens, suggesting that surface infiltration may decrease with time in these areas because of compaction of soils caused by concentrated flows or surface soil clogging from particle settling (Illinois Sustainable Technology Center, 2012).
Plant diversity and density are critical for creating successful installations, and failing to achieve adequate vegetative communities will ultimately cause the practice to fail because vegetation diversity and density affects infiltration capacity in vegetated basins (Rainer and West, 2015). Prairie vegetation can have greater infiltration rates than turf grass in rain gardens (Selbig and Balster, 2010). Vegetated basins with high infiltration rates may serve to restore hydraulic connectivity in areas where surface and groundwater are otherwise decoupled, providing a pathway for recharging of groundwater (Stewart and others, 2017).
Implementation of an internal water storage zone allows for continued exfiltration (infiltration into the underlying soil) during interevent periods. Exfiltration rate and internal water storage zone thickness were the primary determinants in successfully reducing runoff volume, with lateral exfiltration the primary pathway (Winston and others, 2016). Runoff reduction for three bioretention ponds with internal water storage zones in Ohio (Ursuline College, Holden South, and Holden North ponds at Holden Arboretum [fig. 16]) was 60, 42, and 36 percent, respectively, and was primarily related to the exfiltration rate of the underlying soil (Winston and others, 2015). The maximum rainfall depth that could be retained in the basins without outflow is a result of storage capacity in the internal water storage zone (a function of zone depth and exfiltration rate) with the greatest volume reduction taking place in basins with the highest infiltration rate and deepest internal water storage zone.
Vegetated Channels
Like vegetated basins, vegetated channel success is dependent upon infiltration capacity, the presence of an internal storage zone, and the density and diversity of vegetation in the installation. Even where soils have poor hydraulic conductivity, a 12-foot (ft) trench can reduce stormwater runoff from a typical road to about 25 percent of total precipitation (Capitol Region District, 2021). Most of the studies reviewed reported reduction in stormwater volume and peak flow. Water-quality effects can include reduction of contaminants from road runoff being retained in the bioswale and a resultant reduced contaminant load to surface waters (Kumar and others, 2017). Studies indicate that vegetated channels designed to slow but not necessarily capture 100 percent of runoff are successfully used to effectively capture and reroute enough stormwater runoff to prevent overflow onto nearby roads during small storm events (Kumar and others, 2017).
At two sites in the Chagrin River watershed, Northeastern Ohio (fig. 18), frequent residential street flooding led to the installation of a bioswale and a rain garden (Darner and Dumouchelle, 2011; Darner and others, 2015). The combination of the rain garden and bioswale performed better than expected when several precipitation events that exceeded 0.75 inches (in.) did not result in overflows (Darner and Dumouchelle, 2011), and total runoff was reduced by 45 percent (Darner and others, 2015). During a 5-year monitoring period that was adjusted for rainfall variation, the runoff reduction decreased with time; however, the lag time from precipitation to peak flow remained constant (Darner and others, 2015). The combination of increased runoff volume with no change in timing may possibly be because of preferential flow paths developing in the structure, increasing capacity for internal drainage. If clogging of surface or subsurface sediments in the bioswale is causing increased overflow, the system may be inadequate to reduce street flooding in future years (Darner and others, 2015). Sediment deposition in bioswales is likely not to be uniform, resulting in decreased performance in parts of the channels where sediments accumulate. Infiltration rates at bioswales at Cermak Road and Blue Island Avenue corridor in Chicago, Ill. (fig. 18), decreased with time because of soil compaction and deposition of fine-grained sediments from stormwater runoff (Kumar and others, 2017). Greater amounts of sediment were deposited close to the curb cut compared to the center of the bioswale.
Vegetated channels in conjunction with other practices can be an effective contributor to reducing runoff. Few studies were found that focus solely on quantifying the benefits of vegetated channels. A combination of bioswales, permeable pavers, and infiltration zones (tree boxes and planter boxes) installed in Chicago were designed to infiltrate 80 percent of rainfall from the 2-year 30-minute design storm, which is equivalent to approximately 1.12 in. of rainfall; however, during the study period, the area received rainfall at much higher intensities and still the practices were able to infiltrate almost 100 percent of runoff (Kumar and others, 2017). Biowales were included as a part of low-impact development in a new residential area in Wisconsin (Selbig and others, 2004) that was studied to determine the effect of residential construction on a nearby Class I trout stream. Collectively, the stormwater management and erosion control practices reduced stormwater runoff and solids transport during construction and provided sufficient protection against degradation of the stream. A combination of vegetated swales and detention basins were able to retain predevelopment runoff characteristics and avoid negative consequences of the residential neighborhood development, indicating that implementing GI practices before residential construction can help prevent stream degradation because of land disturbance. Grassed swales were installed as part of a low-impact development catchment which included forested hillslopes, lawns, and a detention pond in Cross Plains, Wisconsin (fig. 18). The swales captured 96 percent of the potential runoff volume (based on rainfall in the basin) before reaching the infiltration basin and provided the greatest benefit for high-intensity storm events that exceeded infiltration rates of underlying soils (Selbig and Bannerman, 2008).
Permeable Pavements
Every study reviewed for this GI practice reported that, at least initially, all permeable paver sites captured and reduced stormwater runoff (Kumar and others, 2017; Lebens and Troyer, 2012; Selbig and Buer, 2018; Traver, 2002; Winston and others, 2016, 2018, 2020). As many as 80 percent of storm events were completely captured by permeable pavements. The reduction in stormwater volume resulting from the installation of permeable pavements varied widely (13 to nearly 99 percent), indicating that factors beyond the pavers themselves contribute to a large percentage of the success (Winston and others, 2015). Factors contributing to the effectiveness (or lack of effectiveness) in permeable pavement installations included characteristics of the site and installation design, level of long-term maintenance, and characteristics of individual storm events.
Site characteristics and installation design were important for achieving stormwater reductions. Greater volume reductions were achieved by having a larger permeable zone relative to the watershed size, incorporating an internal water storage zone beneath the crushed stone base layer, and installing permeable pavement systems in areas with higher permeability underlying soils (Winston and others, 2015). Stormwater was completely captured during 4–80 percent of observed storm events (Winston and others, 2018), with volume reductions from 16 to 32 percent at four separate installations (Old Woman Creek National Estuarine Research Reserve, Orange Village Park, Perkins Township Police Administration, and Willoughby Hills, parking lots northern Ohio, [fig. 20]). Those studies found that the loading ratio for exfiltration (a measure of the capacity of the permeable pavement system in relation to the runoff area) and drawdown rate (the amount of water that can flow through the system into the soil) affect the performance of the system (Winston and others, 2018). High loading ratios and low drawdown rates resulted in the worst overall performance in completely capturing events. The study determined that it is important to locate permeable pavements over the most permeable soils at the development site and increase the permeable pavement surface area to reduce the loading ratio and improve runoff mitigation. Even in areas with poorly drained soils, permeable pavements with well-engineered substrates can be implemented successfully through the addition of an underlying impermeable geomembrane (Eisenberg and others, 2015). Harsh winter climate with multiple freeze/thaw cycles and the addition of deicing compounds can also affect the performance of permeable pavement; however, recent studies indicate that using specially designed concrete mixtures and the correct deicing compounds can enhance performance of these systems in cold regions such as the Great Lakes, as illustrated by a study in Minnesota (Schaefer and others, 2012)
For four sites in northern Ohio, the minimum rainfall depth to produce outflow ranged from 0.11 to 0.99 in., indicating there is a wide variability in the hydrologic performance of these systems (Winston and others, 2015). Construction and materials also affect performance; permeable asphalt was found to absorb higher runoff volume than permeable interlocking pavers and permeable concrete (Selbig and Buer, 2018), but asphalt lacked the same degree of water-quality treatment. Rainfall intensity and volume were important in the overall effectiveness of permeable pavement installations (Winston and others, 2018). Stormwater was captured completely for as much as 80 percent of observed storms, and substantial peak flow mitigation was observed for all rainfall events not producing surface runoff.
Urban Tree Canopy and Green Roofs
A reduction in stormwater runoff is frequently cited as a benefit of increasing urban tree canopy (U.S. Environmental Protection Agency, 2014b), yet few studies exist that quantify the effect that urban tree canopy has on stormwater runoff quantity and quality (fig. 22). The USGS is collaborating with the U.S. Forest Service, EPA, and the University of Wisconsin-Madison to measure the hydrologic effects of urban tree canopy to fill some of these data gaps (see sidebar 5).
A study of green roofs in Pennsylvania used paired field and laboratory tests to determine design specifications for optimal performance in limiting runoff and assess water quality effects (Berghage and others, 2009). Water quantity and quality properties measured included flow, turbidity, and nutrients. The results indicate that a 3.5–4 in. deep green roof can retain 50 percent or more of annual precipitation. Green roof functioning can be further improved by understanding the interactions among soils and vegetation and other roof ecosystem elements (Oberndorfer and others, 2007).
Restoration of Human and Ecological Beneficial Uses
Stormwater runoff is a major cause of water contamination in urban areas. Contaminants, habitat destruction, and streamflow flashiness resulting from urban development disrupt biological communities, particularly sensitive aquatic species (Coles and others, 2012). Every stream flows downstream to a larger water body, such as rivers, reservoirs and lakes (including the Great Lakes), and ultimately coastal waters. Inputs of pollutants, whether chemical contaminants or sediments, at any point along the stream can degrade downstream water quality and cause harm to biological communities and economically valuable resources, such as fisheries and tourism. GI practices designed to restore hydrologic function by capturing, infiltrating, and evapotranspirating stormwater runoff can also result in improvements to water quality, which benefits human and ecological uses of surface waters; however, there are far fewer studies documenting the effectiveness of GI practices for restoring human and ecological beneficial uses than those documenting the hydrologic performance of GI. This makes the evaluation of and comparison between practices extremely challenging.
Vegetated Basins and Vegetated Channels
Three major factors affect the water quality effect of vegetated basins: (1) the type and makeup of soils (native or engineered), (2) the presence of an internal water storage zone, and (3) the type and number of plants (Winston and others, 2015). Particulate matter is captured near the surface of soils through filtration, resulting in capture of particulate phosphorus, total suspended solids, and heavy metals (Davis, 2007). Dissolved components of water quality were reduced because of interactions with clay particles and organic matter during infiltration. The initial content of phosphorus in the soil can be critical in determining if the basin acts as a net phosphorus sink or source (Hunt and others, 2006). Saturated conditions cause phosphorus to be ineffectively stored in the submerged zone. Plants provide a mechanism for volume reduction through transpiration and nutrient and metal uptake from soil water (Lucas and Greenway, 2008). Nitrogen fate within basin soils is regulated mainly by aerobic or anaerobic conditions of the soils and plant uptake (Davis and others, 2009). Planted basins have higher soil-saturated hydraulic conductivity and higher nitrogen and phosphorus assimilation than unplanted basins (Bratieres and others, 2008; Lucas and Greenway, 2008). Vegetated basins in sandy soils allow more infiltration than heavier soils like clays, but this may also allow for greater pollutant mitigation because of greater throughflow and less accumulation of contaminants within the basin; however, sediment and heavy metal concentration reductions were observed in nearly every field- and laboratory-based study on bioretention regardless of soil or vegetation in the basin (Davis, 2007; Davis and others, 2009; Feng and others, 2012; Hunt and others, 2008). A study was done in the Shepherd Creek catchment in Cincinnati, Ohio (fig. 16), where 81 rain gardens were installed on 30 percent of the properties in 4 experimental subcachments. Results indicated that the rain gardens were successful at mitigating stormwater at the property level but that only minor effects on streamflow volume and water quality, with no changes in biotic health, were observed in Shepherd Creek (Roy and others, 2014; Thurston and others, 200881). Their study concluded that improvement of overall stream health is unlikely without additional treatment of major impervious surfaces (like roads and parking lots) and that further research is needed to define the minimum effect threshold for retrofitting catchments if the goal is to improve stream ecosystem health.
Water quality results indicated that large amounts of pollutants, like metals, nutrients, sediment, and chloride, entered the bioswale from road runoff and were retained in the structure, preventing contamination from entering sewers directly (Kumar and others, 2017). Although grassed swales are effective at reducing runoff velocity and peak discharge, they do not provide adequate pollutant removal benefits to act as a stand-alone best management practice (Minnesota Pollution Control Agency, 2021).
Permeable Pavement
Reduction of stormwater volume is the primary design function of permeable pavement; however, there may be other benefits to well-designed permeable pavement systems including improved quality of runoff. All the studies referenced in the previous section on permeable pavements monitored inflow and outflow from permeable pavement to determine volume and peak reduction but only a subset monitored water-quality properties (Selbig and Buer, 2018; Winston and others, 2016105 ,2020). Of these, results varied and indicated a decreased effectiveness with time. In one study, a combination of primary treatment and final capture in a cistern contributed to a 96 percent decrease in total suspended solids and turbidity concentrations and a 99.5 percent decrease in total suspended solids and loads that resulted in a greater than 40 percent reduction of sediment-bound nutrient forms and total nitrogen (Winston and others, 2020). Winston and others (2020) also analyzed for several metals and found that copper, lead, and zinc were initially sequestered in the subsurface during the first 5 months of monitoring; however, during the second half of the monitoring period, metals were observed to leach back into the runoff. The cause of leaching may have been because of decreased pH within the cistern or a result of desorption of metals from the sediment caused by residual chloride from salt used for deicing.
Urban Tree Canopy and Green Roofs
One of the few studies used for this review that included water quality was a study of green roofs in Pennsylvania (Berghage and others, 2009). Water-quality properties measured in addition to flow included turbidity and nutrients. The results indicate that a 3.5–4 in. deep green roof limited nitrate loading, and the authors suggest that performance can be improved further by routing the roof discharge to other GI practices such as vegetated basins or channels. An added benefit to both urban tree canopy and green roofs is they can help mitigate the urban heat island effect (U.S. Environmental Protection Agency, 2021c).
Factors that Affect Performance
The primary goal of most GI practices installed in the Great Lakes region is to reduce runoff volume and improve runoff quality (see Christopher Burke Engineering, LLC, undated). Because there are many design metrics to evaluate the theoretical effectiveness of each GI practice, an accurate evaluation of performance of individual installations can only be made by monitoring and observing runoff quantity and quality through time (often years). Urban stormwater runoff quantity and quality are strongly dependent upon catchment properties. Catchment capacity is dependent on land use and underlying natural physiographical conditions like soils, geology, climate, geomorphology, and vegetation (Golden and Hoghooghi, 2018). Success of GI installations is a function of the response of the practice to contributing area properties and is largely dependent upon the functional performance of vegetation, underlying filtration (whether it be soils and [or] underdrains), and subsequent maintenance of the system. Designing practices without understanding the inherent characteristics of the catchment and neglecting to adequately address vegetation and filtration construction and subsequent maintenance will impair performance or ultimately cause system failure. Inadequate design, poor construction techniques (especially soil compaction resulting in reduced infiltration rates), lack of soil stabilization in the practice before receiving runoff, inadequate pretreatment of sediment-laden runoff, and lack of proper maintenance are the primary causes of reduced performance (Christopher Burke Engineering, LLC, undated).
Catchment Characteristics
An evaluation of catchment characteristics is the first step in ensuring good performance of GI installation. The success (or failure) of GI performance can be determined by whether the installation meets certain design criteria. Even though there are a multitude of design criteria, there is no national standard for sizing GI to address stormwater challenges. Communities must evaluate the objectives of local programs and establish their own constraints for determining required water volume and depth capture based on local rainfall analysis, catchment characteristics, and targeted removal of stormwater pollutants.
Site design techniques that reduce impervious cover, conserve natural areas, and use pervious areas more effectively increase the likelihood of success for restoring natural hydrologic conditions (Minnesota Pollution Control Agency, 2021). Individual practices that are relatively small but densely distributed, like rain gardens and bioswales, are relatively inexpensive, can be considered an aesthetic part of landscaping, and may provide cost-effective alternatives to more traditional larger centralized practices like detention ponds. An additional benefit of increasing catchment capacity through multiple distributed systems is to enhance chemical transformations and storage of pollutants via longer soil residence times to attenuate entrained constituent and particulate matter transport to a stream, river, or other water body (Golden and Hoghooghi, 2018). The maximum contributing area should not exceed five acres (Christopher Burke Engineering, LLC, undated). Other key site factors affecting performance include slope (less than 20 percent), depth to bedrock, water table depth, underlying soils, and ratio of contributing area to GI surface area (Christopher Burke Engineering, LLC, undated). The optimal ratio of connected impervious contributing area to GI surface area differs for each practice ranging from 3:1 for permeable pavement to 5:1 for vegetated basins and swales. If the ratio is too large, the installation is overwhelmed and cannot capture the required stormwater volumes (Christopher Burke Engineering, LLC, undated). Although undersized practices still offer some treatment benefits, such design limitations may affect longevity, maintenance requirements, and the resilience to accommodate extreme rainfall events (Taguchi and others, 2020).
Infiltration Capacity
The infiltration capacity of a GI is driven by the substrate on which it is installed. The substrate may be of unaltered or amended soil and may include underdrains to improve infiltration in areas with low permeability. Unaltered soils vary widely throughout the Great Lakes region, with highly permeable well-drained sandy soils in much of Wisconsin and Michigan to very poorly drained high clay soils in Ohio and Indiana (fig. 2B). Often soils in urban areas are low in organic matter and highly compacted, reducing infiltrability. The urban soil condition with the greatest infiltration potential is noncompacted sand (Pitt and others, 1999; fig. 25). Compaction has the greatest effect on infiltration rates in sandy soils, with little detrimental effects associated with soil moisture. Compaction and moisture have about the same effect on infiltration on clayey soils, with saturated-compacted clayey soils having the least effective infiltration (Pitt and others, 1999; fig. 25). Because it is difficult to predict the level of infiltration for urban soils, doing infiltration tests during saturated conditions is crucial for a site-specific design of GI installations. Soils that have previously been disturbed by development should be considered compacted. Compaction typically affects the first 18 in. below the surface; therefore, infiltration testing should extend below the compaction depth (Pennsylvania Department of Environmental Protection, 2006). For clay or compacted soil, it is typical to excavate to the depth of the planting soil and replace with an engineered soil to support healthy plant growth (U.S. Environmental Protection Agency, 2014a).
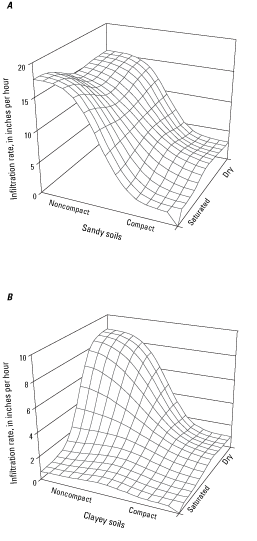
Three-dimensional plots of infiltration rates for: A, sandy soils and, B, clayey soils. Infiltration rates from highest to lowest are (1) noncompacted sandy soils, (2) compacted sandy soils, (3) dry, noncompacted clayey soils, and (4) all other clayey soils (compacted and dry, plus all saturated conditions. (Source: Pitt and others, 1999.)
A study done in Madison, Wisc., from 2004 to 2008 compared the capability of rain gardens with different soil and vegetation types to infiltrate stormwater runoff (Selbig and Balster, 2010). Two side-by-side rain gardens were installed on sandy soil, and two additional side-by-side rain gardens were installed on clay soil (fig. 26). For each soil type, one of the rain gardens was planted with turf grass and the other with a native prairie species. Results indicated that regardless of soil type or vegetation, the rain gardens stored and infiltrated at least 99 percent of the runoff during the 4-year study period. Median infiltration rates in sand were greater than clay. Although infiltration rates were reduced during winter months, the hydraulic function of the rain gardens was not appreciably altered (Selbig and Balster, 2010). In Toledo, Ohio, a study of bioswales built on clay soils indicated the system was able to retain about 64 percent of annual runoff volume and peak flows were reduced by 60–70 percent despite the relative imperviousness of the underlying soils (U.S. Environmental Protection Agency, 2014a). Initially an underdrain was installed because of the existence of clay soils, but it was later closed to promote infiltration into the native soil.
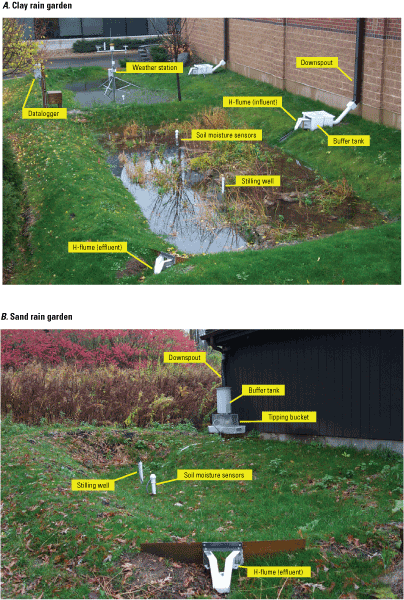
Rain gardens with monitoring equipment installed in, A, clay and B, sand in Madison, Wisconsin. (Courtesy of U.S. Geological Survey.)
Soil amendments are recommended by the U.S. Department of Agriculture if infiltration rates are below 0.5 in. per hour and organic matter is below 2 percent (U.S. Department of Agriculture, undated). Although amendments are intended primarily for supporting vigorous plant growth, all growing media should have a field-tested infiltration rate between 1 and 8 in. per hour according to the Minnesota Stormwater Manual (Minnesota Pollution Control Agency, 2021). If phosphorus is a water quality concern, recommended amendments include substituting organic matter less prone to phosphorus leaching, like coir or biochar. Soil amendments that are effective in increasing chemical sorption of dissolved phosphorus include iron filings, steel wool, native iron-rich soils, oxide-based sorbtive media, and drinking water treatment byproducts containing aluminum and (or) iron hydroxides. Other water-quality concerns have different media requirements.
During site evaluation, the depths to the seasonal high groundwater table and to bedrock should also be measured to ensure adequate infiltration. At least 2–3 ft of separation from the GI bed bottom to bedrock or seasonal high groundwater table is recommended (Minnesota Pollution Control Agency, 2021; Pennsylvania Department of Environmental Protection, 2006). Underdrains convey subsurface water in a GI practice to facilitate infiltration when rates are too slow and are highly recommended where parent soils have low or very low infiltration rates when wetted, have permanent high-water table, or contain a claypan or clay layer at or near the surface (Minnesota Pollution Control Agency, 2021; U.S. Environmental Protection Agency, 2014a). A maximum 72-hour dewatering time is recommended to prevent extended surface ponding (Minnesota Pollution Control Agency, 2021).
Vegetation
Vegetation selection and maintenance is important for GI success. Under-vegetated structures encourage erosion and heavy inflows of salt and other urban pollutants, which kill plants. Often plantings are treated as horticultural objects rather than a diverse system of roots that play a major role in filtration, water uptake, transpiration, and erosion control (Rainer and West, 2015; fig. 27). Bioretention basin plantings require many different plants woven together in tight mosaics to effectively address the wide array of hydrologic conditions in a small area; for example, there are dry rims in the upper part of the installation, moist centers, and perpetually wet areas near outflows and drains. Plant diversity also provides a range of different benefits: cool-season growers hold the soil in winter, warm-season growers tolerate drought, short-lived plants reseed and fill gaps, long-term plants create stability, deep rooted plants act as a sponge, and shallow rooted plants resist erosion (Rainer and West, 2015).
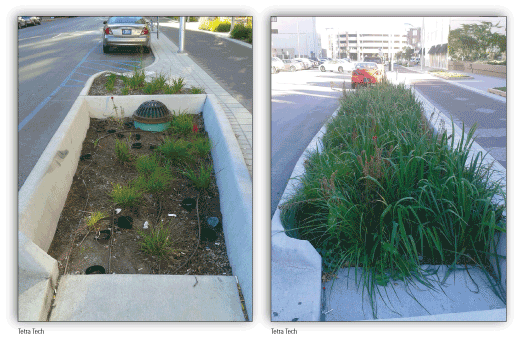
Examples of bioswales in downtown Indianapolis, Indiana. Left bioswale needs maintenance and revegetation; right bioswale is well vegetated and appears to be working properly. (Source: U.S. Environmental Protection Agency, 2016b.)
Maintenance
All GI practices require some periodic maintenance to sustain performance through time. Neglecting to include the long-term cost and support of maintenance will eventually lead to reduced performance or failure. The level of maintenance ranges from low for revegetation (for example tree canopy) to high for permeable pavement (Northeast Ohio Regional Sewer District, 2012). Maintenance considerations for bioretention ponds, rain gardens, bioswales, and green roofs are primarily associated with maintaining vegetation (table 2). Maintenance can be greatly reduced in vegetated systems with diverse, densely packed plantings. Vegetated systems that have few species and widely spaced plantings require more weeding and attention to erosion damage. Trash and debris removal are also a concern when contributing areas are frequently littered.
Table 2.
Maintenance considerations for green infrastructure practices. Source: Modified from Northeast Ohio Regional Sewer District, 2012.Erosion and sedimentation are also maintenance concerns for bioretention ponds, rain gardens, bioswales, and permeable pavements especially when these practices receive runoff from roads and parking lots (table 2). Many practices fail because of sod or rock inlets that have filled with sediment and cause stormwater to bypass the structure. In areas with high sediment loading, pretreatment devices, such as sediment traps and forebays (fig. 28), have the capacity to remove at least 50 percent of the annual sediment load (U.S. Environmental Protection Agency, 2016b). If run-on water to the practice is contaminated with nutrients, sediment, metals, or other contaminants, they will accumulate in engineered soils and may require replacement periodically. Li and Davis (2008) found that sediment and heavy metals concentrate in the top 5–10 cm of bioretention media, so removal and replacement of surface layers may revitalize water quality performance. Depending on the contaminants present, these soils may be considered hazardous and require suitable disposal. If sediment buildup reaches 25 percent of the ponding depth, it should be removed (Christopher Burke Engineering, LLC, undated). Bioretention and bioswales that have underdrains or overflow structures may require periodic maintenance to prevent clogging and potential overflow of the installation (table 2).
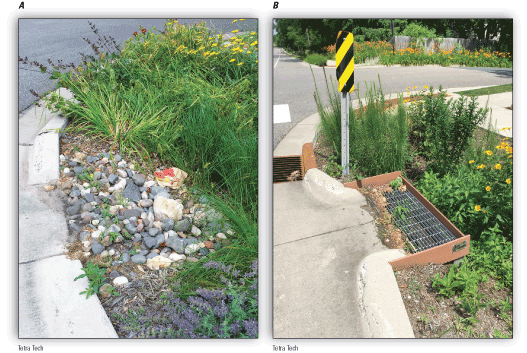
Two types of street rain garden inlets: A, rock inlet and, B, pretreatment inlet designed to aid in collection of gross solids (sediment, leaves, and trash). In some communities, rock inlets are no longer allowed because of difficulty maintaining the effectiveness of the inlet for pretreatment. (Source: U.S. Environmental Protection Agency, 2016.)
Maintenance of permeable pavements is critical to providing long-term reductions in stormwater runoff (Kumar and others, 2017). All the reviewed permeable pavement installations became clogged with sediment through time, reducing performance (Kumar and others, 2017, Lebens and Troyer, 2012; Selbig and Buer, 2018; Selbig and others, 2019; Traver, 2002; Winston and others, 2015, 2016, 2018, 2020). Run-on from nearby pervious and impervious surfaces carry sediment and debris that clog surface pores of the pavement (fig. 29). Locations beneath trees, draining pervious areas, and with higher traffic flows are more susceptible to clogging. Maintenance includes periodic vacuuming, sweeping, or power washing to alleviate clogs in the pavement. When the pavement becomes clogged, often the only remedy is to remove or replenish the top layer of stone or sand between joints (Danz and others, 2020).
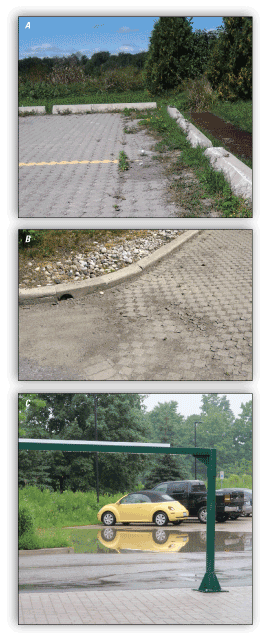
Examples of permeable pavement systems showing accumulation of sediments (A and B) and partial infiltration (C). (Source: Sustainable Technologies Evaluation Program, 2018.)
A study of two sites in Chicago reported that a decline in paver infiltration rates was on the road with higher traffic intensity and specifically the side of the road where daily commuters parked their cars (Kumar and others, 2017). Infiltration rates of pavers recovered after cleaning; manual cleaning with complete replacement of aggregate fill material was more effective than mechanical cleaning.
Surface cleaning to maintain the permeable properties of porous pavement is recommended at least twice per year using industry methods such as regenerative air or vacuum sweeping (Eisenberg and others, 2015; Wisconsin Department of Natural Resources, 2016). Selbig and Buer (2018) tested several methods of surface cleaning and all produced appreciable gains in infiltration (fig. 30). A review of numerous studies including some done in cold climates found that the common key to success was proper and regular maintenance (Weiss and others, 2015).
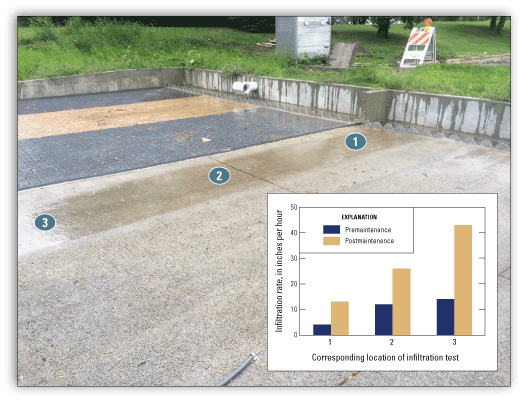
Response in infiltration rates at select locations premaintenance and postmaintenance of the pervious concrete surface. (Source: Selbig and Buer, 2018.)
Quantitative recommendations made by the company Sustainable Technologies after an evaluation of several permeable pavement installations include twice-yearly vacuuming and joint material replacement when the measured surface infiltration rate is less than 150 millimeters per hour (Sustainable Technologies Evaluation Program, 2018). If surface drainage performance remains unacceptable, all the bedding and joint fill in the affected area should be replaced. Other recommendations include twice-yearly cleaning of inlet structures within or draining to infiltration beds to prolong their lifespans. Finally, maintaining planted areas adjacent to the permeable pavement prevents soil washout onto the pavement, and if washout happens, it should be cleaned immediately to prevent further clogging. Although permeable pavement systems usually require less deicing treatment than standard pavement, sand or other abrasive deicing treatment can cause clogging if applied near or on the permeable pavement.
Unintended Consequences
The goal of each type of GI practice is to reduce and treat stormwater at its source while delivering environmental benefits like increased habitat for wildlife, flood protection, cleaner air, and cleaner water; however, when GI is designed and deployed to address urban drainage and water-quality issues, it is generally built to solve site-specific problems and does not consider all potential consequences. Examples of possible negative consequences for humans and the environment include increasing allergens, promoting invasive plants, hosting pathogens or pests, increasing water and fertilizer use for management of urban trees and plants, and redirecting surface water contaminants to groundwater. The result is that often GI practices are initiated without full knowledge of potential unintended social, ecological, and human health consequences (Taguchi and others, 2020). Each GI practice performs best under specific conditions and when targeting specific goals, but there are tradeoffs associated with each practice that may cause impaired function or degrade the surrounding environment (table 3). Like the factors that affect performance, these tradeoffs or unintended consequences are a function of infiltration (whether it be underlying soils and (or) underdrains), vegetation, and (or)soil media within the installation, and maintenance of the system.
Table 3.
Examples of unintended consequences resulting from GI practices.[Shading (also marked with an “X”) indicates that the practice may produce the unintended consequence. --, practice may produce the intended consequence]
Infiltration
Because each type of practice has associated unintended consequences, the greatest negative consequence of many GI practices may be the infiltration of stormwater contaminants to groundwater (Andres and others, 2018). Frequently, the only design criterion for stormwater infiltration is the rate of infiltration; however, infiltrated stormwater can carry pollutants (nitrogen; pesticides and fertilizers; metals, oil, and grease from road surfaces and gas stations; hazardous waste spills; and salts used in road deicing) and cause hydraulic problems like mounding, slope instability, and subsurface flooding of infrastructure (Andres and others, 2018). Contaminants that are water soluble (for example, deicing salts, nitrogen, and some pesticides) are more likely to infiltrate into shallow groundwater, whereas contaminants that bind to soils (metals, some pesticides, and orthophosphate) tend to accumulate in soils underlying the GI installation. Accumulated contaminants in soils may eventually release to groundwater with time; for example, deicing agents containing chlorides, applied during winter months, can mobilize metals, and carry them to groundwater. Deicing compounds containing chlorides are highly soluble and may accumulate in GI sediments to be released later during subsequent runoff events. In addition, salt-laden runoff from deicing compounds can mobilize previously sorbed toxic metals from filtration media (Paus and others, 2014). Likewise, hydrocarbons are trapped in the first few centimeters of soil and are potentially taken up by microorganisms; it is not uncommon for groundwater from infiltrated stormwater to contain organic compounds such as polycyclic aromatic hydrocarbons (Taguchi and others, 2020). As pointed out in Andres and others (2018, p. 1), “…using shallow groundwater for the disposal of todays' stormwater problems may only be delaying a problem rather than solving it.”
The pathways for contaminated stormwater to be transported from GI to groundwater vary depending on the practice and the construction. Vegetated basins and vegetated channels generally do not have lined bottoms so that stormwater can freely infiltrate deep into aquifers (Andres and others, 2018). Sediments below permeable pavements may accumulate nutrients, metals, deicing compounds, and hydrocarbons and with time may percolate to deeper substrates and eventually the groundwater table (Taguchi and others, 2020). Practices, such as vegetated basins and channels, disconnect impervious rooftops and sidewalks from local waterways, and storm drains generally do not have lined bottoms so that stormwater freely infiltrates into the ground, posing potential risks to groundwater (Andres and others, 2018). Potential contamination to groundwater from accumulation of nutrients, metals, and hydrocarbons in sediments below permeable pavement also is a concern (Taguchi and others, 2020). Fertilizers in contributing areas run-on and have the potential to wash into a permeable pavement system and infiltrate to groundwater. Wash off from streets onto permeable pavement may include metals or hydrocarbons.
During high inflow events, underdrains in some permeable pavement and bioswale systems may release stormflow almost directly to storm sewers. This reduced residence time in the GI basin may limit the filtering effect and increase the potential for contaminants to move to storm drains and eventually to streams (Stewart and others, 2017). The internal water storage system may also release increased phosphorus concentrations and loads in outflows during large events.
Performance of GI depends on infiltration to happen. Sediment transported to the site from construction and other activities can greatly reduce infiltration rates through clogging and compaction. Winter sand application clogged some sites after just 1 year when spring runoff carried high sediment loads (Selbig and others, 2019). The area most prone to clogging at permeable pavement sites may be the permeable/impermeable interface where the largest sediment load is deposited (Winston and others, 2015).
Vegetation and Soil Media
Vegetation and soil media can cause unintended consequences for vegetated basins and channels, tree canopy, and green roofs when materials selected are inadequate for the practice. Vegetation within these practices provide biological treatment that can permanently remove certain organic contaminants through biodegradation depending on the health of the vegetation and soil microorganisms (Taguchi and others, 2020); however, overuse of compost, fertilizer, irrigation, or other common landscaping practices can result in accelerated nutrient accumulation and lead to increased contaminant concentrations in stormwater throughflow (Taguchi and others, 2020). Vegetated basins and channels are often successful in reducing metal concentrations (common in street runoff), and export of phosphorus from accumulated sediments has been observed (Taguchi and others, 2020). Salt used for de-icing can also be harmful to vegetation in GI installations.
Trees that border streets contribute organic matter and nutrients, in the form of bulk solids as particles including leaves, pollen, nuts, and fruits, to streets (Taguchi and others, 2020). Janke and others (2017) demonstrated a strong relation among nitrogen and phosphorus concentrations and tree canopy over impervious surfaces. Coarse organic solids from trees are likely a major source of solids to storm drains (and to GI practices), increasing maintenance costs (Taguchi and others, 2020). Winter leaching of leaves may also be a major source of nutrients to winter stormwater (Taguchi and others, 2020). Tree canopy along roadways may funnel water to impervious surfaces. Locations beneath trees, draining pervious areas, and with higher traffic load were also more susceptible to clogging (Winston and others, 2015). Street sweeping can greatly reduce nutrient loading to stormwater (Selbig, 2016).
Atmospheric deposition and the addition of nutrients are the primary sources of contaminants from green roofs. Nutrient rich stormwater draining from green roofs can reach storm drains or infiltrate to groundwater if not routed to a secondary GI practice (Taguchi and others, 2020). Green roofs do not have contributing areas beyond the roof, therefore, run-on from other surfaces do not cause accumulation of contaminants. During dry conditions, green roofs may need irrigation. When vegetation dies and is not replaced, vegetated basins, vegetated channels, tree canopy, and green roofs lose the pollutant uptake and evapotranspiration benefits provided by the plants (U.S. Environmental Protection Agency, 2016b). Lack of vegetation can lead to lower porosity of soil media, preventing infiltration. Mulch requires less maintenance and provides some direct pollutant and sedimentation removal; however, it is organic and decomposes with time, potentially releasing nutrients to the environment. In addition, improper balance of soil amendments could also lead to nutrient export. Because vegetated basins and channels have the capacity to accumulate contaminants with time, contaminated soils may need to be periodically removed and replaced.
Maintenance
Vegetated basins, vegetated channels, urban tree canopy, and green roofs require planting, watering, fertilizing and other maintenance. Many of the unintended consequences associated with GI are because of lack of maintenance, and when not addressed properly this can lead to failure and high costs associated with restoration (U.S. Environmental Protection Agency, 2016b). Practices that serve highly impervious roadways and parking lots (such as vegetated basins, vegetated channels, and permeable pavements) require a high level of maintenance; without maintenance, these practices can be a source of high nutrient and sediment loads, heavy metals, and organic compounds to streams and groundwater. Increased sedimentation, because of lack of maintenance, may also cause localized flooding around the GI installation, and in some cases, cause worse flooding than preinstallation conditions; for example, the pavers at the Juarez High School (part of the Cermak-Blue Island Streetscapes Corridor, fig. 20) were never cleaned and had substantial deterioration in terms of infiltration performance and often pond water at the depression areas in the plaza and sidewalks (Kumar and others, 2017).
Research Needs
Most of the studies documented in this report are the result of monitoring individual local-scale GI installations. Information is needed to better understand scale, including: (1) how local practices affect catchment scale hydrology; (2) empirical evidence of the effectiveness of GI practices rather than rely solely on design or modeled results; (3) widescale, long-term monitoring studies to determine if practices are improving water-quality and reducing runoff to receiving waters: and (4) the performance of GI practices in a changing world.
Numerous studies have been published on the local plot or parcel scale summarizing water quantity and quality effects of various GI practices, however, there are few studies that scale the effects of GI practices from those measured and modeled at local scales to catchments of multiple spatial scales. This is important for managing catchments for targeted outcomes, such as maintenance of baseflow, minimizing peak flow, and reducing rapid pulses of pollutants to streams (Golden and Hoghooghi, 2018). For example, when the Shepherd Creek catchment in Cincinnati, Ohio reported only minor improvement in streamflow volume and water quality despite the installation of rain gardens on 30 percent of the properties, Roy and others (2014) concluded that further research is needed to quantitatively define the minimum effect threshold and restoration trajectories for retrofitting catchments. It is important to understand the relative contributions of different impervious areas within a catchment to effectively treat the watershed. Although disconnecting residential roof runoff from sewers and streams is beneficial at the parcel level, treatment of major impervious surfaces like roads, parking lots, and apartment buildings may be needed to produce watershed-level improvement. Research gaps include 1) relating the cumulative effects of GI practices on downstream hydrology and water quality, 2) understanding the extent to which these effects are expressed at nested catchments, 3) determining what factors, like land cover and soils, contribute to this response, and 4) identifying the optimal spatial configurations for these practices to ensure targeted catchment-scale management outcomes (Golden and Hoghooghi, 2018).
Many commonly cited environmental benefits of urban greenspace are still poorly supported by empirical evidence, adding to the difficulties in designing and implementing GI programs (Pataki and others, 2011). Because, most non-USGS studies do not provide associated datasets, it is difficult to compile harmonized results from multiple studies to synthesize broad-scale performances of different practices. Removal of atmospheric pollutants by vegetation is a commonly cited urban ecosystem service, yet it is one of the least supported empirically (Pataki and others, 2011). Widescale and long-term monitoring of receiving water bodies is critical to determine if practices are improving water-quality and reducing runoff. Many GI water-quality studies focus on reduction of nutrients and sediment; however, few address the success (or failure) of GI to mitigate heavy metal contamination and contaminants of emerging concern such as pharmaceutical chemicals and microplastic contamination in stormwater. Quantifying biogeochemical processes in urban areas with GI practices can improve our understanding of ecosystem services and disservices (negative or unintended consequences) resulting from designed urban green spaces (Pataki and others, 2011).
None of the studies reviewed addressed future challenges of GI practices to perform as designed. Infrastructure is designed for watershed conditions at the time of construction rather than factoring in future development and future weather patterns: climate change is expected to increase the frequency and intensity of extreme weather events (Taguchi and others, 2020). Loading of urban stormwater contaminants, like phosphorus, are expected to increase in colder regions like the Great Lakes because of increased winter rains (Taguchi and others, 2020). Some GI may be undersized if future rainfall projections are realized. Related to concerns over increased rainfall intensity, research to assess the viability of active versus passive GI practices could be beneficial. An example of an active practice is one that includes automated controls that could increase storage during intense rainfall or by-pass runoff to temporary storage in case of toxic spills.
The need for detailed published data on both the kind and numbers of GI and associated performance data is an example of other issues that remain (Jaffe and others, 2010). To be effective for research needs, these data must include information on design and size of GI structures. In addition, very few studies document the effectiveness and cumulative effect of multiple GI practices combined into a single watershed. Finally, complete sets of metadata would be helpful when data are published by researchers to enable other researchers to compare results.
As part of the GLRI, the EPA is committed to funding future efforts addressing stormwater runoff. It is expected that this investment will lead to efforts that will more than double the amount of stormwater runoff reduced through GI practices in the Great Lakes to 550 million gallons by the end of 2024 (Great Lakes Restoration, 2019). This type of support along with other GLRI-supported studies evaluating the performance of GI such as those highlighted in this report (Gary City Hall, Gary, Indiana; RecoveryPark, Detroit, Michigan; Niagara Street, Buffalo, New York), will help fill knowledge gaps in evaluating success and performance of GI. Still, much research is needed to better predict how GI can be used to mitigate the effects of increasing urbanization and future climate change.
Summary
GI practices can effectively enhance urban landscapes, increase resilience of aging infrastructure, and reduce flooding and contaminant vulnerability to waterways in the Great Lakes region while delivering a host of valuable benefits. It is generally agreed that GI practices are successful at restoring at least some hydrologic function and other human and beneficial uses in urban environments; however, current scientific knowledge, public understanding, and acceptance of GI practices for stormwater management is far from complete. By summarizing the selected published reports and data sources from studies done in the Great Lakes region, this report provides foundational information to help readers assess the ability of GI to restore the hydrologic cycle to a more natural condition and to repair human and ecological beneficial uses in Great Lakes urban areas. In addition, the report informs scientists and their state and local partners about the tradeoffs associated with installing GI, including the factors affecting performance and potential unintended consequences to human health and the environment sometimes associated with GI practices. Finally, knowledge gaps are highlighted to help national, state, and city planners and managers explore potential further scientific research in GI practices to make our cities and communities sustainable and attractive places to live and work. Key findings resulting from review of the many sources used to compile this report are listed here for easy reference:
-
• GI can be a viable approach to treat stormwater from urban settings.
-
• The number of GI installations throughout the Great Lakes region is rapidly increasing as cities and communities recognize and embrace the environmental benefits of more sustainable communities.
-
• Urban planners and developers recognize the value of creating aesthetically pleasing and inviting community spaces while also addressing the need to manage ever-increasing runoff volume and contamination caused by increasing impervious area, to outdated and aging infrastructure.
-
• The goal of GI is to minimize the disruption of the hydrologic cycle caused by the expansive impervious areas associated with urbanization and transform the landscape to mimic more natural conditions.
-
• The primary barriers to the adoption of GI in the Great Lakes region are lack of coordination among all levels of government, lack of clear and standard management guidelines, and unbased concern by planners that GI is a riskier investment than alternatives.
-
• Vegetated basins (rain gardens and bioretention ponds) and bioswales, the most numerous GI installations in the Great Lakes region, provide water storage, evapotranspiration, and infiltration, while trapping sediment and contaminants at the site, thereby reducing runoff volume and contamination to streams, rivers, and lakes.
-
• Permeable pavements, often used in parking lots and alleyways, infiltrate and store runoff from nearby impervious areas. Sediment and contaminants are thus prevented from reaching receiving waters.
-
• Urban tree canopy and green roofs decrease surface runoff by increasing infiltration and evapotranspiration. In addition, they can help mitigate the urban heat island effect.
-
• Nearly every study of every GI practice reported reduction in peak storm flow and volume at the GI site.
-
• Where studies monitored water quality, reduction in contaminant outflow had mixed results. Reductions were consistently seen for total suspended solids and suspended sediments.
-
• The primary factors that affect performance of GI practices include inadequate design, poor construction techniques (especially soil compaction resulting in reduced infiltration rates), lack of soil stabilization in the practice, inadequate pretreatment of sediment laden runoff, inadequate vegetation, and lack of proper maintenance.
-
• Often GI practices are initiated without full knowledge of potential unintended social, ecological, and human health consequences.
-
• One of the greatest potential negative consequences of GI is the infiltration of stormwater contaminants (such as nutrients, pesticides, metals, oil and grease, hazardous waste spills, and salts) to groundwater.
-
• Other unintended consequences include: (1) increased sedimentation or flooding compared to prepractice conditions because of lack of maintenance of the GI; (2) accumulation of contaminants in soils within the practice so that they eventually need to be removed and disposed of properly; (3) overuse of compost, fertilizer, irrigation, or other common landscaping practices resulting in accelerated nutrient accumulation and eventual release in stormwater; and (4) urban trees contributing organic matter and nutrients, in the form of bulk solids like leaves, pollen, nuts, and fruits to streets.
-
• Although numerous studies have been published about GI practices at the local scale, there are few that scale the effects of GI practices to catchments of multiple spatial scales.
-
• Many commonly cited environmental benefits of GI practices are still poorly supported by empirical evidence.
-
• Because most non-U.S. Geological Survey studies do not provide associated datasets, it is difficult to compile harmonized results from multiple studies to synthesize broad-scale performances of different practices.
-
• Very few studies address future challenges of GI practices to perform as designed especially when factoring in future development and future weather patterns.
Recognizing the critical importance of managing risk and improving resilience of our Great Lakes communities and ecosystems in the face of land use and climate change, the Great Lakes Restoration Initiative Action Plan III (2020–24) calls for the accelerating implementation of GI practices to capture urban runoff. The U.S. Environmental Protection Agency, the U.S. Geological Survey, and other Federal agencies are working with their State and local partners to evaluate the most effective ways to reduce stormwater runoff; improve water quality in our streams, rivers, and lakes; and protect our valuable groundwater resources.
References Cited
Andres, A.S., Ballestero, T.P., and Musick, M.L., 2018, Stormwater management—When is green not so green?: Ground Water, v. 56, no. 3, p. 357–358. [Also available at https://doi.org/10.1111/gwat.12653.]
Asleson, B.C., Nestingen, R.S., Gulliver, J.S., Hozalski, R.M., and Nieber, J.L., 2009, Performance assessment of rain gardens: Journal of the American Water Resources Association, v. 45, no. 4, p. 1019–1031. [Also available at https://doi.org/10.1111/j.1752-1688.2009.00344.x.]
Baldwin, A.K., Corsi, S.R., and Mason, S.A., 2016, Plastic debris in 29 Great Lakes tributaries: Relations to watershed attributes and hydrology: Environmental Science and Technology v. 50 no. 19, p. 10377–10385. [Also available at https://doi.org/10.1021/acs.est.6b02917.]
Basu, A., Sinha, S., and Caprenter, D., 2020, A survey of barriers and opportunities to adopting green stormwater infrastructure in Michigan: Michigan Sea Grant Report MICHU-20-502, 6 p., accessed December 2021 at https://www.michiganseagrant.org/wp-content/uploads/2020/01/Executive-Summary-GI-Barriers-Survey-January-2020.pdf.
Berghage, R., Beattie, D., Jarrett, A., Thurig, C., Razaei, F., and O’Conner, T., 2009, Green roofs for stormwater runoff control: Washington, D.C., U.S. Environmental Protection Agency, EPA/600/R–09/026, 89 p. [Also available at https://www.nps.gov/tps/sustainability/greendocs/epa%20stormwater-sm.pdf.]
Berland, A., Shiflett, S.A., Shuster, W.D., Garmestani, A.S., Goddard, H.C., Herrmann, D.L., and Hopton, M.E., 2017, The role of trees in urban stormwater management: Landscape and Urban Planning, v. 162, p. 167–177. [Also available at https://doi.org/10.1016/j.landurbplan.2017.02.017.]
Bratieres, K., Fletcher, T.D., Deletic, A., and Zinger, Y., 2008, Nutrient and sediment removal by stormwater biofilters—A large-scale design optimisation study: Water Research, v. 42, no. 14, p. 3930–3940. [Also available at https://doi.org/10.1016/j.watres.2008.06.009.]
Capitol Region District, 2021, Bioswales, stormwater, wastewater & septic: Capitol Region District web page, accessed on February 19, 2012, at https://www.crd.bc.ca/education/stormwater-wastewater-septic/green-stormwater-infrastructure/bioswales.
Capitol Region Water, 2017, Community greening plan: A green stormwater infrastructure plan for Harrisburg: Capitol Region Water, Harrisburg PA, City Beautiful H2O, 278 p. [Also available at https://capitalregionwater.com/wp-content/uploads/2017/04/Community-Greening-Plan_FINAL_smallest.pdf.]
Center For Neighborhood Technology, 2014, The prevalence and cost of urban flooding: A case study of Cook County, IL: The Center For Neighborhood Technology, May 2014–Revised Version, 32 p. [Also available at https://www.cnt.org/sites/default/files/publications/CNT_PrevalenceAndCostOfUrbanFlooding2014.pdf.]
Chaffin, B.C., Shuster, W.D., Garmestani, A.S., Furio, B., Albro, S.L., Gardiner, M., Spring, M., and Green, O.D., 2016, A tale of two rain gardens—Barriers and bridges to adaptive management of urban stormwater in Cleveland, Ohio: Journal of Environmental Management, v. 183, no. 2, p. 431–441. [Also available at https://doi.org/10.1016/j.jenvman.2016.06.025.]
Chicago Region Trees Initiative, 2022, Chicago Region Trees Initiative—Our trees, our communities, our future: Chicago Region Trees Initiative web page, accessed June 2022 at https://chicagorti.org/.
Christopher Burke Engineering, LLC, undated, Performance summary of green infrastructure practices and BMP fact sheet: Christopher Burke Engineering, LLC, 248 p., posted online by Indiana Office of Community & Rural Affairs, accessed September 15, 2015, at https://www.in.gov/ocra/files/Appendix-C-BMP-Fact-Sheets.pdf.
City of Milwaukee, 2019, City of Milwaukee green infrastructure plan: City of Milwaukee Environmental Collaboration Office, 70 p. [Also available at https://city.milwaukee.gov/ImageLibrary/WCC/Images/GreenLots/FINALGIPLAN--reduced_2.pdf.]
Coles, J.F., McMahon, G., Bell, A. H., Brown, L. R., Fitzpatrick, F. A., Scudder Eikenberry, B. C., Woodside, M. D., Cuffney, T. F., Bryant, W. L., Cappiella, K., Fraley-McNeal, L., and Stack, W. P., 2012, Effects of urban development on stream ecosystems in nine metropolitan study areas across the United States: U.S. Geological Survey Circular 1373, 138 p., accessed March 2022 at https://pubs.usgs.gov/circ/1373/.
Corsi, S.R., De Cicco, L.A., Lutz, M.A., and Hirsch, R.M., 2015, 2015, River chloride trends in snow-affected urban watersheds—Increasing concentrations outpace urban growth rate and are common among all seasons: Science of the Total Environment, v. 508, no. 1, p. 488–497. [Also available at https://doi.org/10.1016/j.scitotenv.2014.12.012.]
Danz, M.E., Selbig, W.R., and Buer, N.H., 2020, Assessment of restorative maintenance practices on the infiltration capacity of permeable pavement: Water (Basel), v. 12, no. 6, p. 1563. [Also available at https://doi.org/10.3390/w12061563.]
Darner, R.A., and Dumouchelle, D.H., 2011, Hydraulic characteristics of low-impact development practices in northeastern Ohio, 2008–2010: U.S. Geological Survey Scientific Investigations Report 2011–5165, 19 p. [Also available at https://doi.org/10.3133/sir20115165.]
Darner, R.A., Shuster, W.D., and Dumouchelle, D.H., 2015, Hydrologic characteristics of low-impact stormwater control measures at two sites in northeastern Ohio, 2008–13: U.S. Geological Survey Scientific Investigations Report 2015–5030, 27 p. [Also available at https://doi.org/10.3133/sir20155030.]
Davis, A.P., 2007, Field performance of bioretention—Water quality: Environmental Engineering Science, v. 24, no. 8, p. 1048–1064. [Also available at https://doi.org/10.1089/ees.2006.0190.]
Davis, A.P., Hunt, W.F., Traver, R.G., and Clar, M., 2009, Bioretention technology—Overview of current practices and future needs: Journal of Environmental Engineering, v. 135, no. 3, p. 109–117. [Also available at https://doi.org/10.1061/(ASCE)0733-9372(2009)135:3(109).]
Dumouchelle, D.H., and Darner, R.A., 2014, Visualization of soil-moisture change in response to precipitation within two rain gardens in Ohio: U.S. Geological Survey Data Series 837, 9 p. [Also available at https://doi.org/10.3133/ds837.]
Dugan, H.A., Skaff, N.K., Doubek, J.P., Bartlett, S.L., Burke, S.M., Krivak-Tetley, F.E., Summers, J.C., Hanson, P.C., and Weathers, K.C., 2020, Lakes at risk of chloride contamination: Environmental Science & Technology, v. 54, no. 11, p. 6639–6650. [Also available at https://doi.org/10.1021/acs.est.9b07718.]
Eisenberg, B., Lindow, K.C., and Smith, D.R., eds., 2015, Permeable pavements: Reston, Va., American Society of Civil Engineers, 249 p. [Also available at https://doi.org/10.1061/9780784413784.]
Feng, W., Hatt, B.E., McCarthy, D.T., Fletcher, T.D., and Deletic, A., 2012, Biofilters for stormwater harvesting—Understanding the treatment performance of key metals that pose a risk for water use: Environmental Science & Technology, v. 46, no. 9, p. 5100–5108. [Also available at https://doi.org/10.1021/es203396f.]
First Street Foundation, 2020, The first national flood risk assessment: Defining America’s growing risk: First Street Foundation, Inc., 163 p. [Also available at https://assets.firststreet.org/uploads/2020/06/first_street_foundation__first_national_flood_risk_assessment.pdf.]
Federal Interagency Stream Restoration Working Group, 1998, Stream corridor restoration: Principles, processes, and practices: GPO Item No. 0120-A; SuDocs No. A 57.6/2:EN 3/PT.653. ISBN-0-934213-59-3, 648 p. [Also available at https://nepis.epa.gov/Exe/ZyPDF.cgi/50000Y7R.PDF?Dockey=50000Y7R.PDF.]
Golden, H., and Hoghooghi, N., 2018, Green infrastructure and its catchment-scale effects—An emerging science: WIREs. Water, v. 5, no. 1, p. e1254. [Also available at https://doi.org/10.1002/wat2.1254.]
Great Lakes Commission, 2018, Great Lakes regional green infrastructure policy analysis—Addressing barriers to implementation: Great Lakes Commission and Credit Valley Conservation, 52 p. [Also available at https://www.glc.org/wp-content/uploads/GI-policy-analysis.pdf.]
Great Lakes Law, 2010, Addressing urban and agricultural runoff pollution in the Great Lakes Water Quality Agreement: Great Lakes Law web page, accessed March 2021 at https://www.greatlakeslaw.org/blog/2010/08/index.html.
Great Lakes Restoration, 2019, Great Lakes Restoration Initiative Action Plan III: Fiscal year 2020–fiscal year 2024: Great Lakes Restoration, https://www.epa.gov/sites/production/files/2019-10/documents/glri-action-plan-3-201910-30pp.pdf.
Gulliver, J.S., and Anderson, J.L., eds., 2008, Assessment of stormwater best management practices: University of Minnesota, 600 p. [Also available at https://www.wrc.umn.edu/sites/wrc.umn.edu/files/Assessment-of-Stormwater-Best-Management-Practices-Manual.pdf.]
Hand, C., 2010, Great Lakes Water Quality Agreement: Sources of nonpoint source pollution: White Paper developed for the Great Lakes Environmental Law Center, 24 p., [Also available at https://www.greatlakeslaw.org/files/Hand_GLWQA.pdf.]
Hoard, C.J., Haefner, R.J., Shuster, W.D., Pieschek, R.L., and Beeler, S., 2020, Full water-cycle monitoring in an urban catchment reveals unexpected water transfers (Detroit MI, USA): Journal of the American Water Resources Association, v. 56, no. 1, p. 82–99. [Also available at https://doi.org/10.1111/1752-1688.12814.]
Hunt, W.F., Jarrett, A.R., Smith, J.T., and Sharkey, L.J., 2006, Evaluating bioretention hydrology and nutrient removal at three field sites in North Carolina: Journal of Irrigation and Drainage Engineering, v. 132, no. 6, p. 600–608. [Also available at https://doi.org/10.1061/(ASCE)0733-9437(2006)132:6(600).]
Hunt, W.F., Smith, J.T., Jadlocki, S.J., Hathaway, J.M., and Eubanks, P.R., 2008, Pollutant removal and peak flow mitigation by a bioretention cell in urban Charlotte, NC: Journal of Environmental Engineering, v. 134, no. 5, p. 403–408. [Also available at https://doi.org/10.1061/(ASCE)0733-9372(2008)134:5(403).]
Illinois Sustainable Technology Center, 2012, Monitoring and documenting the performance of stormwater best management practices: Illinois Sustainable Technology Center for Neighborhood Technology with Hey and Associates Report TR-048, 72 p. [Also available at http://hdl.handle.net/2142/30660.]
i-Tree, 2020, i-Tree Hydro—Tools for assessing and managing forests & community trees: i-Tree web page, accessed January 22, 2021, at https://www.itreetools.org/tools/hydro.
Janke, B.D., Finlay, J.C., and Hobbie, S.E., 2017, Trees and streets as drivers of urban stormwater nutrient pollution: Environmental Science & Technology, v. 51, no. 17, p. 9569–9579. [Also available at https://doi.org/10.1021/acs.est.7b02225.]
Jaffe, M., Zeller, M., Minor, E., Gonzalez-Meler, M., Cotner, L.B., Massey, D., Ahmed, H., Elbers, M., Sprague, H., Wise, S., and Miller, B., 2010, The Illinois green infrastructure study—A report to the Illinois Environmental Protection Agency on the criteria in section 15 of Public Act 96-0026: The Illinois Green Infrastructure for Clean Water Act of 2009, 126 p., [Also available at http://www.epa.state.il.us/green-infrastructure/docs/draft-final-report.pdf.]
Kuehler, E., Hathaway, J., and Tirpak, A., 2017, Quantifying the benefits of urban forest systems as a component of the green infrastructure stormwater treatment network: Ecohydrology, v. 10, no. 3, p. e1813. [Also available at https://doi.org/10.1002/eco.1813.]
Kumar, K., Attarian, J., Hundal, L., Kozak, J., Cox, A., and Zhang, H., 2017, Monitoring the effectiveness of urban stormwater best management practices in the Cermak-Blue Island streetscapes corridor in Chicago, Illinois: Metropolitan Water Reclamation District of Greater Chicago, Monitoring and Research Department, Report no. 17–32, 99 p. [Also available at https://legacy.mwrd.org/irj/go/km/docs/documents/MWRD/internet/reports/Monitoring_and_Research/pdf/2017/17-32_Monitoring_Effectiveness_Urban_Stormwate r.pdf.]
Lebens, M., and Troyer, B., 2012, Porous asphalt pavement performance in cold regions: Minnesota Department of Transportation, Research Services, Office of Policy Analysis, Research and Innovation, 204 p. [Also available at https://www.dot.state.mn.us/research/TS/2012/2012-12.pdf.]
Li, H., and Davis, A.P., 2008, Heavy meatal capture and accumulation in bioretention media: Environmental Science & Technology, v. 42, no. 14, p. 5247–5253. [Also available at https://doi.org/10.1021/es702681j.]
Lucas, W.C., and Greenway, M., 2008, Nutrient retention in vegetated and nonvegetated bioretention mesocosms: Journal of Irrigation and Drainage Engineering, v. 134, no. 5, p. 613–623. [Also available at https://doi.org/10.1061/(ASCE)0733-9437(2008)134:5(613).]
Lyandres, O., and Welch, L.C., 2012, Reducing combined sewer overflows in the Great Lakes—Why investing in infrastructure is critical to improving water quality: Alliance for the Great Lakes, 21 p., [Also available at https://greatlakes.org/wp-content/uploads/2016/08/AGL_Reducing_CSO__14_FINAL-1.pdf.]
Minnesota Pollution Control Agency, 2021, Minnesota stormwater manual—Design criteria for bioretention: Minnesota Pollution Control Agency web page, accessed, February 17, 2021, at https://stormwater.pca.state.mn.us/index.php/Design_criteria_for_bioretention.]
Multi-Resolution Land Characteristics Consortium, 2020, NLCD 2016 Land Cover (CONUS): MRLC database, accessed November 16, 2020, at https://www.mrlc.gov/data?f%5B0%5D=category%3ATree%20Canopy&f%5B1%5D=region%3Aconus&f%5B2%5D=year%3A2016.
New York City Environmental Protection, 2012, NYC green infrastructure plan—2012 green infrastructure pilot monitoring report: New York City Environmental Protection, 49 p. [Also available at https://www1.nyc.gov/assets/dep/downloads/pdf/water/stormwater/green-infrastructure/2012-green-infrastructure-pilot-monitoring-report.pdf.]
Northeast Ohio Regional Sewer District, 2012, Green infrastructure plan April 23, 2012: Northeast Ohio Regional Sewer District report, 167 p., [Also available at https://www.neorsd.org/I_Library.php?a=download_file&LIBRARY_RECORD_ID=5526.]
Oberndorfer, E., Lundholm, J., Bass, B., Coffman, R.R., Doshi, H., Dunnett, N., Gaffin, S., Kohler, M., Liu, K.K.Y., and Rowe, B., 2007, Green roofs as urban ecosystems—Ecological 2 structures, functions, and services: Bioscience, v. 57, no. 10, p. 823–833. [Also available at https://doi.org/10.1641/B571005.]
Pataki, D.E., Carreiro, M.M., Cherrier, J., Grulke, N.E., Jennings, V., Pincetl, S., Pouyat, R.V., Whitlow, T.H., and Zipperer, W.C., 2011, Coupling biogeochemical cycles in urban environments—Ecosystem services, green solutions and misconceptions: Frontiers in Ecology and the Environment, v. 9, no. 1, p. 27–36. [Also available at https://doi.org/10.1890/090220.]
Paus, K.H., Morgan, J., Gulliver, J.S., Leiknes, T., and Hozalski, R.M., 2014, Effects of temperature and NaCl on toxic metal retention in bioretention media: Journal of Environmental Engineering, v. 140, no. 10, p. 04014034. [Also available at https://doi.org/10.1061/(ASCE)EE.1943-7870.0000847.]
Pennsylvania Department of Environmental Protection, 2006, Pennsylvania stormwater best management practices manual: Pennsylvania Department of Environmental Protection, 685 p. [Also available at https://pecpa.org/wp-content/uploads/Stormwater-BMP-Manual.pdf.]
Pitt, R., Lantrip, J., and Harrison, R., 1999, Infiltration through disturbed urban soils and compost-amended soil effects on runoff quality and quantity: U.S. Environmental Protection Agency National Risk Management Research Laboratory Office of Research and Development report EPA/600/R-99/016, 244 p. [Also available at https://nepis.epa.gov/Exe/ZyPDF.cgi/P1000OBH.PDF?Dockey=P1000OBH.PDF.]
PRISM Climate Group, 2020, 30-Year normals 1981-2010: PRISM Climate Group, Northwest Alliance for Computational Science and Engineering database, accessed November 9, 2020, at https://prism.oregonstate.edu/normals/.
Quinn, F.H., 1992, Hydraulic residence times for the Laurentian Great Lakes: Journal of Great Lakes Research, v. 18, no. 1, p. 22–28. [Also available at https://doi.org/10.1016/S0380-1330(92)71271-4.]
Ramirez, C.E., Williams, C., and Donnelly F.X., Rain pain: Metro residents recover from floods brace for storms: The Detroit News, published May 1, 2019, accessed March 15, 2021, at https://www.detroitnews.com/story/news/local/michigan/2019/05/01/flooding-closes-southfield-fwy-dearborn-nb-lodge-jefferson/3637424002/.
Robertson, D.M., and Saad, D.A., 2011, Nutrient inputs to the Laurentian Great Lakes by source and watershed estimated using SPARROW watershed models: Journal of the American Water Resources Association, v. 47, no. 5, p. 1011–1033. [Also available at https://doi.org/10.1111/j.1752-1688.2011.00574.x.]
Robertson, D.M., Saad, D.A., and Benoy, G.A., Vouk, Ivana, Schwarz, G.E., and Laitta, M.T., 2019, Phosphorus and nitrogen transport in the binational Great Lakes Basin estimated using SPARROW watershed models: Journal of the American Water Resources Association, v. 55, no. 6, 24 p. [Also available at https://doi.org/10.1111/1752-1688.12792.]
Roy, A.H., Rhea, L.K., Mayer, A.L., Shuster, W.D., Beaulieu, J.J., Hopton, M.E., Morrison, M.A., and St. Amand, A., 2014, How much is enough? Minimal responses of water quality and stream biota to partial retrofit stormwater management in a suburban neighborhood: PLoS ONE, v. 9, no. 1, p. e85011. [Also available at https://doi.org/10.1371/journal.pone.0085011.]
Schaefer, V.R., Kevern, J.T., and Shields-Cook, S., 2012, Pervious concrete—Moving in the cold: Roads & Bridges webpage, accessed November 16, 2020, at https://www.roadsbridges.com/pervious-concrete-moving-cold.
Schuler, M.S., and Relyea, R.A., 2018, A review of the combined threats of road salts and heavy metals to freshwater systems: Bioscience, v. 68, no. 5, p. 327–335. [Also available at https://doi.org/10.1093/biosci/biy018.]
Selbig, W.R., 2016, Evaluation of leaf removal as a means to reduce nutrient concentrations and loads in urban stormwater: Science of the Total Environment, v. 571, p. 124–133. [Also available at https://doi.org/10.1016/j.scitotenv.2016.07.003.]
Selbig, W.R., and Balster, N., 2010, Evaluation of turf grass and prairie vegetated rain gardens in a sand and clay soil—Madison, Wisconsin, water years 2004 – 08: U.S. Geological Survey, Scientific Investigations Report 2010–5077, 75 p. [Also available at https://doi.org/10.3133/sir20105077.]
Selbig, W.R., and Bannerman, R.T., 2008, A comparison of runoff quantity and quality from two small basins undergoing implementation of conventional- and low-impact-development (LID) strategies—Cross Plains, Wisconsin, water years 1999–2005: U.S. Geological Survey Scientific Investigations Report 2008–5008, 57 p. [Also available at https://doi.org/10.3133/sir20085008.]
Selbig, W.R., Jopke, P.L., Marshall, D.W., and Sorge, M.J., 2004, Hydrologic, Ecologic, and Geomorphic Responses of Brewery Creek to Construction of a Residential Subdivision, Dane County, Wisconsin, 1999–2002: U.S. Geological Survey Scientific Investigations Report 2004–5156, 41 p. [Also available at https://doi.org/10.3133/sir20045156.]
Selbig, W.R., and Buer, N., 2018, Hydraulic, water-quality, and temperature performance of three types of permeable pavement under high sediment loading conditions: U.S. Geological Survey Scientific Investigations Report 2018–5037, 44 p. [Also available at https://doi.org/10.3133/sir20185037.]
Selbig, W.R., Buer, N., and Danz, M.E., 2019, Stormwater-quality performance of lined permeable pavement systems: Journal of Environmental Management, v. 251, no. 1. [Also available at https://doi.org/10.1016/j.jenvman.2019.109510.]
Selbig, W.R., Loheide, S.P., Shuster, W., Scharenbroch, B.C., Coville, R.C., Kruegler, J., Avery, W., Haefner, R., and Nowak, D., 2021, Quantifying the stormwater runoff volume reduction benefits of urban street tree canopy: Science of the Total Environment, 806(3), 9 p. [Also available at https://doi.org/10.1016/j.scitotenv.2021.151296.]
Sinha, S.K., Tettit, R., Ridgway, A.E., Silfen, J., Peralta, G. and Cannito, G., 2017, Public private partnerships and finance of large-scale green infrastructure in the Great Lakes Basin: Environmental Consulting & Technology, Inc., report, 46 p. [Also available at https://mk0ectinc0oif6nymsp2.kinstacdn.com/wp-content/uploads/2019/05/Public-Private-Partnerships-and-Private-Finance-of-Large-Scale-Green-Infrastruct ure-In-Great-Lakes-an-ECT-Report.pdf.]
Shuster, W.D., Gehring, R., and Gerken, J., 2007, Prospects for enhanced groundwater recharge via infiltration of urban storm water runoff: A case study: Journal of Soil and Water Conservation, v. 62, no. 3, 8 p. [Also available at https://www.jswconline.org/content/62/3/129.]
Shuster, W.D., Darner, R.A., Schifman, L.A., and Herrmann, D.L., 2017, Factors contributing to the hydrologic effectiveness of a rain garden network (Cincinnati OH USA): Infrastructures, v. 2, no. 3, 14 p. [Also available at https://doi.org/10.3390/infrastructures2030011.]
Shuster, W.D., and Darner, R.A., 2018, Hydrologic performance of retrofit rain gardens in a residential neighborhood (Cleveland Ohio USA) with a focus on monitoring methods: U.S. Environmental Protection Agency report EPA/600/R-18/191 44 p. [Also available at https://cfpub.epa.gov/si/si_public_record_report.cfm?Lab=NRMRL&dirEntryId=341951.]
Stewart, R.D., Joong, G.L., Shuster, W.D., and Darner, R.A., 2017, Modelling hydrological response to a fully‐monitored urban bioretention cell: Hydrological Processes, v. 31, no. 26, p. 4626–4638. [Also available at https://doi.org/10.1002/hyp.11386.]
Sustainable Technologies Evaluation Program, 2018, Permeable pavements maintenance: Sustainable Technologies Evaluation Program, Technical Briefs, Resource Library: Water, accessed May 4, 2022, at https://sustainabletechnologies.ca/app/uploads/2018/02/Permeable-Pavement-Fact-Sheet.pdf.
Taguchi, V.J., Weiss, P.T., Gulliver, J.S., Klein, M.R., Hozalski, R.M., Baker, L.A., Finlay, J.C., Keeler, B.L., and Nieber, J.L., 2020, It is not easy being green—Recognizing unintended consequences of green stormwater infrastructure: Water (Basel), v. 12, no. 2, 33 p. [Also available at https://doi.org/10.3390/w12020522.]
Talebi, L., 2014, Assessment of integrated green infrastructure-based stormwater controls in small to large scale developed urban watersheds: Tuscaloosa, Alabama, The University of Alabama, Ph.D. Dissertation, 620 p. [Also available at http://unix.eng.ua.edu/~rpitt/Publications/11_Theses_and_Dissertations/Leila_Dissertation.pdf.]
Thurston, H.W., Roy, A.H., Shuster, W.D., Morrison, M.A., Taylor, M.A., and Cabezas, H., 2008, Using economic incentives to manage stormwater runoff in the Shepherd Creek Watershed, part I: U.S. Environmental Protection Agency, Washington, D.C., EPA/600/R-08/129 (NTIS PB2009-103249), 66 p. [Also available at https://nepis.epa.gov/Exe/ZyPDF.cgi/P1002Q4G.PDF?Dockey=P1002Q4G.PDF.]
Traver, R.G., 2002, VUSP ~ PaDEP—Best management practice national monitoring site: Villanova’s Urban Stormwater BMP Research and Demonstration site report, 8 p. [Also available at https://www1.villanova.edu/content/dam/villanova/engineering/vcase/sym-presentations/2003/1C4.pdf.]
U.S. Department of Agriculture, undated, Rain gardens, Iowa rain garden design and installation manual: U.S. Department of Agriculture Natural Resources Conservation Service, Iowa Storm Water Education Program, and Iowa Department of Agriculture report, 32 p. [Also available at https://www.nrcs.usda.gov/Internet/FSE_DOCUMENTS/nrcs142p2_007154.pdf.]
U.S. Department of Agriculture, 2009, Pervious paving: U.S. Department of Agriculture, Natural Resources Conservation Service webpage, accessed January 20, 2021, at https://www.nrcs.usda.gov/Internet/FSE_DOCUMENTS/nrcs144p2_029024.pdf.
U.S. Department of Agriculture, 2019, U.S. General Soil Map (STATSGO2) CONUS: U.S. Department of Agriculture database, accessed November 10, 2020, at https://nrcs.app.box.com/v/soils.
U.S Environmental Protection Agency, 2010, Green infrastructure case studies; municipal policies for managing stormwater with green infrastructure: U.S. Environmental Protection Agency report EPA–841–F–10–004, 76 p. [Also available at https://nepis.epa.gov/Exe/ZyPDF.cgi/P100FTEM.PDF?Dockey=P100FTEM.PDF.]
U.S. Environmental Protection Agency, 2014a, Addressing green infrastructure design challenges in the Pittsburgh Region, clay soils: 2012 Green Infrastructure Technical Assistance Program, U.S. Environmental Protection Agency, report EPA 800–R–14–004, 24 p. [Also available at https://www.epa.gov/sites/production/files/2015-10/documents/pittsburgh-united-clay-soils-508.pdf.]
U.S. Environmental Protection Agency, 2014b, Greening CSO plans: Planning and modeling green infrastructure for combined sewer overflow (CSO) control: U.S. Environmental Protection Agency report 832–R–14–001, 38 p. [Also available at https://www.epa.gov/sites/production/files/2015-10/documents/greening_cso_plans_0.pdf.]
U.S. Environmental Protection Agency, 2016a, Report to Congress: Combined sewer overflows to the Great Lakes Basin: U.S. Environmental Protection Agency Office of Wastewater Management report EPA 833–R–16–006, 104 p. [Also available at https://www.epa.gov/sites/production/files/2016-05/documents/gls_cso_report_to_congress_-_4-12-2016.pdf.]
U.S. Environmental Protection Agency, 2016b, Operation and maintenance of green infrastructure receiving runoff from roads and parking lots: U.S. Environmental Protection Agency Technical Memorandum EP-BPA–13–R5–0001, 23 p. [Also available at https://www.epa.gov/sites/production/files/2016-11/documents/final_gi_maintenance_508.pdf.]
U.S. Environmental Protection Agency, 2017a, National water quality inventory: Report to Congress: U.S. Environmental Protection Agency report EPA 841–R–16–011, 21 p. [Also available at https://www.epa.gov/sites/production/files/2017-12/documents/305brtc_finalowow_08302017.pdf.]
U.S. Environmental Protection Agency, 2017b, National Stormwater Calculator (SWC): U.S. Environmental Protection Agency fact sheet, EPA/600/F–13/095d, 2 p. [Also available at https://www.epa.gov/sites/default/files/2017-09/documents/swc_technical_factsheet_update_final_9-28-17.pdf.]
U.S. Environmental Protection Agency, 2020, U.S. Great Lakes areas of concern: U.S. Environmental Protection Agency, Great Lakes AOCs, accessed October 2, 2020, at https://www.epa.gov/great-lakes-aocs/list-great-lakes-aocs.
U.S. Environmental Protection Agency, 2021a, Facts and figures about the Great Lakes: U.S. Environmental Protection Agency web page, accessed March 2021 at https://www.epa.gov/greatlakes/facts-and-figures-about-great-lakes.
U.S. Environmental Protection Agency, 2021b, EPA Grantees Develop Tool to Help Water Resources Managers Make Stormwater Infrastructure Decisions: U.S. Environmental Protection Agency web page, accessed June 2021 at https://www.epa.gov/sciencematters/epa-grantees-develop-tool-help-water-resources-managers-make-stormwater.
U.S. Environmental Protection Agency, 2021c, What is green infrastructure?: U.S. Environmental Protection Agency web page, accessed June 2021 at https://www.epa.gov/green-infrastructure/what-green-infrastructure.
U.S. Environmental Protection Agency, and Environment and Climate Change Canada, 2020, State of the Great Lakes 2019—Highlights report: U.S. Environmental Protection Agency and Environment and Climate Change Canada report, 35 p., accessed June 2021 at https://binational.net/wp-content/uploads/2020/05/May-4.2020-2019-SOGL-FINAL.pdf.
U.S. Geological Survey, 2021a, Assessing stormwater reduction using green infrastructure—Gary City Hall (Gary, Ind.): U.S. Geological Survey web page, accessed February 16, 2021, at https://www.usgs.gov/centers/umid-water/science/assessing-stormwater-reduction-using-green-infrastructure-gary-city-hall?qt-science_center_objects=0#q t-science_center_objects.
U.S. Geological Survey, 2021b, Assessing stormwater reduction using green infrastructure—Niagara River Greenway Project (Buffalo, NY): U.S. Geological Survey web page, accessed January 29, 2021, at https://www.usgs.gov/centers/umid-water/science/assessing-stormwater-reduction-using-green-infrastructure-niagara-river?qt-science_center_objects=0#qt -science_center_objects.
U.S. Geological Survey, 2021c, Assessing stormwater reduction through green infrastructure—Recovery Park (Detroit, Mich.): U.S. Geological Survey web page, accessed January 25, 2021, at https://www.usgs.gov/centers/umid-water/science/assessing-stormwater-reduction-through-green-infrastructure-recoverypark?qt-science_center_objects=0#q t-science_center_objects.
U.S. Geological Survey, 2021d, Monitoring and predicting the impacts of trees on urban stormwater volume reduction: U.S. Geological Survey web page, accessed January 22, 2021, at https://www.usgs.gov/centers/umid-water/science/monitoring-and-predicting-impacts-trees-urban-stormwater-volume-reduction?qt-science_center_objects=0# qt-science_center_objects.
Weiss, P.T., Kayhanian, M., Khazanovich, L., and Gulliver, J.S., 2015, Permeable pavements in cold climates: State of the art and cold climate case studies: Minnesota Department of Transportation, final report #2015–30, 365 p. [Also available at https://www.lrrb.org/pdf/201530.pdf.]
Winston, R.J., Dorsey, J.D., and Hunt, W.F., 2015, Monitoring the performance of bioretention and permeable pavement stormwater controls in northern Ohio: Hydrology, water quality, and maintenance needs: Prepared for Chagrin River Watershed Partners, Inc., National Oceanic and Atmospheric Administration award no. NA09NOS4190153. [Also available at https://crwp.org/wp-content/uploads/2020/09/OH_StormwaterControls_MonitoringReport2015.pdf.]
Winston, R.J., Dorsey, J.D., and Hunt, W.F., 2016, Quantifying volume reduction and peak flow mitigation for three bioretention cells in clay soils in northeast Ohio: Science of the Total Environment, v. 553, p. 83–95. [Also available at https://doi.org/10.1016/j.scitotenv.2016.02.081.]
Winston, R.J., Dorsey, J.D., Smolek, A.P., and Hunt, W.F., 2018, Hydrologic performance of four permeable pavement systems constructed over low-permeability soils in Northeast Ohio: Journal of Hydrologic Engineering, v. 23, no. 4, p. 04018007. [Also available at https://doi.org/10.1061/(ASCE)HE.1943-5584.0001627.]
Winston, R.J., Arend, K., Dorsey, J.D., and Hunt, W.F., 2020, Water quality performance of a permeable pavement and stormwater harvesting treatment train stormwater control measure: Blue-Green Systems, v. 2, no. 1, p. 91–111. [Also available at https://doi.org/10.2166/bgs.2020.914.]
Wisconsin Department of Natural Resources, 2016, Stormwater post-construction technical standards for permeable pavement (1008): Wisconsin Department of Natural Resources, Storm Water Technical Standards, Models and BMPS report, accessed March 2021 at https://dnr.wi.gov/topic/Stormwater/standards/postconst_standards.html.
Appendix 1. Supplemental Table
Conversion Factors
U.S. customary units to International System of Units
International System of Units to U.S. customary units
Datum
Vertical coordinate information is referenced to the North American Vertical Datum of 1988 (NAVD 88).
Horizontal coordinate information is referenced to the North American Datum of 1983 (NAD 83).
Supplemental Information
Concentrations of chemical constituents in water are given in milligrams per liter (mg/L).
Load is given in metric tons per year (t/yr).
For more information about this publication, contact:
Director, USGS Upper Midwest Water Science Center
1 Gifford Pinchot Drive
Madison, WI 53726
For additional information, visit: https://www.usgs.gov/centers/upper-midwest-water-science-center
Publishing support provided by the Indianapolis Publishing Service Center
Disclaimers
Any use of trade, firm, or product names is for descriptive purposes only and does not imply endorsement by the U.S. Government.
Although this information product, for the most part, is in the public domain, it also may contain copyrighted materials as noted in the text. Permission to reproduce copyrighted items must be secured from the copyright owner.
Suggested Citation
Baker, N.T., Sullivan, D.J., Selbig, W.R., Haefner, R.J., Lampe, D.C., Bayless, R., and McHale, M.R., 2022, Green infrastructure in the Great Lakes—Assessment of performance, barriers, and unintended consequences: U.S. Geological Survey Circular 1496, 70 p., https://doi.org/10.3133/cir1496.
ISSN: 2330-5703 (online)
Study Area
| Publication type | Report |
|---|---|
| Publication Subtype | USGS Numbered Series |
| Title | Green infrastructure in the Great Lakes—Assessment of performance, barriers, and unintended consequences |
| Series title | Circular |
| Series number | 1496 |
| DOI | 10.3133/cir1496 |
| Publication Date | August 25, 2022 |
| Year Published | 2022 |
| Language | English |
| Publisher | U.S. Geological Survey |
| Publisher location | Reston, VA |
| Contributing office(s) | New York Water Science Center, Wisconsin Water Science Center, Ohio-Kentucky-Indiana Water Science Center, Upper Midwest Water Science Center |
| Description | Report: ix, 70 p.; 1 Table |
| Country | United States |
| State | Illinois, Indiana, Michigan, Minnesota, New York, Ohio, Pennsylvania, Wisconsin |
| Online Only (Y/N) | Y |
| Additional Online Files (Y/N) | Y |