

Albuquerque Seismological Laboratory Strategic Vision
Links
- Document: Report (55.7 MB pdf) , HTML , XML
- Download citation as: RIS | Dublin Core
Acknowledgments
This work has benefited from discussions with the EarthScope Global Seismographic Network (GSN) Advisory Committee. We have also benefited from discussions and help from all of the Albuquerque Seismological Laboratory (ASL) field staff as well as staff at the National Earthquake Information Center (NEIC).
We thank Cecily Wolfe (U.S. Geological Survey [USGS]) for helpful comments that improved this work. We also thank Bill Barnhart (USGS) for a helpful review and a number of suggestions that improved the overall readability of the paper. We thank Monica Erdman (USGS) for help with the template process as well as reviewing for format issues.
Abstract
This circular presents a strategic outlook for the U.S. Geological Survey (USGS) Albuquerque Seismological Laboratory (ASL) for the next 10 years (2026–36). The ASL is a USGS field office in the Geological Hazards Science Center that operates portions of the Advanced National Seismic System and the Global Seismographic Network and focuses on fundamental research for instrumentation testing and data quality. The strategic outlook is categorized into two types of tasks: “Foundational Tasks” and “Aspirational Tasks.” Foundational Tasks are those that maintain the laboratory’s basic operations and services, including regional and global seismic monitoring, improving data quality, and providing instrument testing and support. A suite of Aspirational Tasks is also articulated; these can be considered priority targets of ASL that could improve ASL’s seismic monitoring capabilities and mission. Such tasks include improvements to remote stations, testing capabilities of nonseismic geophysical instruments, detection threshold monitoring, rapid aftershock deployments, and expanding seismic monitoring networks. This report was written with input from the USGS Geological Hazards Science Center, the USGS Earthquake Hazards Program (EHP), and colleagues with an interest in the work done by the ASL. Although the details of these tasks may change, this document can provide guidance on the overarching tasks at the ASL from 2026 to 2036 and an overview of the various components of the ASL and how they fit into the EHP and the Global Seismographic Network Program.
Plain Language Summary
The Albuquerque National Laboratory is a U.S. Geological Survey field office in the Geological Hazards Science Center that operates portions of the Advanced National Seismic System and the Global Seismographic Network and focuses on fundamental research for instrumentation testing and data quality. These seismic networks provide the data used by the U.S. Geological Survey to meet the needs of earthquake monitoring within the multi-agency National Earthquake Hazard Reduction Program. This report highlights the key priorities of the Albuquerque National Laboratory during the next ten years (2026–36) and indicates where the laboratory could focus efforts to improve earthquake monitoring.
Introduction
Earthquakes are a nationwide hazard that affects more than half of the American population and causes $14.7 billion in annualized loses (Jaiswal and others, 2023). Additionally, international earthquakes have the potential to directly affect the United States' economic, strategic, and security interests while providing opportunities to understand the effects of large earthquakes that will one day occur within the United States. The first step in mitigating these effects and working toward a more earthquake-resilient Nation is robust and timely earthquake monitoring through national and global seismic networks. The seismic networks operated by the Albuquerque Seismological Laboratory (ASL) provide the data used for prompt earthquake alerting by the National Earthquake Information Center (NEIC), rapid tsunami warnings by the National Oceanic and Atmospheric Administration (NOAA) Tsunami Warning Centers, and the global explosion detection and monitoring mission of the U.S. Air Force Technical Applications Center.
The ASL is a U.S. Geological Survey (USGS) field office in the Geological Hazards Science Center (GHSC) that operates portions of the Advanced National Seismic System (ANSS) and the Global Seismographic Network (GSN). These networks provide the data necessary for the USGS to meet the needs of earthquake monitoring within the multi-agency National Earthquake Hazard Reduction Program (NEHRP). The ANSS and GSN Program reside within the Natural Hazards Mission Area (NHMA) and are operated by the ASL. The ASL is located on the Isleta Pueblo, New Mexico, approximately 15 miles south of Albuquerque in Valencia County. The ASL is also active in instrumentation research and data quality. Isleta Pueblo is one of the seismically quietest locations in the world (Moore and others, 2019) and has a world-class facility for studies that improve our ability to record ground motions in support of the USGS’s Earthquake Hazards Program (EHP) and the Volcano Hazards Program (VHP). The ASL also collaborates with the Geomagnetism Program.
The ASL was established in 1961 by the U.S. Coast & Geodetic Survey (USC&GS) to address the needs of seismic instrumentation testing and development (fig. 1). Along with instrumentation testing and development, it was envisioned that the ASL would be a resource for supporting USC&GS seismic networks and instrumentation as Isleta Pueblo was found to be one of the seismically quietest locations in the United States at 1 hertz (Hz; Moore and others, 2019). From 1961–78, the World-Wide Standardized Seismograph Network (WWSSN; Peterson and Hutt, 2014) was designed after it was funded by the Defense Advanced Research Projects Agency. The ASL was also used for network operations for the WWSSN, and on June 19, 1961, the ASL opened and began network installation and operation of the WWSSN (fig. 2). Buildout was completed in 1967 (Peterson and Hutt, 2014). This network served as the first standardized global network. When the network was closed in 1996, many sites were already being utilized by the GSN (Peterson and Hutt, 2014).
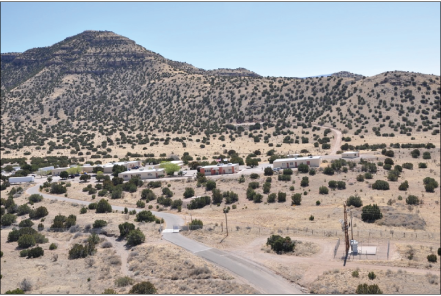
Photograph of the Albuquerque Seismological Laboratory taken from Kirtland Air Force Base looking south toward the lab. The underground vaults are on the side of the hill in the back. This location was selected for being an exceptionally low-noise site. Photograph by the U.S. Air Force.
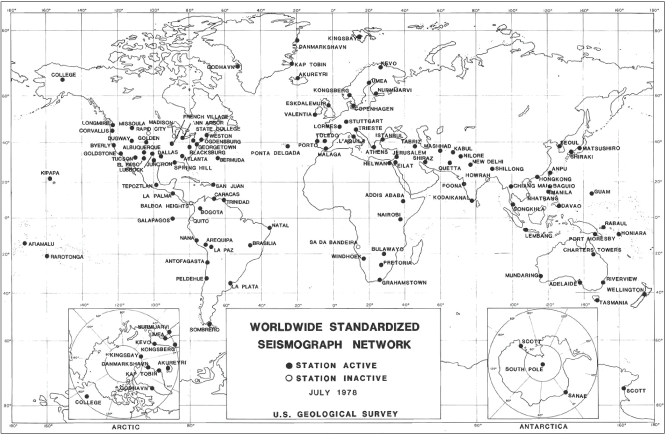
U.S. Geological Survey world map showing the World-Wide Standardized Seismograph Network in July 1978. Reproduced from Peterson and Hutt (2014).
The WWSSN was later augmented by the high-gain long period (HGLP) network, which was the first digital seismic network operated by the ASL. Along with the HGLP network, several other networks (Seismic Research Observatories [SRO]; the modified HGLP [ASRO]; the Digital WWSSN [DWWSSN]; and the China Digital Seismograph Network [CDSN]) made up the network known as the Global Digital Seismic Network (GDSN; Ringler and others, 2022). From 1971 to 1979, reorganization efforts were carried out in the U.S. Government. In 1971, the ASL was transferred from USC&GS to NOAA before permanently moving to the USGS in 1974. During this same time, the NEIC was moved to Boulder, Colorado, and in 1974, it was moved again, to its present location, in Golden, Colorado (Wilson and others, 2024).
The instrumentation that made up the various networks in the GDSN was limited in bandwidth, which presented shortcomings in the data being collected. For example, many of the very low-frequency signals, such as normal modes, were not recorded by these instruments, and the instruments tended to be only partially shielded from atmospheric disturbances. To address these shortcomings and to provide more uniform global coverage, a collaboration between the National Science Foundation (NSF), the Incorporated Research Institutions for Seismology (IRIS, which subsequently became the EarthScope Consortium), and the USGS was formed to establish the GSN. The GSN was built on the footprint of the GDSN and the International Deployment of Accelerometers (IDA) network, which was operated by the University of California, San Diego. This network of approximately 150 globally distributed very broadband (VBB) seismic stations provides a multiuse network of near real-time data used for global earthquake alerts and situational awareness products, tsunami warnings, national security (through nuclear test treaty monitoring and research), seismic hazard assessments and earthquake loss reduction, and research on earthquake sources and the structure and dynamics of the Earth (fig. 3 and table 1). By “very broadband” we refer to a sensor whose passband allows us to record the entire seismic spectrum (from Earth tides to near-field high-frequency occurrences). The GSN is a partnership between the USGS and NSF and is implemented in partnership with the EarthScope Consortium and many other entities.
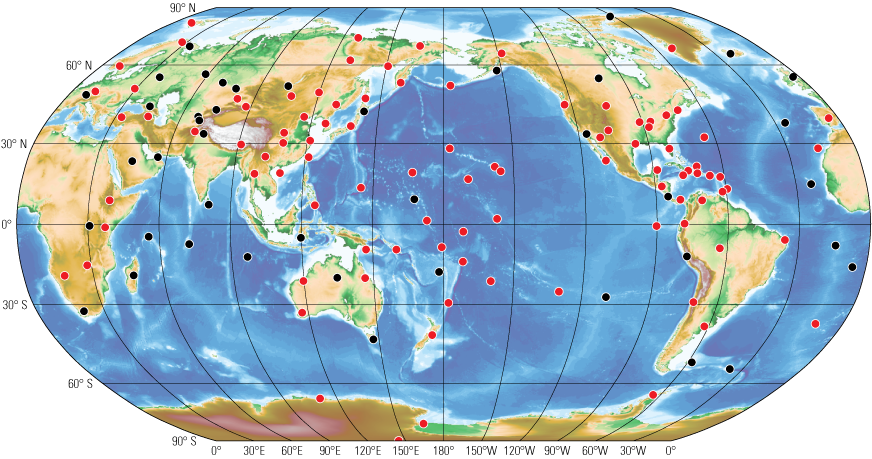
Map showing the Global Seismographic Network in 2024 (modified from Tozer and others, 2019). Red circles denote U.S. Geological Survey stations, and green circles denote National Science Foundation stations operated by EarthScope and the International Deployment of Accelerometers.
Table 1.
List of Global Seismographic Network stations (National Science Foundation, 2025).[U.K., United Kingdom, U.S.A., United States of America]
Stations with network code II are operated by the National Science Foundation; all other stations are operated by the U.S. Geological Survey.
Station lists available from EarthScope Consortium (National Science Foundation, 2025).
Along with operating the USGS GSN, the ASL also operates the ANSS U.S. backbone network of 57 national stations, the Central and Eastern U.S. Network (N4), the Intermountain West Seismic Network (IW), and the New England Seismic Network (NE) regional networks. The ASL provides instrumentation and support for aftershock stations and other specialized studies through the Geological Survey network (GS). The ASL also supports the other ANSS networks by operating an instrumentation depot, the ANSS Depot, where network operators can request new equipment or have malfunctioning equipment repaired (fig. 4).
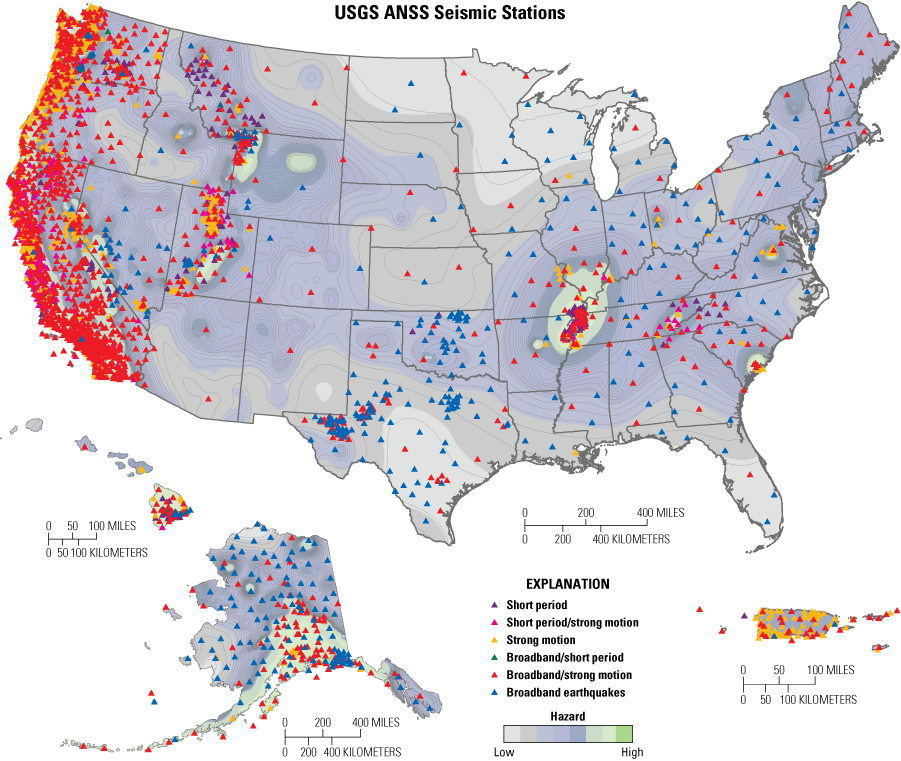
Map showing the Advanced National Seismic System (ANSS) with locations of ANSS stations and the kind of instrument at each station. The shading indicating hazard level is defined by the U.S. Geological Survey national seismic hazard model (Peterson and others, 2024).
In addition to network operations, the ASL tests and develops instrumentation. Its facility includes a state-of-the-art underground vault (fig. 5A–D), a surface vault with shake tables, and more than 20 postholes and boreholes at a range of depths, making it a world-class facility (fig. 6A–D).
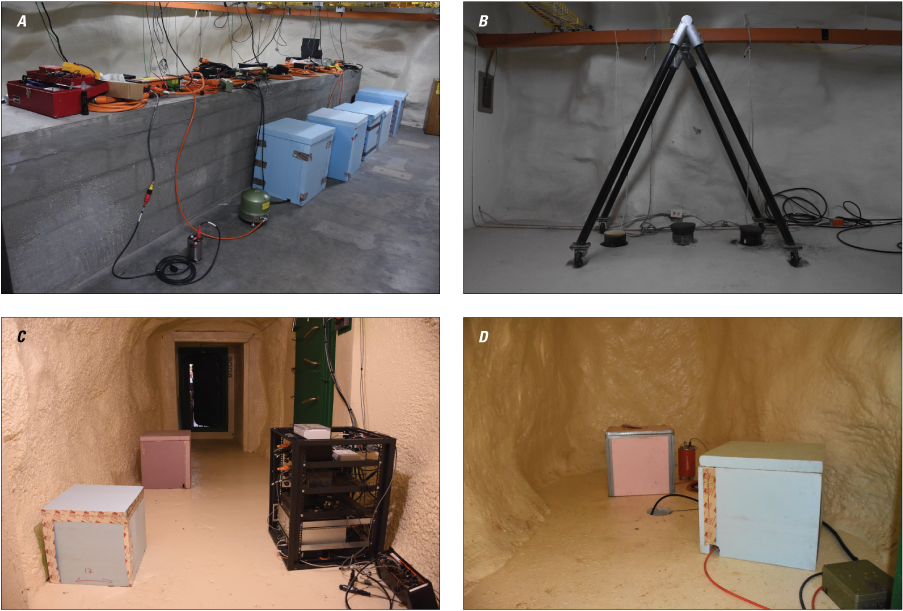
Photographs of the Albuquerque Seismological Laboratory underground vault. A, instruments being tested in the east portion of the underground vault, B, winch and location of three boreholes in the west portion of the underground vault, C, cross-tunnel and recording equipment for the reference sensor vault, and D, reference sensor vault, which contains a vertical STS-1 seismometer, reference STS-2 seismometer, a vertical GS-13 geophone, and a posthole STS-6 seismometer. Photographs by Corey Beutel, Albuquerque Seismological Laboratory, September 2024.
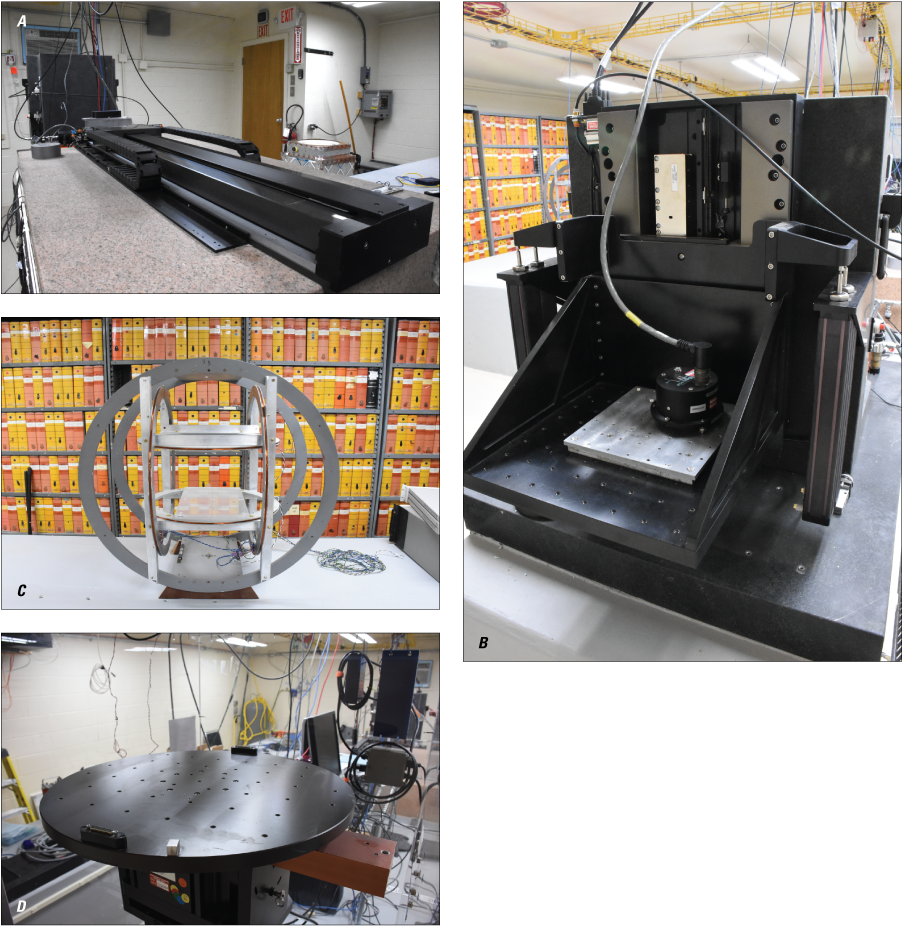
Photographs of equipment housed in the Albuquerque Seismological Laboratory surface vault. A, the air-bearing horizontal shake table stage with laser triangulation transducer, B, the air-bearing vertical shake table stage, C, a three-component Helmholtz coil for measuring magnetic sensitivity or zeroing out the magnetic field, and D, the mechanical rotational shake table. Photographs by Corey Beutel, Albuquerque Seismological Laboratory, September 2024.
In addition to network operations and testing and developing instrumentation, the ASL collects and archives data with a focus on data integrity. ASL scientists also focus on research and development to improve seismic algorithms and processing methods that help improve our ability to record ground motion. For example, between 2020 and 2025, work has focused on understanding detection and magnitude thresholds for earthquake monitoring networks on regional and global scales (fig. 7A–B; Wilson and others, 2022; Ringler and others, 2024). In collaboration with other groups, the ASL tested and characterized the production VBB instruments deployed in the GSN. Several rotational sensors and other new technologies have benefited from the ASL testing facilities (fig. 5 and 6).
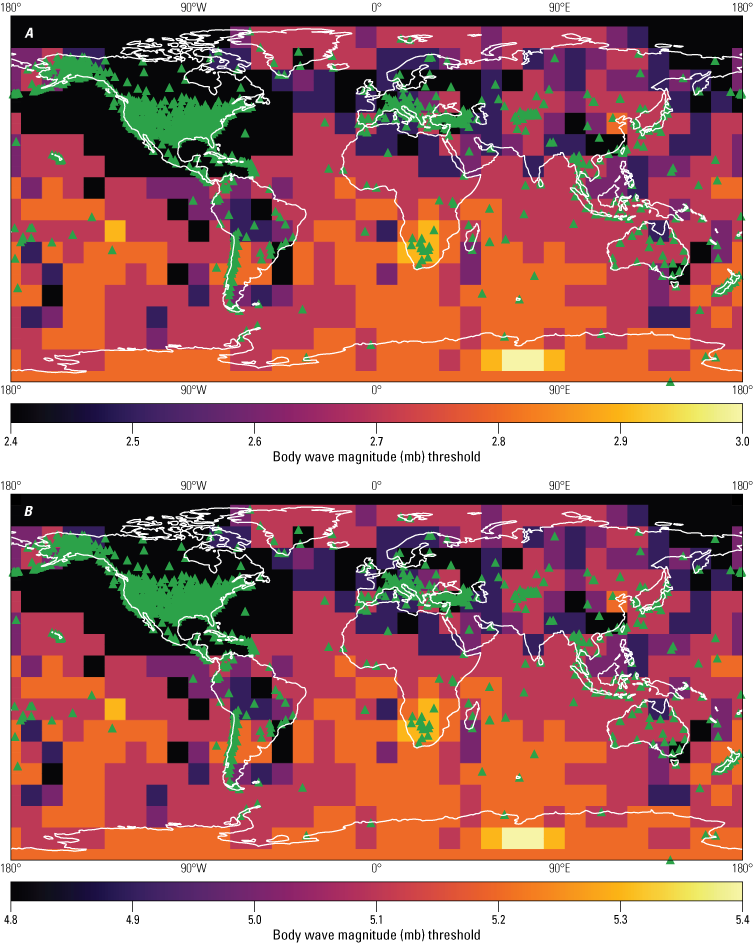
Maps showing theoretical body-wave magnitude thresholds. A, minimum measurement thresholds of body‐wave magnitude (mb) for the stations used by the U.S. Geological Survey National Earthquake Information Center (NEIC; stations indicated with green triangles) assuming every station has noise levels defined by the Peterson (1993) new low-noise model, which would correspond to the lowest noise globally observed on Earth. A measurement is declared when at least 10 stations record the P‐wave arrival with a signal-to-noise ratio of 5 or greater. B, same measurement as figure 7A, but for the Peterson (1993) new high‐noise model, which would correspond to the highest noise globally observed on Earth in the absence of earthquakes. The minimum detection threshold for an earthquake to be detected at a given location is quantified by the color bar (black to yellow).
To support the ASL operational mission, the research and development group at ASL has been tasked with developing algorithms and tests for the predeployment of instrumentation and in situ data quality efforts. This has consisted of developing methodology for identifying compromised instrumentation, in situ data quality monitoring, routine station calibrations, and various absolute calibration methods (Ringler and others, 2015). One example of instrumentation testing is sensitivity, orientation, and location (SensOrLoc), in which the sensitivity, orientation, and geographic location of a seismic sensor are verified by an independent setup during station visits. Many of these data-quality efforts have been communicated to the public by providing real-time metrics to several agencies, such as the EarthScope Consortium, which distributes the metrics to other interested parties.
In short, the ASL aims to meet the needs of the USGS and partner groups by providing near real-time VBB data to the greater community, instrumentation testing and development, and data quality improvements that can be adopted by other network operators. High-quality, near-real-time data are used for regional and global earthquake monitoring. These data are also used for tsunami warnings, nuclear monitoring, and fundamental scientific research.
Purpose and Scope
The purpose of this report is to highlight the key priorities of the ASL during the next ten years (2026–36) as “Foundational Tasks,” and to indicate where the ASL can focus additional efforts, which we refer to as “Aspirational Tasks.” This format is similar to the NEIC Strategic Plan (Hayes and others, 2019) and the EHP Strategic Vision (Hayes and others, 2024). The focus of the Foundational and Aspirational Tasks is to provide potential improvements in data quality for the EHP and the GSN Program. Many of the products produced by the EHP rely on ASL-operated stations and benefit from improvements made to the quality of the geophysical data. The EHP relies heavily on the GSN, and there are additional outside stakeholders and collaborators who depend on GSN data and other data produced by ASL stations.
List of Foundational Priorities
In this section we list the foundational priorities of the ASL. This includes the operational priorities along with the research and development efforts.
(1) Continued Operations of the U.S. Geological Survey Component of the Global Seismographic Network
The GSN is a permanent digital network of state-of-the art seismological and geophysical sensors connected by a telecommunications network. It serves as a multiuse scientific facility and societal resource for monitoring, research, and education. Per byte, the GSN comprises some of the most highly requested seismic stations in the world (fig. 8A–C). The GSN is used as a resource because of the wide frequency band that allows GSN stations to characterize high-frequency local seismicity and very low-frequency signals such as the background hum of the Earth or the deformation of the Earth from the gravitational attraction of the Moon and the Sun (fig. 9). Along with the high-quality data of the GSN’s stations, many are sited in extremely remote locations where very few other seismic stations operate. These stations, with their focus on low-latency, high data quality and global coverage, are used by the NEIC and other stakeholders (for example, the NOAA Tsunami Warning Centers) to carry out their mission.
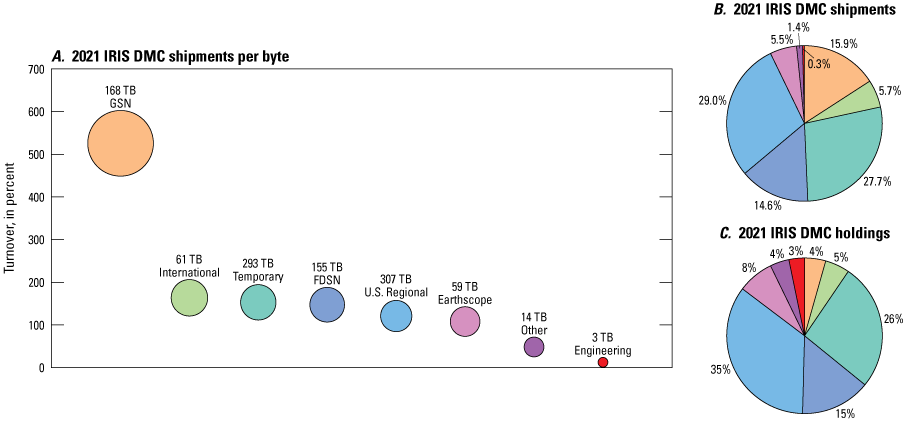
Graphs showing EarthScope (Incorporated Research Institutions for Seismology [IRIS] Data Management Center [DMC]) data turnover. Reproduced from Staats and others (2024). A, turnover for different network data classifications, which represent the amount of data that is shipped (downloaded) relative to total data holdings (in bytes) for 2021, B, total shipped data by network data type, and C, data holdings by network type. (%, percent; GSN, Global Seismographic Network; FDSN, Federation of Digital Seismograph Networks; TB, terabytes)
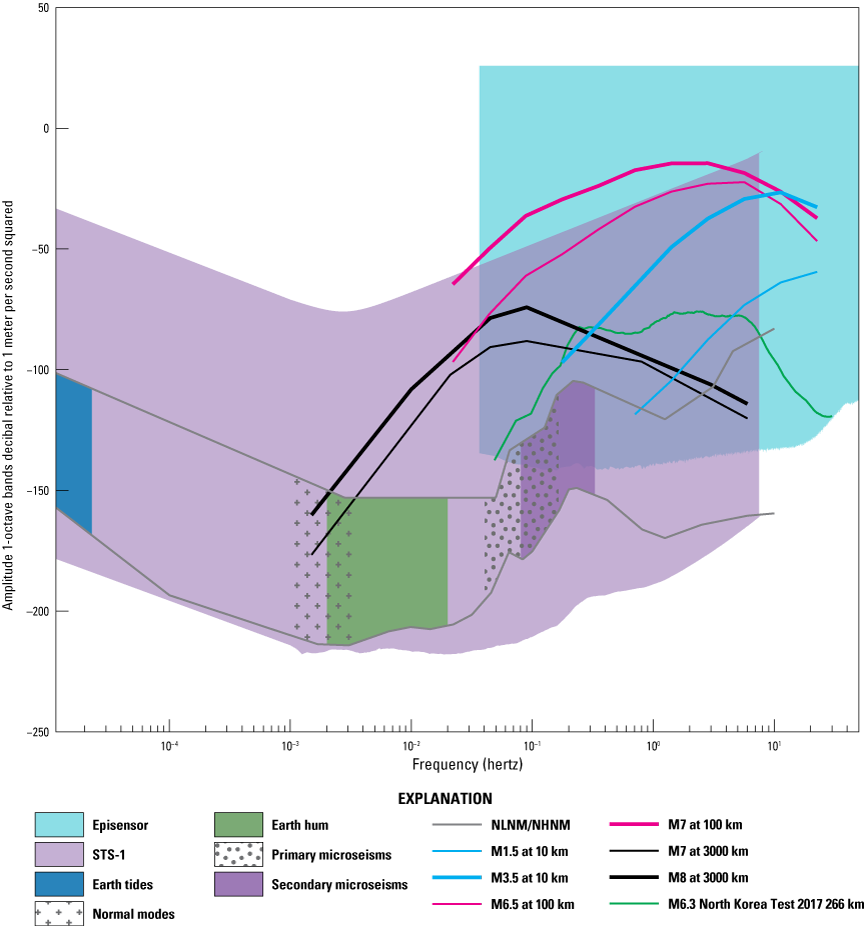
Graph showing the Global Seismographic Network (GSN) frequency band. Figure reproduced from Ringler and others (2022). The figure consists of the fundamentals of Earth's seismic acceleration power spectral density and corresponding broadband instrumentation dynamic ranges. The effective dynamic range of the very broadband (VBB) Streckeisen STS-1 seismometer, shown in light purple, is from Ringler and Hutt (2010). The effective dynamic range of the Kinemetrics EpiSensor strong-motion accelerometer, shown in cyan, is from Ringler, Evans, and Hutt (2015). The Peterson (1993) new low- and high-noise models (NLNM and NHNM), shown in gray, are based on global broadband seismic background observations. Fourier amplitude spectra from intermediate distance (approximately 100 kilometers [km]) earthquakes are from Clinton and Heaton (2002). The event Fourier amplitude spectrum from GSN station MDJ (Mudanjiang, Heilongjiang Province, China; shown in green) is located 366 km from the 2017 North Korea magnitude 6.3 underground nuclear explosion.
Much of the technology developed for the GSN is adopted later by other networks (for example, data format and telemetry and installation methods). This means that other networks often adopt technological advances after they have been vetted at GSN stations. Therefore, continuing to investigate ways to improve data quality and station infrastructure at GSN sites, with the goal of implementing these new technologies in national and regional networks, could improve USGS seismic data.
(2) Global Seismographic Network Deferred Maintenance
Modernizing the GSN could allow it to continue to provide state-of-the-art, high-quality geophysical data. This could consist of modernizing the sensors that have not yet been upgraded in the existing borehole upgrade project. Future deferred maintenance could also comprise upgrading the GSN digitizers, including identifying, testing, and integrating a new digitizer into the GSN. These maintenance components are part of the requirements for continued operation of the GSN.
(3) Provide High-Quality, Near Real-Time Data in Support of the Advanced National Seismic System
The backbone stations of the ANSS and the N4 network provide a network of reference stations and coverage in regions where there are no dedicated ANSS regional networks. These stations need to be calibrated and oriented to ensure that they provide a solid reference so other regional networks can compare nearby station quality. These stations are used for NEIC monitoring in the United States, where the ANSS is required to detect and characterize all seismicity of magnitude (Mw) 2.5 and greater in the Central and Eastern United States, and Mw 3.0 and larger in the Western United States, Alaska, Hawaii, and United States Territories. The low noise and high quality of these stations also allow for the testing and development of new methods for characterizing seismicity at regional scales (fig. 7A–B). The continued long-term maintenance of these stations helps to ensure that the Nation has a level of monitoring capability even if a regional seismic network experiences a temporary outage.
(4) Continued Support of Instrumentation for Regional Networks Through the Advanced National Seismic System Equipment Depot
The ANSS Depot is housed at the ASL. It provides tested equipment for the ANSS regional seismic networks and allows for the exchange of instruments that no longer provide quality data because of failures. By having one location to support these regional seismic networks, the USGS can standardize equipment and provide replacements quickly. The testing facilities at ASL make it possible to efficiently test all equipment before it is shipped. This helps to ensure that equipment failures are not caused by vendors sending compromised instrumentation.
(5) Instrumentation Testing for Improvements in U.S. Geological Survey Operations
The ASL facilities for instrumentation testing and development have historically been considered to be among the gold-standard facilities in the world (Moore and others, 2019; fig. 5 and 6). To support the needs of the GSN and regional and national networks, the ASL can continue instrumentation testing. The ASL facilities include two quiet vaults, more than 20 boreholes of various depths, several reference sensors, an array of broadband stations (Anthony and others, 2020), and shake tables that can characterize horizontal, vertical, and rotational motions. These facilities are used to support the GSN Program and the EHP, and they also provide facilities and staff that can test and develop instrumentation in support of the broader USGS NHMA. For example, the ASL has tested and developed instrumentation for the Landslide Hazards Program (LHP) and the VHP. Through procurement testing, the ASL can vet the seismic equipment on its equipment contracts for use by the entire NHMA.
Moreover, the ASL is also able to test and characterize emerging technologies that could be of future interest to the USGS. For example, rotational instruments and distributed acoustic sensing instrumentation and configuration have been examined at the ASL. The low-noise environment at the ASL can be well-suited for these efforts.
(6) Continued Support for and Modernization of Aftershock Systems
The ASL maintains seismic equipment for deployment during major earthquake aftershock sequences. Each of the aftershock kits maintained by ASL has a broadband sensor, a strong-motion accelerometer, and equipment to provide real-time telemetry. By rapidly deploying temporary stations after earthquakes and other seismic activity, the ASL can provide near-field data with low latency. This benefits the NEIC in characterizing locations and magnitudes and can also benefit the greater scientific community (for example, McNamara and others, 2013; Boyd and others, 2024). As ASL aftershock data are telemetered in real time and made publicly available by EarthScope, these aftershock deployments provide the community with additional data feeds and station coverage. The aftershock stations installed by ASL are used for improving USGS aftershock forecasting products (fig. 10A–B). The continual modernization of instruments, recording equipment, and telemetry equipment helps to ensure that these systems can provide high-quality data and be deployed quickly. The ASL could consider ways to more quickly transport and install aftershock stations to the area of the deployment.
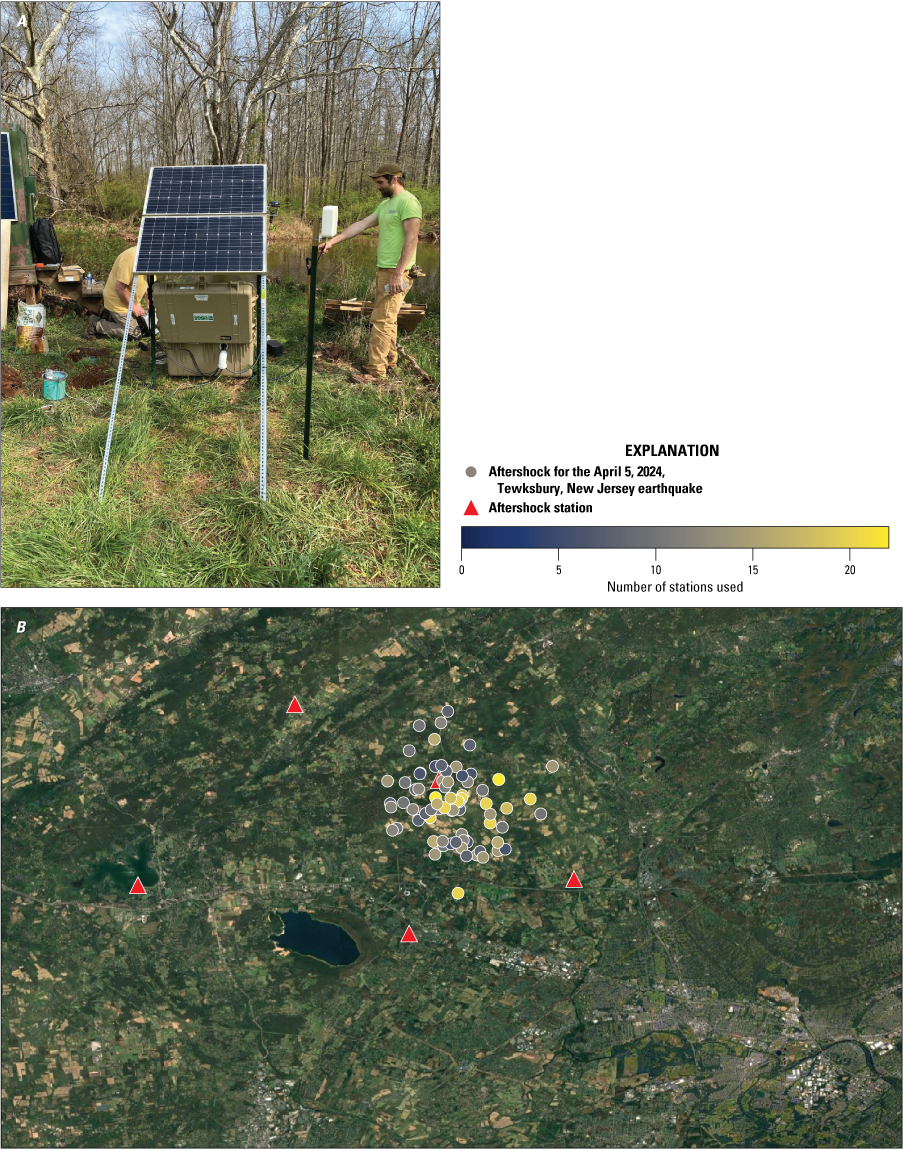
Example Albuquerque Seismological Laboratory (ASL) aftershock system. A, U.S. Geological Survey field engineers Greg Tanner (left) and Patrick Bowen (right) installing aftershock station NJ02 in response to the April 5, 2024, magnitude 4.8 earthquake in Tewksbury Township, New Jersey. Photograph by Steven Ploetz, U.S. Geological Survey. B, map of the five ASL aftershock stations (triangles) and aftershocks for the event (circles) with the number of stations used by the National Earthquake Information Center to locate the event indicated by color.
(7) Data Quality Innovation for Improvements in Network Operations for Government and University Stakeholders
The ability for the USGS and outside stakeholders to utilize data from the seismic networks operated by the ASL is limited by the quality of the data. For example, scatter in earthquake magnitude estimates is often a result of station noise and local site effects. Such noise limitations are not specific to earthquake magnitudes but are pervasive in many areas of observational seismology. Along with improving data quality by understanding local site effects, the characterization of the stations by metadata (for example, sensitivity, timing, and orientation) is also used. The GSN provides many of the stations used in understanding Earth’s inner core rotation because of the long deployment history and geographic locations of these stations. Scientists are making ever-increasing requests for GSN data (for example, seeking timing accuracy to less than a millisecond). To address these requests, the ASL has developed in situ metrics to quantify the quality of a station. These metrics help the ASL identify stations with subtle but problematic issues that can eventually compromise the quality of ASL-operated stations. For this information to be available to quality control analysts, the metrics are collected in the data quality analyzer (DQA; Ringler and others, 2015). For example, analysts can look at changes in noise levels during many years or identify potential misorientations by using metrics that compare the strong-motion accelerometer to the broadband sensor at a station (fig. 11A–F). The ASL continues to produce low-frequency synthetic seismograms and three-dimensional synthetic seismograms after magnitude 6.5 and greater occurrences. By doing data-to-synthetic comparisons (fig. 11A) for the entire frequency content of the synthetics (approximately 40 seconds [s] to 1000 s), frequency-dependent problems at a station can be identified (for example, changes in the amplitude response of the instrument).
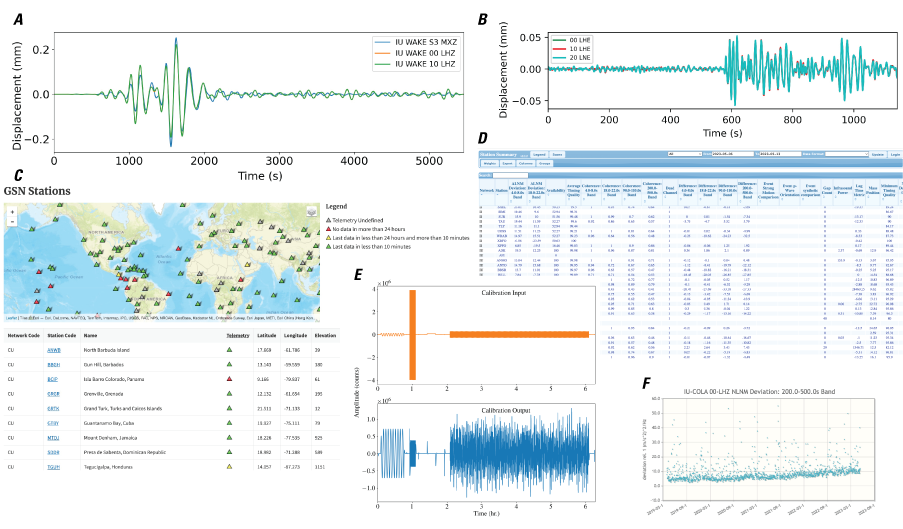
Examples of Albuquerque Seismological Laboratory (ASL) quality control tools. A, vertical‐component spectral finite element (SpecFEM; Komatitsch and others, 2016) synthetic seismogram for the magnitude (Mw) 8.2 Chignik, Alaska, earthquake (blue) on July 28, 2021, at the Wake Island (WAKE) Incorporated Research Institutions for Seismology (IRIS) U.S. Geological Survey (USGS) station compared with the primary sensor (Nanometrics Trillium 360‐BH [orange] and Streckeisen STS‐2.5 [green]); B, east-west component strong‐motion accelerometer comparison with broadband seismometer records during the theoretical P‐ and S‐wave arrival times at the Wyandotte Cave, Indiana (WCI) IRIS-USGS station for the Mw 7.8 Turkey–Syria earthquake on February 6, 2023. Primary sensor (location code 00, green line), secondary sensor (location code 10, red line), and strong‐motion accelerometer (location code 20, cyan line); C, Global Seismographic Network (GSN) station latency map; D, main view of the ASL data quality analyzer (DQA; Ringler and others, 2015); E, example calibration input (orange) and calibration output (blue) for a primary sensor; and F, example of station deviation from the Peterson (1993) new low‐noise model in the 200–500 second period band for the vertical component of the College, Alaska (COLA) IRIS-USGS station. Examples reproduced from Wilson and others (2024).
(8) Support Education, Workforce, and Research Development in Seismology and Instrumentation
Producing high-quality, real-time data allows ASL to provide accurate data for the EHP and outside stakeholders. For USGS data to continue to provide innovations and improvements in science with the long-term goal of mitigating loss of life and property, new processing techniques and algorithms could be developed. Many new methods are first developed in an academic setting and later adapted for operational needs in the USGS. For example, the W-phase moment tensor solutions—a rapid and accurate measurement of earthquake size and fault mechanism that has been used by the USGS NEIC and the NOAA Tsunami Warning Center missions—make optimal use of the low-frequency, high-quality data provided by GSN stations. For these products to be developed, researchers evaluate the limitations of their data and understand some of their unexploited uses.
Through community support for educating scientists about details like the timing quality at seismic stations or the accuracy and precision of the signals being recorded, researchers can better develop new approaches to data processing (for example, Ringler and Evans, 2015; Ringler and others, 2023). As the ASL straddles the instrumentation of observational seismology and data quality, the ASL can identify and communicate to the community different uses of observational seismology and potential limitations in the data in addition to technological advances that could help circumvent these limitations.
Continuing the following foundational priorities may help ASL continue to provide exceptional service.
List of Aspirational Priorities
In addition to the foundational priorities of the ASL, we also provide a list of aspirational priorities that could further help the ASL to continue its mission.
(1) Expand Albuquerque Seismological Laboratory Networks to Provide Multiple Geophysical Observations
As many areas of observational seismology are making use of nonseismic data streams (for example, temperature, magnetic field measurements, and pressure), ASL-operated stations can be used to provide these colocated geophysical measurements. For example, colocated pressure observations during the Hunga Tonga volcanic eruption (fig. 12) led to improvements in our understanding of large volcanic eruptions (Matoza and others, 2022). By understanding interactions between the atmosphere and solid Earth, it may be possible to identify and mitigate losses from rare but extreme geological hazards.
Often these colocated geophysical measurements can be recorded on already open digitizer channels and low-cost sensors. For example, the addition of low-cost magnetometers allows for improvements in spatial resolution to monitor space weather occurrences that could compromise the power grid. As resources allow, the ASL could expand its ability to provide additional, nonseismic data at ASL stations. Although this is often done at existing GSN stations, efforts could be considered to continue expanding these additional data channels to other ASL-operated stations, such as stations in the United States and N4 networks. Working with colleagues in the USGS Geomagnetism Program and VHP may help the USGS to prioritize key locations where additional, nonseismic sensors might be advantageous.
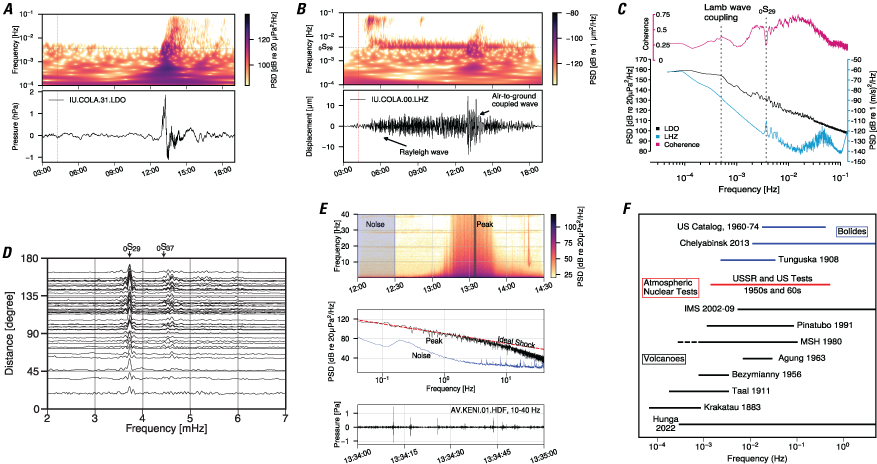
Graphs showing atmospheric waves from the Hunga Tonga volcanic eruption in 2022. Colocated wideband A, pressure, and B, seismic spectrograms (top panel) and unfiltered waveforms (bottom panel); C and D, power spectral densities (PSD) and seismoacoustic coherences worldwide show that pressure waves couple to the solid Earth through direct conversion as the Lamb wave passes the station and through near-source excitation of atmospheric acoustic modes; E, Alaska infrasound stations recorded audio range signals at great distances, apparent in the spectra (top panel) and as intermittent transients with shock-like features (middle and bottom panels); and F, observed wideband pressure spectral character of the Hunga Tonga eruption compared with published instrumental observations of previous occurrences. Graphs reproduced from Matoza and others (2022).
(2) Targeted Improvement of Remote Stations to Improve Coverage and Data Quality of the Global Seismographic Network
The GSN provides data from some of the remotest stations in the world (fig. 3). Although these stations are used by the NEIC and stakeholders that require global coverage, they pose operational and data-quality challenges. For example, many of these remote stations are on island sites that have high noise levels, and station outages can be lengthy because of lead times in getting to these stations for repairs and telemetry issues.
The ASL could look at methods to improve coverage and data quality at these remote sites and consider moving problematic sites without losing coverage. This could come from improved infrastructure with backup telemetry and power and additional onsite sensors. For example, a local array could provide redundant sensors at these remote sites, and noise levels could be mitigated using array techniques. In contrast, low-footprint sites with robust communication could provide moderate-quality data in remote locations that would be less likely to be compromised because of vandalism.
(3) Improve Testing Capabilities for Nonseismic Geophysical Instruments
With the integration of nonseismic sensors into seismic networks, data quality is considered for these types of sensors (for example, magnetometers, barometric pressure, and weather stations) and the best practices for installing them and verifying their associated metadata. ASL testing of these types of sensors is mostly functional and done to identify the basic quality of their data. As such, the accuracy and precision of these sensors aren’t quantified, and more refined quality control methods could be necessary.
As the USGS and outside stakeholders make ever-increasing requests for data produced by the GSN and the ANSS, the quality of the nonseismic geophysical instruments could be evaluated and improved. This may require calibrating laboratory reference sensors and developing methods for characterizing the sensors when deployed. For example, by improving magnetometer calibrations, it may be possible to quantify magnetic field data produced at ASL stations that are used by the Geomagnetism Program. This type of calibration and quality control could allow outside stakeholders to have confidence in these data for nonseismic applications (for example, space weather monitoring).
(4) Improve Detection Threshold Monitoring and Quality Control in Near Real Time
The ASL has developed capabilities to quantify network thresholds for detections and magnitude estimates (Wilson and others, 2022; Ringler and others, 2024). These methods enable us to understand how additional stations can improve monitoring efforts. Current (2025) methods require already having knowledge of the background noise levels at the station, which can make it difficult to understand improvements in network thresholds in near real time. For example, when new stations go online during aftershock deployments, it is not possible to quantify the improvement in detection capabilities until a few days of background data have been recorded. This is further complicated when installing stations in active regions where aftershocks are frequent and possibly skewing the background noise statistics. Previous studies have also been limited by only considering specific types of magnitudes (for example, Wilson and others, 2022; Ringler and others, 2024).
By utilizing more sophisticated real-time background noise estimation techniques, it could be possible to understand changes in network thresholds in near real time, allowing scientists to identify when monitoring efforts could become compromised because of various changes in station status (for example, regional outages, elevated noise from human-made sources). Near real-time network threshold quantification would have the additional advantage of helping in the decision-making process during aftershock deployments. For example, it could be possible to look at the improvements in detection thresholds after each station is added to the network. This could also help to identify station locations that might be ideal for various USGS real-time products (for example, improved azimuth coverage or depth constraints).
(5) Expand Data Quality Analysis to All Channels Used by the National Earthquake Information Center
The NEIC utilizes approximately 1,500 real-time broadband seismic stations operated by universities and other countries (fig. 5). By utilizing many diverse stations, the NEIC can ensure that it can meet its hazard monitoring missions. Not all seismic stations produce data that meet standard quality levels. This can be due to flawed metadata, elevated noise levels, or other station issues that compromise the quality of the data being used by the NEIC.
Utilizing the DQA to provide in situ measurements of the data quality for stations used by the NEIC could allow the NEIC to provide near real-time updates of stations that might compromise USGS products produced by the NEIC (fig. 11). This large-scale data quality analysis could also help the USGS communicate these problems to network operators that might be otherwise unaware of the compromised data quality because their network focuses on other applications, or they do not have the resources to do robust data quality control.
(6) Improve Rapid Aftershock Deployments
The ASL aftershock equipment pool contains about 30 kits that have a broadband and strong-motion accelerometer along with telemetry equipment to provide low-latency real-time data. Future aftershock deployments could make use of new instrumentation or approaches. For example, improving station coverage by deploying many low-cost midband instruments that improve azimuthal coverage and speed up the deployment of aftershock kits has been considered at the possible cost of station noise levels. This is only one possible scenario, as utilizing quickly deployed arrays of sensors could provide improved benefits for aftershock monitoring using array processing techniques.
Along with considering different deployment strategies, developing tools and techniques can help quantify the quality of our aftershock systems and how they improve upon existing stations in the area. For example, aftershock deployments in regions with high background noise levels might benefit from broadband stations farther away. Alternatively, placing stations directly above a fault could result in improved estimates of the depth of earthquakes in a sequence.
Regardless of the scientific focus of the study, being able to quantify and identify the optimal deployment strategies could help improve data quality and reduce costs in labor and equipment by having more targeted deployment strategies. Using previously deployed aftershock kits, along with theoretical modeling, could help in identifying metrics for quantifying aftershock station data quality, which could also help us quantify the quality of aftershock deployments as well as guide future deployments. The following are aspirational tasks.
-
• Improve global coverage through targeted deployments and expansion of the GSN,
-
• Provide additional geophysical data streams for improving hazard monitoring (for example, volcanoes and landslides), and
-
• Improve monitoring capabilities of NEIC and partners by improved data quality and deployment strategies.
Summary
This report outlines priorities of the U.S. Geological Survey Albuquerque Seismological Laboratory (ASL) for instrumentation testing, network operations, and data quality from 2026 to 2036. Two targeted lists are provided: a Foundational Task list that discusses ongoing efforts that could maintain existing resources and an Aspirational Task list that describes work that the ASL could consider pursuing to enhance seismic monitoring networks and data quality, which will ultimately improve hazard monitoring. The ASL works on three broad aspects of observational seismology: instrumentation testing and development, network operations and station installations, and data quality. However, these three aspects are often intertwined, and improvements in all three can help the ASL continue to meet the Foundational Tasks and further improve operations through the Aspirational Tasks. By focusing ASL resources in these three areas, we can help to ensure that the ASL is able to meet the increasing use of global seismic data by the Earthquake Hazards Program and that the Global Seismographic Network Program continues to provide reliable seismic data for the U.S. Geological Survey and other stakeholders.
References Cited
Anthony, R.E., Ringler, A.T., Wilson, D.C., Maharrey, J.Z., Gyure, G., Pepiot, A., Sandoval, L.D., Sandoval, S., Telesha, T., Valio, G., and Voss, N., 2020, Installation and performance of the Albuquerque Seismological Laboratory small-aperture posthole array: Seismological Research Letters, v. 91, no. 4, p. 2425–2437, accessed October 5, 2024, at https://doi.org/10.1785/0220200080.
Boyd, O.S., Barnhart, W.D., Bourke, J., Chapman, M., Earle, P.S., Huang, G.D., Thompson Jobe, J.A., Kim, W.-Y., Link, F., Litherland, M., Lloyd, A., Long, M.D., McBride, S., Michael, A.J., Mooney, W.D., Mountain, G.S., Nikolaou, S., Savvaidis, A., Waldhauser, F., Wolfe, C.J., and Yoon, C., 2024, Preliminary observations of the 5 April 2024 Mw 4.8 New Jersey earthquake: The Seismic Record, v. 4, no. 4, p. 240–250, accessed October 5, 2024, at https://doi.org/10.1785/0320240024.
Clinton, J.F., and Heaton, T.H., 2002, Potential advantages of a strong-motion velocity meter over a strong-motion accelerometer: Seismological Research Letters, v. 73, no. 3, p. 332–342, accessed November 21, 2024, at https://doi.org/10.1785/gssrl.73.3.332.
Hayes, G.P., Baltay Sundstrom, A.S., Barnhart, W.D., Blanpied, M.L., Davis, L.A., Earle, P.S., Field, N., Franks, J.M., Given, D.D., Gold, R.D., Goulet, C.A., Guy, M.M., Hardebeck, J.L., Luco, N., Pollitz, F., Ringler, A.T., Scharer, K.M., Sobieszczyk, S., Thomas, V.I., and Wolfe, C.J., 2024, U.S. Geological Survey Earthquake Hazards Program decadal science strategy, 2024–33: U.S. Geological Survey Circular 1544, 55 p., accessed October 5, 2024, at https://doi.org/10.3133/cir1544.
Hayes, G., Earle, P.S., Benz, H.M., Wald, D.J., and Yeck, W.L., 2019, National Earthquake Information Center strategic plan—2019-23: U.S. Geological Survey Circular 1457, 17 p., accessed October 5, 2024, at https://doi.org/10.3133/cir1457.
Jaiswal, K., Rozelle, J., Tong, M., Sheehan, A., McNabb, S., Kelly, M., Zuzak, C., Bausch, D., and Sims, J., 2023, Hazus estimated annualized earthquake losses for the United States—FEMA [Federal Emergency Management Agency] P-366: Federal Emergency Management Agency web page, 96 p., accessed October 5, 2024, at https://pubs.usgs.gov/publication/70250588.
Komatitsch, D., Xie, Z., Bozdag, E., Sales de Andrade, E., Liu, Q., and Tromp, J., 2016, Anelastic sensitivity kernels with parsimonious storage for adjoint tomography and full waveform inversion: Geophysical Journal International, v. 206, no. 3, p. 1467–1478, accessed October 5, 2024, at https://doi.org/10.1093/gji/ggw224.
Matoza, R.S., Fee, D., Assink, J.D., Iezzi, A.M., Green, D.N., Kim, K.Toney, L., Lecoco, T., Krishnamoorthy, S., Lalande, J.-M., Nishida, K., Gee, K.L. Haney, M.M., Ortiz, H.D., Brissaud, Q., Martire, L., Rolland, L., Vergados, P., Nippress, A., Park, J., Shani-Kadmiel, S., Witsil, A., Arrowsmith, S., Caudron, C., Watada, S., Perttu, A.B., Taisne, B., Mialle, P., Le Pichon, A., Vergoz, J., Hupe, P., Blom, P.S., Waxler, R., De Angelis, S., Snively, J.B., Ringler, A.T., Anthony, R.E., Jolly, A.D., Kilgour, G., Averbuch, G., Ripepe, M., Ichihara, M. Arciniega-Ceballos, A., Astafyeva, E., Ceranna, L., Cevuard, S., Che, I.-Y., De Negri, R., Ebeling, C.W., Evers, L.G., Franco-Marin, L.E., Gabrielson, T.B., Hafner, K., Harrison, R.G., Komjathy, A., Lacanna, G., Lyons, J., Macpherson, K.A., Marchetti, E., McKee, K.F., Mellors, R.J., Mendo-Pérez, G., Mikesell, T.D., Munaibari, E., Oyola-Merced, M., Park, I., Pilger, C., Ramos, C., Ruiz, M.C., Sabatini, R., Schwaiger, H.F., Tailpied, D., Talmadge, C., Vidot, J., Webster, J., and Wilson, D.C., 2022, Atmospheric waves and global seismoacoustic observations of the January 2022 Hunga eruption, Tonga: Science, v. 377, article 6601, p. 95–100, accessed October 5, 2024, at https://doi.org/10.1126/science.abo7063.
McNamara, D.E., Benz, H.M., Herrmann, R.B., Bergman, E.A., Earle, P., Meltzer, A., Withers, M., and Chapman, M., 2013, The Mw 5.8 Mineral, Virigina, earthquake of August 2011, and aftershock sequence—Constraints on earthquake source parameters and fault geometry: Bulletin of the Seismological Society of America, v. 104, no. 1, p. 40–54, accessed October 5, 2024, at https://doi.org/10.1785/0120130058.
Moore, S.V., Hutt, C.R., Anthony, R.E., Ringler, A.T., Alejandro, A.C.B., and Wilson, D.C., 2019, A collection of historic seismic instrumentation photographs at the Albuquerque Seismological Laboratory: Seismological Research Letters, v. 90, no. 2A, p. 765–773, accessed September 30, 2025, at https://doi.org/10.1785/0220180267.
National Science Foundation, 2025, MetaData aggregator—All networks: EarthScope Consortium web page, accessed November 19, 2025, at http://ds.iris.edu/mda/.
Peterson, J.R., 1993, Observations and modeling of seismic background noise: U.S. Geological Survey Open-File Report 93–322, 94 p., accessed October 5, 2024, at https://doi.org/10.3133/ofr93322.
Peterson, J., and Hutt, C.R., 2014, World-Wide Standardized Seismograph Network—A data users guide: U.S. Geological Survey Open-File Report 2014–1218, 74 p., accessed October 5, 2024, at https://pubs.usgs.gov/of/2014/1218/pdf/ofr2014-1218.pdf.
Petersen, M.D., Shumway, A.M., Powers, P.M, Field, E.H., Moschetti, M.P, Jaiswal, K.S., Milner, K.R., Rezaeian, S., Frankel, A.D., Llenos, A.L., Michael, A.J., Altekruse, J.M., Ahdi, S.K., Withers, K.B., Mueller, C.S., Zeng, Y., Chase, R.E., Salditch, L.M., Luco, N., Rukstales, K.S., Herrick, J.A., Girot, D.L., Aagaard, B.T., Bender, A.M., Blanpied, M.L., Briggs, R.W., Boyd, O.S., Clayton, B.S., DuRoss, C.B., Evans, E.L., Haeussler, P.J., Hatem, A.E., Haynie, K.L., Hearn, E.H., Johnson, K.M., Kortum, Z.A., Kwong, N.S., Makdisi, A.J., Mason, H.B., McNamara, D.E., McPhillips, D.F., Okubo, P.G., Page, M.T., Pollitz, F.F., Rubinstein, J.L., Shaw, B.E., Shen, Z.-K., Shiro, B.R., Smith, J.A., Stephenson, W.J., Thompson, E.M., Thompson Jobe, J.A., Wirth, E.A., and Witter, R.C., 2024, The 2023 U.S. 50-State National Seismic Hazard Model—Overview and implications: Earthquake Spectra, v. 40, no. 1, p. 5–88, accessed August 1, 2025, at https://doi.org/10.1177/87552930231215428.
Ringler, A.T., Anthony, R.E., Aster, R.C., Ammon, C.J., Arrowsmith, S., Benz, H., Ebeling, C., Frassetto, A., Kim, W.-Y., Koelemeijer, P., Lau, H.C.P., Lekić, V., Montanger, J.-P., Richards, P.G., Schaff, D.P., Vallée, M., and Yeck, W., 2022, Achievements and prospects of global broadband seismic networks after 30 years of continuous geophysical observations: Reviews of Geophysics, v. 60, no. 6, article e2021RG000749, 98 p., accessed October 5, 2024, at https://doi.org/10.1029/2021RG000749.
Ringler, A.T., Anthony, R.E., Bastien, P., Pascale, A., and Merchant, B.J., 2023, Introduction to the digitization of seismic data—A user’s guide: Seismological Research Letters, v. 94, no. 4, p. 2060–2074, accessed October 5, 2024, at https://doi.org/10.1785/0220220158.
Ringler, A.T., and Evans, J.R., 2015, A quick SEED tutorial: Seismological Research Letters, v. 86, no. 6, p. 1717–1725, accessed October 5, 2024, at https://doi.org/10.1785/0220150043.
Ringler, A.T., Evans, J.R., and Hutt, C.R., 2015, Self-noise models of five commercial strong-motion accelerometers: Seismological Research Letters, v. 86, no. 4, p. 1143–1147, accessed October 5, 2024, at https://doi.org/10.1785/0220150027.
Ringler, A.T., Hagerty, M.T., Holland, J., Gonzales, A., Gee, L.S., Edwards, J.D., Wilson, D., and Baker, A.M., 2015, The data quality analyzer—A quality control program for seismic data: Computers & Geosciences, v. 76, p. 96–111, accessed October 5, 2024, at https://doi.org/10.1016/j.cageo.2014.12.006.
Ringler, A.T., and Hutt, C.R., 2010, Self-noise models of seismic instruments: Seismological Research Letters, v. 81, no. 6, p. 972–983, accessed October 5, 2024, at https://doi.org/10.1785/gssrl.81.6.972.
Ringler, A.T., Wilson, D.C., Earle, P., Yeck, W., Mason, D.B., and Wilgus, J., 2024, Noise constraints on global body-wave measurement thresholds: Seismological Research Letters, v. 114, no. 4, p. 1765–1776, accessed October 5, 2024, at https://doi.org/10.1785/0120230246.
Staats, M., Aderhold, K., Hafner, K., Dalton, C., Flanagan, M., Lau, H., Simons, F.J., Vallée, M., Wei, S.S., Yeck, W., Frassetto, A., and Busby, R., 2024, Inconsistent citation of the Global Seismographic Network in scientific publications: Seismological Research Letters, v. 95, no. 3, p. 1478–1485, accessed October 5, 2024, at https://doi.org/10.1785/0220230004.
Tozer, B., Sandwell, D.T., Smith, W.H.F, Olson, C., Beale, J.R., and Wessel, P., 2019, Global bathymetry and topography at 15 arc sec—SRTM15+: Earth and Space Science, v. 6, no. 10, p. 1847–1864, accessed August 1, 2025, at https://doi.org/10.1029/2019EA000658.
Wilson, D.C., Hutt, C.R., Gee, L.S., Ringler, A.T., and Anthony, R.E., 2024, Global seismic networks operated by the U.S. Geological Survey: Seismological Research Letters, v. 95, no. 3, p. 1578–1590, accessed October 5, 2024, at https://doi.org/10.1785/0220230178.
Wilson, D.C., Wolin, E., Yeck, W.L., Anthony, R.E., and Ringler, A.T., 2022, Modeling seismic network detection thresholds using production picking algorithms: Seismological Research Letters, v. 93, no. 1, p. 149–160, accessed September 30, 2025, at https://doi.org/10.1785/0220210192.
Abbreviations
ANSS
Advanced National Seismic System
ASL
Albuquerque Seismological Laboratory
ASRO
modified high-gain long period
CDSN
China Digital Seismograph Network
DQA
data quality analyzer
DWWSSN
Digital World-Wide Standardized Seismographic Network
EHP
Earthquake Hazards Program
GDSN
Global Digital Seismographic Network
GHSC
Geological Hazards Science Center
GS
Geological Survey network code
GSN
Global Seismographic Network
HGLP
High-Gain Long Period
Hz
hertz
IDA
International Deployment of Accelerometers
IRIS
Incorporated Research Institutions for Seismology
IW
Intermountain West Seismic Network
LHP
Landslide Hazards Program
Mw
magnitude, moment
N4
Central and Eastern U.S. Network
NEHRP
National Earthquake Hazard Reduction Program
NEIC
National Earthquake Information Center
NE
New England Seismic Network
NHMA
Natural Hazards Mission Area
NHNM
new high-noise model
NLNM
new low-noise model
NOAA
National Oceanic and Atmospheric Administration
NSF
National Science Foundation
s
second
SensOrLoc
sensitivity, orientation, and location
SNR
signal-to-noise ratio
SRO
Seismic Research Observatory
USCGS
U.S. Coast and Geodetic Survey
USGS
U.S. Geological Survey
VBB
very broadband
VHP
Volcano Hazards Program
WWSSN
World-Wide Standardized Seismographic Network
For more information concerning the research in this report, contact the
Center Director, USGS Geologic Hazards Science Center
Box 25046, Mail Stop 966
Denver, CO 80225
(303) 273-8579
Or visit the Geologic Hazards Science Center website at
https://www.usgs.gov/centers/geologic-hazards-science-center
Publishing support provided by the Science Publishing Network,
Denver and Reston Publishing Service Centers
Disclaimers
Any use of trade, firm, or product names is for descriptive purposes only and does not imply endorsement by the U.S. Government.
Although this information product, for the most part, is in the public domain, it also may contain copyrighted materials as noted in the text. Permission to reproduce copyrighted items must be secured from the copyright owner.
Suggested Citation
Ringler, A.T., Wilson, D.C., Anthony, R., Beutel, C.I., Holcomb, A., Hutt, C.R., and Telesha, T., 2026, Albuquerque Seismological Laboratory strategic vision: U.S. Geological Survey Circular 1563, 23 p., https://doi.org/10.3133/cir1563.
ISSN: 2330-5703 (online)
ISSN: 1067-084X (print)
| Publication type | Report |
|---|---|
| Publication Subtype | USGS Numbered Series |
| Title | Albuquerque Seismological Laboratory strategic vision |
| Series title | Circular |
| Series number | 1563 |
| DOI | 10.3133/cir1563 |
| Publication Date | April 13, 2026 |
| Year Published | 2026 |
| Language | English |
| Publisher | U.S. Geological Survey |
| Publisher location | Reston VA |
| Contributing office(s) | Geologic Hazards Science Center |
| Description | viii, 23 p. |
| Online Only (Y/N) | N |