

Yellowstone Volcano Observatory 2024 Annual Report
Links
- Document: Report (45 MB pdf) , HTML , XML
- Illustration: Infographic (1.8 MB pdf)
- NGMDB Index Page: National Geologic Map Database Index Page (html)
- Download citation as: RIS | Dublin Core
Introduction
The Yellowstone Volcano Observatory (YVO) monitors volcanic and hydrothermal activity associated with the Yellowstone magmatic system, carries out research into magmatic processes occurring beneath Yellowstone Caldera, and issues timely warnings and guidance related to potential future geologic hazards (refer to “Volcanic Hazards in the Yellowstone Region” sidebar). YVO is a collaborative consortium that includes the U.S. Geological Survey (USGS), Yellowstone National Park, University of Utah, University of Wyoming, Montana State University, EarthScope Consortium, Wyoming State Geological Survey, Montana Bureau of Mines and Geology, and Idaho Geological Survey (refer to “What is the Yellowstone Volcano Observatory?” sidebar). The USGS component of YVO also has the operational responsibility for monitoring volcanic activity in the Intermountain West of the United States, including Arizona, New Mexico, Utah, and Colorado.
This report summarizes the activities and findings of YVO during the year 2024, focusing on the Yellowstone volcanic system. Highlights of YVO research and related activities in 2024 include
-
• Response to a hydrothermal explosion from Black Diamond Pool in Biscuit Basin, Upper Geyser Basin, on July 23,
-
• Detection and characterization of a hydrothermal explosion in the Porcelain Basin area of Norris Geyser Basin on April 15,
-
• Deployment of semipermanent Global Positioning System (SPGPS) array from May to September,
-
• Geological studies of a major fault system in the northwest part of Yellowstone National Park,
-
• Monitoring changes in the hydrothermal activity, including a temperature increase of Abyss Pool, in West Thumb Geyser Basin, the reawakening of Economic Geyser, in Upper Geyser Basin, and the formation of a new steam vent near Nymph Lake, between Norris Geyser Basin and Roaring Mountain, and
-
• Assessment of thermal output based on satellite imagery and chloride flux in rivers.
Box 1. Volcanic Hazards in the Yellowstone Region
The Yellowstone Plateau in the northern Rocky Mountains of Wyoming, Montana, and Idaho includes a youthful, active volcanic system with subterranean magma (molten rock), boiling and pressurized waters, and a variety of active faults. This combination creates a diversity of hazards, but the most catastrophic events—large volcanic explosions—are the least likely to occur.
Over the past 2.1 million years, Yellowstone volcano has had three immense explosive volcanic eruptions that blanketed large parts of the North American continent with ash and debris and that created sizable calderas. Yellowstone Caldera, which comprises nearly one third of the land area in Yellowstone National Park, formed 631,000 years ago during the most recent of these large explosive phases. Its formation was followed by dozens of less explosive but massive lava flows, the last of which erupted 70,000 years ago.
Tectonic extension of the western United States is responsible for large and devastating earthquakes in the Yellowstone region along the Teton and Hebgen Faults. Most recently, a devastating magnitude 7.3 earthquake in 1959 killed 28 people and a strong magnitude 6 earthquake near Norris Geyser Basin in 1975 was widely felt.
Yellowstone National Park’s famous geothermal waters create fabulous hot springs and geysers but occasionally explode catastrophically to create craters found throughout the park. At least 25 explosions that left craters greater than 100 meters (about 300 feet) wide have occurred since the last ice age ended in the Yellowstone region 16,000–14,000 years ago. Much smaller explosions, which leave craters only a few meters (yards) across, happen every few years in the Yellowstone region.
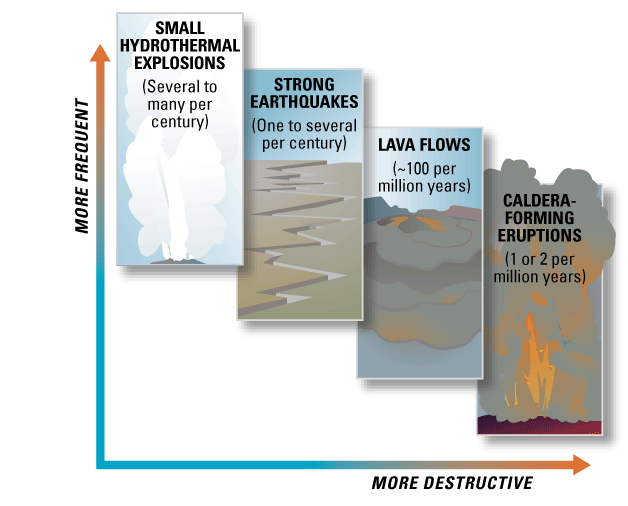
The most destructive hazards in the Yellowstone region, including volcanic explosions and lava flow eruptions, are also the least likely to occur. On human timescales, the most likely hazards are small hydrothermal explosions and strong earthquakes. Modified from U.S. Geological Survey Fact Sheet 2005–3024 (Lowenstern and others, 2005).
The most noteworthy events of the year were the hydrothermal explosions in Biscuit Basin and Norris Geyser Basin. A small explosion crater and region of disrupted ground at Norris Geyser Basin, in the area between Porcelain Basin and Nuphar Lake, was discovered during field work in May, and subsequent analysis of satellite imagery and seismic-acoustic data identified an explosion signal on April 15 at 2:56 p.m. mountain daylight time (MDT). The event was not witnessed because it occurred during an administrative closure period of Yellowstone National Park, but a park employee heard the explosion from his residence about 0.6 kilometers (0.4 miles) away. The explosion of Black Diamond Pool in Biscuit Basin on July 23, however, was well observed by a number of visitors who were in the basin at the time and had to run for safety. Fortunately, there were no injuries. Although the event barely registered on a seismic station about 4 kilometers (2.5 miles) away, visitor videos provided an excellent record of the explosion. YVO scientists answered numerous public and media questions in the days that followed, and the event provided an opportunity to highlight the hazards posed by hydrothermal explosions (refer to “Volcanic Hazards in the Yellowstone Region” sidebar)—hazards that have long been discussed by YVO in formal reports and public outreach products (for example, Lowenstern and others, 2005; Christiansen and others, 2007) but that seemed underappreciated compared to large explosive volcanic eruptions.
Steamboat Geyser, in Norris Geyser Basin, continued the pattern of frequent eruptions that began in 2018 with six water eruptions in 2024, the lowest number of annual eruptions in the current eruptive sequence (compared to 32 in 2018, 48 each in 2019 and 2020, 20 in 2021, 11 in 2022, and 9 in 2023). The episodic activity at Steamboat Geyser is typical for Yellowstone National Park hydrothermal systems, where many geysers experience alternating periods of frequent and infrequent eruptions. Another example is Economic Geyser, in the Upper Geyser Basin near Old Faithful, which erupted for the first time in nearly 25 years in January 2024 (an eruption may have occurred in late 2023 but was not observed and only inferred from observations of surface disturbance). The geyser erupted frequently for much of the year.
The number of located earthquakes in the Yellowstone National Park region during 2024—1,173—was the lowest annual total since 900 earthquakes were located in 2016. This is less than the typical 1,500–2,500 earthquakes that are located each year, but it is not particularly anomalous—about 700 earthquakes were located in 2011 and also in 2012 (fig. 1). Deformation patterns during 2024 indicated trends that continued from previous years. Overall subsidence of the caldera floor, ongoing since late 2015 or early 2016, continued at rates of a few centimeters (1–2 inches) per year, and no noteworthy deformation was detected in the area between the north caldera rim and Norris Geyser Basin.
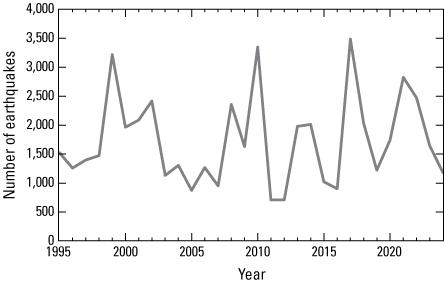
Plot of earthquakes located each year since 1995 in the Yellowstone National Park region. Data from the University of Utah seismograph stations (https://quake.utah.edu/earthquake-information-products/earthquake-catalogs/).
Throughout 2024, the aviation color code for Yellowstone Caldera remained at “green” and the volcano alert level remained at “normal” indicating that the volcano is not exhibiting any unusual activity that would indicate a volcanic eruption is likely in the near future. Two Information Statements were released in 2024, both in response to the hydrothermal explosion at Biscuit Basin on July 23, 2024; the statements described the event, explained its cause, and discussed the potential for continuing hazards.
YVO Activities
In May 2024, an in-person meeting of the YVO consortium was held to share research and monitoring results and to discuss responses to any future volcanic, hydrothermal or seismic unrest—a prescient topic, given the hydrothermal explosion at Biscuit Basin two months later. YVO scientists contributed their expertise over the past 2 years to infrastructure development in the Tower Junction area, where a new bridge is being constructed over the Yellowstone River. The year also saw the failure of YVO’s only webcam, which had provided a view of Yellowstone Lake since 2017.
Box 2. What is the Yellowstone Volcano Observatory?
The Yellowstone Volcano Observatory (YVO) was formed on May 14, 2001, to strengthen the long-term monitoring of volcanic and seismic unrest in the Yellowstone National Park region. YVO is a “virtual” observatory that does not have an on-site building to house employees. Instead, it is a consortium of nine organizations spread throughout the western United States that collaborate to monitor and study the volcanic and hydrothermal systems of the Yellowstone region, as well as disseminate data, interpretations, and accumulated knowledge to the public. The partnership provides for improved collaborative study and monitoring of active geologic processes and hazards of the Yellowstone Plateau volcanic field, which is the site of the largest and most diverse collection of natural thermal features on Earth, the world’s first national park, and the United States’ first World Heritage Site.
Each of the nine consortium agencies offers unique skills and expertise to YVO. The U.S. Geological Survey (USGS) has the Federal responsibility to provide warnings of volcanic activity and holds the ultimate authority over YVO operations. Key geophysical monitoring sites were established and are maintained by the University of Utah and the EarthScope Consortium. Scientists from these two organizations analyze and provide data to the public as well as carry out research on active tectonic and volcanic processes in the region. Yellowstone National Park is the land manager and the agency responsible for emergency response to natural disasters within the national park boundaries. The Wyoming State Geological Survey (WSGS), Montana Bureau of Mines and Geology, and Idaho Geological Survey provide critical hazards information and outreach products to their respective citizens. The University of Wyoming and Montana State University support research into the Yellowstone region’s volcanic and hydrothermal activity, as well as the geologic history of the region. YVO agencies also aid and collaborate with scientists outside the consortium.

Member agencies of the Yellowstone Volcano Observatory.
YVO coordination meeting
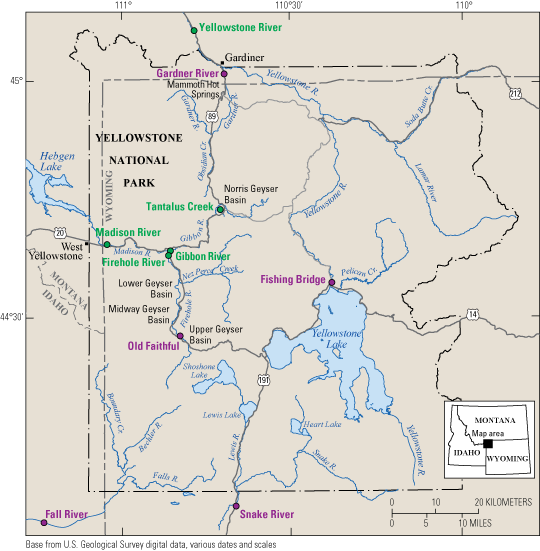
During May 20–22, members of the YVO consortium gathered in Mammoth Hot Springs, Yellowstone National Park, for the biennial coordination meeting of the Yellowstone Volcano Observatory. More than 60 attendees, representing nearly all the YVO member agencies, participated in the meeting. The first day was spent discussing science and monitoring results from the previous 2 years, including the potential for machine learning to develop a more complete, accurate, and timely earthquake catalog, gas emissions from the new Tern Lake thermal area, new interpretations of the geological history of Lower Geyser Basin, and the status of thermal area mapping and monitoring. On the second day, YVO scientists received training in the Incident Command System—a management strategy used by many agencies, including the National Park Service, to coordinate emergency response operations. During a major geological event, like a strong earthquake or volcanic eruption, YVO scientists would contribute information to any Incident Command System established to manage the crisis. Meeting attendees also had an opportunity to discuss natural hazards that have affected Yellowstone National Park, including flooding, climate variability, faulting, and landslides. The final day of the meeting provided an opportunity for YVO scientists to visit field sites along the northern margin of Yellowstone National Park (fig. 2). The first part of the trip was to the Gardner River to inspect damage caused by the historic flooding in June 2022, which destroyed much of the north entrance road. The second part of the trip examined outcrops of travertine—a hydrothermal mineral that records information about past climate—located just northeast of Gardiner, Montana. YVO scientists also participated in a public event held in Gardiner on May 21, when visitors and members of the community were invited to hear updates about recent research and monitoring results and interact with scientists from the YVO member agencies and fields of expertise (refer to “Communications and Outreach” section).
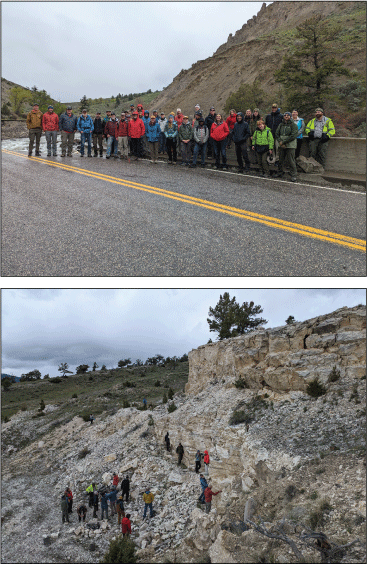
Photographs from the 2024 Yellowstone Volcano Observatory biennial coordination meeting. Top, Field trip participants on the north entrance road of Yellowstone National Park, which was damaged by historic flooding in June 2022. Bottom, Field trip participants examine an outcrop of travertine near Gardiner, Montana. Photographs by Mike Poland, U.S. Geological Survey, May 22, 2024.
Yellowstone River Bridge Construction
The Yellowstone River bridge project involves replacing the existing 60-year-old bridge crossing the Yellowstone River near Tower Junction and rerouting part of the Northeast Entrance Road to the intersection of Grand Loop Road. The new 390-meter- (1,285-foot-) long and 50-meter- (175-foot-) high steel girder bridge is within a hydrothermally active zone, with multiple gas vents along the river’s edge. Because of its proximity to thermal activity, the large, drilled shafts (1.5–3 meters [5–10 feet] in diameter and 12–18 meters [40–60 feet] in depth) required sulfate-resistant cement and thermal monitoring of below-ground concrete curing to ensure a stable bridge structure. The actual drilling of these large shafts also posed a substantial safety risk for the drillers that had to be addressed.
A particular concern related to the drilling was hydrogen sulfide gas (H2S), which is often associated with Yellowstone’s hydrothermal systems and can be toxic. H2S is first noticeable to humans at 0.01–1.5 parts per million (ppm) and has a faint rotten egg smell; at higher concentrations, H2S is odorless and extremely dangerous. Prolonged exposure, up to an hour or more, to concentrations between 10 and 50 ppm can cause nausea, headaches, fatigue, dizziness, and eye and respiratory tract irritation. Concentrations between 400 and 700 ppm can cause unconsciousness within five minutes and death if exposure is not reduced within 30 to 60 minutes. Death is near instantaneous if concentrations exceed 1,000 ppm. The hazard is exemplified by an accident that occurred in this same location on June 26, 1939. During the construction of a previous bridge across the Yellowstone River, three Bureau of Public Roads employees were conducting a routine test pit excavation when H2S overwhelmed two of the workers in the pit. The two victims were eventually rescued, but one worker died the following day.
To determine if the modern-day drilling was impinging on the adjacent local hydrothermal system, geologists from the University of Wyoming measured and recorded temperature and pH variations in groundwater and drill-spoils (the dirt and rock removed from the drill holes) as well as changes in groundwater electrical conductivity at specified time and depth intervals. They also monitored gas concentrations to help ensure a safe work environment. This monitoring involved equipping each worker with personal H2S gas monitors, and a response plan was developed to address geologic hazards and worker risks. In the event of an accidental and hazardous gas exposure, an oxygen supply and full protective gear were on site to ensure a fast and effective response.
The drilling phase of the Yellowstone River bridge project was completed in September 2023 without incident, and in 2024, construction focused on the bridge piers and roadbed (fig. 3). The bridge and associated work is scheduled to be completed in 2026.
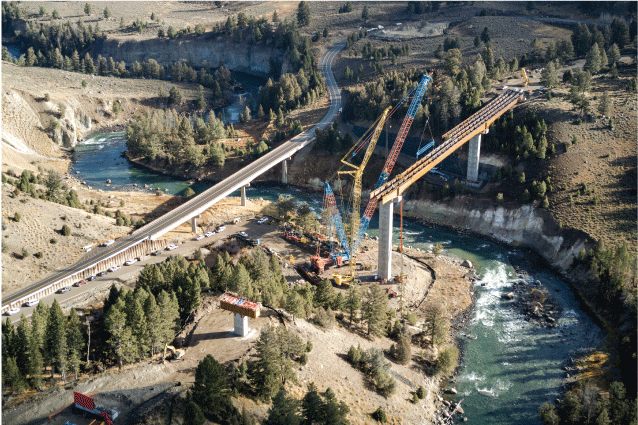
Yellowstone River bridge replacement project near Tower Junction, Wyoming. The existing bridge span, at the left, will be removed and the road realigned when the new bridge span, under construction to the right, is completed. Photograph by Jacob Frank, National Park Service, October 24, 2024.
Yellowstone Lake Webcam
In October 2024, the YVO camera overlooking Yellowstone Lake failed and could not be revived. The camera was installed on a cell tower overlooking the north part of Yellowstone Lake in 2017 (fig. 4). The location provided an unobstructed view of the lake and how it changed over time, for example, with ice forming in winter and melting in the summer. The motivation for the location was an earthquake swarm that occurred over an 11-day span in December 2008–January 2009 in the north part of Yellowstone Lake. The swarm had more than 800 located earthquakes, with 111 events greater than magnitude 2 and the largest reaching magnitude 4.1. The intensity of the swarm attracted a substantial amount of attention from the public, but at that time of year, there were few observations of the lake. YVO scientists realized that a camera with a view of Yellowstone Lake would be a powerful way to detect any anomalous activity.
Although the camera never recorded any geological changes, it was helpful for monitoring other activity—for example, the Brimstone fire (fig. 4), which burned 217 acres just southeast of the lake during August–September 2019 (the largest wildfire in Yellowstone National Park that year). If equipment and permission can be obtained, YVO hopes to replace the Yellowstone Lake camera in 2025 or 2026.
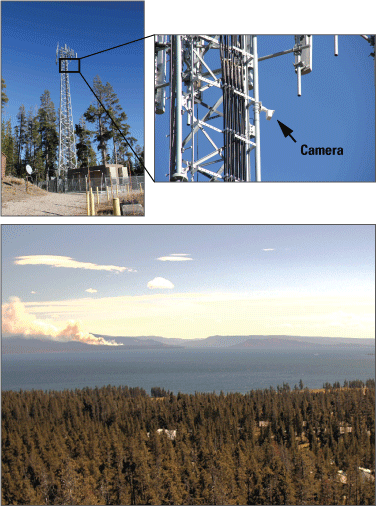
Yellowstone Volcano Observatory (YVO) camera with view of Yellowstone Lake. Top, The YVO camera was near the top of the cellular tower near Lake Village. Photographs by Jake Lowenstern, U.S. Geological Survey, May 2016. Bottom, Camera view of Yellowstone Lake showing the Brimstone fire on September 2, 2019, at 2:05 p.m. mountain daylight time. Installation of webcam conducted under National Park Service research permit YELL-2024-SCI-5842.
Seismology
Earthquakes have been monitored in the Yellowstone region since the 1970s (refer to “Seismicity in Yellowstone Plateau” sidebar). The Yellowstone Seismic Network is maintained and operated by the University of Utah Seismograph Stations, which records data from 46 seismic stations in the Yellowstone region. Typically, about 1,500–2,500 earthquakes are located in and around Yellowstone National Park every year (most of which are too small to be felt by humans), making the Yellowstone region one of the most seismically active areas in the United States.
Overall Seismicity in 2024
During 2024, the University of Utah Seismograph Stations located 1,173 earthquakes in the Yellowstone region (fig. 5), which is less than the typical range of 1,500 to 2,500 earthquakes per year (fig. 1). The total includes 3 magnitude 3 earthquakes, 58 magnitude 2 earthquakes, and 1,112 earthquakes with magnitudes less than 2. Seven earthquakes during the year were felt, meaning that people reported some shaking owing to the proximity and (or) magnitude of the event.
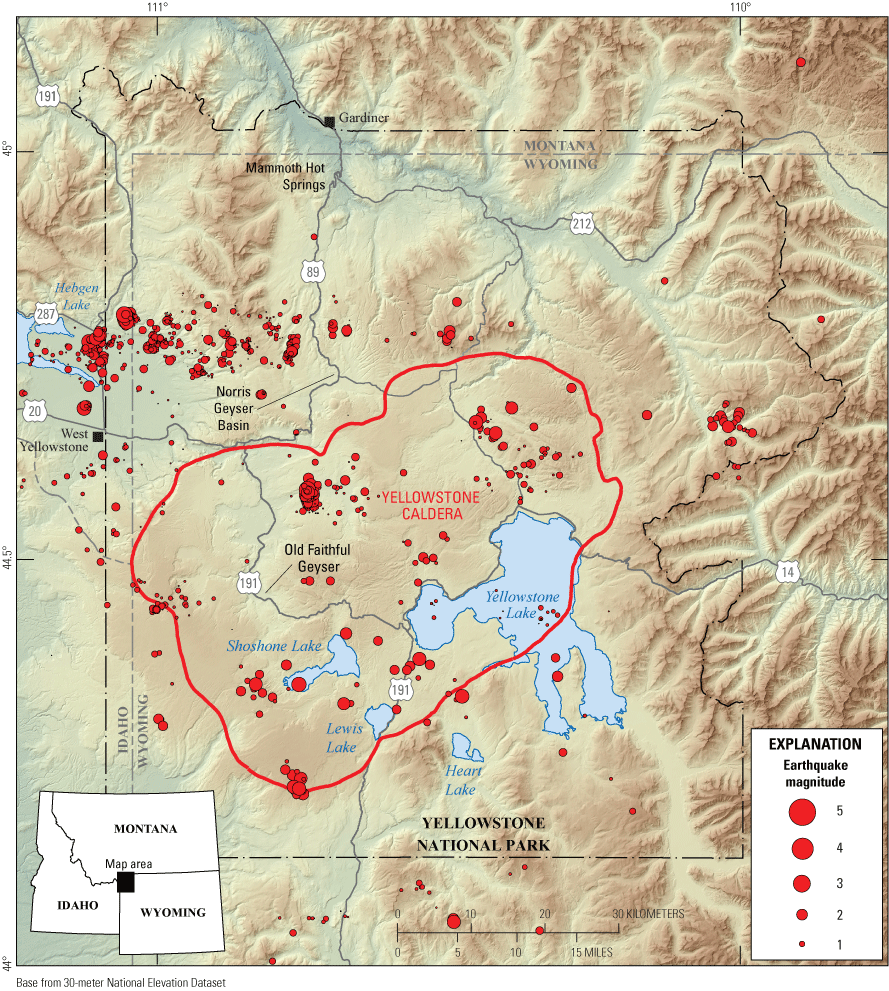
Map of earthquakes (red circles) that occurred during 2024 in the Yellowstone National Park region. Circle size is scaled to the magnitude of the earthquake, where larger circles represent stronger earthquakes.
Box 3. Seismicity in Yellowstone Plateau
Seismicity in the Yellowstone Plateau is monitored by the University of Utah Seismograph Stations. The earthquake monitoring network, known as the Yellowstone Seismic Network, consists of about 46 seismometers installed in the seismically and volcanically active Yellowstone National Park and surrounding area. It is designed for the purpose of monitoring earthquake activity associated with tectonic faulting as well as volcanic and hydrothermal activity. Data are also used to study the subsurface processes of Yellowstone Caldera.
Seismic monitoring in the Yellowstone Plateau began during the early 1970s, when a seismic network was installed by the U.S. Geological Survey. This network operated until the early 1980s when it was discontinued. The network was re-established and expanded by the University of Utah in 1984 and has been in operation ever since. In recent years, the Yellowstone Seismic Network has been updated with modern digital seismic recording equipment, making it one of the most modern volcano-monitoring networks in the world. Data are transmitted from seismic stations in the Yellowstone region to the University of Utah in real-time using a sophisticated radio and satellite telemetry system. Given that Yellowstone Plateau is a high-elevation region that experiences heavy snowfall and frigid temperatures much of the year, and that many of the data transmission sites are located on tall peaks, it is a challenge to keep the data flowing during the harsh winter months. It is not uncommon for seismometers to go offline for short periods when the solar panels or antennas are covered in snow and ice. Sometimes seismometers that go offline during the winter cannot be accessed until the following spring.
Since 1973, there have been more than 60,000 earthquakes located in the Yellowstone region. More than 99 percent of those earthquakes are magnitude 2 or smaller and are not felt by anyone. Since 1973, there has been one magnitude 6 event—the 1975 Norris earthquake located near Norris Geyser Basin (the largest earthquake ever recorded in Yellowstone National Park). There have also been two earthquakes in the magnitude 5 range, 30 earthquakes in the magnitude 4 range, and 417 earthquakes in the magnitude 3 range. The largest earthquake ever recorded in the Yellowstone region was the 1959 magnitude 7.3 Hebgen Lake earthquake, which was located just west of the national park boundary and north-northwest of West Yellowstone, Montana. That earthquake was responsible for 28 deaths and had a major impact on the hydrothermal systems in Yellowstone National Park, including Old Faithful Geyser.
Earthquake swarms (earthquakes that cluster in time and space) account for about 50 percent of the total seismicity in the Yellowstone region. Although they can occur anywhere in the region, they are most common in an east-west band of seismicity between Hebgen Lake and Norris Geyser Basin. Most swarms consist of short bursts of small-magnitude earthquakes, containing 10–20 events and lasting for 1–2 days, although large swarms of thousands of earthquakes lasting for months do occur on occasion (for example, in 1985–86 and in 2017).
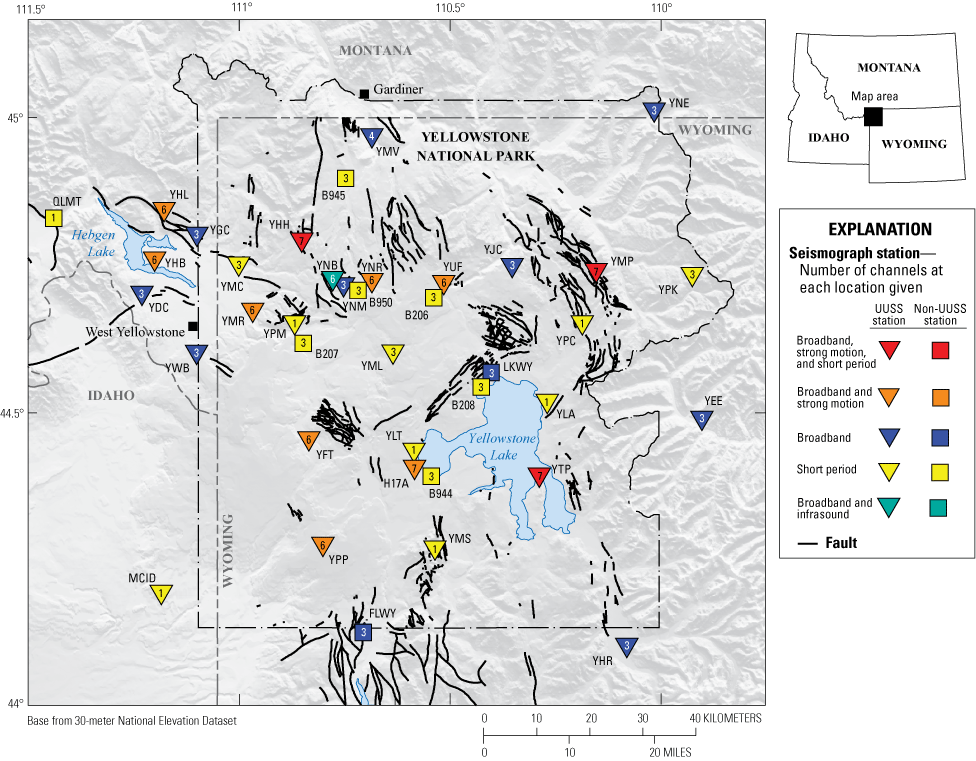
Map of seismometer station locations operated by the University of Utah Seismograph Stations (UUSS) and other agencies. Map view shows the Yellowstone Plateau earthquake catalog region.
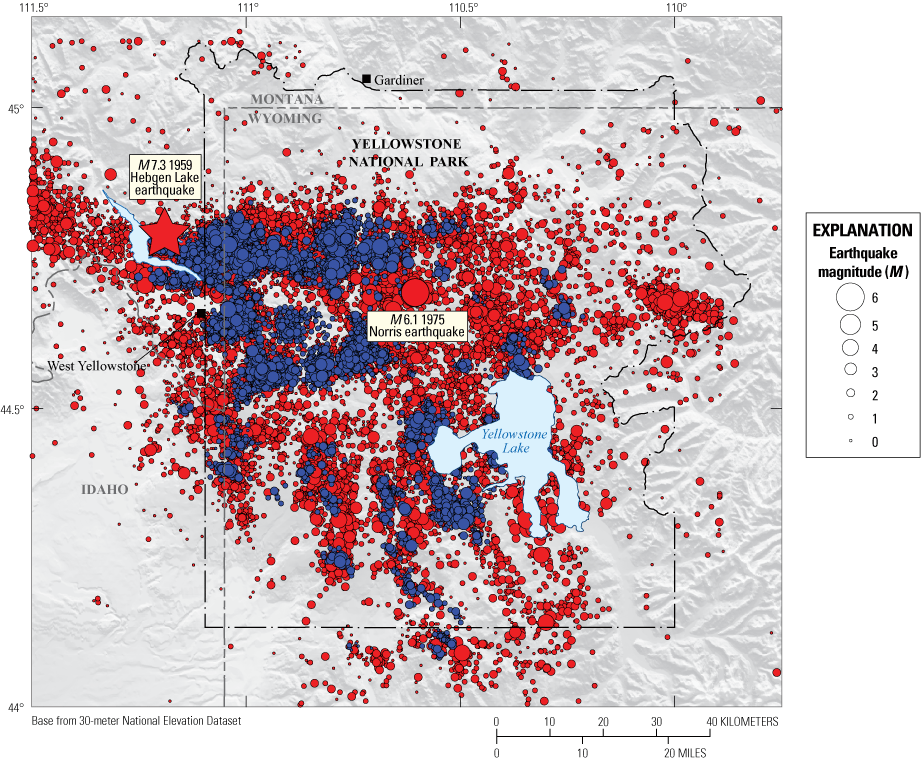
Map of Yellowstone region earthquakes as located by the University of Utah Seismograph Stations from 1973–2023. Red circles represent individual earthquakes and blue circles indicate individual earthquakes that were part of swarms. The star represents the only magnitude (M) 7 earthquake ever recorded in the region. The size of the circles (and star) is scaled to the magnitude of the earthquake, where larger circles represent stronger earthquakes.
Of the total number of recorded earthquakes, about 44 percent occurred as part of 14 swarms, which are defined as the occurrence of many earthquakes in the same small area over a relatively short period of time. Swarm activity is common in the Yellowstone region because of the coincidence of preexisting tectonic faults, magmatism, and abundant groundwater, and about half of all earthquakes that take place in the region occur within swarms. The largest swarm in 2024 consisted of 112 events during January 1–6 just to the northeast of Lower Geyser Basin in Yellowstone National Park and included the largest earthquake of the year, a magnitude 3.3. The second largest swarm of the year occurred during April 21–May 6 along the west boundary of Yellowstone National Park just east of Hebgen Lake, with 98 located events.
Upgrades to the Yellowstone Seismic Network
A long-term project is to upgrade the Yellowstone Seismic Network to a fully digital network, as described in the YVO monitoring plan for the Yellowstone Caldera system (YVO, 2022b). A primary goal of the monitoring plan is to update 2 to 3 stations per year until all analog stations have been upgraded to digital—a modification that will also add the flexibility to include additional sensors in the future. When upgrades are completed, the network will provide state-of-the-art earthquake monitoring and offer volcano seismologists a more powerful tool to investigate many types of earth processes that cause ground shaking, which in turn will support continued advances in understanding the Yellowstone region’s magmatic, tectonic, and hydrothermal systems and associated hazards.
During 2024, three stations, all located near Hebgen Lake and West Yellowstone, Montana, were upgraded from single-component analog channels to three-component digital sensors: YWB, YGC, and YDC. In addition, digitizers were upgraded at three additional sites, YHH, YTP, and YPP; analog equipment, which has been operating in parallel with digital sensors, was removed from stations YPP and YHB; solar power systems were upgraded at station YHH; and battery capacity was upgraded at stations YFT, YNE, and YMS. Station YSB, in the northeast part of Yellowstone National Park, was decommissioned and removed because power and telemetry problems prevented it from operating reliably. If a permit is approved, a new digital seismic station will be installed in the northeast part of Yellowstone National Park near GPS site P720 in 2025 to replace YSB.
Geodesy
Geodesy is the scientific discipline focused on changes in the shape of Earth’s surface, called deformation. In and around Yellowstone Caldera, deformation is caused by a combination of magmatic, tectonic, and hydrothermal processes. Ground motion is measured using networks of GPS2 stations, borehole tiltmeters and strainmeters, and a satellite-based remote-sensing technique called interferometric synthetic aperture radar (InSAR) (refer to “Monitoring Geodetic Change in the Yellowstone Region” sidebar). Changes in Earth’s gravity field, which can indicate subsurface mass changes caused by, for example, movement of magma or groundwater, is also a subfield of geodesy. Geodetic measurements are used to develop models of the sources of deformation and gravity changes as far as several kilometers (miles) beneath the surface, which can provide insights into the physical processes responsible for changes measured at the surface.
In this report, we use GPS as a general and more familiar term for Global Navigation Satellite Systems (GNSS), even though GPS specifically refers to the Global Positioning System operated by the United States.
Box 4. Monitoring Geodetic Change in the Yellowstone Region
Subtle changes to the shape of a volcano’s surface, called deformation, can be caused by the accumulation, withdrawal, or migration of magma, gas, or other fluids (usually water) beneath the ground or by movements in Earth’s crust owing to motion along faults. Typically, this deformation is very small in magnitude—a few centimeters (inches) or less—and so can only be detected and monitored using very sensitive instruments. Changes in the amount of material beneath the ground also result in variations in gravity at the surface. Combining measurements of gravity change with deformation can help scientists determine the type of fluid that is accumulating or withdrawing—for example, magma versus gas.
By measuring the pattern and style of surface deformation, it is possible to determine the location of subsurface fluid storage areas. For example, as magma or water accumulates in a reservoir below ground, the surface above will swell. The pattern of this surface inflation can be used to identify the depth of fluid accumulation, and the scale of the deformation can provide information on how much and what type of fluid is accumulating. By monitoring changes in deformation over time, it is possible to assess how magma, water, and gas are moving in the subsurface. The technique is an important tool for forecasting potential future volcanic eruptions. In the days, months, and years before a volcanic eruption, many volcanoes inflate as magma accumulates underground. Yellowstone Caldera presents a complicated situation because deformation may be caused by magma, water, or gas, as well as non-volcanic processes such as fault or landslide motion.
A variety of techniques are used to monitor ground deformation in the Yellowstone region. EarthScope Consortium operates the Geodetic Facility for the Advancement of Geoscience (GAGE), including the Network of the Americas, a hemispherical-scale geodetic network composed of geodetic-grade Global Positioning System (GPS) instrumentation as well as high-precision borehole tensor strainmeters and tiltmeters, all of which are present in Yellowstone National Park. Borehole strainmeters and tiltmeters are designed to detect very small changes in deformation style especially over short time intervals (even down to minutes), but they tend to drift over days to weeks and so cannot track long-term ground deformation. This is why GPS, the backbone of the Yellowstone Volcano Observatory deformation monitoring network, is so important. There are 16 continuously recording GPS stations within Yellowstone National Park and many more in the surrounding region. Measurements from these sites are used to precisely record the horizontal and vertical positions of fixed points at the surface. Variation in the positions over time gives an indication of how the ground in the Yellowstone region deforms owing to local processes, such as subsurface fluid accumulation and withdrawal or faulting caused by earthquakes. Data from continuous GPS stations in the Yellowstone region are transmitted via radio and satellite links to EarthScope Consortium’s GAGE archives, where they are made publicly available at https://www.earthscope.org/.
Semipermanent GPS sites are temporary stations that are deployed in late spring and collected in early fall. Measurements from these portable sensors significantly add to the number of instruments measuring deformation in the Yellowstone region and help track year-to-year changes. Compared to continuous GPS, semipermanent GPS stations are less expensive and less intrusive on the landscape, and they are portable enough to be deployed in areas that might be off limits to a continuous GPS installation. Disadvantages of semipermanent GPS stations include that measurements are intermittent, whereas continuous GPS measurements are collected year-round, and that semipermanent GPS data are not telemetered and so are available only after the stations have been retrieved. Used together, however, the two approaches complement one another by providing precise ground deformation measurements from more than 30 sites in Yellowstone National Park.
Yellowstone Volcano Observatory scientists also use satellite measurements, called interferometric synthetic aperture radar (InSAR), to take a broad snapshot of deformation. Two radar images of the same area that were collected at different times from similar vantage points in space are compared against each other. Any movement of the ground surface toward or away from the satellite is measured and portrayed as a “picture”—not of the surface itself but of how much the surface moved during the time between images. Unlike visible or infrared light, radar waves penetrate most weather clouds and are equally effective in darkness; using InSAR, it is possible to track ground deformation even in bad weather and at night. Although it is less precise than GPS, InSAR has the advantages of showing the entire pattern of surface deformation as a spatially continuous image, and the technique does not require access to or installations in the study area. Disadvantages are that current InSAR satellites collect images several days apart (whereas GPS measurements are continuous), InSAR only shows deformation in one direction (line-of-sight of the satellite) compared to the three-dimensional deformation measured by GPS, and InSAR measurements are not usable during winter months in the Yellowstone region because most of the surface is covered with snow.
Measurements of changes in Earth’s gravity field are another means to study processes that occur underground, hidden from sight. For example, gravity will increase slightly if more magma accumulates in a shallow reservoir, or if porous rock fills with groundwater. By combining gravity measurements (which can record changes in subsurface mass) with deformation (which can indicate changes in subsurface volume), it is possible to calculate the density of the fluids that are driving the changes seen at the surface. High-density fluids are likely to be magma, whereas low-density fluids may be water or gas.
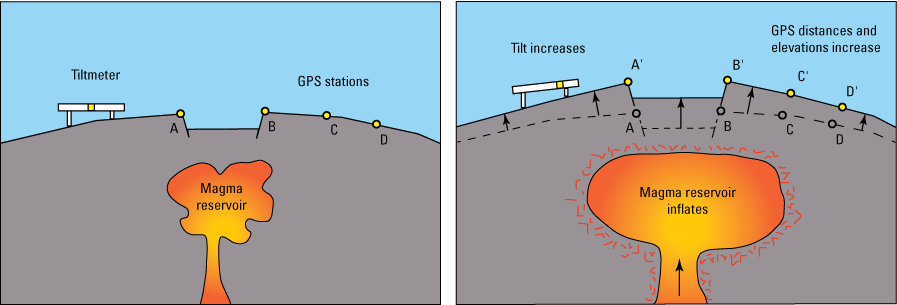
Schematic illustration showing how the ground changes shape as magma accumulates beneath the surface. GPS, Global Positioning System.
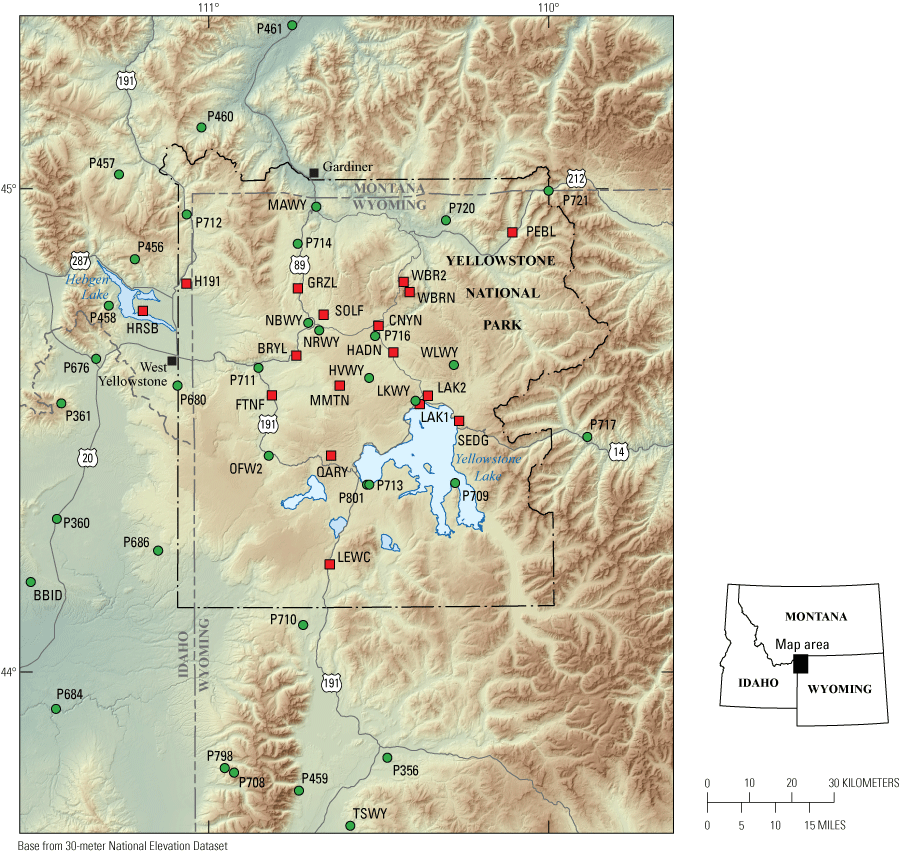
Map showing locations of continuous (green circles) and semipermanent (red squares) Global Positioning System (GPS) sites in the Yellowstone region. Photograph shows continuous GPS station P711 in Yellowstone National Park.
Map of past ground deformation in the Yellowstone region. This image was created using data from satellite passes in 1996 and 2000. The image shows 125 millimeters (about 5 inches) of uplift centered near the north rim of Yellowstone Caldera, about 10 kilometers (6.2 miles) south of Norris Geyser Basin. Each full cycle of color (from red through green to purple) represents about 28 millimeters (1 inch) of surface movement toward or away from the satellite (mostly uplift or subsidence). Here, the bullseye centered along the north caldera rim near Norris Geyser Basin shows an area of uplift approximately 35×40 kilometers (22×25 miles) in size. Modified from U.S. Geological Survey Professional Paper 1788 (Dzurisin and others, 2012).
Overall Deformation in 2024
Ground deformation throughout 2024 followed patterns established since 2021. Subsidence of Yellowstone Caldera occurred at a rate of 2 to 3 centimeters (about 1 inch) per year (fig. 6), continuing the trend that, except for a brief period of uplift in 2014–2015, has persisted since 2010 (fig. 7). The subsidence is interrupted each summer by a few-month pause, or even a small amount (about 1 centimeter, or 0.4 inch) of uplift (fig. 7), caused by seasonal groundwater and snowmelt conditions. At Norris Geyser Basin, a period of uplift began in late 2015 or early 2016, stalled in late 2018, and was followed by a minor amount of subsidence that ceased in 2020, with no substantial changes in 2024 (fig. 6).
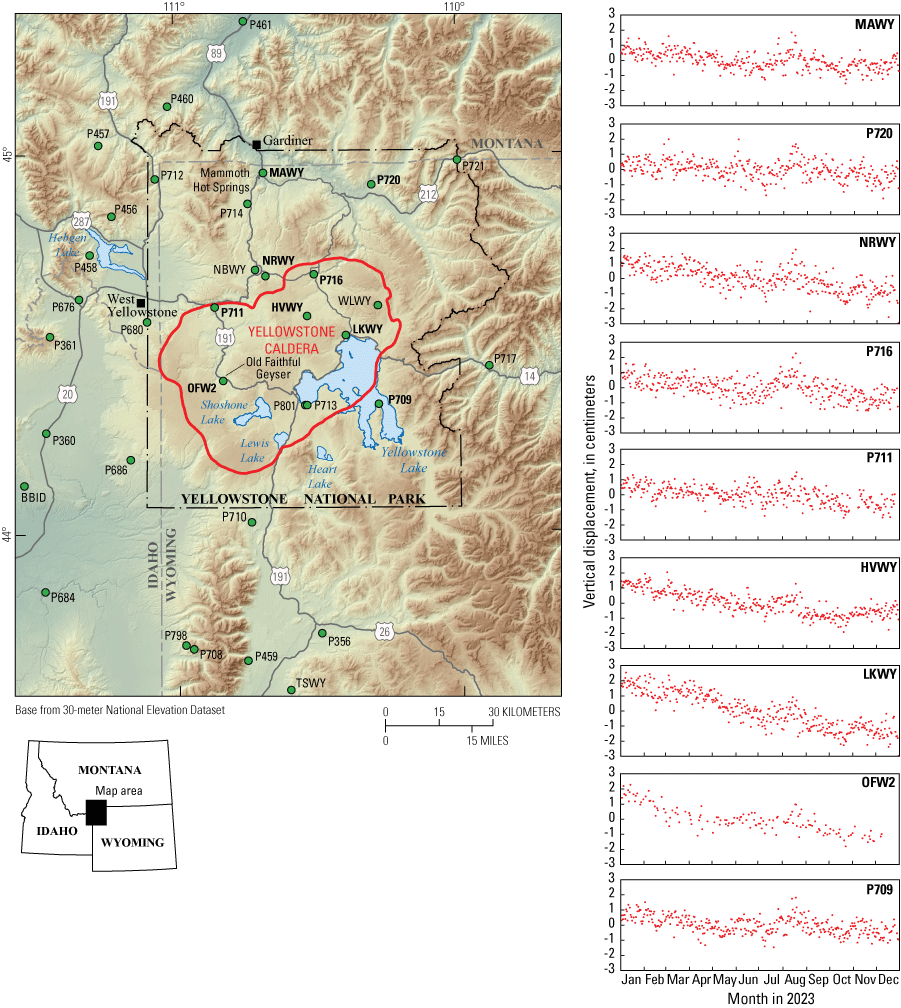
Map of Global Positioning System (GPS) stations showing the deformation observed in Yellowstone National Park in 2024. Solid red line indicates boundary of Yellowstone Caldera. Vertical displacement (up or down movement of the ground) throughout the year is plotted for nine selected GPS stations (green dots with station names in bold) located around the national park. The vertical axis of all plots is in centimeters (1 centimeter is equal to about 0.4 inch). Downward trends indicate subsidence and upward trends indicate uplift. General trends during 2024 are subsidence within Yellowstone Caldera (exemplified by stations LKWY and OFW2) and less than a few millimeters of net vertical motion elsewhere, including at Norris Geyser Basin (station NRWY). All stations show slight uplift during the summer months, which is a seasonal signal owing to changing groundwater and snowmelt conditions. Gaps during time series indicate periods when GPS stations were not operational.
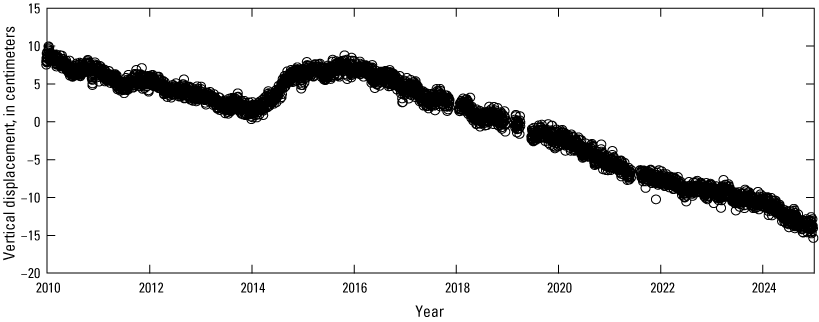
Vertical displacement (up or down movement of the ground) since 2010 measured at the LKWY continuous GPS station on the southeast side of Yellowstone Caldera (refer to fig. 6 for station location). Each black circle represents a single day of data. The station measured subsidence during 2010–2024 except for a brief period of uplift in 2014–2015, with an overall subsidence rate of 2–3 centimeters (about 1 inch) per year. Each summer, the subsidence trend is interrupted by a pause in deformation or a transition to slight uplift because of seasonal groundwater and snowmelt conditions.
In 2024, five borehole tiltmeters and four borehole strainmeters were operating within Yellowstone National Park. These exceptionally sensitive instruments are most useful for detecting short-term changes in deformation (for example, owing to earthquakes or sudden fluid movements). Because their signals can drift over periods of weeks to months and indicate trends not related to deformation, tilt and strain measurements are less useful for determining long-term (months to years) deformation patterns. The tiltmeter and strainmeter networks detected no meaningful changes during 2024. Several of the instrument sites were upgraded with satellite telemetry and other improvements during the year.
Continuous GPS Results
Throughout 2024, surface deformation measured by 16 continuous GPS stations in Yellowstone National Park mostly followed trends established during previous years. Stations inside Yellowstone Caldera subsided at rates of 2–3 centimeters (about 1 inch) per year, following patterns that have been ongoing since late 2015 or early 2016 (refer to fig. 6). During summer months, the subsidence stalls, and can even reverse slightly, with as much as about 1 centimeter (0.4 inch) of uplift interrupting the ongoing subsidence. This seasonal variation is observed during most summers and is related to groundwater and snowmelt conditions and is not due to the magmatic or hydrothermal systems. During 2024, the seasonal pause in subsidence was manifested as slight uplift at most GPS stations in Yellowstone National Park, beginning in May or June and lasting until September or October.
At Norris Geyser Basin there has been little net deformation in the past 5 years. Uplift that began in late 2015 or early 2016 paused in late 2018 (refer to 2018 YVO annual report [YVO, 2021a]) and gave way to slow subsidence in September 2019, which stopped in 2020. Similar to the GPS stations in the caldera, seasonal uplift in 2024 near Norris Geyser Basin began in late May, accumulating about 1 centimeter (about 0.4 inch) by late September. Little change occurred through the remainder of the year.
Station coordinates and daily time-series plots for the Yellowstone region continuous GPS stations are available at https://earthquake.usgs.gov/monitoring/gps/YellowstoneContin. Station WLWY, on the east side of Yellowstone Caldera on the Sour Creek dome, malfunctioned in late May 2024. The antenna and receiver were replaced in September 2024, but additional repairs are needed before the station can be made operational; another maintenance visit is planned for summer 2025. During the year, satellite telemetry upgrades were completed at a few GPS sites in the region, including P712 and P721 in Yellowstone National Park.
Semipermanent GPS Results
The Yellowstone semipermanent GPS (SPGPS) network in 2024 consisted of 15 stations in the park and one (HRSB) in the adjacent Hebgen Lake Ranger District of Gallatin National Forest (fig. 8). Fifteen of the sites were deployed in May 2024, with the remaining one, MMTN, deployed in July when snow conditions permitted access. All 16 stations were recovered in August/September. With the exception of site LAK2, which was not operational for four days during its deployment, all the SPGPS stations recorded useful data for the duration of their deployments (in total, 99.75 percent data retrieval). These temporary stations, which have only a small footprint on the landscape (about ten square feet, or one square meter, per station), are intended to complement the year-round operation of the continuous GPS (CGPS) network and to take advantage of generally benign summertime conditions to collect data while avoiding harsh Rocky Mountain winters. For more information on the SPGPS technique, refer to the “Monitoring Geodetic Change in the Yellowstone Region” sidebar.
Both SPGPS and CGPS stations record not only ground deformation caused by volcanic and tectonic processes but also unrelated short-term signals. These include seasonal effects, like changes in lake and groundwater levels that cause variable loading of the surface (YVO, 2019), as well as noise that occurs when a GPS antenna is covered with snow or ice, which is especially common near the start or end of the deployments. Such signals are easier to identify on records from CGPS stations than from SPGPS stations, which are deployed for only part of the year. For this reason, unless the deformation rate is unusually high, data from SPGPS stations are best compared from year to year, ignoring small variations during any one year.
From 2023 to 2024, most of the SPGPS stations recorded only small seasonal effects or weather-related noise, with little net change (fig. 8). Exceptions were stations in the central part of Yellowstone Caldera, including LAK1, HADN, and MMTN, which recorded a few centimeters of net subsidence over the two-year period, consistent with results from CGPS stations (refer to “Continuous GPS Results” section) and interferometric synthetic aperture radar, or InSAR (refer to “InSAR” section). Also consistent with the CGPS and InSAR results, the SPGPS data indicate no appreciable deformation in the vicinity of Norris Geyser Basin, for example, at BRYL and GRZL.
Station coordinates and daily time series plots for Yellowstone SPGPS stations are available at https://earthquake.usgs.gov/monitoring/gps/Yellowstone_SPGPS.
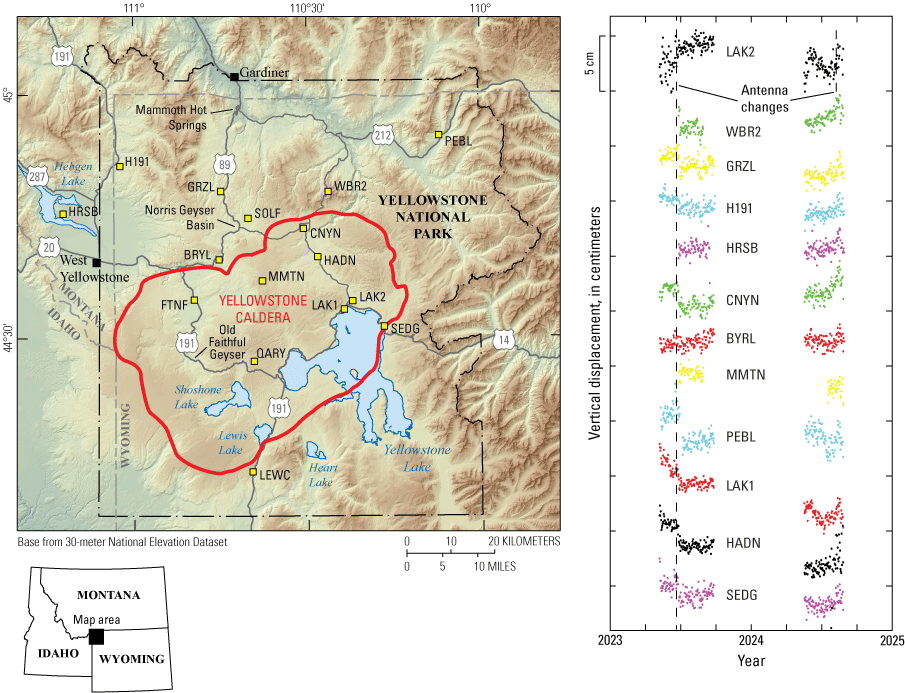
Map of semipermanent Global Positioning System (SPGPS) stations showing changes observed in Yellowstone National Park from 2023 to 2024. Vertical displacement (up or down movement of the ground) is plotted for 12 selected SPGPS stations (yellow squares) within or just outside the park. The distance between tick marks on the vertical axis is 5 centimeters (cm) (about 2 inches). Downward trends indicate subsidence and upward trends indicate uplift. Each dot marks a single day of data. Most SPGPS stations recorded small seasonal effects with little net change. Dashed vertical line in 2023 marks time when older GPS receivers and antennas were swapped for newer equipment, which caused a vertical offset in most time series that does not reflect real ground motion. The LAK2 antenna was also modified in 2024, causing a small offset towards the end of the time series that year.
Interferometric Synthetic Aperture Radar Results
Satellite interferometric synthetic aperture radar (InSAR) uses measurements from radar satellites to map ground deformation by comparing satellite-to-ground distances at different times. Resulting images are called interferograms, and they show how much the surface moved during the time between satellite observations. For more information about the InSAR technique, refer to the sidebar on monitoring geodetic change (p. $X–$X).
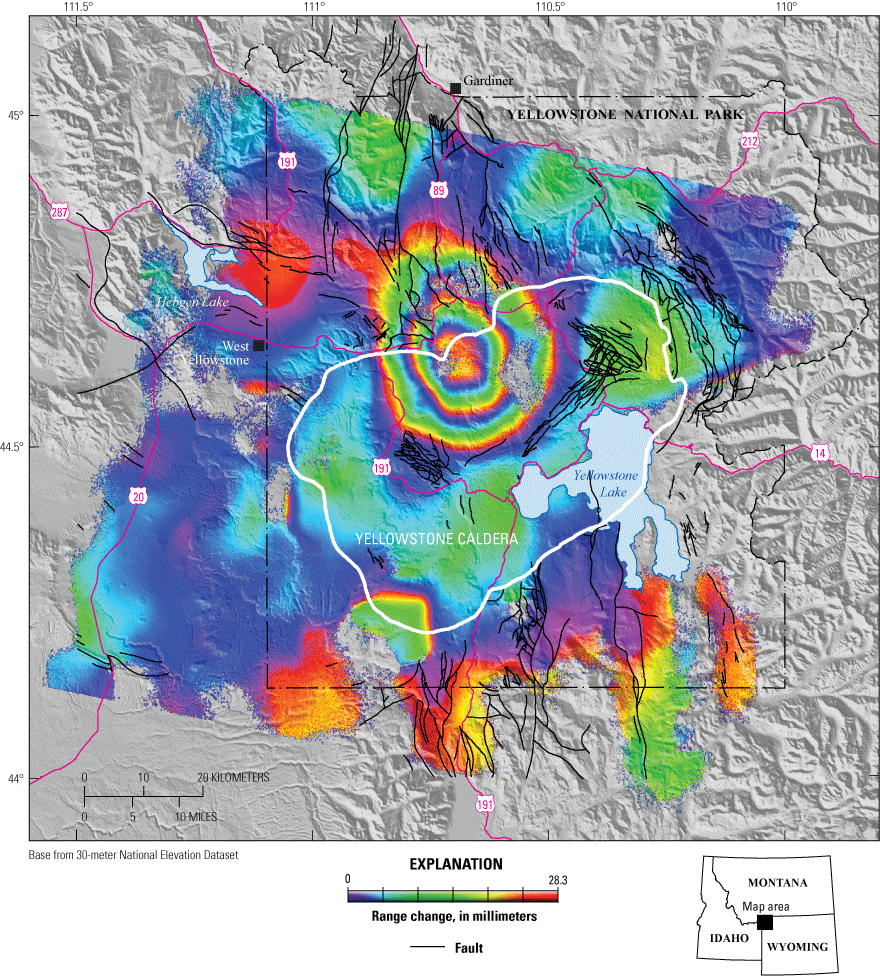
A radar interferogram that spans the period from October 1, 2023, to October 7, 2024, shows about 3 centimeters (1.2 inches) of subsidence of Yellowstone Caldera, maximized near the caldera center (fig. 9). This pattern of caldera deformation is similar to that from the preceding several years. No deformation is apparent outside the caldera, including in the area between Norris Geyser Basin and the north caldera rim. Interferograms spanning 2020–2021 show about 1 centimeter (0.4 inch) of uplift in that area (YVO, 2022a), followed by an equivalent amount of subsidence in the same area during 2021–2022 (YVO, 2023). The region between the caldera and Norris Geyser Basin has seen varying deformation many centimeters (several inches) in magnitude during recent decades related to both magma and water accumulation and withdrawal (Wicks and others, 2020). An episode that began in 1996 and lasted until 2004 resulted in uplift of 12 centimeters (4.7 inches) at a rate of approximately 1.5 centimeters (0.6 inch) per year and was probably caused by magma accumulation at a depth of about 14 kilometers (almost 9 miles). More localized episodes of uplift and subsidence in 2013–2014 and 2016–2018 appear to be caused by water and gas accumulation and drainage at shallower depths of about 2–3 kilometers (1.2–1.9 miles), but the area did not deform significantly in 2023 or 2024.
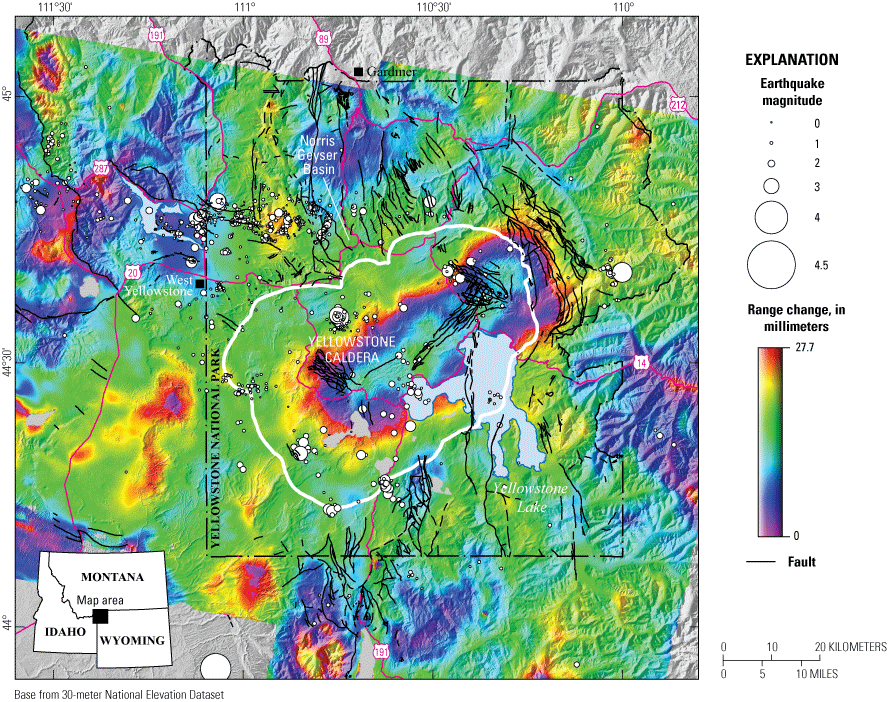
Interferogram created from satellite radar data collected on October 1, 2023, and October 7, 2024, over the Yellowstone region by the Sentinel-1 satellite system. Colored fringes indicate a change in distance (called range change) between the satellite and ground surface that is caused by surface deformation. In this interferogram, the fringes indicate subsidence (an increase in the range between the ground and the satellite) of about 3 centimeters (about 1.2 inches) in the central part of Yellowstone Caldera during the one-year period between the image acquisition times. Fringes outside the caldera are mostly related to atmospheric artifacts and do not reflect real ground motion. White circles show earthquakes that occurred during the time spanned by the interferogram. Circle size scales with magnitude, with the largest magnitude 3.3 in Yellowstone National Park and magnitude 3.9 south of the park at the bottom of the map.
Geochemistry
Geochemical studies aim at better understanding the interface between hydrothermal and magmatic systems in the Yellowstone region, with the ultimate goal of investigating processes that are hidden from direct observation (refer to “Geochemical Monitoring in Yellowstone Caldera” sidebar). Thermal features provide a window into the subsurface characteristics of Yellowstone National Park, not only through the chemical composition of the emitted waters, but also from the composition and flux of gases possibly emanating from subsurface magma.
Box 5. Geochemical Monitoring in Yellowstone Caldera
Deep beneath the surface, gases are dissolved in magma. As magma rises toward the surface, however, the pressure decreases, allowing gases to separate from the liquid and form bubbles. Because gas is less dense than magma, the bubbles can rise more quickly and be detected at the surface of the Earth.
Similarly, water can also transport material up to the surface where it can be studied by scientists. Groundwater circulates deep within the Earth’s crust in volcanic regions, where it can be heated by magma to more than 200 °C (around 400 °F). This heating causes water to rise along fractures, bringing dissolved chemical components up toward the surface. By studying the chemical makeup of this thermal water, scientists can gain a better picture of the conditions deep within a volcano.
In Yellowstone Caldera, volcanic gas emissions are usually sampled by hand directly from fumaroles (gas vents), although some temporary automated measurements of certain types of gases are also possible. Likewise, measurements of water chemistry are typically made by collecting samples and analyzing the chemical makeup of the water in the laboratory.
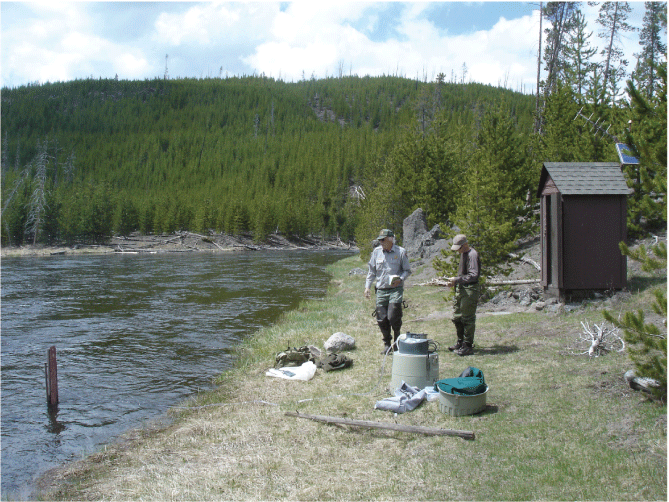
National Park Service scientists collect water samples from the Firehole River in Yellowstone National Park. Photograph by Jim Ball, U.S. Geological Survey, 2014.
Summary of Geochemistry Activities in 2024
In 2024, YVO scientists continued with gas emission measurements and water sampling in targeted areas for laboratory analysis. The multicomponent Gas Analyzer System (multi-GAS) that was installed in the Mud Volcano area in 2021 (YVO, 2022a) continued to collect water vapor, hydrogen sulfide, and carbon dioxide concentrations throughout 2024. In addition, in 2024 a water chemistry data release that compiled water sample results extending back to 1883 was published—the largest water quality dataset ever compiled for the Yellowstone region. Research results included a study of hydrothermal plumbing in the area of Beryl Spring.
Gas Emissions
A study of gas emissions from around Obsidian Pool, in the Mud Volcano thermal area, continued in 2024. Gases emitted from the Mud Volcano thermal area have the highest magmatic components in the Yellowstone region, and monitoring in the area may be useful for detecting any future changes in the magmatic system. The multi-GAS installed in July 2021 (station “MUD”; fig. 10) continued to operate through 2024, making high frequency (once per second) measurements of water vapor (H2O), carbon dioxide (CO2), hydrogen sulfide (H2S), and sulfur dioxide (SO2) concentrations in gas plumes emitted from hydrothermal features, along with wind speed and direction, atmospheric pressure and temperature, relative humidity, and ground temperature (fig. 11). The real-time data from the MUD multi-GAS station are available on the YVO monitoring page (https://www.usgs.gov/volcanoes/yellowstone).
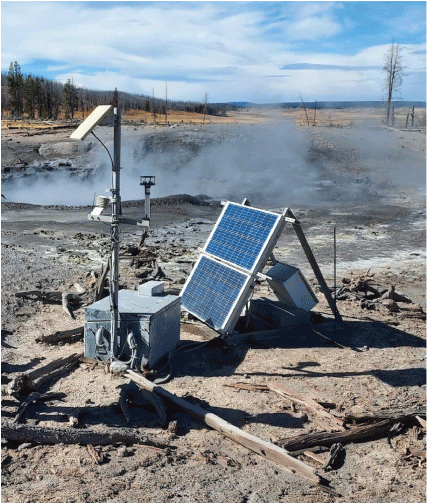
Photograph of the MUD multi-GAS station in the Obsidian Pool region of the Mud Volcano thermal area. Photograph by Laura Dobeck, U.S. Geological Survey, October 11, 2024. Research conducted under National Park Service research permit YELL-2024-SCI-7082.
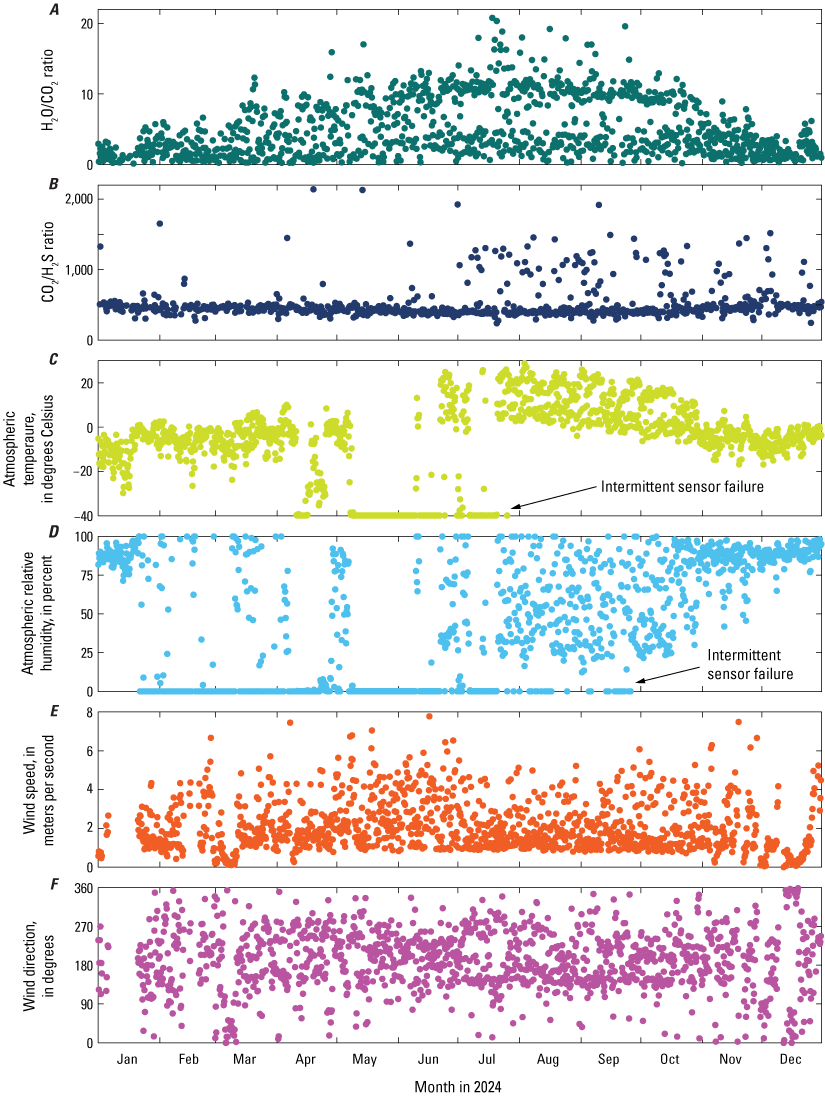
Time series of 30-minute average (A) water to carbon dioxide (H2O/CO2) ratio, (B) carbon dioxide to hydrogen sulfide (CO2/H2S) ratio, (C) atmospheric temperature, (D) relative humidity, (E) wind speed, and (F) wind direction measured by the MUD multi-GAS station.
Except for intermittent problems with atmospheric temperature and relative humidity sensors (figs. 11C and 11D), the MUD station remained operational throughout 2024. Consistent with observations from 2021–2023 (YVO, 2022a, 2023, 2024), the 30-minute average H2O, CO2, and H2S concentrations measured by MUD ranged from <1 to 23 parts per thousand by volume, 457 to 1,283 parts per million by volume, and <0.1 to 2 parts per million by volume, respectively. SO2 was not detected. Time series of 30-minute average H2O/CO2 and CO2/H2S ratios and meteorological parameters are shown in fig. 11. Average H2O/CO2 and CO2/H2S ratios ranged from <1 to 22 and 238 to 2,139, respectively (figs. 11A and 11B). These results were similar to observations in prior years. During winter months, CO2/H2S ratios were higher and H2O/CO2 ratios lower, on average, reflecting plume water condensation and H2S scrubbing (removal of H2S by groundwater) with low atmospheric temperatures and high relative humidity (figs. 11A–11D).
Thermal Water Studies
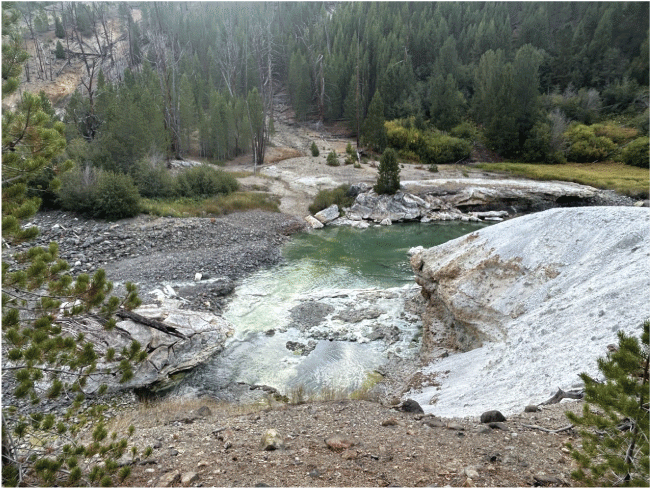
In spring and summer 2024, scientists from the USGS and Yellowstone National Park sampled thermal waters at Biscuit Basin, Hillside Springs, Upper and Lower Geyser Basin, Norris Geyser Basin, Wahb Springs in Northeast Yellowstone National Park (fig. 12), and several lakes in and near Lower Geyser Basin. At each sample site, a variety of field measurements were collected (for example, pH, specific conductance, temperature, and hydrogen sulfide concentration), and water samples were taken for the determination of major cations, anions, trace metals, redox species (iron, arsenic, mercury), water stable isotopes, and also tritium (for some samples). Gas samples were collected from Death Gulch, Wahb Springs, Norris Geyser Basin, the Mud Volcano area, and at a new fumarole that formed in July 2024 north of Nymph Lake (refer to “New Steam Vent Near Nymph Lake” section). Water and gas samples collected in the summer of 2024 will be analyzed during the winter of 2024–2025, and data and interpretive reports are planned for 2025.
Photograph of Whab Springs in northeast Yellowstone National Park. The water samples that were collected from a small pool in the Wahb Springs group have the highest reported hydrogen sulfide concentration (H2S = 44 mg/L). Photograph by David Roth, U.S. Geological Survey, September 2024. Research conducted under National Park Service research permit YELL-2024-SCI-5194.
The water chemistry of several features in Norris Geyser Basin and Lower Geyser Basin is regularly monitored to document and investigate variations in hydrothermal activity. Thermal features that are the sites of long-term monitoring include Cistern Spring, Cinder Pool, Porkchop Geyser, and Perpetual Spouter in Norris Geyser Basin, and Ojo Caliente Spring in Lower Geyser Basin. In addition, the seasonal effects on thermal water chemistry are being investigated at Hillside Springs, located on the side of a hill to the west of the Firehole River near Biscuit Basin. Water discharging from Hillside Springs is thought to be a mixture of deep thermal water and shallower groundwater—a perfect site to investigate the seasonal effects of snowmelt on the shallow hydrothermal system. Finally, the water chemistry of lakes near Lower Geyser Basin was sampled to determine whether the lakes are receiving thermal waters, as well as their general chemical composition.
Water Chemistry Data Compilation
Scientists have studied water chemistry in Yellowstone National Park for over a century. As a result of this collective multigenerational effort, it is possible to examine broad patterns across space and time, providing insights into trends in the park’s hydrologic and geologic systems and guiding future research. Because much of this work was published before the advent of modern computer technologies, access to historical data has been limited. Many reports are preserved only as paper copies or low-resolution scans, making it challenging and time-consuming to locate, extract, and use their data.
To address this problem, a new USGS data release (Price and others, 2024) compiled data from dozens of historical and modern reports on Yellowstone water chemistry. The dataset includes information from water samples collected in the Yellowstone region over the last 140 years, as well as details about location and date, sampling methods, and quality-control procedures taken to confirm the reliability of the data. Included in the compilation are results from 4,918 discrete samples from 38 published reports between 1883 and 2021, as well as data collected but never published by multiple USGS research groups. Across all these sources, more than 100 types of results are reported, including basic field measurements (such as temperature, pH, and specific conductance), major ion concentrations, trace metals, redox species of sulfur, arsenic, and iron, various isotopes, and tritium, among others. More than 600 individual features (including rivers and streams, hydrothermal features, drillholes, and precipitation gages) in and around the park are represented. These data were compiled through careful analysis of available paper and digital copies of publications, manual digitization of tables, and thorough checking for erroneous values or duplicated samples. Sample information has been harmonized, so all results are reported in the same order and with the same units.
This dataset is designed to simplify the exploration of trends in Yellowstone water chemistry and provides a comprehensive body of analyses and detailed descriptions of who examined particular aspects of the system and where their reports can be found. Users can sort the data by sample collection date, sample type, collection area or location, original report, or any of the 100 reported chemical analytes.
Hydrothermal Plumbing of Beryl Spring Area
Beryl Spring (fig. 13), located in Gibbon Canyon alongside the road, is an extraordinary thermal feature that provides insight into the hydrothermal processes occurring deep in the subsurface. The area around Beryl Spring consists of a roaring fumarole (gas vent) adjacent to a blue-water spring and another spring just to the east beneath the road, which had to be specially engineered with a bridge because of that corrosive thermal feature. Scientists from the University of Wyoming integrated geophysical data, gas measurements, and chemical analyses collected from the Beryl Spring area to: (1) understand the subsurface plumbing system beneath Beryl Spring’s hydrothermal features; (2) image phase separation—gas separating from liquid—below ground, which results in different chemical compositions at the surface; and (3) characterize the age and water-rock interactions of the deeply sourced hydrothermal fluid discharging from Beryl Spring.
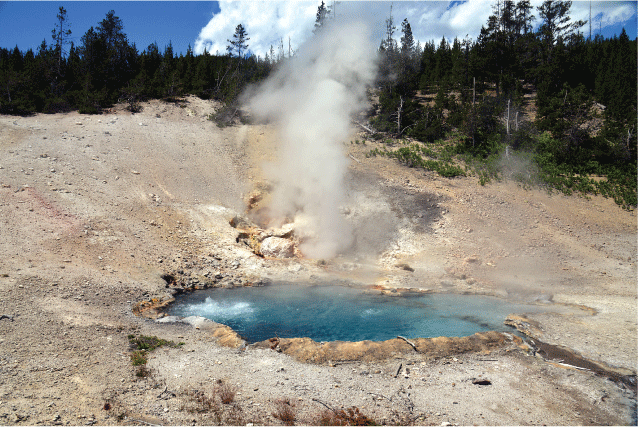
Gas vent and adjacent blue-water spring that make up part of the Beryl Spring thermal area along the Gibbon River between Madison Junction and Norris Geyser Basin in Yellowstone National Park. Photograph by G. Edward Johnson, July 15, 2019, (https://commons.wikimedia.org/wiki/File:Beryl_spring_20190715_135435_1.jpg). This photograph is licensed under the Creative Commons Attribution 3.0 Unported license (https://creativecommons.org/licenses/by/3.0/).
Radiogenic isotopes can provide powerful insights into water-rock interactions occurring at depth in the Yellowstone hydrothermal system. Beryl Spring has a lead isotope ratio (208Pb/206Pb) of 2.08 and a strontium isotope ratio (87Sr/86Sr) of 0.7094. When compared to the lead and strontium isotopic compositions of lava and ash deposits erupted by the Yellowstone volcanic system and sedimentary rocks present throughout the region, the isotopic composition of Beryl Spring fluids more closely aligns with the sedimentary rock. This result indicates that the hydrothermal fluids emitted from Beryl Spring circulate through these rocks, far below the volcanic rocks that make up near-surface geologic units.
Electrical resistivity surveys were also conducted to investigate subsurface structure. Shallow areas of high resistivity were interpreted as engineered structures of the roadway or areas of unaltered rock. Low resistivity areas, occurring around the thermal features, were interpreted as up-flow zones of hydrothermal fluids feeding the different pools, saturated soils from the discharge of the pools, or as areas of substantially altered rock from hydrothermal activity. Soil CO2 gas surveys conducted in 2023 and 2024 identified areas of high gas flux to the north-northwest of Beryl Spring, associated with the work that was done to prevent the feature beneath the roadbed from affecting the road’s integrity. Airborne electromagnetic surveys to the north and south of Beryl Spring reveal a low-resistivity area extending across the Gibbon River from Beryl Spring and may indicate upward-flowing hydrothermal fluids, possibly connecting all the features in the area to the deeper subsurface reservoir.
Geology
Geologic research in Yellowstone National Park is focused on interpreting the rock record as a means of better understanding conditions that preceded and accompanied past volcanic eruptions and hydrothermal explosions. The primary tools for this work include mapping rock compositions and structures, as well as determining the ages of specific rock units. This work established the foundation for understanding eruptions in the Yellowstone region (refer to “Geology of the Yellowstone Plateau” sidebar) and continues to be refined as new analytical tools become available and as mapping becomes sufficiently detailed to better identify small-scale features.
Box 6. Geology of the Yellowstone Plateau
The Yellowstone Plateau volcanic field developed through three volcanic cycles that span 2 million years and include two of the world’s largest known volcanic eruptions. About 2.1 million years ago, eruption of the Huckleberry Ridge Tuff produced more than 2,450 cubic kilometers (588 cubic miles) of volcanic deposits—enough material to cover the entire State of Wyoming in a layer 10 meters (30 feet) thick—and created the large, approximately 75-kilometers- (47-miles-) wide, Huckleberry Ridge caldera. A second cycle concluded with the eruption of the much smaller Mesa Falls Tuff around 1.3 million years ago that resulted in formation of the Henrys Fork Caldera. Activity subsequently shifted to the present-day Yellowstone Plateau and culminated 631,000 years ago with the eruption of more than 1,000 cubic kilometers (240 cubic miles) of magma, forming the Lava Creek Tuff and the 45×85 kilometer (28×53 mile) Yellowstone Caldera.
The three extraordinarily large explosive volcanic eruptions in the past 2.1 million years each created a giant caldera and spread enormous volumes of hot, fragmented volcanic rocks via pyroclastic density currents over vast areas. The accumulated hot ash, pumice, and other rock fragments welded together from their heat and the weight of overlying material to form extensive sheets of hard lava-like rock, called tuff. In some places these welded ash-flow tuffs are more than 400 meters (1,300 feet) thick. The ash-flow sheets account for about half the material erupted from the Yellowstone region.
Before and after these caldera-forming events, volcanic eruptions in the Yellowstone region produced rhyolitic and basaltic rocks—including large rhyolite lava flows (pink and orange colors on simplified geologic map), some smaller rhyolite pyroclastic flows in and near where the calderas collapsed, and basalt lava flows (yellow color on simplified geologic map) around the margins of the calderas. Large volumes of rhyolitic lava flows (approximately 600 cubic kilometers, or 144 cubic miles) were erupted in the most recent caldera between 160,000 and 70,000 years ago. No magmatic eruptions have occurred since then, but large hydrothermal explosions have taken place since the end of the last ice age in the Yellowstone region.
Yellowstone Caldera’s volcanism is only the most recent in a 17-million-year history of volcanic activity that has occurred progressively eastward from near the common border of southeastern Oregon, northern Nevada, and southwestern Idaho to Yellowstone National Park as the North American Plate has drifted over a hot spot—a stationary area of melting within Earth’s interior. At least six other large volcanic fields along this path generated caldera-forming eruptions; the calderas are no longer visible because they are buried beneath younger basaltic lava flows and sediments that blanket the Snake River Plain.
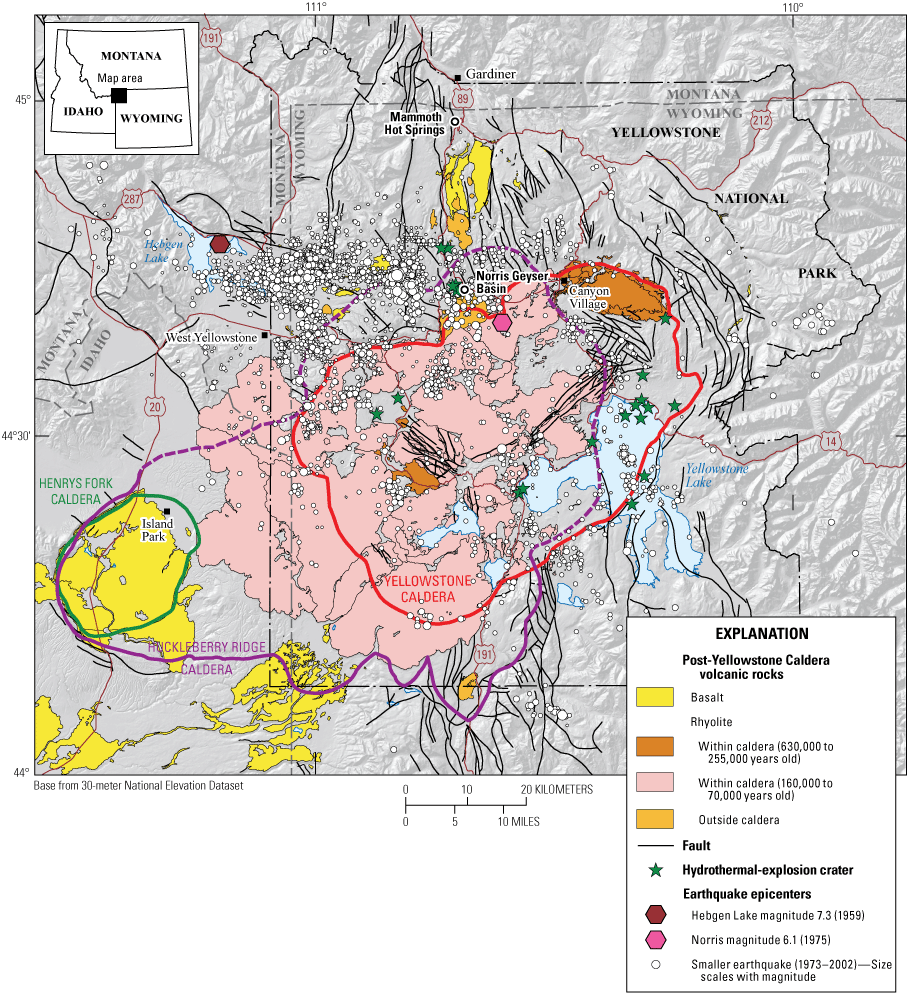
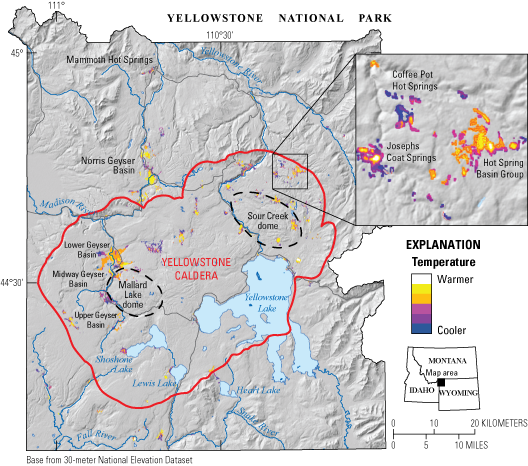
Simplified geologic map of the Yellowstone region, showing rocks that erupted after the most recent caldera-forming eruption 631,000 years ago (colored areas) and outlines of the three most recent calderas (red, green, and purple lines). Modified from U.S. Geological Survey Fact Sheet 2005–3024 (Lowenstern and others, 2005).
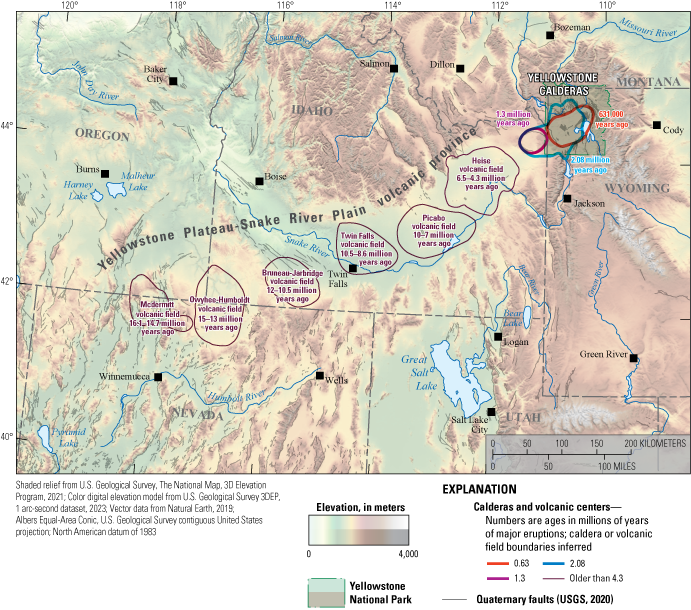
Map showing volcanic fields (outlined) where the Yellowstone hot spot produced one or more caldera eruptions—essentially “ancient Yellowstones”—during the time periods indicated. As the North American Plate drifted southwest over the hot spot, the volcanism progressed northeast, from the common border of southeastern Oregon, northern Nevada, and southwestern Idaho 16.5 million years ago and reaching Yellowstone National Park about 2 million years ago. Mountains (whites, browns, and tans) surround the low elevations (yellows and greens) of the seismically quiet Snake River Plain. The low elevations of the Snake River Plain mark the alignment of past calderas that have since been filled in by lava flows and sediments. Black lines show faults within the region. Modified from Morgan and others (2017) and Smith and Siegel (2000) with permission.
Summary of Geology Activities in 2024
In 2024, YVO geologists and collaborators made progress on several ongoing projects, including investigations of the compositions and ages of mafic and rhyolite lava flows in and around Yellowstone National Park, the distribution of the Lava Creek Tuff eruptive unit, and the slip history and earthquake hazards associated with the East Gallatin-Reese Creek Fault System in the northwest part of the park.
Understanding the Recent Volcanic History of the Yellowstone Region
Recent geochronologic and paleomagnetic work demonstrated that the 22 Central Plateau Member rhyolite eruptions, which are the youngest episode of rhyolite volcanism from the Yellowstone Plateau volcanic field, occurred in five brief episodes at 160,000, 150,000, 111,000, 104,000, and 71,000 years ago (fig. 14; Stelten and others, 2023). During these episodes, multiple rhyolites erupted from volcanic vents spaced out over several to tens of kilometers (a few to tens of miles) over no more than 400 years (although they could have occurred over much shorter durations). During 2024, USGS geologist Mark Stelten and collaborators from UC Davis (Dr. Kari Cooper, Elizabeth Grant, Anjelica Guerrier, and Julia Walker) continued work on understanding the origin of Central Plateau Member rhyolites and what the magmatic system looked like before their eruption. Preliminary uranium-thorium (238U-230Th) dating of zircon crystals and Pb isotope analysis of sanidine crystals hosted in the several Central Plateau Member rhyolites that erupted 160,000 years ago reveal compositional differences among rhyolites erupted during the same brief episode, indicating that prior to eruption, the magmatic system was composed of multiple discrete magma bodies instead of one integrated magma body.
Also in 2024, USGS scientists collaborated with Dr. Madison Myers (Montana State University) and Ph.D. student Stacy Henderson to reevaluate the distribution of the Lava Creek Tuff, which erupted approximately 631,000 years ago and resulted in the formation of Yellowstone Caldera. Through a combination of argon-argon (40Ar/39Ar) dating and geochemistry, this work has helped to redefine the distribution of the Lava Creek Tuff within and around Yellowstone Caldera, providing important updates to geologic mapping and new insights into the history of this large eruption. Work on this project will continue in 2025, with a focus on finishing 40Ar/39Ar dating of existing samples and expanding the geochemical dataset to understand the origin and evolution of the magma body that erupted to form the Lava Creek Tuff.
Over the past several years, efforts have also been made to better understand the eruptive history of mafic volcanism associated with the Yellowstone Plateau volcanic field. Argon-argon dating of basaltic rocks from the Henrys Fork Caldera west of Yellowstone National Park has been completed, and in 2024 progress was made in dating basalts from within Yellowstone National Park, predominantly north of Yellowstone Caldera. Additional 40Ar/39Ar dating of basaltic rocks from within Yellowstone National Park will continue in 2025, with the goal of creating a robust eruptive history for mafic volcanism in the region. This will help to better understand the recurrence rate of mafic volcanism and its role in driving silicic eruptions in the Yellowstone region.
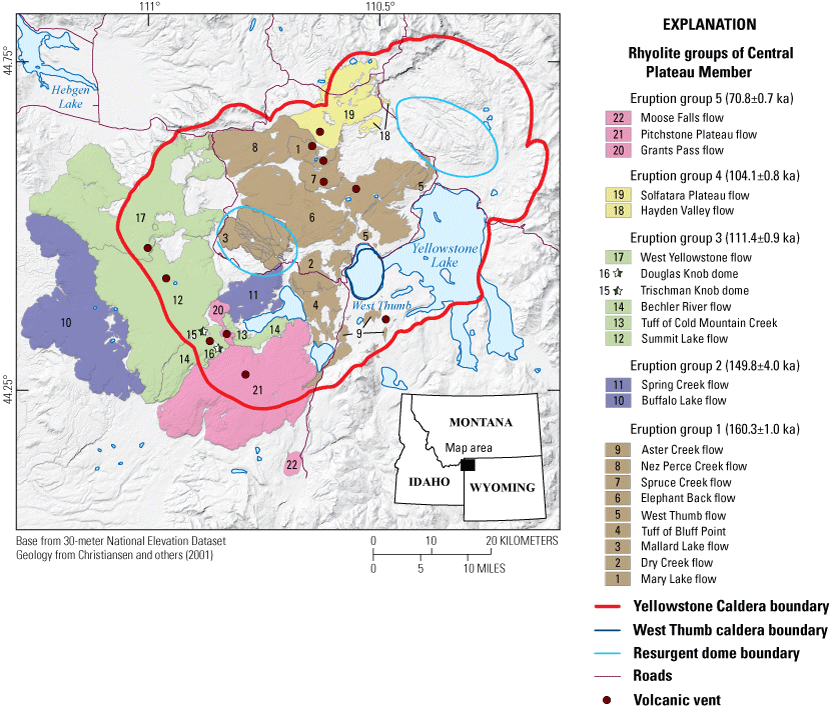
Shaded-relief map of Yellowstone Caldera showing the ages and locations of the Central Plateau Member of the Plateau Rhyolite, which erupted after the formation of Yellowstone Caldera. Flow boundaries and dome locations are from Christiansen (2001). The West Thumb caldera of Yellowstone Lake is indicated because it is thought to be the location of an explosive eruption and the source vent for the tuff of Bluff Point. The rhyolite of the Central Plateau Member is broken into five informal groups on the basis of new 40Ar/39Ar eruption ages. Each informal eruption group is shown in the same color. Numbers on the map and legend are included to indicate the location of different lava flows. Group mean ages and their 95 percent confidence intervals are included next to the list of units.
Post-glacial Earthquake Surface Rupture of the East Gallatin-Reese Creek Fault System
Geologists from the Wyoming State Geological Survey and Montana Bureau of Mines and Geology continued their investigation of the East Gallatin-Reese Creek fault system in 2024 (fig. 15). The study seeks to characterize the timing and rate of fault displacement, as well as the associated seismic hazard, of the normal fault system that has been active during the Quaternary (the last 2.6 million years of Earth’s history) and that bounds the eastern front of the Gallatin Range in northwest Yellowstone National Park (fig. 16). To address these questions, geologists are mapping fault scarps (locations where past earthquakes have ruptured the ground surface) along the length of the fault system and dating the glacial deposits that the fault scarps displace. The geologists are using a technique known as cosmogenic nuclide exposure dating, which determines the time that a rock has been exposed to cosmic rays at Earth’s surface, to date the fault-offset glacial deposits. This will help bracket the timing of past surface-rupturing earthquakes and shed light on the history of this fault system.
Geologists collected samples from two study sites along the East Gallatin-Reese Creek fault system as part of preliminary reconnaissance work in 2023 (YVO, 2024). Two of these samples from the Fawn Creek study site yielded preliminary exposure ages of around 14,100 years. These ages are consistent with ages from previous studies that have dated glacial deposits in the Yellowstone region using the same method, and they indicate that glacial till at the base of the Gallatin Range was deposited during the late Pinedale glaciation—the most recent ice age in the Rocky Mountains. Furthermore, the 14,100-year exposure ages of fault-displaced glacial deposits also demonstrate that the East Gallatin-Reese Creek fault system has experienced surface-rupturing earthquakes since the end of the last ice age.
In light of these favorable results, the team returned to Fawn Creek on a multiday backcountry trip in August 2024 to collect an additional ten samples for cosmogenic nuclide dating. The new samples are from various geomorphic surfaces that have distinct offset orientations relative to the fault scarp. Dating these samples will provide insights into how fault slip rates may vary along the length of the fault and through time.
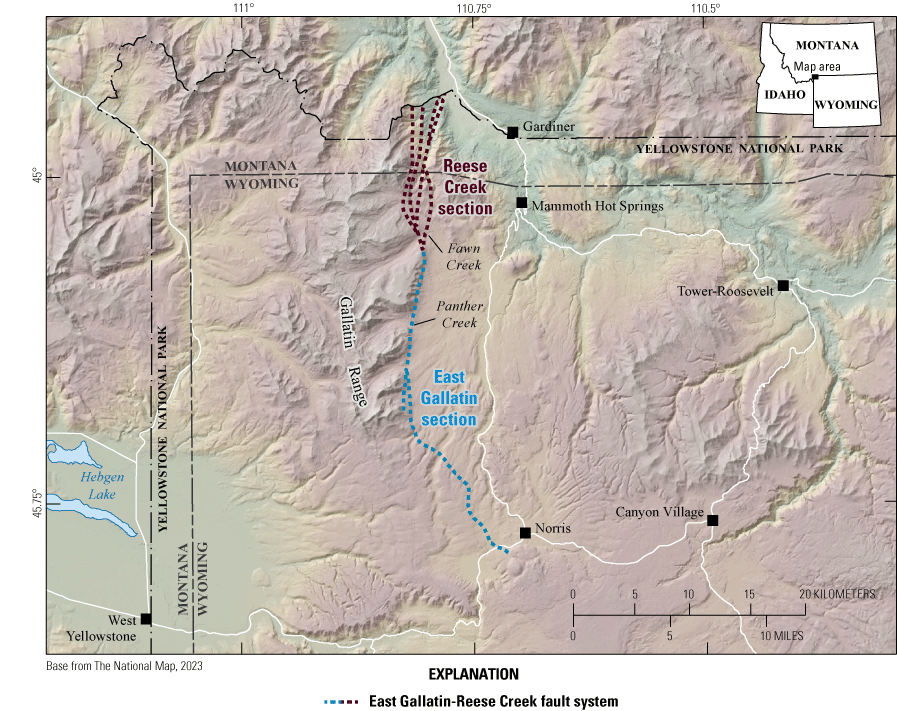
Shaded-relief location map for the East Gallatin-Reese Creek Fault System in northwest Yellowstone National Park. The trace of the East Gallatin-Reese Creek Fault System is shown as mapped in the U.S. Geological Survey Quaternary Fault and Fold Database (Haller and Pierce, 1996a, b), subdivided into the southern East Gallatin section (blue dashed lines) and the northern Reese Creek section (dark red dashed lines).
View of the eastern front of the Gallatin Range. The East Gallatin-Reese Creek fault system runs through the trees along the base of the mountain front. Fawn Creek—one of the locations for cosmogenic nuclide dating of glacial deposits—is the drainage exiting the Gallatin Range at the far right of the photograph. Photograph by James Mauch, Wyoming State Geological Survey, August 29, 2024.
Heat Flow Studies
The thousands of on-land thermal features of the Yellowstone region range in temperature from just a few degrees Celsius above the normal background temperature to well above boiling (as hot as 138 °C [280 °F]). Studies of thermal features are accomplished by ground-based monitoring (including both occasional observations and continuous temperature monitoring), thermal infrared remote sensing from satellites and aircraft, and proxy measurements of chloride in Yellowstone National Park’s rivers (refer to “Monitoring Thermal Changes at Yellowstone Caldera” sidebar).
Box 7. Monitoring Thermal Changes at Yellowstone Caldera
A lot of heat is released in the Yellowstone region from thermal features like hot springs, geysers, mud pots, and fumaroles. Tracking the temperatures and sizes of thermal areas is critical for monitoring Yellowstone Caldera’s hydrothermal activity and for understanding and preserving these spectacular features. The task is challenging, however, given that there are more than 10,000 individual thermal features spread out over large and mostly inaccessible areas within Yellowstone National Park.
Some thermal features are continuously monitored with temperature sensors, such as at Norris Geyser Basin. There, thermal probes are connected via radio links so that data within the thermal-monitoring network can be viewed anytime. These thermal probes have proven useful for detecting geyser eruptions when visual observations are impossible (for example, because of weather or time of day).
Temperature probes, however, can be used to measure the output of only a few specific features. To look at overall thermal output of the Yellowstone region, other techniques are employed—for example, tracking the chemistry of Yellowstone National Park’s major rivers. Because the hot water from thermal features ultimately ends up in rivers, changes in river chemistry are used to track overall hydrothermal activity. The most useful chemical indicator is the chloride composition of the river water because hydrothermal water has a high concentration of chloride. In fact, nearly all (95 percent) of the chloride in Yellowstone National Park rivers comes from thermal features. Thus, monitoring the chloride flux (or variability) in the major rivers in Yellowstone National Park provides a reliable way to monitor overall hydrothermal activity. Chloride monitoring is now done continuously by automated stations on all the park’s major rivers.
Another method for obtaining broad views of Yellowstone Caldera’s thermal output is to use satellites, which can measure surface temperature and detect changes over time. One of the advantages of satellite-based thermal infrared remote sensing is that nearly all the thermal areas in the park can be viewed at once. This broad view comes at a cost—thermal-infrared satellite images tend to have low spatial resolution, with pixels that are 90 to 100 meters (about 300 feet) on a side. Nevertheless, thermal-infrared images of Yellowstone National Park have enough detail to make maps of temperature anomalies, which are especially useful in areas that are not easily accessible.
One of the challenges of thermal-infrared remote sensing is that temperature contrasts can be low and thus challenging to discern. Hot springs and fumarole fields are relatively subtle thermal features compared to extremely hot features like active lavas or fires because the thermal features exhibit sub-boiling to boiling temperatures at the surface in areas that are generally small with respect to the pixel size of thermal-infrared satellite data. During the day, most surface heating comes from the sun, and rocky, sun-facing slopes can mask or exceed the thermal-infrared emittance from thermal areas. Using nighttime thermal-infrared data minimizes the effects of solar radiance and maximizes thermal contrast between thermal and background areas. At night, water bodies are generally warmer and more radiant than the surrounding land surface and can mask thermal areas adjacent to lakes. In Yellowstone National Park, lakes that do not receive thermal input from nearby hot springs or underwater vents are frozen from late fall through early spring. Therefore, nighttime thermal-infrared data from January through May are preferred. During these times, cloud-free thermal-infrared data can differentiate most thermal areas from ambient background areas because of greater thermal contrast, and these data can be used to evaluate surface thermal metrics, such as geothermal radiant heat flux and geothermal radiative power output. Another advantage of wintertime data is their utility for characterizing thermal input to lakes. These data have revealed the presence of warm vents and springs not previously cataloged in the thermal vent inventory database.
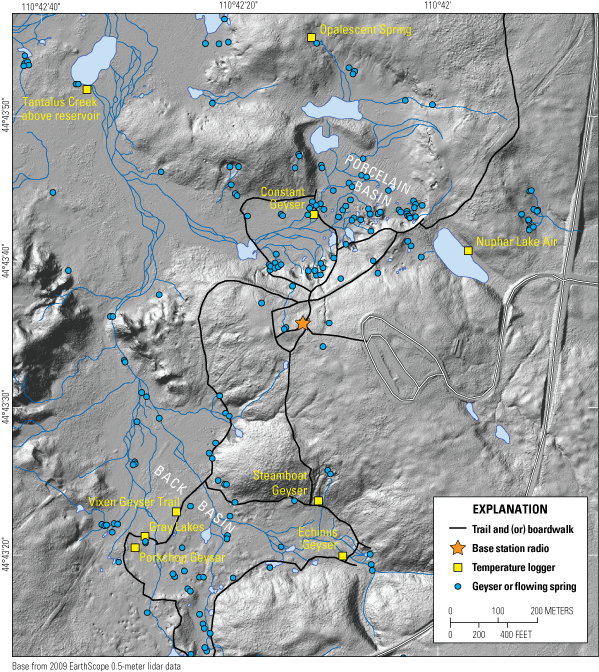
Map of temperature measurement sites in Norris Geyser Basin.
Map showing specific-conductance-monitoring sites for determining chloride flux in rivers that drain thermal areas in Yellowstone National Park. Green stations are telemetered, and data from purple stations are downloaded manually.
Satellite thermal-infrared temperature anomaly map of Yellowstone National Park’s thermal areas based on a Landsat 8 image from January 9, 2021. The warmest areas (white) are 20–30 °C (36–54 °F) above background; the cooler areas (blue) are 2–4 °C (4–7 °F) above background. By comparing maps like this for different times, scientists assess changes in thermal areas over time and estimate the total heat output from the Yellowstone region.
Summary of Heat Flow Studies in 2024
The total geothermal radiative heat output from Yellowstone National Park’s thermal areas in 2024, estimated from satellite thermal infrared observations, was similar to that measured in previous years. Heat output based on chloride flux in Yellowstone National Park’s rivers was also similar to past years, although measurements were not possible on the Yellowstone River because of damage to monitoring equipment, probably as a result of remobilized debris and sediment from the June 10–13, 2022, flooding. Together, the thermal infrared remote sensing and chloride-flux measurements indicate that the total thermal discharge remained relatively steady.
Thermal Infrared Remote Sensing
Most of Yellowstone’s thousands of thermal features are clustered together into about 120 distinct regions, called thermal areas. Thermal areas are characterized by having multiple thermal features, hydrothermally altered ground and (or) hydrothermal mineral deposits, emitting geothermal heat and (or) gases, and are generally barren of vegetation or have stressed or dying vegetation. There are also numerous water bodies—typically lakes, ponds, or wetland areas—that are thermally emissive because they receive heated water from a nearby thermal area, a nearshore thermal spring, or underwater vents.
Analysis and interpretation of thermal infrared remote sensing data for characterizing thermal areas and thermal water bodies in Yellowstone National Park has been ongoing for several years. Satellite thermal infrared data with moderate spatial resolution (90 to 100 meters [about 300 feet] per pixel) are useful for mapping, measuring, and monitoring the characteristics of most thermal areas and thermal water bodies on a regional to park-wide scale, although some thermal areas are too subtle (either too small or not hot enough) to be clearly detected with moderate-resolution orbital data. Higher-resolution thermal infrared data have been useful in the past for characterizing these areas; however, such data from airborne surveys are not regularly acquired over the Yellowstone region because of their high cost. Thermal areas and thermal water bodies also have characteristics that can be identified with high-resolution (0.5 to 2 meters [1.6 to 6.5 feet] per pixel) visible remote sensing data. Moderate-resolution thermal infrared and high-resolution visible data are thus used together with field observations to characterize Yellowstone National Park’s thermal areas and thermal water bodies.
The primary satellite-based thermal infrared data used for thermal area characterization in the Yellowstone region are from Landsat 8 and Landsat 9 (https://earthexplorer.usgs.gov/). Other moderate-resolution thermal infrared satellite data, such as from the Advanced Spaceborne Thermal Emission and Reflection Radiometer (ASTER) or Ecosystem Thermal Radiometer Experiment on Space Station (ECOSTRESS), are not normally acquired in the area with a spatial coverage or cadence that is ideal for regular monitoring. Landsat 8 nighttime thermal infrared data have been acquired over the Yellowstone region since its launch in 2013, nominally every 16 days. Landsat 9, which is nearly identical to Landsat 8, was launched in 2021 into an offsetting orbit; thus, together they have the potential to image the Yellowstone region at night every 8 days. For thermal infrared data, nighttime acquisitions in the winter are preferred for analysis because this minimizes the effects of solar radiance on surface thermal emission and maximizes thermal contrast between thermal targets and background areas. In 2024, a total of 38 nighttime scenes from Landsat 8 and 9 were acquired. Clear nighttime scenes were acquired in the winter on January 2, March 14, and March 30. The data from January 2, 2024, were processed and analyzed for this report (fig. 17).
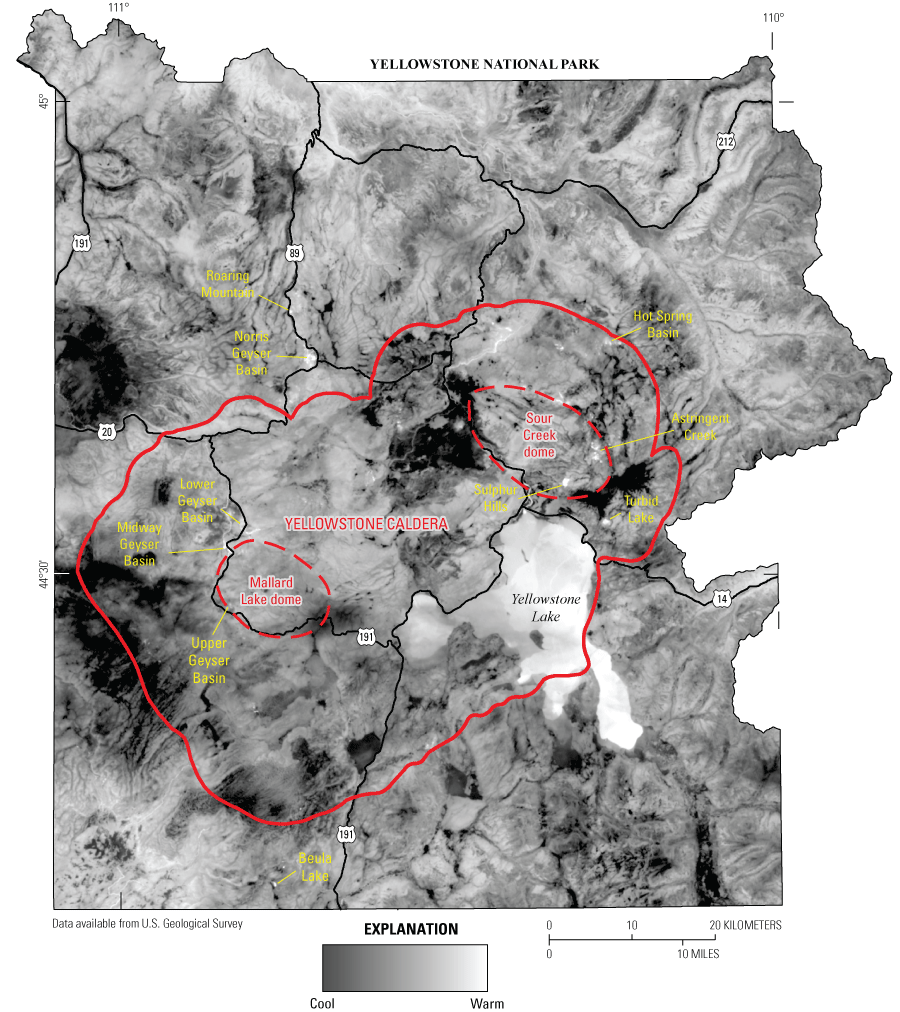
Landsat 8 nighttime thermal infrared image of Yellowstone National Park from January 2, 2024 (https://earthexplorer.usgs.gov/). Satellite-based thermal infrared data show areas on the surface that are warmer versus cooler, and they can be used to estimate surface temperature and the geothermal radiative heat output from the Yellowstone magmatic and hydrothermal system. The warmest pixels (lightest in shade) in this image are about 18.8 °C (65.8 °F), which is about 46.5 °C (83.6 °F) above the background temperature of the cold winter night on which this image was acquired. Geologic structures are indicated in red (solid line is caldera boundary, and dashed lines mark resurgent domes); thermal areas are labeled in yellow.
The results of thermal infrared data analyses using the Landsat 8 image acquired on January 2, 2024, were similar to those from previous years in that the same regions tended to be the warmest and most radiant. The thermal area with the highest pixel temperatures and highest geothermal radiant emittance was Sulphur Hills, with temperatures 46.5 °C (83.6 °F) above background and geothermal radiant emittance values of as much as 181 watts per square meter. Because of their large size, the thermal areas with the highest total geothermal radiative power output (in megawatts) were Lower Geyser Basin at 235 megawatts and Norris Geyser Basin at 188 megawatts. Other large thermal areas with notably high geothermal radiative power output include Astringent Creek and Roaring Mountain, with outputs greater than 100 megawatts. The total geothermal radiative power output summed for all of Yellowstone’s thermal areas was 2.1 gigawatts. This value, calculated only for the parts of thermal areas that were warmer than two standard deviations above the mean temperature of the background, is within the range of values reported from the previous years (1.8 to 2.5 gigawatts).
Chloride Flux Monitoring
Measuring the thermal output of Yellowstone Caldera’s large magmatic system is not straightforward, as thousands of thermal features are spread across more than 9,000 square kilometers (3,500 square miles). Because thermal-water discharge eventually enters nearby rivers, one way to capture and integrate the contributions from this broad area is to monitor river chemistry. Nearly all the chloride in rivers that drain Yellowstone National Park comes from emerging hot-spring water heated underground by underlying magma. By monitoring the chloride flux, the hydrothermal discharge and heat flux from the Yellowstone region can be estimated, and variations (short and long term) can be used to identify changes in the deep hydrothermal system, earthquake activity, geyser eruptions, and other natural events (like floods and the effects of wildfire).
The USGS and Yellowstone National Park have collaborated on chloride-flux monitoring in Yellowstone National Park since the 1970s and have been continually improving the monitoring network and systems used to quantify solute concentrations and fluxes. Beginning in 2010, the USGS installed stations along major rivers to automatically measure specific conductance (an indication of how well water conducts an electrical current), which is a proxy for the concentration of chloride and other solutes. The stations can make measurements of specific conductance every 15 minutes.
Monitoring the chloride (and other geothermal solutes) flux in the major rivers draining Yellowstone National Park continued in 2024. Specific conductance measurements were made at monitoring sites along Tantalus Creek and the Madison, Firehole, Gibbon, Snake, Gardner, Yellowstone, and Fall Rivers (refer to “Monitoring Thermal Changes at Yellowstone Caldera” sidebar). The current network provides information at several scales (park-wide, watersheds, and individual geyser basins). The Madison, Yellowstone, Snake, and Fall River monitoring sites capture the hydrothermal discharge within their watersheds, and the sum of these four rivers captures the entire hydrothermal discharge from Yellowstone National Park. Additional monitoring sites along their tributaries provide higher resolution and can be used to identify changes at geyser-basin or hot-spring scales.
The use of specific conductance as a proxy for chloride requires knowledge of the relation among specific conductance, chloride, and other geothermal solutes (sulfate, fluoride, bicarbonate, silica, potassium, lithium, boron, and arsenic), and the relation needs to be confirmed annually. Water samples were collected during two 2024 field trips to assess the solute-specific conductance correlations.
The 2024 chloride flux measured at the river monitoring sites was similar to historical (beginning 1983) fluxes (fig. 18). Quantifying the chloride flux was again challenging in 2024 because of the historic flooding that occurred in the northern areas of Yellowstone National Park during June 10–13, 2022. Riverbed material that was mobilized during the storm buried the specific conductance probes in the Gardner River and also in the Yellowstone River at Corwin Springs. The Gardner River monitoring site was relocated downstream and in 2024 the specific conductance data appear to be complete and reliable. During the 2024 spring snowmelt, however, the monitoring equipment in the Yellowstone River at Corwin Springs was damaged as the result of remobilized rocks and sediment. Consequently, a large part of the data for water year 2024 (October 1, 2023, to September 30, 2024) was not recovered, and the annual chloride flux was not determined for the Yellowstone River at the Corwin Springs monitoring site.
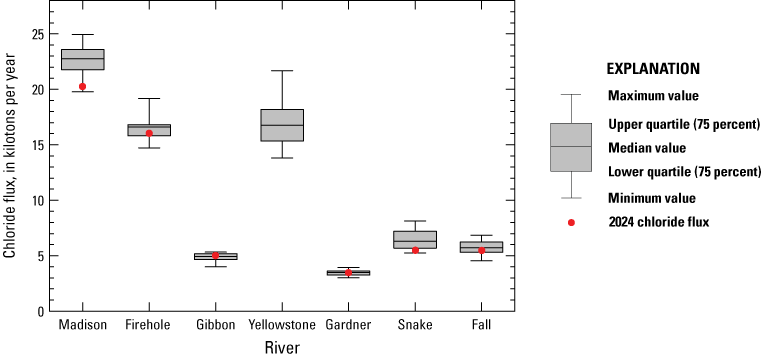
Boxplots showing the distribution of chloride flux measurements collected from 1983 to 2024 on major rivers that drain the Yellowstone National Park region. Fluxes were measured at gaging locations in various areas in and around the park (refer to “Monitoring Thermal Changes at Yellowstone Caldera” sidebar). The 2024 chloride flux for each monitoring site is shown in red (no measurement was possible for the Yellowstone River).
Hydrothermal Explosions
Hydrothermal explosions are the most common geologic hazard in Yellowstone National Park (refer to “Volcanic Hazards int the Yellowstone Region” sidebar). Small explosions, leaving craters perhaps one or two meters (a few feet) across, happen almost annually in the park, often in backcountry areas where they may go unnoticed, but much larger explosions can also occur. At least 18 hydrothermal explosion craters with diameters greater than 300 meters (about 1,000 feet) have formed since the end of the last ice age approximately 14,000 years ago. Several such craters are on the north side of Yellowstone Lake, including Mary Bay, which has a diameter of 2.5 kilometers (1.5 miles) and is the largest known hydrothermal explosion crater in the world (Christiansen and others, 2007; Morgan and others, 2023). The occurrence rate of hydrothermal explosions scales with their size (small ones happen more frequently than large ones), but even small events have the potential to cause injury if they happen in a well-visited geyser basin when people are present (Christiansen and others, 2007).
In 2024, at least two significant hydrothermal explosions occurred within Yellowstone National Park. The first took place in Norris Geyser Basin on April 15 during a seasonal closure of the park. Although the explosion was unobserved by people, it was detected by nearby seismic and acoustic sensors installed as part of YVO’s effort to better monitor hydrothermal activity (YVO, 2022b). The second occurred in Biscuit Basin, Upper Geyser Basin, on July 23, and was well documented by numerous visitors. Fortunately, there were no injuries, but the event emphasized hydrothermal hazards and the importance of hydrothermal monitoring.
Norris Geyser Basin Explosion of April 15, 2024
In May 2024, geologists working in Norris Geyser Basin discovered a small crater about 3 meters (10 feet) across that was surrounded by fragments of silica sinter and associated with nearby disrupted, cracked ground and small collapse features (fig. 19). The crater was located on Porcelain Terrace, which is near the western edge of Nuphar Lake and above Porcelain Basin on the east side of Norris Geyser Basin, and had formed since the last time geologists visited the site in September 2023. This area, about 50 meters (160 feet) from the nearest boardwalk, had been exceptionally active during the prior two years, with runoff from thermal features on the terrace flowing into Nuphar Lake and causing the lake to change color to a light blue and the water level to rise. In May 2024, however, the thermal features in the area were less vigorous, and no water was emitted by the features on Porcelain Terrace nor flowing into the lake, although a small blue-water pool was present.
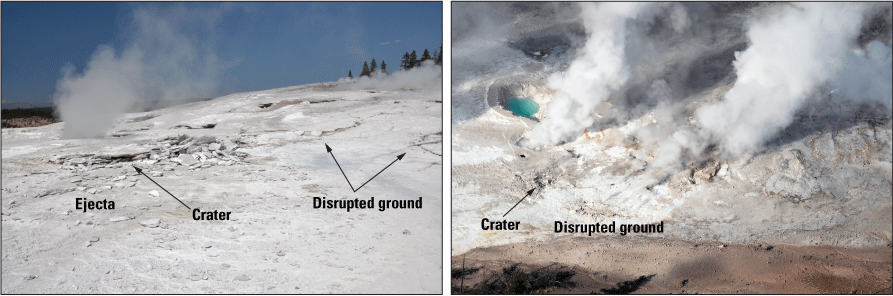
Photographs of hydrothermal explosion crater that formed in Norris Geyser Basin on April 15, 2024. The site is in an area covered by silica sinter and includes a crater surrounded by angular sinter ejecta as well as disrupted ground consisting of numerous cracks and upraised slabs of sinter. Left, View from the ground of the crater and disrupted surface looking northwest. Photograph by Mike Poland, U.S. Geological Survey, September 1, 2024. Right, Oblique aerial view of crater, disrupted ground, and nearby thermal features. Photograph by Janet Jones, SnowMoon Photography, December 5, 2024, used with permission.
An examination of high-resolution satellite data indicated that the thermal features on Porcelain Terrace went from being vigorously active to mostly dormant between April 2 and 21, 2024 (fig. 20). The new crater and disrupted ground were too small to be visible in these images, but the timing of changes in the nearby thermal features provided a starting point for examining monitoring data for signs of an explosion.
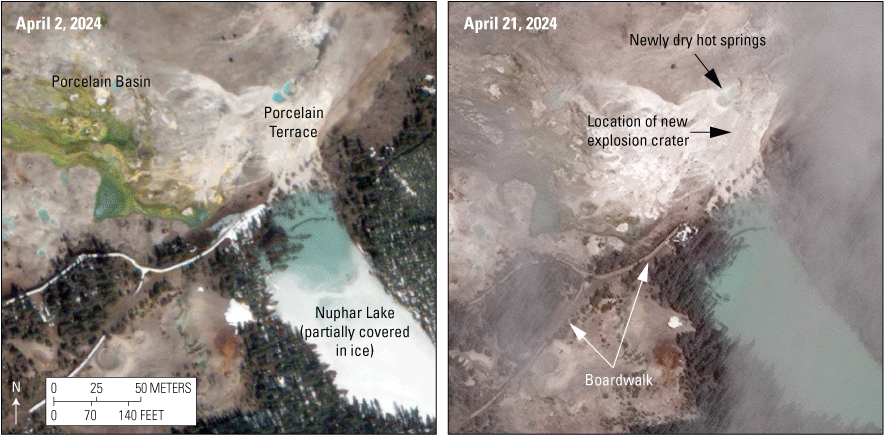
High-resolution satellite images of Norris Geyser Basin showing the area of Porcelain Basin and Nuphar Lake in April 2024. In the left image, acquired on April 2, 2024, springs on Porcelain Terrace are full of water and hydrothermal fluids are flowing into Nuphar Lake, keeping the north part of the lake free of ice. Boardwalks in the area appear as white lineations because they are covered in snow. In the right image, acquired on April 21, 2024, the springs on Porcelain Terrace are dry and there is no water entering Nuphar Lake (which was free of ice because of the change in seasons). This image, which includes some wispy cloud cover that causes a slightly fuzzy appearance, was acquired after a small explosion on April 15, 2024, that probably coincided with the change in hydrothermal activity on Porcelain Terrace. Imagery processed by R. Greg Vaughan (U.S. Geological Survey). Data collected by WorldView-3 satellite and provided by Maxar Technologies (formerly DigitalGlobe, Inc.) under the NEXTVIEW End User License Agreement, which supports Earth science research and applications.
A hydrothermal monitoring site, designated YNB, installed at Norris Geyser Basin in August–September 2023 (YVO, 2024) includes GPS and seismic sensors and an infrasound array, which can detect the strength and directionality of low-frequency acoustic energy. On April 15, at 2:56 p.m. MDT, station YNB recorded a strong acoustic signal from the direction of the new crater (fig. 21). Two nearby seismometers, one at the Norris Geyser Basin museum (YNM) and the other collocated with the new infrasound array, also recorded a signal. On the basis of the difference in the arrival time of the signal at the two seismic stations (fig. 21), the signal was moving at the speed of sound, not at the speed of a seismic wave—evidence of an explosion, as opposed to an earthquake. Anecdotally, a Yellowstone National Park employee about 0.6 kilometers (0.4 miles) from the explosion site heard a booming sound at the time the infrasound signal was recorded but was not in a location that allowed for visual observations.
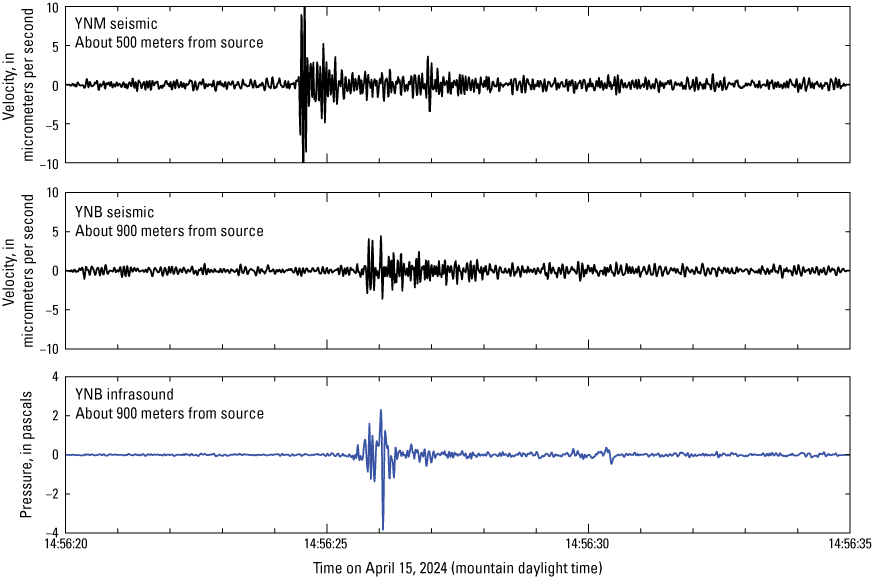
Seismic and infrasound data for the hydrothermal explosion on April 15, 2024, at Porcelain Terrace, Norris Geyser Basin. Top plot is seismic data from the YNM station, located at the Norris Geyser Basin Museum. Middle plot is seismic data from station YNB, in the Ragged Hills at the center of Norris Geyser Basin. Bottom plot is infrasound data from station YNB. The pressure change at the YNB infrasound station indicates an explosion source. The seismic signal appears first at station YNM, which is closer to the explosion site. There was a delay of about 1.3 seconds between the signal being received at YNB versus YNM. Given the distance between those stations, this delay corresponds to the speed of sound, indicating that the seismic signal was caused by the air wave from the explosion.
There were no obvious immediate precursors to the explosion in monitoring data. It might be that no such changes occurred, or perhaps they were too small to be detected by monitoring stations, the closest of which was about 500 meters (1,640 feet) away (fig. 21). The data that were recorded, however, unequivocally identified the explosion, which is the first time such an event was detected by geophysical data in Yellowstone National Park. Using this example, it may be possible to design algorithms that can detect similar events at Norris Geyser Basin using the new monitoring station, and elsewhere in Yellowstone National Park as hydrothermal monitoring efforts expand in the coming years.
Biscuit Basin Explosion of July 23, 2024
At 9:53 a.m. MDT on July 23, 2024, an explosion occurred from Black Diamond Pool in Biscuit Basin, Upper Geyser Basin (fig. 22), about 3.4 kilometers (2.1 miles) northwest of Old Faithful Geyser. No precursors to the event were detected by monitoring instruments, and the event was only weakly detected at seismic station YFT, near Old Faithful. Dramatic videos posted to social media and eyewitness accounts indicated that the event started with multiple pulses of water, rock, and mud rising several meters (tens of feet) into the air (fig. 23A, B) before an explosion sent material an estimated 120–180 meters (400–600 feet) high (fig. 23C, D) as people ran for safety. Fortunately, no injuries were reported. The explosion lasted about one minute and heavily damaged the nearby boardwalk (fig. 24), and the basin remained closed for the rest of the year to provide an opportunity for geologists to assess the activity and Yellowstone National Park officials to develop a plan for the future of visitation in the basin.
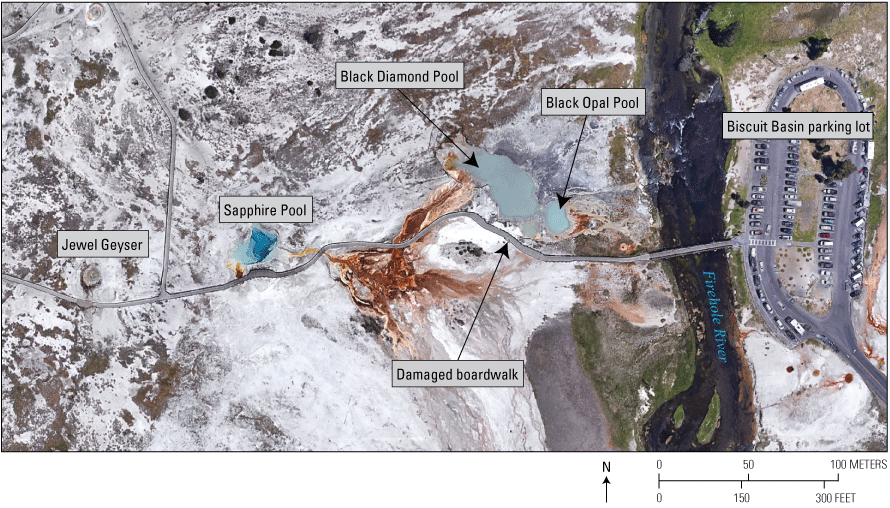
Map of major thermal features in Biscuit Basin, Yellowstone National Park. The explosion occurred from Black Diamond Pool. Base map from Google Earth.
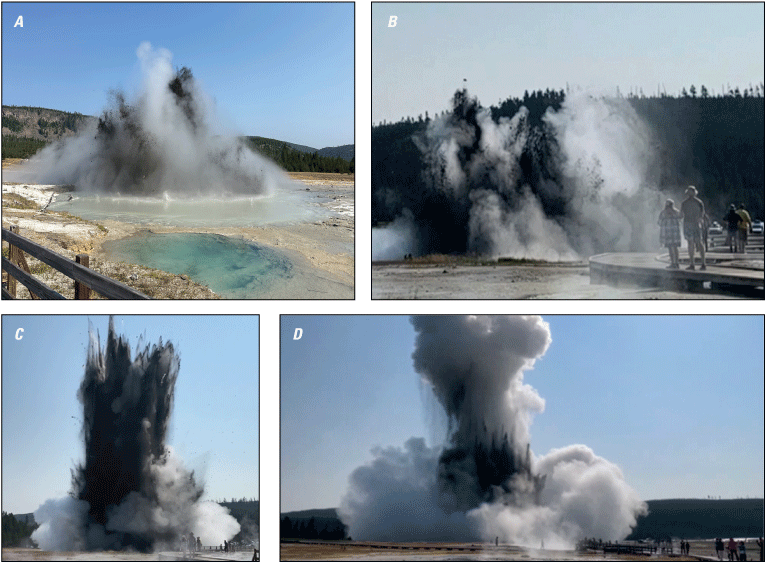
Images of the July 23, 2024, hydrothermal explosion at Biscuit Basin from park visitors. A, Photograph by visitor Sabrina Harris of a small explosion that preceded the main explosive event by several seconds, used with permission. View is to the northwest from near Black Opal Pool (visible in foreground). B, Screen capture from a video by visitor Juliet Su showing a small explosion a few seconds before the main explosive event, used with permission. View is to the east from near Sapphire Pool. C, Screen capture from a video by park visitor Juliet Su of the main explosive event about 4 seconds after the onset, used with permission. Image is from 7 seconds after the image in part B. D, Screen capture from a video by visitor Bill Gruen approximately 16 seconds after the start of the main explosive event, used with permission. View is to the east from near Jewel Geyser.
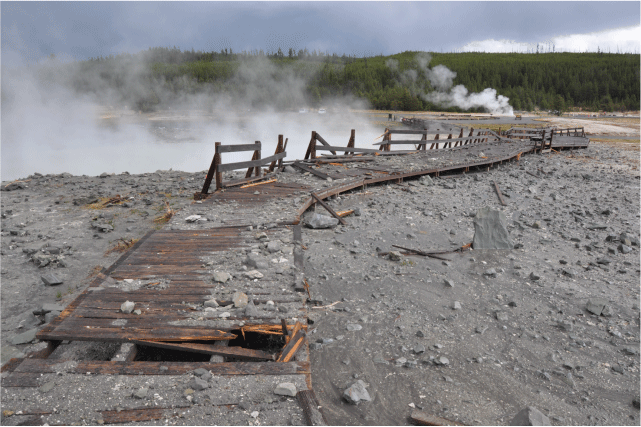
View looking east, toward the Firehole River and Biscuit Basin parking lot, of boardwalk that was damaged during the July 23, 2024, explosion from Black Diamond Pool, which is the steaming area located to the immediate left of the boardwalk. Photograph by Mike Poland, U.S. Geological Survey, September 3, 2024.
Mechanism of the Explosion
Immediately after the explosion, geologists began mapping the deposit left by the event. They mapped about 1,500 rocks that were thought to be a result of the explosion and that had a long dimension of at least 40 centimeters (16 inches). The largest such block was about 3 meters (10 feet) across. The explosion was mostly directed to the northeast toward the Firehole River (away from the boardwalk; fig. 25), and the largest boulders were found in that area. This fortuitous directionality probably contributed to the fact that no one standing on the boardwalk at the time of the event was injured.
The rocks thrown out by the explosion were composed of glacial materials, sandstones and siltstones, and gravels that immediately underlie the silica sinter that forms a veneer on the surface (fig. 26). Scientific drilling in Biscuit Basin in the late 1960s noted that rhyolite bedrock is present at a depth of about 50 meters (approximately 175 feet) beneath the surface. Rhyolite bedrock was not observed in the deposit, indicating that the source of the explosion was shallow enough that it did not disturb that bedrock. This is not surprising, because hydrothermal conduits mostly exist just beneath the surface in Yellowstone National Park thermal areas. No other nearby features in Biscuit Basin, like Sapphire Pool or Jewel Geyser, changed their appearance or behavior as a result of the explosion, further indicating that the event was confined to the shallow hydrothermal system associated with Black Diamond Pool.
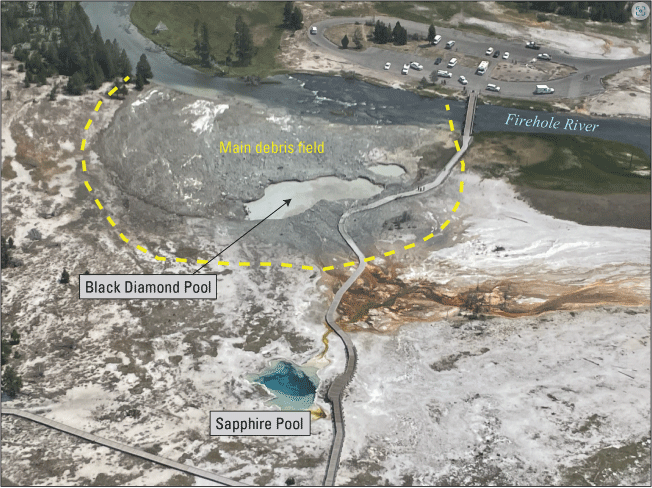
Oblique aerial view of Biscuit Basin, Yellowstone National Park, showing debris deposited by the July 23, 2024, hydrothermal explosion from Black Diamond Pool. Major features are labeled. The main debris field (within dashed yellow line) has a gray appearance. Photograph by Joe Bueter, National Park Service, on July 23, 2024.
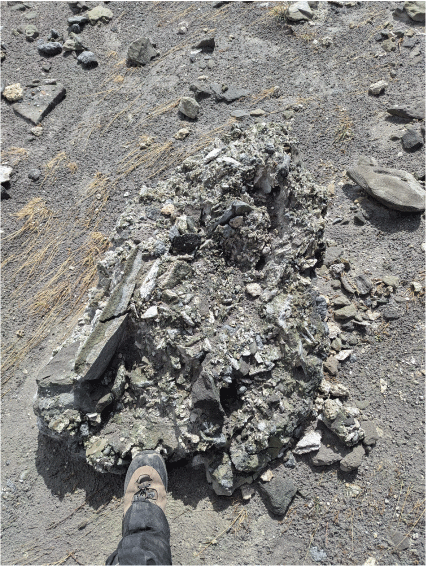
Boulder that was emplaced during the July 23, 2024, explosion of Black Diamond Pool in Biscuit Basin. The boulder is composed of gravel, sandstone, siltstone, and debris typical of the glacial deposits present in the shallow subsurface, and it also contains some hydrothermal silica that precipitated from thermal water within the plumbing system of the hot spring. Photograph by Mike Poland, U.S. Geological Survey, September 3, 2024.
In a few cases, ejecta indicate evidence of being part of the hydrothermal conduit system—they are heavily silicified with very low permeability. Some of the glacial gravels, sandstones, and siltstones, in contrast, still had their high porosity and permeability that document evidence of being saturated with water at the time of the explosion. This evidence indicates that the explosion probably occurred as deposition of silica in the hydrothermal conduit system created a seal, allowing pressure to build in the subsurface because of accumulation of boiling liquid water and steam. Once the pressure was high enough, the impermeable cap fractured, subsurface pressure dropped suddenly, and liquid water flashed to steam.
The July 23 event was not the first explosion in Biscuit Basin. Although the origin date of Black Diamond Pool is not known, it seems to have formed sometime between 1902 and 1912, probably in an explosion. Subsequent explosions in 1918, 1925, 1934, and 1953 expanded and enlarged Black Diamond Pool and nearby features, although none of the events were witnessed; only the aftermath of the explosions (changes in pool shapes, new boulders, and so on) were noted. An additional phase of eruptive activity occurred during 2006–2012, with individual small events also occurring in 2013, 2015, and 2016. These events were witnessed by many visitors and Yellowstone National Park employees, with water, mud, and small rocks ejected to a height of 2–15 meters (6–50 feet) and lasting 10–20 seconds. With the possible exception of the unwitnessed hydrothermal explosions that created it, Black Diamond Pool’s most recent activity on July 23, 2024, was by far its largest.
Post-Explosion Monitoring
Within days of the explosion, YVO scientists and collaborators, including investigators from the University of Utah, Colorado State University, University of California at Berkeley, and Yellowstone National Park, deployed monitoring equipment in and around Biscuit Basin, including almost three dozen seismometers, infrasound sensors, static cameras, and water and soil temperature probes. Data from these instruments, which were not telemetered and therefore not transmitting information in real time, were downloaded every few weeks. Results indicated that Black Diamond Pool remained active, with several discrete events that were especially well recorded by seismic and infrasound sensors. Cameras did not capture any of these events as they happened but did record their aftermath—displaced rocks and new sediment along the margin of the pool. Scientists working in the basin on the morning of November 5 witnessed a small eruption of Black Diamond Pool that sent muddy water and small rocks about 6 meters (20 feet) into the air. YVO plans to deploy at least one new permanent telemetered monitoring site with infrasound, seismic, and deformation sensors to the Biscuit Basin area in 2025 to better track activity in the region in real time.
Scientists from the University of Wyoming used electromagnetic, resistivity, and surface nuclear magnetic resonance surveys around Black Diamond Pool to investigate subsurface structure and hydrothermal fluid pathways, including steam and gas zones within the subsurface. They also measured soil gas emissions, including radon isotope ratio (220Rn/222Rn) and CO2, on a regularly spaced two-dimensional grid around Black Diamond Pool to quantify the timescales and amounts of subsurface gas traveling through the system. The results indicated a distinct zone of high CO2 flux to the north of Black Diamond Pool and medium fluxes of CO2 to the east of Black Opal Pool. Electromagnetic mapping indicated elevated conductivity to the west, northwest, and to a lesser extent northeast of Black Diamond Pool. Resistivity images focused around the area of elevated electrical conductivity revealed high resistivity within 5 meters (16 feet) of the surface underlain by a much lower resistivity layer. The upper layer contains vertical conduits that probably indicate fluid pathways. The nuclear magnetic resonance sounding detected the highest liquid water content at depths of 2–4 meters (7–13 feet).
Post-explosion investigations also included gas and water sampling in and around Biscuit Basin. Water samples were collected from Black Diamond Pool, five nearby pools, and drill hole Y-7 in Biscuit Basin to monitor the changes in water chemistry over time. In addition, samples of dissolved gas were collected from Black Diamond Pool and from Y-7 (fig. 27). The samples are being analyzed for a large suite of chemical constituents to understand water-rock interactions and water flow paths in the basin.
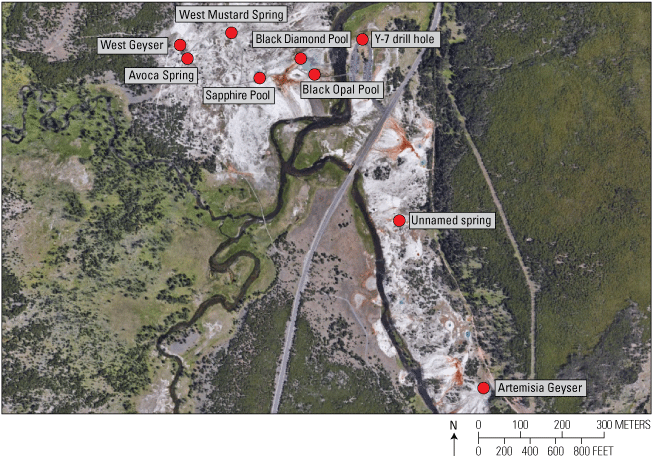
Map showing locations from which water and dissolved gas were collected within Biscuit Basin (top center of map) and adjacent areas, Upper Geyser Basin, after the July 23, 2024, hydrothermal explosion from Black Diamond Pool. Base map from Google Earth.
Geysers, Hot Springs, and Thermal Areas
Yellowstone National Park hosts thousands of thermal features, including geysers, hot springs, fumaroles, and mud pots. These features are incredibly dynamic, displaying a variety of behaviors over time. Some geysers, exemplified by Old Faithful, follow patterns that allow their activity to be forecast; however, the eruption times for most geysers in Yellowstone National Park are unpredictable. Thermal features mostly occur in clusters, forming about 120 distinct regions called thermal areas that are found throughout Yellowstone National Park (refer to “Monitoring Thermal Changes at Yellowstone Caldera” sidebar).
Summary of Geyser Activity and Research in 2024
As has been the case since 2018, the most noteworthy geyser activity in Yellowstone National Park during 2024 continued to be the eruptions of Steamboat Geyser, the tallest active geyser in the world. Fewer eruptions occurred in 2024 compared with the previous six years, indicating that the geyser’s current period of activity might be waning. In addition, Economic Geyser, in Upper Geyser Basin, erupted for the first time since 1999; the temperature increased at Abyss Pool, in West Thumb Geyser Basin, over the course of the summer; and a new steam vent formed at the base of a hill north of Nymph Lake, between Roaring Mountain and Norris Geyser Basin. Research efforts during the year focused on using high-resolution commercial satellite data to identify and define the boundaries of thermal areas throughout Yellowstone National Park.
Steamboat Geyser
Steamboat Geyser is a prominent feature of Norris Geyser Basin. The geyser typically experiences frequent minor eruptions that include water splashing as high as a few meters (yards) above the vent and infrequent major eruptions with water columns more than 100 meters (about 328 feet) in height that are separated in some cases by several years to decades. The geyser has a history, however, of entering into phases with more frequent major eruptions, as in the 1960s and 1980s when dozens of eruptions occurred per year, with some eruptions separated by only days to weeks.
In 2018, Steamboat Geyser (fig. 28) entered a new phase of increased activity, with 32 major water eruptions—a new record for a single calendar year (refer to YVO 2018 annual report [YVO, 2021a]). That trend continued in 2019 with 48 major eruptions, shattering the record set during the previous year—a record that was equaled with 48 major eruptions in 2020 (YVO, 2021b, c). In 2021, however, there were 20 major water eruptions (YVO, 2022a), followed by 11 eruptions in 2022 (YVO, 2023) and 9 eruptions in 2023 (YVO, 2024). In 2024 there were just 6 eruptions. It is unclear if fewer eruptions during 2021–2024 is an indication that the current episode of frequent eruptive activity is coming to an end.
Each eruption of Steamboat Geyser followed the same general pattern: gradually increasing minor activity over hours to days, culminating in a major eruption that lasts minutes to tens of minutes. A steam phase, lasting for about a day, follows the liquid water eruption, and the minor activity ceases for several days to weeks until the buildup to the next eruption begins and the cycle repeats. Also, as is common with Steamboat Geyser eruptions, the pool at Cistern Spring, about 100 meters (300 feet) downslope, drains within a day after each eruption and then gradually refills over the following days.
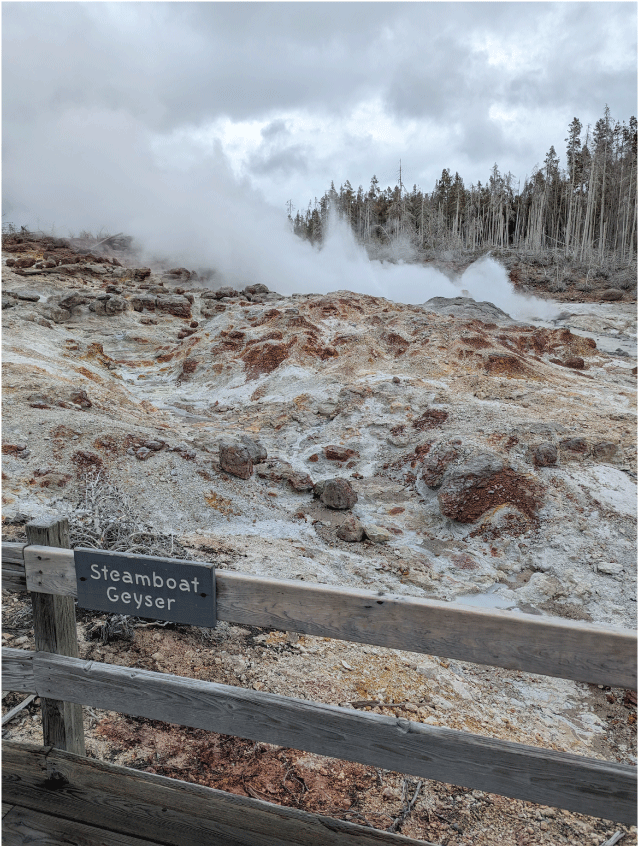
Photograph showing minor eruptive activity at Steamboat Geyser on May 22, 2024. In 2024, 6 major water eruptions occurred—fewer than the annual numbers of the preceding 6 years and with more variable intervals between eruptions. Photograph by Mike Poland, U.S. Geological Survey.
As has been the case since 2021, the intervals between geyser eruptions in 2024 were longer and more variable than during 2018–2020. The shortest interval between eruptions was a little more than 37 days, which occurred during February–April, and the longest interval was more than 83 days during July–October. In previous years, the shortest intervals between eruptions were in early summer months, presumably owing to abundant groundwater from spring snowmelt (YVO, 2021c). This pattern was broken in 2021 (YVO, 2022a), and since that time, the longest intervals have occurred during late summer. How the current episode of frequent eruptions may end is unknown, but the trend of the past three years implies that the number of eruptions will continue to diminish in 2025.
YVO uses four indicators to detect eruptions of Steamboat Geyser: (1) increased seismic noise recorded at a seismometer in the Norris Geyser Basin Museum, about 300 meters (1,000 feet) from the geyser, (2) a spike in temperature recorded on the sensor in the geyser’s outflow channel, (3) a spike in discharge recorded at the Tantalus Creek streamgage, through which all water from Norris Geyser Basin hydrothermal features flows, and (4) infrasound detections at the new monitoring site in the Ragged Hills area that are coming from the direction of the geyser (YVO, 2024). All these data are freely available on the YVO website, accessible at https://www.usgs.gov/volcanoes/yellowstone.
Economic Geyser and Abyss Pool
Hydrothermal areas in Yellowstone National Park are dynamic natural systems, where the one constant is change. Every year formerly dormant geysers spring to life and active geysers go quiet, and temperature changes in hot spring pools are common. Two such changes occurred at well-visited features in 2024 and are worthy of note.
In January, Economic Geyser (fig. 29A), near Grand Geyser in Upper Geyser Basin, erupted for the first time since 1999 (there may have been an eruption in late 2023, but that activity was unobserved and could only be inferred from broken sinter and the disappearance of the bacterial mat). Eruptions reached about 3 meters (10 feet) and at times occurred every few minutes during several phases in the first part of 2024. Economic Geyser was frequently active in the early history of Yellowstone National Park when it erupted every few minutes, but it went mostly dormant in the 1920s.
At 16 meters (53 feet), Abyss Pool in West Thumb Geyser Basin is one of the deeper hot springs in Yellowstone National Park. Although a calm pool now, it had frequent geyser eruptions, some as much as 30 meters (100 feet) high, in the early 1900s. The pool did not erupt again until 1987 and then experienced a series of eruptions during 1991–1992, again to a height of as much as 30 meters (100 feet). Since that time, Abyss Pool has been quiet. For the past several years and into early 2024 the pool had a dark color from microbes mixing with the blue water and with water levels a few tens of centimeters (1–2 feet) beneath its rim. In June, the water level began to rise and overflow the rim and the color changed to a more vivid blue as the temperature increased (fig. 29B)—in excess of about 77 °C (171 °F)—which killed the bacterial mats. These high temperatures appear to have persisted for the remainder of the year, but no eruptive activity was noted.3
Thanks to Janet Jones, of SnowMoon Photography, for contributing observations and insights into changes at Abyss Pool in 2024.
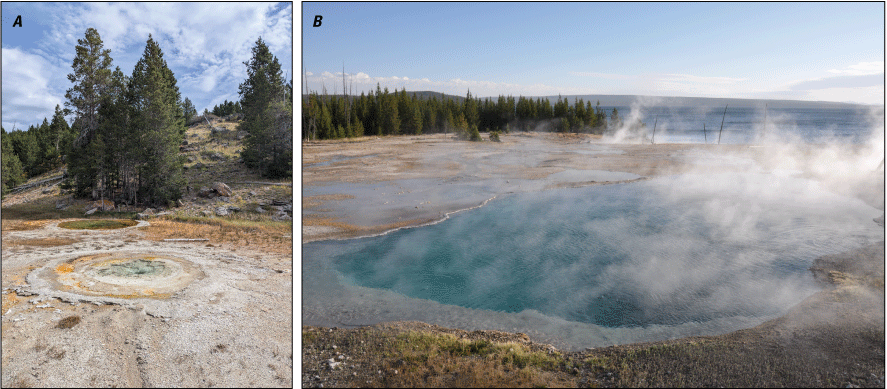
A, Economic Geyser, in Upper Geyser Basin near Grand Geyser, shown in a non-erupting state. Photograph by Mike Poland, U.S. Geological Survey, September 2, 2024. B, Abyss Pool, in West Thumb Geyser Basin, with Yellowstone Lake in the background. Photograph by Mike Poland, U.S. Geological Survey, August 28, 2024.
New Steam Vent Near Nymph Lake
In early August 2024, a new steam vent (fig. 30) was noted at the base of a northeast-facing hill on the west side of the highway that connects Mammoth Hot Springs and Norris Geyser Basin. The new feature is about 300 meters (about 1000 feet) north of Nymph Lake and about 3 kilometers (1.8 miles) south of Roaring Mountain. A low roaring sound was audible from the road, and the steam plume was vigorous. This activity lasted for a few months, but by November the plume was no longer visible. Inspection by geologists at that time revealed the feature was still active and hot but that a pool had formed in the steam vent, perhaps because of snowmelt. The new feature is along the same trend as features that formed in 2003 near Nymph Lake and may be an extension of that system.
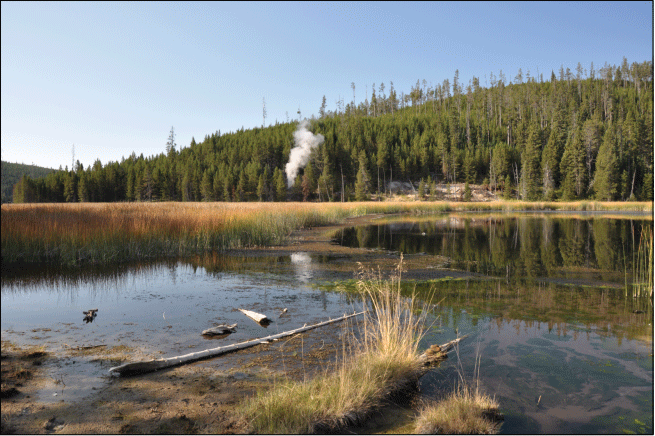
New steam vent at the base of a hill north of Nymph Lake, west of the highway and between Norris Geyser Basin and Roaring Mountain. Photograph by Mike Poland, U.S. Geological Survey, September 1, 2024.
Mapping of Snow-Free Zones with High-Resolution Commercial Satellite Imagery
Satellite remote sensing data from orbiting spacecraft have long been used to study and monitor Yellowstone National Park’s dynamic thermal areas. Satellites with thermal infrared instruments, such as ASTER and Landsat 8 and 9, can measure the heat emitted from thermal areas, but because of their moderate spatial resolution (90- to 100-meter pixels [about 300 feet]) they cannot clearly detect subtle changes in small thermal areas or thermal water bodies. High-resolution commercial satellite data do not yet have thermal infrared capabilities, but the sub-meter- to meter-scale pixels in those datasets enable detection of small visible features that are characteristic of thermal areas, such as mineral deposits, vegetation stress, water discoloration, snow-free zones, and persistent open water on frozen lakes during the winter. These data are thus important for accurately mapping the extent of thermal areas and characterizing unique features and changes that are too subtle to be detected with moderate-resolution satellite data.
A new project started in 2024, supported by the National Aeronautics and Space Administration (NASA) Commercial SmallSat Data Scientific Analysis Program, focuses on using satellite data to assess and update current maps of Yellowstone’s thermal areas and thermal water bodies. The project specifically makes use of WorldView-1, -2, -3, and GeoEye-1 imagery (Maxar Technologies; available at https://www.usgs.gov/centers/eros/science/usgs-eros-archive-commercial-satellites-commercial-data-purchases-cdp-imagery) to map persistently snow- or ice-free zones in wintertime imagery. Preliminary data analyses indicate that numerous persistently snow- or ice-free zones are adjacent to, but outside of, some previously mapped thermal area boundaries, possibly indicating that the thermal area boundary should be extended (for example, fig. 31). The use of high spatial resolution images acquired in the wintertime from these commercial satellites will enable more detailed mapping of thermal area boundaries and the recognition of thermal areas that are smaller than can be resolved by moderate-resolution sensors. This fine-tuning of thermal area map products will have a substantial benefit for the understanding of heat emissions and potential hazards from hydrothermal areas in the Yellowstone region.
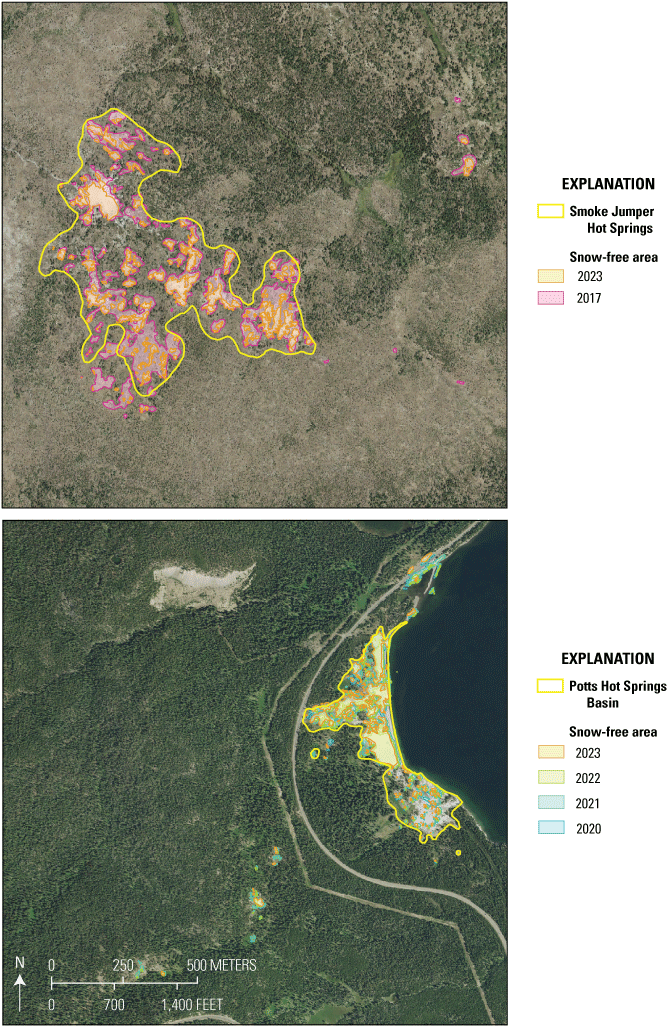
Examples of high-resolution commercial satellite imagery used to map thermal area boundaries. Top, The northern part of Smoke Jumper Hot Springs is shown in yellow. Areas that have been mapped as persistently snow free in wintertime imagery are shown in pink and orange colors. These persistently snow-free zones could be warm areas that should be included in the thermal area mapping. Bottom, The northern part of Potts Hot Springs Basin is shown in yellow. Areas that have been mapped as persistently snow free in wintertime imagery are shown in orange, pale blue, and green colors. These persistently snow-free zones could be warm areas that should be included in the thermal area mapping. This work used data made available through the National Aeronautics and Space Administration (NASA) Commercial SmallSat Data Acquisition Program and Maxar’s NEXTVIEW End User License Agreement. Background maps are from National Agriculture Imagery Program in 2022.
Communications and Outreach
YVO scientists were extremely active with public programs and outreach events in 2024. Three public lectures, two in Gardiner, Montana (in May and September) and one in West Yellowstone, Montana (in September), provided an opportunity to update local residents and visitors on recent research and monitoring results from geological, geochemical, and geophysical studies of the Yellowstone region. The September events provided an opportunity to give updates and answer questions about the Biscuit Basin hydrothermal explosion. The May event in Gardiner was held in conjunction with the YVO biennial coordination meeting (refer to “YVO Coordination Meeting” section) and featured many YVO scientists with different expertise providing updates and demonstrations of equipment. In May, YVO scientists also led a multiday geological field for the Geologists of Jackson Hole group. In August, two seismologists gave presentations during the commemoration of the 65th anniversary of the Hebgen Lake earthquake at the U.S. Forest Service Earthquake Lake Visitor Center.
During 2024, YVO continued to produce products that have now become traditional, including monthly video updates of activity (posted on “USGSVolcanoes” Facebook, Instagram and X (Twitter) social media, the USGS YouTube channel “Yellowstone” playlist, the USGS Multimedia Gallery [downloadable], and the multimedia section of the YVO website). The multiple platforms provide hundreds of thousands of people with an opportunity to learn about geological aspects of Yellowstone National Park, refer to recent seismic, deformation, and geyser data, and ask questions of scientists via comments and through the email yvowebteam@usgs.gov. YVO scientists and guest scientists also contribute to weekly Yellowstone Caldera Chronicles articles, which are posted to social media, the YVO webpage, and published by several regional news outlets. The weekly articles are also sent via email to people who have subscribed to the Yellowstone Caldera Chronicles, and during 2024, the number of email subscribers grew from about 4,600 to more than 7,000. YVO scientists from USGS also participated in more than 60 media interviews throughout the year, including for podcasts, radio, print and online outlets, documentaries, and local and national television and cable news. About half of these media contacts were in response to the July 23, 2024, hydrothermal explosion at Biscuit Basin.
Summary
In 2024, measurements from monitoring stations in and around Yellowstone National Park indicated background levels of seismicity, deformation, and thermal emissions. The number of located earthquakes (1,173) was at the low end of the typical range of annual seismicity for the region. GPS measurements indicated no significant deformation at Norris Geyser Basin throughout the year, and Yellowstone Caldera continued to subside at rates of a few centimeters (about 1 inch) per year, as it has since 2015. Heat flux estimates from both satellite imagery and river chemistry indicated no major changes with respect to previous years, although continued effects from the June 2022 flood caused a failure of the monitoring station on the Yellowstone River and complicated measurements of hydrothermal output for that drainage. Geyser activity was mostly normal, and 6 major water eruptions occurred at Steamboat Geyser, the fourth straight year of a decrease in the number of eruptions from the world’s tallest geyser. Other noteworthy hydrothermal activity included the reactivation of Economic Geyser after about 25 years of quiescence, an increase in the temperature of Abyss Pool, and the formation of a new steam vent north of Nymph Lake. Changes like these are considered to be normal in the dynamic thermal areas of Yellowstone National Park.
The most important geological events of 2024 were two hydrothermal explosions, one on April 15 in Norris Geyser Basin and the other on July 23 in Biscuit Basin, Upper Geyser Basin. The April 15 event was the first instrumentally recorded hydrothermal explosion in the history of Yellowstone National Park—it was not witnessed, but was detected by seismic and acoustic monitoring, including at a station that was installed in September 2023 for the specific purpose of monitoring hydrothermal activity. The explosion left a crater about 3 meters (10 feet) across, surrounded by disrupted ground, and it caused a change in the behavior of nearby hydrothermal features, which ceased discharging water into nearby Nuphar Lake. The July 23 event at Biscuit Basin occurred during a bright sunny morning and was well observed by people in Upper Geyser Basin, including dozens of people in Biscuit Basin who had to scramble for safety; fortunately, there were no injuries. Analysis of material deposited during the explosion indicates that the event was caused by changes in pressure within a sealed part of the hydrothermal system at shallow depths beneath Black Diamond Pool; no other nearby hot springs or geysers were affected by the activity. Throughout the remainder of the year, temporary monitoring instruments deployed after the explosion recorded signals associated with numerous episodic, smaller explosive events that sent rocks, mud, and water a few meters (tens of feet) into the air and included surges of water from Black Diamond Pool. YVO will explore the installation of a permanent real-time monitoring station in Biscuit Basin in 2025.
2024 Publications
Harrison, L.N., Hurwitz, S., Paces, J.B., Peek, S., Whitlock, C., and Licciardi, J., 2023, Mineralogy, strontium (87Sr/86Sr), oxygen (18O/16O) and carbon (13C/12C) isotope composition, elemental concentrations, and U-Th disequilibrium ages for travertine deposits from various locations in Yellowstone National Park, USA: U.S. Geological Survey data release, https://doi.org/https://doi.org/10.5066/P9G2R6ZF.
Harrison, L.N., Hurwitz, S., Paces, J.B., Whitlock, C., Peek, S., and Licciardi, J., 2024, Travertine records climate-induced transformations of the Yellowstone hydrothermal system from the late Pleistocene to the present: Geological Society of America Bulletin, v. 136, no. 9–10, p. 3605–3618, at https://doi.org/10.1130/B37317.1.
Hurwitz, S., 2024, Major element chemistry of water from Old Faithful Geyser and the Firehole River, Upper Geyser Basin, Yellowstone National Park: U.S. Geological Survey, data release, https://doi.org/https://doi.org/10.5066/P139XEUL.
Hurwitz, S., 2024, Data from temperature measurements in research drill hole Y-7, Upper Geyser Basin, Yellowstone National Park: U.S. Geological Survey data release, https://doi.org/https://doi.org/10.5066/P13BXLDI.
Hurwitz, S., King, J.C., and Pederson, G.T., 2024, Radiocarbon dating of silicified wood from around Artemisia Geyser in the Upper Geyser Basin, Yellowstone National Park: U.S. Geological Survey data release, https://doi.org/https://doi.org/10.5066/P1EDRZ6L.
Paces, J.B., Hurwitz, S., Harrison, L.N., Lowenstern, J.B., and McCleskey, R.B., 2024, Radiogenic strontium‐ and uranium‐isotope tracers of water‐rock interactions and hydrothermal flow in the Upper Geyser Basin, Yellowstone Plateau volcanic field, USA: Geochemistry, Geophysics, Geosystems, v. 25, no. 10, 29 p., https://doi.org/https://doi.org/10.1029/2024GC011729.
Price, M.B., McCleskey, R.B., Oaks, A., Hurwitz, S., and Nordstrom, D.K., 2024, Historic water chemistry data for thermal features, streams, and rivers in the Yellowstone National Park Area, 1883–2021: U.S. Geological Survey data release, https://doi.org/https://doi.org/10.5066/P9KSEVI1.
Reed, M., Barth, A., Taira, T., Farrell, J., and Manga, M., 2024, A shake and a surge—Assessing the possibility of an earthquake-triggered eruption at Steamboat Geyser: Volcanica, v. 7, no. 2, p. 733–748, at https://doi.org/10.30909/vol.07.02.733748.
Vaughan, R.G., Hungerford, J.D.G., and Hunter, M.A., 2024, Map of Yellowstone’s thermal areas—Updated 2023-12-31: U.S. Geological Survey data release, https://doi.org/https://doi.org/10.5066/P1457JVI.
References Cited
Christiansen, R.L., 2001, The Quaternary and Pliocene Yellowstone Plateau volcanic field of Wyoming, Idaho, and Montana: U.S. Geological Survey Professional Paper 729-G, 145 p., https://doi.org/10.3133/pp729G.
Christiansen, R.L., Lowenstern, J.B., Smith, R.B., Heasler, H., Morgan, L.A., Nathenson, M., Mastin, L.G., Muffler, L.J.P., and Robinson, J.E., 2007, Preliminary assessment of volcanic and hydrothermal hazards in Yellowstone National Park and vicinity: U.S. Geological Survey Open-File Report 2007–1071, 94 p., https://doi.org/10.3133/ofr20071071.
Dzurisin, D., Wicks, C.W., and Poland, M.P., 2012, History of surface displacements at the Yellowstone Caldera, Wyoming, from leveling surveys and InSAR observations, 1923–2008: U.S. Geological Survey Professional Paper 1788, 68 p., https://doi.org/10.3133/pp1788.
Haller, K.M., and Pierce, K.L., compilers, 1996a, Fault number 746a, East Gallatin-Reese Creek Fault system, Reese Creek section, in Quaternary fault and fold database of the United States: U.S. Geological Survey, accessed May 2023, at https://www.usgs.gov/programs/earthquake-hazards/faults.
Haller, K.M., and Pierce, K.L., 1996b, Fault number 746b, East Gallatin-Reese Creek Fault system, East Gallatin section, in Quaternary fault and fold database of the United States: U.S. Geological Survey, accessed May 2023, at https://www.usgs.gov/programs/earthquake-hazards/faults.
Lowenstern, J.B., Christiansen, R.L., Smith, R.B., Morgan, L.A., and Heasler, H., 2005, Steam explosions, earthquakes, and volcanic eruptions—What’s in Yellowstone’s future?: U.S. Geological Survey Fact Sheet 2005–3024, 6 p., https://doi.org/10.3133/fs20053024.
Morgan, L.A., Shanks, W.C.P., Pierce, K.L., Iverson, N., Schiller, C.M., Brown, S.R., Zahajska, P., Cartier, R., Cash, R.W., Best, J.L., Whitlock, C., Fritz, S., Benzel, W., Lowers, H., Lovalvo, D.A., and Licciardi, J.M., 2023, The dynamic floor of Yellowstone Lake, Wyoming, USA—The last 14 k.y. of hydrothermal explosions, venting, doming, and faulting: Geological Society of America Bulletin, v. 135, no. 3–4, p. 547–574, at https://doi.org/10.1130/B36190.1.
Price, M.B., McCleskey, R.B., Oaks, A., Hurwitz, S., and Nordstrom, D.K., 2024, Historic water chemistry data for thermal features, streams, and rivers in the Yellowstone National Park area, 1883–2021: U.S. Geological Survey data release, https://doi.org/10.5066/P9KSEVI1.
Smith, R.B., and Siegel, L.J., 2000, Windows into the Earth—The geologic story of Yellowstone and Grand Teton National Parks: New York, Oxford University Press, 242 p., https://doi.org/10.1093/oso/9780195105964.001.0001.
Stelten, M.E., Thomas, N., Pivarunas, A., and Champion, D., 2023, Spatio-temporal clustering of post-caldera eruptions at Yellowstone Caldera—Implications for volcanic hazards and pre-eruptive magma reservoir configuration: Bulletin of Volcanology, v. 85, no. 10, article no. 55, 17 p., https://doi.org/10.1007/s00445-023-01665-w.
U.S. Geological Survey, 2020, Quaternary fault and fold database for the Nation: U.S. Geological Survey database, accessed February 9, 2026, at https://doi.org/10.5066/P9BCVRCK.
Wicks, C.W., Dzurisin, D., Lowenstern, J.B., and Svarc, J., 2020, Magma intrusion and volatile ascent beneath Norris Geyser Basin, Yellowstone National Park: Journal of Geophysical Research, v. 125, no. 2, at https://doi.org/10.1029/2019JB018208.
Yellowstone Volcano Observatory [YVO], 2019, Yellowstone Volcano Observatory 2017 annual report: U.S. Geological Survey Circular 1456, 37 p., https://doi.org/10.3133/cir1456.
Yellowstone Volcano Observatory [YVO], 2021a, Yellowstone Volcano Observatory 2018 annual report: U.S. Geological Survey Circular 1474, 38 p., https://doi.org/10.3133/cir1474.
Yellowstone Volcano Observatory [YVO], 2021b, Yellowstone Volcano Observatory 2019 annual report: U.S. Geological Survey Circular 1473, 35 p., https://doi.org/10.3133/cir1473.
Yellowstone Volcano Observatory [YVO], 2021c, Yellowstone Volcano Observatory 2020 annual report: U.S. Geological Survey Circular 1482, 44 p., https://doi.org/10.3133/cir1482.
Yellowstone Volcano Observatory [YVO], 2022a, Yellowstone Volcano Observatory 2021 annual report: U.S. Geological Survey Circular 1494, 48 p., https://doi.org/10.3133/cir1494.
Yellowstone Volcano Observatory [YVO], 2022b, Volcano and earthquake monitoring plan for the Yellowstone Caldera system, 2022–2032: U.S. Geological Survey Scientific Investigations Report 2022–5032, 23 p., https://doi.org/10.3133/sir20225032.
Yellowstone Volcano Observatory [YVO], 2023, Yellowstone Volcano Observatory 2022 annual report: U.S. Geological Survey Circular 1508, 49 p., https://doi.org/10.3133/cir1508.
Yellowstone Volcano Observatory [YVO], 2024, Yellowstone Volcano Observatory 2023 annual report: U.S. Geological Survey Circular 1524, 49 p., https://doi.org/10.3133/cir1524.
Disclaimers
Any use of trade, firm, or product names is for descriptive purposes only and does not imply endorsement by the U.S. Government.
Although this information product, for the most part, is in the public domain, it also may contain copyrighted materials as noted in the text. Permission to reproduce copyrighted items must be secured from the copyright owner.
Suggested Citation
Yellowstone Volcano Observatory, 2026, Yellowstone Volcano Observatory 2024 annual report: U.S. Geological Survey Circular 1566, 44 p., https://doi.org/10.3133/cir1566.
ISSN: 2330-5703 (online)
ISSN: 1067-084X (print)
Study Area
| Publication type | Report |
|---|---|
| Publication Subtype | USGS Numbered Series |
| Title | Yellowstone Volcano Observatory 2024 annual report |
| Series title | Circular |
| Series number | 1566 |
| DOI | 10.3133/cir1566 |
| Publication Date | April 09, 2026 |
| Year Published | 2026 |
| Language | English |
| Publisher | U.S. Geological Survey |
| Publisher location | Reston, VA |
| Contributing office(s) | Volcano Science Center |
| Description | Report: vi, 44 p.; Infographic |
| Country | United States |
| State | Idaho, Montana, Wyoming |
| Other Geospatial | Yellowstone National Park |
| Online Only (Y/N) | N |
| Additional Online Files (Y/N) | Y |