

Concentrations of Per- and Polyfluoroalkyl Substances (PFAS) in Selected Rivers and Streams in Massachusetts, 2020
Links
- Document: Report (2.95 MB pdf) , HTML , XML
- Data Release: USGS data release - Environmental and quality-control data for per- and polyfluoroalkyl substances (PFAS) measured in selected rivers and streams in Massachusetts, 2020 (ver. 2.0, July 2023)
- Version History: Version History (3.1 kB txt)
- NGMDB Index Page: National Geologic Map Database Index Page (html)
- Download citation as: RIS | Dublin Core
Acknowledgments
This study benefitted greatly from the interest, support, and assistance of many colleagues and agencies, including Laura J. Blake, Richard O. Carey, Richard F. Chase, and Arthur S. Johnson of the Massachusetts Department of Environmental Protection, Watershed Planning Program, who were instrumental in guiding the work; staff of the wastewater treatment facilities, who allowed us access to their properties and helped with site reconnaissance; and graduate student Jiayue Luo of the University of Massachusetts in Lowell, through funding from the National Science Foundation, for her assistance in collecting the water samples.
Abstract
Water samples collected from 27 rivers and streams in Massachusetts were analyzed to characterize the presence and concentrations of per- and polyfluoroalkyl substances (collectively known as PFAS) in surface waters across the Commonwealth. Sampling sites were selected in urban rivers where PFAS were expected to be present, such as those that receive treated municipal wastewater, and in rural rivers that were not known to be affected by municipal wastewater. The samples were collected three times in 2020 from 64 sites, and were analyzed for 24 PFAS, 18 of which are included in the U.S. Environmental Protection Agency’s Method 537.1.
Samples were collected when the instantaneous flow of the rivers and streams were at base-flow condition to minimize PFAS input or dilution from stormwater runoff and overland flow. The analyses detected PFAS in samples from all 27 rivers and streams. The number of PFAS detected in each sample ranged from 2 to 16. Concentrations of individual PFAS ranged from no detectable concentrations (less than 1.74 nanograms per liter) to 109 nanograms per liter. Samples from sites associated with wastewater treatment facilities in urban areas had a larger number and variety of PFAS present, and at higher concentrations, than in samples from the more rural rivers. This report includes a summary of the chemical data and physical properties of both environmental and quality-control samples, and a description of procedures for the collection and processing of the samples.
Introduction
Per- and polyfluoroalkyl substances (collectively known as PFAS) are man-made chemicals that have been manufactured since the 1940s. These substances have been used in the United States for decades in many consumer and industrial products such as nonstick, stain-resisting, water-repelling agents, and in firefighting foams. PFAS are persistent in the environment and are known to have adverse effects on the health of humans and animals. Reduction in the manufacture and use of certain PFAS began in the late 1990s, and countries around the world have been working to both control PFAS in the environment and reduce human exposure pathways. PFAS have been detected throughout the world, with higher concentrations near areas where they are either manufactured or used (such as fire-training areas), and in wastewater and sewage sludge (biosolids). PFAS are resistant to degradation and are known to migrate away from sources in groundwater and surface water, threatening human exposure through contaminated drinking water. Recent studies of PFAS in wastewater discharges to streams have shown decreases over time; however, wastewater discharges, biosolids disposal, and industrial sources continue to be a concern for drinking-water contamination (U.S. Environmental Protection Agency, 2022; Hu and others, 2016; Wang and others, 2017; Sunderland and others, 2018).
The areal extent, presence and magnitude of PFAS concentrations in Massachusetts rivers and streams from point and nonpoint sources is unknown. Thus, a baseline characterization of those factors is needed so that PFAS in rivers and streams can be better quantified, and their sources and pathways managed. In 2020, the U.S. Geological Survey (USGS), in cooperation with the Massachusetts Department of Environmental Protection (MassDEP), conducted three sampling rounds at 64 sites on 27 rivers and streams across the Commonwealth. Water samples were collected upstream and downstream from 25 municipal wastewater treatment facilities (only downstream at one facility) that discharge to rivers, many of which are upstream from intakes for public drinking-water supplies. Samples also were collected from an additional 15 sites to represent nonmunicipal, wastewater-affected streams with other suspected nonpoint sources or where no upstream sources were suspected. Locations of the sampled stream sites are shown in figure 1.
The information obtained from this study will provide MassDEP recent, comparable, and reliable data on concentrations of PFAS in rivers and streams in Massachusetts and will also help resource managers prioritize and better quantify the extent of PFAS concerns associated with wastewater treatment facilities that are upstream of intakes for public drinking-water supplies. Additionally, data from stream sites that were not known to be affected by wastewater discharges will fill spatial gaps in statewide characterization. This report describes the sample collection and analytical methods used in the study, provides a summary of the field and laboratory quality-assurance information collected, briefly describes the frequency of occurrence and magnitude of PFAS concentrations measured, and describes the publicly available results and metadata from this study and how to access them.
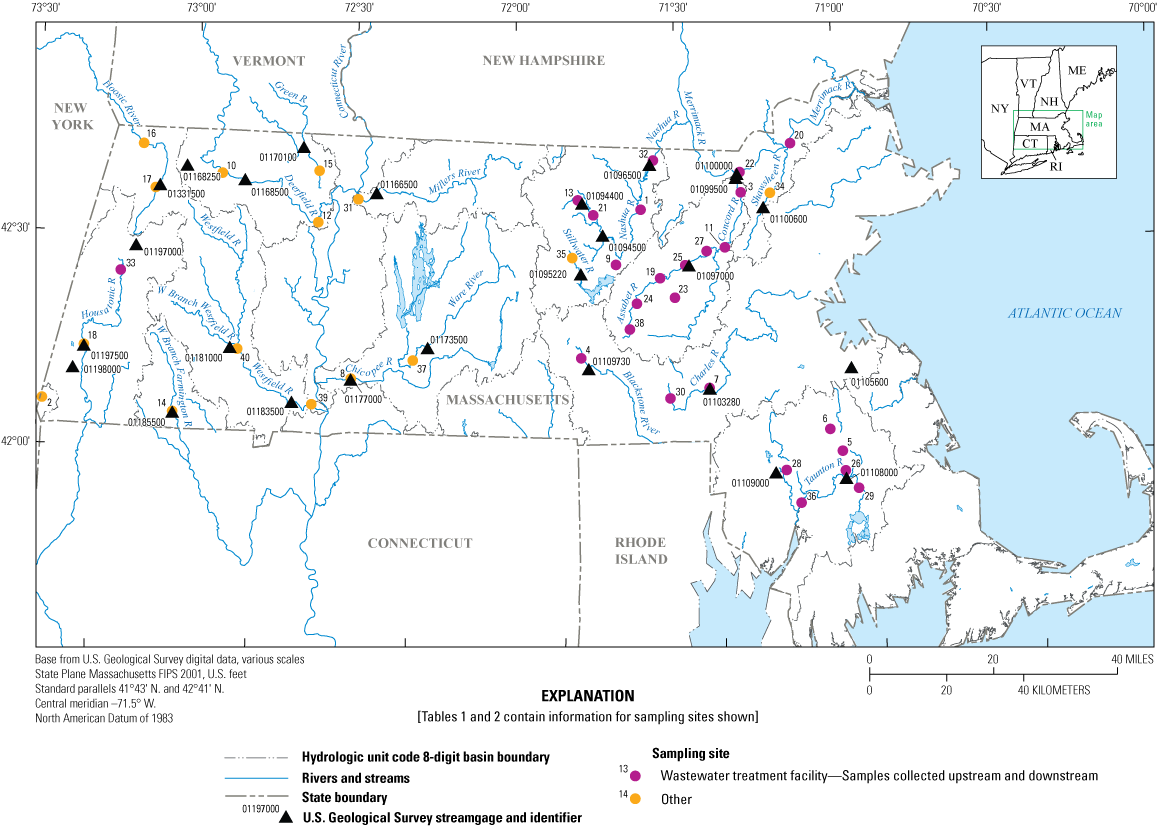
Map showing locations of wastewater treatment facilities, other sampling sites, and nearby gages used to monitor streamflow conditions in Massachusetts.
Study Design
Water samples were collected from August 17 through November 9, 2020, upstream and downstream from 25 wastewater treatment facilities (except at site number 33 [fig. 1], where only downstream samples were collected) and at 15 river or stream sites that were not associated with wastewater discharges (table 1, in back of report). Samples were collected at each site three times over nearly 4 months, with the period between sampling rounds generally lasting 3 to 4 weeks. To ensure that the samples were representative of base-flow concentrations, thereby minimizing PFAS input or dilution from stormwater runoff and overland flow, samples were collected when the streams were at base-flow conditions. For this study, base-flow conditions were defined as those following three or more consecutive days of declining flow and an instantaneous flow less than the 25th percentile of annual daily mean flow (Rantz and others, 1982a, b).
The sampling sites included existing MassDEP monitoring sites, wastewater treatment facility ambient monitoring sites, USGS monitoring sites, and several new sites established for this project. All the sampling sites were assigned USGS station numbers and names. The sites were chosen so that they were only minimally affected by contributions from joining tributaries between the sample sites and the wastewater treatment facilities. Distances upstream and downstream from the wastewater treatment facility discharge points were generally less than (<) 1 mile. In some rivers, however, such as the Merrimack, downstream sampling sites were nearly 8 miles downstream from the discharge point owing to access limitations.
Flow conditions during sample collection were determined from the USGS WaterWatch website, which displays current streamflow conditions relative to the annual daily mean for a site and period of record (https://waterwatch.usgs.gov/?m=real&r=ma&w=map). The 64 sampling sites were spatially associated with an active USGS continuous streamgage (table 2, in back of report; fig. 1). In some cases, several PFAS sampling stations were associated with a single USGS streamgage, such as that on the Assabet River. The USGS streamgages were used as index stations to determine if streams met the sampling criteria for base-flow conditions defined previously.
Discrete measurements of water temperature, specific conductance, pH, and dissolved-oxygen concentration were made in-place and across the stream channel (with YSI 6920 V2-1 multiparameter probes) and the medians of these measurements were applied to the environmental samples. Turbidity also was measured (with a Hach 2100P turbidity meter), either in a grab sample collected from the river center or in the composited sample from a churn splitter. Depending on the width of the river, the USGS standard isokinetic, depth-integrated sampling method, or a modified version, was used to collect the samples (USGS, variously dated). At sites at which the water was shallow enough to wade, samples were collected using a DH-81 depth-integrated hand sampler. At sites that were too deep to wade, samples were collected from bridges using either a DH-95 sampler that was lowered to the stream using a bridge board or by hand, or when flows were <1.5 feet per second (ft/s), samples were collected using a weighted-bottle sampler. If a bridge was not present at the site (such as the Taunton River), samples were collected from a boat using a weighted-bottle sampler. For sites with a cross-sectional width of <30 feet (ft) a single vertical, depth-integrated sample was collected using the DH-81 sampler (or weighted-bottle sampler if flows were <1.5 ft/s) at the center of the river. The sample water was then decanted directly into the sample bottles for analysis at the laboratory. At sites with cross-sectional widths ranging from 30 to 60 ft, three multivertical, depth-integrated subsamples were collected, one each at the center of the channel and at points equidistant from the center and the left and right banks; these subsamples were then decanted into a 4-liter polyethylene churn splitter, which is a compositing container. Sample bottles were filled directly from the churn while the composited sample was being mixed by the churn plunger. At sites where the channel was greater than (>) 60 ft wide, 10 equal-width increment samples were collected using the DH-95 and composited into an 8-liter polyethylene churn splitter, except at Deerfield River (station number 01170006) and Chicopee River (station number 01177000); at those sites, 10 equal-width transect multiple-vertical samples were collected using a weighted-bottle sampler instead of the DH-95 sampler because flows were <1.5 ft/s. At stations on the Nashua River (station number 01095920) and the Assabet River (station number 01097390), the only safe sample-collection locations were from the riverbank (by wading in near the edge) or from a dock. The sampling methods used at each site for the three sampling rounds are shown in table 2 (in back of report).
Collection and Analysis of Environmental Samples
Although the USGS does not currently have published procedures for the collection of surface-water samples specifically for PFAS analysis, internal recommendations and a consensus of best practices provide guidance. The USGS best practices, or procedures, for the collection of surface-water samples for PFAS analysis were based on the policies and procedures for the collection of water-quality data described in the USGS national field manual (USGS, variously dated). The equipment and procedures used for sample collection include: (1) sample-handling equipment that is constructed of noncontaminating materials (for example, no Teflon-based or other equipment with “fluoro” in the construction material name is used); (2) handling equipment in a manner that minimizes the potential for altering ambient sample composition; (3) handling samples in a manner that prevents contamination; and (4) routinely collecting quality-control samples (USGS, variously dated). Sampling equipment was thoroughly cleaned prior to sample collection. Churns and 1-liter sample-collection bottles and bottle nozzles were cleaned with a dilute soap and tap water solution, followed by three rinses of tap water, then by rinses of laboratory-grade deionized water until the specific conductance of the water collected from the churn spigot (or sample-collection bottle and nozzle) measured <1 microsiemens per centimeter at 25 degrees Celsius. The equipment was then transferred to a fume hood, where it was rinsed with methanol and allowed to dry. After the equipment was clean and dry, it was double bagged in polyethylene bags to avoid contamination.
Sampling equipment was field rinsed with sample water prior to sample collection; however, 250-milliliter (mL) high-density polyethylene sample bottles supplied by the analyzing laboratory, Alpha Analytical, Inc., were not rinsed per recommendation by the laboratory. Each sample was collected into two 250-mL high-density polyethylene sample bottles, unfiltered and without chemical preservative. The sample bottles were filled to the shoulder, capped, double bagged, and stored at near 4 degrees Celsius until they were transferred to Alpha Analytical, Inc. in Mansfield, Mass.
The samples were analyzed for specific PFAS using a solid-phase extraction and liquid chromatography/tandem mass spectrometry isotope dilution method, which is a proprietary method modified from EPA Method 537.1. Results of the analyses by this method include concentrations of both the dissolved and sediment-bound PFAS. Alpha Analytical, Inc. first analyzes the liquid sample and then centrifuges the sample and extracts PFAS that are bound to any sediment in the sample. The two extracts (dissolved and sediment-bound) are combined for the final result. The method provided the concentrations for the linear isomers only for 19 of the selected PFAS and concentrations of linear and branched isomers for five substances, as indicated by the substance name, for a total of 24 analytes. Laboratory analyses of the selected PFAS include results of extracted internal standards (also known as surrogates) that were used to monitor the extraction efficiency of the selected analytes. The naming convention for individual PFAS used by Alpha Analytical, Inc. is different than that used by the USGS. Information about each analyte and results of the analyses of each is included in table 3 (in back of report).
Collection and Analysis of Quality-Control Samples
The collection and analysis of quality-control (QC) samples are prerequisite for evaluating the quality of techniques for the collection and processing of environmental samples, as well as data from the actual samples themselves. Environmental-sample data cannot be adequately interpreted if QC data, such as blanks and replicates, are not collected, because any errors associated with the sample data are unknown. In this study, QC samples were collected prior to and throughout the sampling period to ensure that the sampling equipment itself and methods used for cleaning the equipment, collecting the environmental samples, and analyzing the samples were not inadvertently introducing PFAS into the samples. Data from the QC samples were considered to represent the same conditions of potential bias, variability, and random error that affect the environmental samples. Thus, the distribution and frequency of apparent contamination, bias, and random error in the QC samples (both as an ensemble and within analytical batches), were characterized and then used to infer the quality of the environmental samples (Mueller and others, 2015).
Quality-control samples consisted of several types of blank samples and include: (1) three blanks prepared using deionized water produced at the USGS laboratory in Massachusetts and used to clean sampling equipment, (2) three source-solution blanks prepared using Fisher Chemical Optima water manufactured for high-performance liquid chromatography that was used for the field blanks, (3) two preliminary equipment blanks prepared on July 30, 2020, in the USGS laboratory in Massachusetts using the churn splitters and 1-liter sample-collection bottles and bottle nozzles prior to collection of environmental samples, and (4) 23 field blanks collected by passing the Fisher Chemical Optima water through the sample-collection bottle and nozzle into the churn splitter and filling the sample bottles from the churn spigot before the environmental samples were collected. Quality-control samples also included replicates of 22 environmental samples that were either split concurrently, when taken from a churn splitter; or split sequentially, when decanted directly from the 1-liter sample-collection bottles.
Laboratory QC samples were analyzed by Alpha Analytical, Inc. to ensure the precision and accuracy of the laboratory results. Laboratory QC samples included 33 laboratory method blanks, 33 laboratory control sample pairs, 24 laboratory matrix spikes, and 23 laboratory duplicates. Alpha Analytical, Inc. requires that these five types of laboratory QC samples be prepared and analyzed for every batch (no more than 20 samples per batch) of environmental samples processed. If the results of the analysis of a laboratory QC sample did not meet either the percent recovery limits of the analytical method or the extracted internal standard acceptance criteria, then Alpha Analytical, Inc. either repeated the analysis until satisfactory results were obtained or assigned data qualifiers to describe the performance issue.
Laboratory method blanks were analyzed to confirm that potential background contaminants were not interfering with the identification or quantitation of the method analytes. Laboratory control samples were analyzed to assess the performance of the analysis and were prepared by fortifying deionized water with known concentrations of selected analytes in low (2 nanograms per liter [ng/L]), medium (40 ng/L), and high (500 ng/L) concentrations that were rotated from batch to batch. The laboratory control samples were analyzed in pairs, and the relative percent differences of the two results had to be less than or equal to (≤) 30 percent for medium- and high-concentration replicates, and ≤50 percent for low-concentration replicates for the batch analysis results to be considered acceptable.
Laboratory matrix spikes were completed to assess the extent that sample matrix may interfere with the method accuracy. The matrix spikes were created by spiking a random environmental sample with a known concentration of selected analytes. Similar to the laboratory control samples, the matrix spike samples were spiked with low, medium, and high concentrations of selected analytes and the percent recoveries of the added spike analytes were determined. Percent recoveries for matrix spikes had to range between 70 and 130 percent for medium- and high-concentration spiked samples, and 50 to 150 percent for low-concentration spiked samples for the batch analysis results to be considered acceptable. If recoveries were outside these criteria, the results were qualified by Alpha Analytical, Inc.
Laboratory duplicates were analyzed to verify the precision associated with the sample storage and laboratory procedures. Alpha Analytical, Inc. analyzed at least one laboratory duplicate per every 20 samples analyzed either by randomly reanalyzing one of the USGS environmental samples in the batch or by analyzing a sample from another client that was included in the same batch. Results of the two analyses were compared, and relative percent differences between the initial analysis and the duplicate analysis had to be ≤30 percent for the laboratory replication of analyses to be considered acceptable.
Results of Analyses of Environmental and Quality-Control Samples
A total of 192 discrete environmental water samples and 53 field QC samples were collected for the 64 sites during the study period (August to November 2020). The water-quality data for the environmental samples are available to the public online from the USGS National Water Information System (NWIS) web interface (USGS, 2020). The data for the environmental samples and the associated field and laboratory QC samples are available in a data release (Savoie and Argue, 2022).
Measurable concentrations of PFAS were detected in samples from all 27 rivers and streams; however, the number of different substances and their concentrations varied across the State and site types. Nineteen of the 24 PFAS for which samples were analyzed were detected at least once. Five PFAS: fluorotelomersulfonate (8:2 FTS), fluorotelomersulfonate (4:2 FTS), perfluorodecanesulfonate (PFDS), perfluorononanesulfonate (PFNS), and perfluorooctanesulfonamide (PFOSA, also called FOSA) were not detected in any of the samples. A statistical summary of PFAS detected in samples collected from August to November 2020 at 64 sites (192 samples) is shown in table 4. Summary statistics for the minimum, median, mean, and maximum concentrations of each analyte do not include the results that were reported as less than the reporting limit (table 1).
Table 4.
Statistical summary of per- and polyfluoroalkyl substances measured in samples collected from selected rivers and streams in Massachusetts from August to November 2020.[Abbreviations of analytes are shown in parenthesis after analyte name. USGS, U.S. Geological Survey; wu, water unfiltered; E, estimated; V, value affected by systematic contamination, which is attributed in this study to laboratory contamination for PFHxA; —, no data]
The number of PFAS detected in each sample ranged from a low of one substance, measured in samples from Wright Brook, to a high of 16 PFAS, measured in samples from the Shawsheen River. Concentrations of individual PFAS ranged from estimated concentrations that were greater than the method detection limit (MDL) and less than the reporting limit (RL) to 109 ng/L. Six PFAS were detected in 90 percent or more of the samples analyzed; these included the substances perfluorooctanoate (PFOA), perfluorooctanesulfonate (PFOS), perfluoroheptanoate (PFHpA), perfluoropentanoate (PFPeA), perfluorobutanoate (PFBA), and perfluorobutanesulfonate (PFBS). PFPeA and perfluorohexanoate (PFHxA) had the highest overall median concentrations, at 10.9 and 10.7 ng/L, respectively. The highest maximum concentrations reported were for PFPeA and PFBS, at 106 and 109 ng/L, respectively. The highest maximum concentrations of PFOA, PFHpA, PFBA, and PFBS (42, 19, 54, and 109 ng/L, respectively) were measured in samples from the North Nashua River. The highest PFOS concentration (55 ng/L) was measured in the Shawsheen River and the highest PFPeA concentration (106 ng/L) was measured in Sawmill Brook (table 4). Concentrations typically increased from sampling sites upstream to sites downstream from the wastewater treatment facilities, although at some downstream sites concentrations decreased. At sampling sites with associated wastewater treatment facilities, more PFAS were detected and at higher concentrations than at sampling sites on rivers without wastewater treatment facilities.
Field replicate samples were collected at sites that included a wide range of PFAS concentrations, from less than the RL to more than 100 ng/L. The relative percent difference for the field replicate samples was <20 percent for all substances. The relative percent difference between laboratory control sample pairs was <30 percent for all pairs except for Fluorotelomersulfonate (6:2 FTS) in work group WG1414858. The laboratory control sample pair in work group WG1414858 (WG1414858-3 and WG1414858-2) differed by 46 percent, however 6:2 FTS was not detected in the environmental samples analyzed in work group WG1414858. The percent recovery of all the matrix spike samples fell within the set recovery limits for each analyte measured. Data from field and laboratory quality control samples are included as tables in the accompanying data release (Savoie and Argue, 2022).
Perfluorohexanoate (PFHxA) was detected frequently in the QC samples at concentrations greater than the MDL and less than the RL and ranged from 0.305 to 0.513 ng/L. The QC samples with detections of PFHxA included three field source-solution blanks, 80 percent of the field blank samples, two of three deionized water blanks, and 44 percent of the laboratory method blanks. In response to the frequent detection of PFHxA in both field and laboratory blanks, two measures were employed to identify and describe the observed low-level systematic bias for PFHxA results. First, all detections greater than the MDL and less than the RL were reported as less than the RL. Second, a subset of environmental results was qualified with a “V” remark code, indicating that the concentrations may be affected by contamination. Environmental results less than or equal to 10 times the 95-percent upper confidence limit for the 95th percentile of the PFHxA concentrations measured in blanks (Mueller and others, 2015) were qualified with a “V” remark code. The 95-percent upper confidence limit of the 95th percentile of PFHxA concentrations measured in blank samples was 0.513 ng/L. Therefore, all environmental and replicate samples with concentrations of PFHxA reported above the RL and below 5.13 ng/L were qualified with a “V” remark code. The rationale was that potential contamination for this subset of samples could be as great as 10 percent of the measured value; thus, the effect of the contamination bias on the environmental value may be of significance for the measured PFHxA concentrations in these samples. For concentrations in environmental samples >5.13 ng/L, the potential contamination bias would be <10 percent of the reported concentration and is less significant to the environmental values; thus, these values were not qualified with a “V” remark code but were flagged with value qualifier “v” in NWIS, indicating that PFHxA was detected in the laboratory method blank. The PFHxA contamination bias resulted in 36 samples (29 environmental and 7 replicate samples) with PFHxA concentrations greater than the RL and <5.13 ng/L qualified with a “V” remark code.
Selected additional results were also qualified with a “V” remark code because the laboratory method blank completed during the analysis had one or more detections of PFAS. Perfluorononanoate (PFNA) concentrations for six environmental samples (L2046360-01, -02, -03, -06, -08, and -09) were qualified with a “V” remark code because the laboratory method blank in the work group WG1429821 had an estimated PFNA concentration (E1.2 ng/L) that was nearly equal to values reported in the environmental samples. Perfluorohexanesulfonic acid (PFHxS) and PFOS were detected in the laboratory method blank associated with work group WG1432858. PFHxS concentration values for four environmental samples (L2048824-01, -02, -04, and -05) were qualified with a “V” remark code because the environmental sample concentrations were nearly four times the concentration detected in the laboratory method blank (E0.728 ng/L). The PFOS concentration values for the environmental samples in WG1432858 were greater than 10 times the concentration in the laboratory method blank and therefore were not qualified with a remark code but were flagged with value qualifier “v” in NWIS, indicating that PFOS was detected in the laboratory method blank. The PFOS concentration in the field blank in WG1432858 (L2048824-03) was also qualified with a “V” remark code because the field blank concentration was similar to the concentration in the laboratory method blank (E0.728 ng/L). The PFOS concentrations for the environmental samples in WG1432858 were greater than 10 times the concentration in the laboratory method blank and therefore were not qualified with a remark code but were flagged with value qualifier “v” in NWIS, indicating that PFOS was detected in the laboratory method blank.
Selected additional results were “V” qualified because the field blank associated with the environmental sample had one or more detections of PFAS. The PFOA concentration for environmental sample L2039415-24 (7.34 ng/L) was qualified with a “V” remark code because the associated field blank (L2039415-23) had a detection of PFOA at a concentration of 3.54 ng/L. PFOA, PFOS, perfluorodecanoate (PFDA), and perfluorononanoate (PFNA) were detected in the field blank associated with environmental sample L2048824-02. The “V” remark code was applied to the environmental results for PFDA and PFNA for sample L2048824-02 because the concentrations in sample L2048824-02 were within 10 times the concentrations in the field blank. The PFOA and PFOS concentrations for sample L2048824-02 were greater than 10 times the concentrations in the field blank and therefore were not qualified. For samples that were assigned value qualifiers, result-level comments were also added in the NWIS database to indicate that concentrations were associated with detections in field or laboratory blanks. The other detections in the field or laboratory blanks (perfluorotridecanoate [PFTrDA], perfluoroundecanoate [PFUnA], and 6:2 fluorotelomersulfonate [6:2 FTS]) were not associated with detections in the environmental samples, and therefore the associated environmental samples were not qualified with remark or qualifier codes.
Overall, the field and laboratory QC data indicate that the environmental data collected and reported are of known and definable quality and suitable to meet the objectives of the project. The analytical results provided by Alpha Analytical, Inc. included data qualifiers related to the method sensitivity and performance for each sample and substance analyzed. The USGS used those data qualifiers related to the method sensitivity and performance, combined with the distribution and frequency of contamination, bias, and random error measured in the QC samples analyzed for this project, to describe the quality of the data. The USGS has many metadata tools available to describe the quality of data; for this dataset, however, remark codes and value qualifier codes defined by NWIS were used to describe the quality of the results. The Alpha Analytical, Inc. sample labeling convention and data qualifiers with corresponding USGS remark and value qualifiers codes are described in appendix 1. Although selected results were qualified or remark codes were added on the basis of field or laboratory quality-assurance information, all data are published and available. The USGS recommends that data users review and consider the assigned remark codes and value qualifier codes when interpreting these data.
Summary
Water samples collected during three sampling rounds at 64 sites in 27 rivers and streams in Massachusetts were analyzed to determine the occurrence and concentrations of 24 per- and polyfluoroalkyl substances (PFAS). The samples were collected when the instantaneous flow of the rivers and streams were at base-flow conditions (flow less than the 25th percentile of annual daily mean flow) to minimize PFAS input or dilution from stormwater runoff and overland flow. The data collected show that measurable concentrations of PFAS were observed in all rivers and streams sampled. The number of PFAS detected in each sample ranged from a low of 1 substance, measured in samples from Wright Brook, to a high of 16 PFAS, measured in samples from the Shawsheen River. The PFAS detected most frequently—in 90 percent or more of the samples analyzed—included perfluorooctanoate (PFOA), perfluorooctanesulfonate (PFOS), perfluoroheptanoate (PFHpA), perfluoropentanoate (PFPeA), perfluorobutanoate (PFBA), and perfluorobutanesulfonate (PFBS).
Concentrations of individual PFAS ranged from estimated levels that were greater than the method detection limit and less than the reporting limit to 109 nanograms per liter (ng/L). The highest maximum concentrations reported were measured in samples from the North Nashua River, Shawsheen River, and Sawmill Brook. Concentrations typically increased from sampling sites upstream to downstream of the wastewater treatment facilities, although at some sites downstream concentrations decreased. At sampling sites associated with wastewater treatment facilities, more PFAS were detected and at higher concentrations than at sampling sites on rivers without wastewater treatment facilities.
Quality-control data demonstrated that concentrations of perfluorohexanoate (PFHxA) less than 5.13 ng/L may have been affected by a systematic positive bias in the analytical method. The positive bias reduced the ability to characterize low concentrations (less than 5.13 ng/L) of PFHxA. However, the median concentration of PFHxA was 10.7 ng/L and the maximum value 91 ng/L, indicating that more than 50 percent of the distribution of concentrations was high enough to overcome the potential systematic bias. All data are published and available and users are advised to review and consider the assigned remark and value qualifier codes when interpreting the data.
The data collected in this study provide information on PFAS occurrence and concentrations in Massachusetts rivers and streams that receive wastewater discharge from wastewater treatment and industrial facilities, and those that have no known or suspected sources of PFAS. This information can be used for watershed planning and wastewater discharge permitting in Massachusetts, particularly at facilities that discharge upstream from public water supplies. The results of the study will provide the Massachusetts Department of Environmental Protection with documentation of baseline water-quality conditions with respect to PFAS, and will help the U.S. Geological Survey assess sources, transport, and delivery of PFAS in rivers and streams on a nationwide basis.
Table 1.
Site number shown in figure 1, sampling site, and station information for water-quality-monitoring stations at selected rivers and streams in Massachusetts.| Site number (fig. 1) | Sampling site | Station number | Station name | Latitude (decimal degrees) | Longitude (decimal degrees) |
|---|---|---|---|---|---|
| 1 | Upstream | 01095862 | NASHUA RIVER NEAR MCPHERSON ROAD, SHIRLEY, MA | 42.555197 | -71.61100277 |
| 1 | Downstream | 01095920 | NASHUA RIVER NEAR AYER, MA | 42.5784239 | -71.60923487 |
| 2 | Other | 01362147 | WRIGHT BROOK NEAR MOUNT WASHINGTON, MA | 42.1068194 | -73.4825472 |
| 3 | Upstream | 423506071171401 | CONCORD R POLLAND ST | 42.585000 | -71.2872222 |
| 3 | Downstream | 01099000 | CONCORD RIVER AT LOWELL, MA | 42.6278694 | -71.2981156 |
| 4 | Upstream | 01109650 | BLACKSTONE RIVER RT 146 AT WORCESTER, MA | 42.2278528 | -71.78765278 |
| 4 | Downstream | 01109660 | BLACKSTONE RIVER NEAR MILLBURY, MA | 42.207872 | -71.78145948 |
| 5 | Upstream | 01107100 | TOWN RIVER AT BRIDGEWATER, MA | 41.9970454 | -70.9725425 |
| 5 | Downstream | 01107102 | TOWN RIVER AT HAYWARD ST, BRIDGEWATER, MA | 41.99753 | -70.953675 |
| 6 | Upstream | 01106438 | SALISBURY PLAIN R AT SARGENT'S WAY, BROCKTON, MA | 42.0536306 | -71.00980278 |
| 6 | Downstream | 01106444 | SALISBURY PLAIN R NR MATFIELD ST E BRIDGEWATER, MA | 42.0381222 | -70.9839972 |
| 7 | Upstream | 01103280 | CHARLES RIVER AT MEDWAY, MA | 42.1398197 | -71.3895032 |
| 7 | Downstream | 01103305 | CHARLES RIVER NEAR MILLIS, MA | 42.1331533 | -71.36228 |
| 8 | Other | 01177000 | CHICOPEE RIVER AT INDIAN ORCHARD, MA | 42.1606491 | -72.5139756 |
| 9 | Upstream | 01095505 | NASHUA RIVER 0.4 MI UPSTREAM RT 110 AT CLINTON, MA | 42.4291667 | -71.68027778 |
| 9 | Downstream | 01095506 | NASHUA RIVER AT ROUTE 110, CLINTON, MA | 42.4326944 | -71.6800583 |
| 10 | Other | 01168305 | COLD RIVER NEAR CHARLEMONT, MA | 42.6362806 | -72.93435 |
| 11 | Upstream | 01098880 | CONCORD RIVER NEAR LOWELL ROAD, CONCORD, MA | 42.4665361 | -71.35573889 |
| 11 | Downstream | 423033071185001 | CONCORD R RT225 CARLISLE-BEDFORD, MA | 42.5091667 | -71.31388889 |
| 12 | Other | 01170006 | DEERFIELD R, STILLWATER BR, AT WEST DEERFIELD, MA | 42.5267532 | -72.6325895 |
| 13 | Upstream | 01094445 | NORTH NASHUA R NR LANIDES LN, E. FITCHBURG, MA | 42.5495083 | -71.7508583 |
| 13 | Downstream | 01094450 | NORTH NASHUA RIVER AT NORTH LEOMINSTER, MA | 42.5423127 | -71.74590499 |
| 14 | Other | 01185500 | WEST BRANCH FARMINGTON RIVER NEAR NEW BOSTON, MA | 42.0788611 | -73.0728833 |
| 15 | Other | 01170150 | GREEN RIVER NEAR GREENFIELD, MA | 42.6470291 | -72.6203681 |
| 16 | Other | 01332500 | HOOSIC RIVER NEAR WILLIAMSTOWN, MA | 42.700359 | -73.1589939 |
| 17 | Other | 01331393 | HOOSIC RIVER NEAR GROVE STREET, ADAMS, MA | 42.600575 | -73.13815 |
| 18 | Other | 01197500 | HOUSATONIC RIVER NEAR GREAT BARRINGTON, MA | 42.2319167 | -73.3546667 |
| 19 | Upstream | 01096870 | ASSABET RIVER AT COX ST NEAR HUDSON, MA | 42.3998155 | -71.54589859 |
| 19 | Downstream | 01096876 | ASSEBET RIVER AT ROUTE 62, HUDSON, MA | 42.4044083 | -71.5259694 |
| 20 | Upstream | 01100500 | MERRIMACK RIVER AT LAWRENCE, MA | 42.7048333 | -71.15313889 |
| 20 | Downstream | 011006712 | MERRIMACK RIVER NEAR HAVERHILL, MA | 42.7704833 | -71.0869111 |
| 21 | Upstream | 01094455 | NORTH NASHUA RIVER AT LEOMINSTER, MA | 42.5259241 | -71.7367379 |
| 21 | Downstream | 01094465 | NORTH NASHUA RIVER AT MECHANIC ST, LEOMINSTER, MA | 42.5196167 | -71.72733889 |
| 22 | Upstream | 01100000 | MERRIMACK RIVER BL CONCORD RIVER AT LOWELL, MA | 42.6459246 | -71.2983937 |
| 22 | Downstream | 01100475 | MERRIMACK R AT ABE BASHARA BOAT HOUSE LAWRENCE, MA | 42.6929167 | -71.1766111 |
| 23 | Upstream | 01098704 | WARD BROOK NEAR MARLBOROUGH, MA | 42.3520386 | -71.4947859 |
| 23 | Downstream | 01098705 | SEWAGE BROOK NEAR MARLBOROUGH, MA | 42.3509275 | -71.4908968 |
| 24 | Upstream | 01096720 | ASSABET RIVER AT BOUNDARY ST. NR NORTHBOROUGH, MA | 42.3414824 | -71.6159002 |
| 24 | Downstream | 01096725 | ASSABET RIVER, DS MARLBOROUGH WWTP | 42.3452056 | -71.6142667 |
| 25 | Upstream | 01097000 | ASSABET RIVER AT MAYNARD, MA | 42.432038 | -71.4497848 |
| 25 | Downstream | 01097026 | ASSABET RIVER AT POWDERMILL RD AT ACTON, MA | 42.4406889 | -71.4291944 |
| 26 | Upstream | 01108050 | SAWMILL BROOK AT CONANT ST BRIDGEWATER, MA | 41.9588111 | -70.9587917 |
| 26 | Downstream | 01108055 | SAWMILL BROOK AT ROUTE 28, BRIDGEWATER, MA | 41.9489056 | -70.968575 |
| 27 | Upstream | 01097050 | ASSABET RIVER AT MAIN ST NEAR CONCORD, MA | 42.4564827 | -71.3900608 |
| 27 | Downstream | 01097390 | ASSABET RIVER AT RT 2 NEAR CONCORD, MA | 42.4656492 | -71.3917276 |
| 28 | Upstream | 01109043 | THREEMILE RIVER AT CRANE ST, TAUNTON, MA | 41.9467583 | -71.1604111 |
| 28 | Downstream | 01109048 | THREEMILE RIVER AT NORTON AVE, TAUNTON, MA | 41.9333028 | -71.1542667 |
| 29 | Upstream | 01107798 | NEMASKET R AT OLIVER MILL PARK, MIDDLEBOROUGH, MA | 41.9070083 | -70.91362778 |
| 29 | Downstream | 01107799 | NEMASKET RIVER AT PLYMOUTH ST, MIDDLEBOROUGH, MA | 41.9218778 | -70.9233611 |
| 30 | Upstream | 01103138 | CHARLES RIVER AT MILFORD SEWER PLANT, MILFORD, MA | 42.1199083 | -71.507000 |
| 30 | Downstream | 01103139 | CHARLES RIVER AT MELLEN STREET, MILFORD, MA | 42.11695 | -71.5013583 |
| 31 | Other | 01166630 | MILLERS RIVER AT BRIDGE STREET, MILLERS FALLS, MA | 42.5801861 | -72.4968611 |
| 32 | Upstream | 010965042 | NASHUA RIVER UPSTREAM, PEPPERELL, MA | 42.6729722 | -71.5631556 |
| 32 | Downstream | 010965043 | NASHUA RIVER DOWNSTREAM, PEPPERELL, MA | 42.6758556 | -71.55976389 |
| 33 | Downstream | 01197134 | HOUSATONIC RIVER AT NEW LENOX, MA | 42.3939745 | -73.2403829 |
| 34 | Other | 011006065 | SHAWSHEEN RIVER AT BRIDGE STREET NR TEWKSBURY, MA | 42.594675 | -71.19512222 |
| 35 | Other | 01094950 | STILLWATER RIVER AT WEST STERLING, MA | 42.4467579 | -71.818128 |
| 36 | Upstream | 01108414 | TAUNTON RIVER UPSTREAM, TAUNTON, MA | 41.8778806 | -71.09325 |
| 36 | Downstream | 01108415 | TAUNTON RIVER DOWNSTREAM, TAUNTON, MA | 41.8715611 | -71.1025556 |
| 37 | Other | 01173515 | WARE RIVER NEAR PALMER, MA | 42.2046194 | -72.3186111 |
| 38 | Upstream | 01096603 | ASSABET RIVER NEAR WESTBOROUGH, MA | 42.2795385 | -71.63812279 |
| 38 | Downstream | 421700071381901 | ASSABET RIVER DS FROM WESTBOROUGH WTP AT ROUTE 9 | 42.2833333 | -71.6386111 |
| 39 | Other | 01183610 | WESTFIELD RIVER AT BRIDGE ST AT NORTH AGAWAM, MA | 42.0994444 | -72.6363056 |
| 40 | Other | 01181008 | WESTFIELD RIVER AT HUNTINGTON, MA | 42.2256454 | -72.8706533 |
Table 2.
Sampling method and nearby U.S. Geological Survey (USGS) continuous streamgage used to determine flow conditions at sampling sites.[Sampling method: C, centroid, single vertical sample; L, left edge of river single sample; R, right edge of river single sample; EWI, equal-width incremental (10 samples collected from the river using a DH-95 and composited into a churn splitter); EWT, equal-width transect (10 samples collected from the river using a weighted-bottle sampler and composited into a churn splitter); L-C-R, left, center, right (3 to 5 samples composited into a churn splitter)]
| Site number (fig. 1) | USGS station number | USGS station name | Sampling method round 1 | Sampling method round 2 | Sampling method round 3 | Nearby continuous streamgage USGS station number | Nearby continuous streamgage USGS station name |
|---|---|---|---|---|---|---|---|
| 1 | 01095862 | NASHUA RIVER NEAR MCPHERSON ROAD, SHIRLEY, MA | L-C-R | L-C-R | L-C-R | 01096500 | NASHUA RIVER AT EAST PEPPERELL, MA |
| 1 | 01095920 | NASHUA RIVER NEAR AYER, MA | L | L | L | 01096500 | NASHUA RIVER AT EAST PEPPERELL, MA |
| 2 | 01362147 | WRIGHT BROOK NEAR MOUNT WASHINGTON, MA | C | C | C | 01198000 | GREEN RIVER NEAR GREAT BARRINGTON, MA |
| 3 | 423506071171401 | CONCORD R POLLAND ST | EWI | EWI | EWI | 01099500 | CONCORD R BELOW R MEADOW BROOK, AT LOWELL, MA |
| 3 | 01099000 | CONCORD RIVER AT LOWELL, MA | EWI | EWI | EWI | 01099500 | CONCORD R BELOW R MEADOW BROOK, AT LOWELL, MA |
| 4 | 01109650 | BLACKSTONE RIVER RT 146 AT WORCESTER, MA | C | C | L-C-R | 01109730 | BLACKSTONE RIVER, W. MAIN ST., AT MILLBURY, MA |
| 4 | 01109660 | BLACKSTONE RIVER NEAR MILLBURY, MA | EWI | EWI | EWI | 01109730 | BLACKSTONE RIVER, W. MAIN ST., AT MILLBURY, MA |
| 5 | 01107100 | TOWN RIVER AT BRIDGEWATER, MA | C | C | C | 01105600 | OLD SWAMP RIVER NEAR SOUTH WEYMOUTH, MA |
| 5 | 01107102 | TOWN RIVER AT HAYWARD ST, BRIDGEWATER, MA | C | C | C | 01105600 | OLD SWAMP RIVER NEAR SOUTH WEYMOUTH, MA |
| 6 | 01106438 | SALISBURY PLAIN R AT SARGENT'S WAY, BROCKTON, MA | C | C | C | 01105600 | OLD SWAMP RIVER NEAR SOUTH WEYMOUTH, MA |
| 6 | 01106444 | SALISBURY PLAIN R NR MATFIELD ST E BRIDGEWATER, MA | C | C | C | 01105600 | OLD SWAMP RIVER NEAR SOUTH WEYMOUTH, MA |
| 7 | 01103280 | CHARLES RIVER AT MEDWAY, MA | C | C | L-C-R | 01103280 | CHARLES RIVER AT MEDWAY, MA |
| 7 | 01103305 | CHARLES RIVER NEAR MILLIS, MA | L-C-R | C | L-C-R | 01103280 | CHARLES RIVER AT MEDWAY, MA |
| 8 | 01177000 | CHICOPEE RIVER AT INDIAN ORCHARD, MA | EWT | EWT | EWT | 01177000 | CHICOPEE RIVER AT INDIAN ORCHARD, MA |
| 9 | 01095505 | NASHUA RIVER 0.4 MI UPSTREAM RT 110 AT CLINTON, MA | C | C | C | 01094500 | NORTH NASHUA RIVER NEAR LEOMINSTER, MA |
| 9 | 01095506 | NASHUA RIVER AT ROUTE 110, CLINTON, MA | C | C | C | 01094500 | NORTH NASHUA RIVER NEAR LEOMINSTER, MA |
| 10 | 01168305 | COLD RIVER NEAR CHARLEMONT, MA | C | C | C | 01168250 | COLD RIVER AT FLORIDA, MA |
| 11 | 01098880 | CONCORD RIVER NEAR LOWELL ROAD, CONCORD, MA | EWI | EWI | EWI | 01099500 | CONCORD R BELOW R MEADOW BROOK, AT LOWELL, MA |
| 11 | 423033071185001 | CONCORD R RT225 CARLISLE-BEDFORD, MA | EWI | EWI | EWI | 01099500 | CONCORD R BELOW R MEADOW BROOK, AT LOWELL, MA |
| 12 | 01170006 | DEERFIELD R, STILLWATER BR, AT WEST DEERFIELD, MA | EWT | EWT | EWT | 01168500 | DEERFIELD RIVER AT CHARLEMONT, MA |
| 13 | 01094445 | NORTH NASHUA R NR LANIDES LN, E. FITCHBURG, MA | C | C | C | 01094400 | NORTH NASHUA RIVER AT FITCHBURG, MA |
| 13 | 01094450 | NORTH NASHUA RIVER AT NORTH LEOMINSTER, MA | EWI | EWI | EWI | 01094400 | NORTH NASHUA RIVER AT FITCHBURG, MA |
| 14 | 01185500 | WEST BRANCH FARMINGTON RIVER NEAR NEW BOSTON, MA | L-C-R | C | L-C-R | 01185500 | WEST BRANCH FARMINGTON RIVER NEAR NEW BOSTON, MA |
| 15 | 01170150 | GREEN RIVER NEAR GREENFIELD, MA | C | C | C | 01170100 | GREEN RIVER NEAR COLRAIN, MA |
| 16 | 01332500 | HOOSIC RIVER NEAR WILLIAMSTOWN, MA | C | C | C | 01331500 | HOOSIC RIVER AT ADAMS, MA |
| 17 | 01331393 | HOOSIC RIVER NEAR GROVE STREET, ADAMS, MA | C | C | C | 01331500 | HOOSIC RIVER AT ADAMS, MA |
| 18 | 01197500 | HOUSATONIC RIVER NEAR GREAT BARRINGTON, MA | EWI | EWI | EWI | 01197500 | HOUSATONIC RIVER NEAR GREAT BARRINGTON, MA |
| 19 | 01096870 | ASSABET RIVER AT COX ST NEAR HUDSON, MA | L-C-R | L-C-R | L-C-R | 01097000 | ASSABET RIVER AT MAYNARD, MA |
| 19 | 01096876 | ASSEBET RIVER AT ROUTE 62, HUDSON, MA | L-C-R | L-C-R | L-C-R | 01097000 | ASSABET RIVER AT MAYNARD, MA |
| 20 | 01100500 | MERRIMACK RIVER AT LAWRENCE, MA | EWI | EWI | EWI | 01100000 | MERRIMACK RIVER BL CONCORD RIVER AT LOWELL, MA |
| 20 | 011006712 | MERRIMACK RIVER NEAR HAVERHILL, MA | EWI | L-C-R | EWI | 01100000 | MERRIMACK RIVER BL CONCORD RIVER AT LOWELL, MA |
| 21 | 01094455 | NORTH NASHUA RIVER AT LEOMINSTER, MA | C | C | C | 01094500 | NORTH NASHUA RIVER NEAR LEOMINSTER, MA |
| 21 | 01094465 | NORTH NASHUA RIVER AT MECHANIC ST, LEOMINSTER, MA | L-C-R | L-C-R | L-C-R | 01094500 | NORTH NASHUA RIVER NEAR LEOMINSTER, MA |
| 22 | 01100000 | MERRIMACK RIVER BL CONCORD RIVER AT LOWELL, MA | EWI | EWI | EWI | 01100000 | MERRIMACK RIVER BL CONCORD RIVER AT LOWELL, MA |
| 22 | 01100475 | MERRIMACK R AT ABE BASHARA BOAT HOUSE LAWRENCE, MA | R | R | R | 01100000 | MERRIMACK RIVER BL CONCORD RIVER AT LOWELL, MA |
| 23 | 01098704 | WARD BROOK NEAR MARLBOROUGH, MA | C | C | C | No nearby continuous streamgage | No nearby continuous streamgage |
| 23 | 01098705 | SEWAGE BROOK NEAR MARLBOROUGH, MA | C | C | C | No nearby continuous streamgage | No nearby continuous streamgage |
| 24 | 01096720 | ASSABET RIVER AT BOUNDARY ST. NR NORTHBOROUGH, MA | C | C | C | 01097000 | ASSABET RIVER AT MAYNARD, MA |
| 24 | 01096725 | ASSABET RIVER, DS MARLBOROUGH WWTP | C | C | C | 01097000 | ASSABET RIVER AT MAYNARD, MA |
| 25 | 01097000 | ASSABET RIVER AT MAYNARD, MA | L-C-R | L-C-R | L-C-R | 01097000 | ASSABET RIVER AT MAYNARD, MA |
| 25 | 01097026 | ASSABET RIVER AT POWDERMILL RD AT ACTON, MA | L-C-R | L-C-R | L-C-R | 01097000 | ASSABET RIVER AT MAYNARD, MA |
| 26 | 01108050 | SAWMILL BROOK AT CONANT ST BRIDGEWATER, MA | C | C | C | 01108000 | TAUNTON RIVER NEAR BRIDGEWATER, MA |
| 26 | 01108055 | SAWMILL BROOK AT ROUTE 28, BRIDGEWATER, MA | C | C | C | 01108000 | TAUNTON RIVER NEAR BRIDGEWATER, MA |
| 27 | 01097050 | ASSABET RIVER AT MAIN ST NEAR CONCORD, MA | L-C-R | L-C-R | EWI | 01097000 | ASSABET RIVER AT MAYNARD, MA |
| 27 | 01097390 | ASSABET RIVER AT RT 2 NEAR CONCORD, MA | L | L | L | 01097000 | ASSABET RIVER AT MAYNARD, MA |
| 28 | 01109043 | THREEMILE RIVER AT CRANE ST, TAUNTON, MA | C | C | C | 01109000 | WADING RIVER NEAR NORTON, MA |
| 28 | 01109048 | THREEMILE RIVER AT NORTON AVE, TAUNTON, MA | L-C-R | C | C | 01109000 | WADING RIVER NEAR NORTON, MA |
| 29 | 01107798 | NEMASKET R AT OLIVER MILL PARK, MIDDLEBOROUGH, MA | C | C | C | 01108000 | TAUNTON RIVER NEAR BRIDGEWATER, MA |
| 29 | 01107799 | NEMASKET RIVER AT PLYMOUTH ST, MIDDLEBOROUGH, MA | C | C | C | 01108000 | TAUNTON RIVER NEAR BRIDGEWATER, MA |
| 30 | 01103138 | CHARLES RIVER AT MILFORD SEWER PLANT, MILFORD, MA | C | C | C | 01103280 | CHARLES RIVER AT MEDWAY, MA |
| 30 | 01103139 | CHARLES RIVER AT MELLEN STREET, MILFORD, MA | C | C | C | 01103280 | CHARLES RIVER AT MEDWAY, MA |
| 31 | 01166630 | MILLERS RIVER AT BRIDGE STREET, MILLERS FALLS, MA | L-C-R | L-C-R | L-C-R | 01166500 | MILLERS RIVER AT ERVING, MA |
| 32 | 010965042 | NASHUA RIVER UPSTREAM, PEPPERELL, MA | EWI | EWI | EWI | 01096500 | NASHUA RIVER AT EAST PEPPERELL, MA |
| 32 | 10965043 | NASHUA RIVER DOWNSTREAM, PEPPERELL, MA | EWI | EWI | EWI | 01096500 | NASHUA RIVER AT EAST PEPPERELL, MA |
| 33 | 01197134 | HOUSATONIC RIVER AT NEW LENOX, MA | EWI | EWI | EWI | 01197000 | EAST BRANCH HOUSATONIC RIVER AT COLTSVILLE, MA |
| 34 | 011006065 | SHAWSHEEN RIVER AT BRIDGE STREET NR TEWKSBURY, MA | L-C-R | L-C-R | C | 01100600 | SHAWSHEEN RIVER NEAR WILMINGTON, MA |
| 35 | 01094950 | STILLWATER RIVER AT WEST STERLING, MA | C | C | C | 01095220 | STILLWATER RIVER NEAR STERLING, MA |
| 36 | 01108414 | TAUNTON RIVER UPSTREAM, TAUNTON, MA | L-C-R | L-C-R | L-C-R | 01108000 | TAUNTON RIVER NEAR BRIDGEWATER, MA |
| 36 | 01108415 | TAUNTON RIVER DOWNSTREAM, TAUNTON, MA | L-C-R | L-C-R | L-C-R | 01108000 | TAUNTON RIVER NEAR BRIDGEWATER, MA |
| 37 | 01173515 | WARE RIVER NEAR PALMER, MA | EWI | EWI | EWI | 01173500 | WARE RIVER AT GIBBS CROSSING, MA |
| 38 | 01096603 | ASSABET RIVER NEAR WESTBOROUGH, MA | C | C | C | 01097000 | ASSABET RIVER AT MAYNARD, MA |
| 38 | 421700071381901 | ASSABET RIVER DS FROM WESTBOROUGH WTP AT ROUTE 9 | C | C | C | 01097000 | ASSABET RIVER AT MAYNARD, MA |
| 39 | 01183610 | WESTFIELD RIVER AT BRIDGE ST AT NORTH AGAWAM, MA | L-C-R | L-C-R | L-C-R | 01183500 | WESTFIELD RIVER NEAR WESTFIELD, MA |
| 40 | 01181008 | WESTFIELD RIVER AT HUNTINGTON, MA | EWI | L-C-R | EWI | 01181000 | WEST BRANCH WESTFIELD RIVER AT HUNTINGTON, MA |
Table 3.
Information on analyses for per- and polyfluoroalkyl substances in samples collected from rivers and streams in Massachusetts, August to November 2020.[Abbreviations of analytes are shown in parenthesis after analyte name. USGS, U.S. Geological Survey; NWIS, National Water Information System; EIS, extracted internal standard (also known as surrogate); wu, water unfiltered; LM105, mass-dependent determination of selected alkyl substances by solid phase extraction and liquid perfluorinated chromatography/tandem mass spectrometry isotope dilution; MA-AALM, Massachusetts–Alpha Analytical, Inc., laboratory, Mansfield; NA, not applicable]
References Cited
Hu, X.C., Andrews, D.Q., Lindstrom, A.B., Bruton, T.A., Schaider, L.A., Grandjean, P., Lohmann, R., Carignan, C.C., Blum, A., Balan, S.A., Higgins, C.P., and Sunderland, E.M., 2016, Detection of poly- and perfluoroalkyl substances (PFASs) in U.S. drinking water linked to industrial sites, military fire training areas, and wastewater treatment plants: Environmental Science & Technology Letters, v. 3, no. 10, p. 344–350, accessed March 3, 2022, at https://pubs.acs.org/toc/estlcu/3/10.
Mueller, D.K., Schertz, T.L., Martin, J.D., and Sandstrom, M.W., 2015, Design, analysis, and interpretation of field quality-control data for water-sampling projects: U.S. Geological Survey Techniques and Methods, book 4, chap. C4, 54 p., accessed December 7, 2021, at https://doi.org/10.3133/tm4C4.
Rantz, S.E., and others, 1982a, Measurement of stage and discharge, v. 1 of Measurement and computation of streamflow: U.S. Geological Survey Water-Supply Paper 2175, 284 p. [Also available at https://doi.org/10.3133/wsp2175.]
Rantz, S.E., and others, 1982b, Computation of discharge, v. 2 of Measurement and computation of streamflow: U.S. Geological Survey Water-Supply Paper 2175, p. 235–631. [Also available at https://doi.org/10.3133/wsp2175.]
Savoie, J.G., and Argue, D.M., 2022, Environmental and quality-control data for per- and polyfluoroalkyl substances (PFAS) measured in selected rivers and streams in Massachusetts, 2020 (ver. 2.0, July 2023): U.S. Geological Survey data release, https://doi.org/10.5066/P967NOOZ.
Sunderland, E.M., Hu, X.C., Dassuncao, C., Tokranov, A.K., Wagner, C.C., and Allen, J.G., 2018, A review of the pathways of human exposure to poly- and perfluoroalkyl substances (PFASs) and present understanding of health effects: Journal of Exposure Science & Environmental Epidemiology, v. 29, no. 2, p. 131–147, accessed June 28, 2021, at https://doi.org/10.1038/s41370-018-0094-1.
U.S. Environmental Protection Agency, 2022, Risk management for per- and polyfluoroalkyl substances (PFAS) under TSCA: U.S. Environmental Protection Agency web page, accessed April 29, 2022, at https://www.epa.gov/assessing-and-managing-chemicals-under-tsca/risk-management-and-polyfluoroalkyl-substances-pfas.
U.S. Geological Survey [USGS], [variously dated], National field manual for the collection of water-quality data, section A of Handbooks for water-resources investigations: U.S. Geological Survey Techniques of Water-Resources Investigations, book 9, 10 chap. (A0–A10), accessed September 3, 2021, at https://www.usgs.gov/mission-areas/water-resources/science/national-field-manual-collection-water-quality-data-nfm?qt-science_center_objects=0#qt-scie nce_center_objects.
U.S. Geological Survey [USGS], 2020, USGS water-quality data for the Nation: U.S. Geological Survey National Water Information System database, accessed February 28, 2022, at https://waterdata.usgs.gov/nwis/.
Wang, Z., DeWitt, J.C., Higgins, C.P., and Cousins, I.T., 2017, A never-ending story of per- and polyfluoroalkyl substances (PFASs)?: Environmental Science & Technology, v. 51, no. 5, p. 2508–2518, accessed June 29, 2021, at https://pubs.acs.org/doi/pdf/10.1021/acs.est.6b04806.
Appendix 1. Alpha Analytical, Inc. Sample Processing Information and Data Qualifiers With Corresponding U.S. Geological Survey Remark and Value Qualifier Codes
Supplemental Information
Concentrations of chemical constituents in water are given in nanograms per liter (ng/L).
Abbreviations
MassDEP
Massachusetts Department of Environmental Protection
MDL
method detection limit
NWIS
National Water Information System
PFAS
per- and polyfluoroalkyl substances
PFBA
perfluorobutanoate
PFBS
perfluorobutanesulfonate
PFDA
perfluorodecanoate
PFHpA
perfluoroheptanoate
PFHxA
perfluorohexanoate
PFHxS
perfluorohexanesulfonate
PFNA
perfluorononanoate
PFOA
perfluorooctanoate
PFOS
perfluorooctanesulfonate
PFPeA
perfluoropentanoate
RL
reporting limit
QC
quality control
USGS
U.S. Geological Survey
For more information about this report, contact:
Director, New England Water Science Center
U.S. Geological Survey
10 Bearfoot Road
Northborough, MA 01532
dc_nweng@usgs.gov
or visit our website at
https://www.usgs.gov/centers/new-england-water
Publishing support provided by the Pembroke Publishing Service Center
Disclaimers
Any use of trade, firm, or product names is for descriptive purposes only and does not imply endorsement by the U.S. Government.
Although this information product, for the most part, is in the public domain, it also may contain copyrighted materials as noted in the text. Permission to reproduce copyrighted items must be secured from the copyright owner.
Suggested Citation
Savoie, J.G., and Argue, D.M., 2022, Concentrations of per- and polyfluoroalkyl substances (PFAS) in selected rivers and streams in Massachusetts, 2020 (ver. 2.0, October 2023): U.S. Geological Survey Data Report 1160, 18 p., https://doi.org/10.3133/dr1160.
ISSN: 2771-9448 (online)
Study Area
| Publication type | Report |
|---|---|
| Publication Subtype | USGS Numbered Series |
| Title | Concentrations of per- and polyfluoroalkyl substances (PFAS) in selected rivers and streams in Massachusetts, 2020 |
| Series title | Data Report |
| Series number | 1160 |
| DOI | 10.3133/dr1160 |
| Edition | Version 1.0: July 20, 2022; Version 1.1: February 17, 2023; Version 2.0: October 2, 2023 |
| Publication Date | July 20, 2022 |
| Year Published | 2022 |
| Language | English |
| Publisher | U.S. Geological Survey |
| Publisher location | Reston, VA |
| Contributing office(s) | New England Water Science Center |
| Description | Report: vi, 18 p.; Data Release |
| Country | United States |
| State | Massachusetts |
| Online Only (Y/N) | Y |
| Additional Online Files (Y/N) | N |