

Critical Minerals in Orogenic (Gold) and Coeur d’Alene-Type Mineral Systems of the United States
Links
- Document: Report (3.71 MB pdf) , HTML , XML
- Data Release: USGS data release - National Geochemical Database on Ore Deposits: New data featuring fusion digestion analytical methods
- NGMDB Index Page: National Geologic Map Database Index Page (html)
- Download citation as: RIS | Dublin Core
Abstract
Orogenic and Coeur d’Alene-type mineral systems are produced by metamorphic devolatilization of thick volcanic or siliciclastic sedimentary rock sequences and the focused flow of hydrothermal fluids upwards along crustal-scale faults. Most orogenic systems are found along the Cordilleran orogen, stretching from California northwards into Alaska, whereas most Coeur d’Alene-type systems occur in the Proterozoic Belt Basin in Idaho and Montana. Although the deposit types in these systems are exploited for precious and base metals, potential exists for the production of critical minerals necessary for current (2025) societal needs in the United States. Publicly available geochemical data compiled for these mineral systems, coupled with mineralogical characteristics, indicate that several critical minerals could potentially be recovered from unmined resources and processed mine waste: arsenic, antimony, tellurium, cobalt, and tungsten from orogenic gold deposits and zinc, antimony, arsenic, and manganese from Coeur d’Alene-type systems. These critical minerals reside primarily in arsenopyrite (arsenic), scheelite (tungsten), siderite (manganese), sphalerite (zinc), tetrahedrite (antimony and arsenic), stibnite (antimony), and telluride (tellurium) minerals.
Introduction
Meeting the growing demand for commodities used in today’s (2025) advanced technologies is a challenge for the global economy. Critical minerals are commodities (typically elements, but also compounds) deemed vital to the economic or national security of individual countries, and many are vulnerable to supply disruption (U.S. Department of the Interior, 2017; U.S. Department of Energy, 2021; U.S. Geological Survey [USGS], 2022a).
Most critical minerals are not the principal commodities produced from ore deposits. Rather, they are typically extracted as byproducts of principal commodity production (Nassar and others, 2015). The endowment of critical mineral byproducts in ore deposits can be quantified if the tonnage, grade, and concentration of the principal commodities and critical minerals have been determined in a representative set of ore samples (for example, Werner and others, 2017). Unfortunately, geochemical data on the concentrations of critical minerals in ore are commonly lacking, are too few to be representative, or have not been compiled from previous studies. Therefore, the USGS Systems Approach to Critical Minerals Inventory, Research, and Assessment Project set out to fill this data gap by submitting ore samples from dozens of ore deposits for analysis of more than 60 elements, gathering legacy multielement geochemical data on ore samples from previous studies, and publishing the data (Granitto and others, 2020, 2021, 2025).
Analyses from individual deposits in the resulting databases (Granitto and others, 2020, 2021, 2025) were used to calculate critical mineral–principal commodity mass ratios, which can be multiplied by the tonnes of the principal commodity to calculate the approximate tonnes of a critical mineral in a deposit. Critical mineral grades can also be calculated from principal commodity grades using a similar method. The same calculation can also be extrapolated from individual deposits and applied to models for mineral deposit types. However, the quantity of geochemical data (Granitto and others, 2020, 2021, 2025) upon which these critical mineral tonnage and grade calculations are based is generally insufficient to be considered representative, so the endowments of critical minerals obtained are simply rough estimates with unquantified uncertainties. Nevertheless, these estimates provide an indication of which deposits and deposit types are likely to harbor significant quantities of critical minerals that could potentially be recovered, which may prompt economic assessments and development of metallurgical methods for their recovery.
Purpose and Scope
Throughout the last several years, the U.S. Government has taken several important steps to identify and ensure the supply of critical minerals. In 2017, the President issued Executive Order 13817 titled “A Federal Strategy to Ensure Secure and Reliable Supplies of Critical Minerals.” The Executive Order directed the USGS to develop a plan to improve the Nation’s understanding of domestic critical mineral resources. To implement Executive Order 13817, the Secretary of the Interior issued Secretarial Order 3359 titled “Critical Mineral Independence and Security.” In response, the USGS National Minerals Information Center identified the following list of 35 critical minerals with a high risk for supply disruption: aluminum (bauxite), antimony, arsenic, barite (BaSO4), beryllium, bismuth, cesium, chromium, cobalt, fluorspar (CaF2), gallium, germanium, graphite (natural), hafnium, helium, indium, lithium, magnesium, manganese, niobium, platinum group metals, potash (potassium-bearing compounds), rare earth elements group, rhenium, rubidium, scandium, strontium, tantalum, tellurium, tin, titanium, tungsten, uranium, vanadium, and zirconium (Fortier and others, 2018).
In 2018, the U.S. Congress allocated funds to the USGS Mineral Resources Program for the Earth Mapping Resources Initiative to generate topographic, geologic, geochemical, and geophysical maps and data that are needed to increase the inventory of domestic critical minerals (Day, 2019). The USGS Mineral Resources Program project titled “Systems Approach to Critical Minerals Inventory, Research, and Assessment Project” began on October 1, 2018, and is one of several projects that were designed to advance knowledge of critical minerals, including their abundance in the Nation’s ore deposits and mine waste, their sources, the processes that concentrate them in mineral systems, and how to assess their potential in known mining districts and frontier areas.
In 2020, the President determined that the undue reliance of the United States on critical mineral imports, in processed or unprocessed form, constitutes an unusual and extraordinary threat. As a result, the President declared a national emergency and issued Executive Order 13953 titled “Addressing the Threat to the Domestic Supply Chain From Reliance on Critical Minerals From Foreign Adversaries and Supporting the Domestic Mining and Processing Industries”. The 2020 Executive Order directed the U.S. Department of the Interior (which includes the USGS) to investigate the Nation’s undue reliance on critical mineral imports and to provide recommendations for executive action. On January 15, 2021, the U.S. Department of Energy announced the establishment of a Division of Minerals Sustainability to enable the ongoing transformation of the U.S. energy system and help secure a U.S. critical minerals supply chain (U.S. Department of Energy, 2021).
On May 7, 2021, as required by Section 7002 (“Mineral Security”) of Title VII (“Critical Minerals”) of the Energy Act of 2020 (Public Law 116–260, 134 Stat. 2419), the USGS National Minerals Information Center published an updated evaluation on the methodology used to evaluate mineral criticality and a revised draft list of critical minerals (Nassar and Fortier, 2021). Most recently, on February 22, 2022, a final list of 50 critical minerals was released after an extensive multiagency assessment and public comments (aluminum, antimony, arsenic, barite, beryllium, bismuth, cerium, cesium, chromium, cobalt, dysprosium, erbium, europium, fluorspar, gadolinium, gallium, germanium, graphite, hafnium, holmium, indium, iridium, lanthanum, lithium, lutetium, magnesium, manganese, neodymium, nickel, niobium, palladium, platinum, praseodymium, rhodium, rubidium, ruthenium, samarium, scandium, tantalum, tellurium, terbium, thulium, tin, titanium, tungsten, vanadium, ytterbium, yttrium, zinc, and zirconium; USGS, 2022a). This report addresses the President’s and Secretary of the Interior’s orders by filling the knowledge gap on the abundance of critical minerals in orogenic and Coeur d’Alene-type mineral systems, particularly for orogenic gold and Coeur d’Alene-type polymetallic sulfide and antimony deposits. Geochemical data on ore and altered wall rock are used with information on production from and resources in each deposit type to estimate the amount of critical minerals present in processed mine waste resulting from previous mining activities and unmined resources. This report also discusses resources that could potentially be recovered in the future.
Background—Mineral Systems and Ore Deposits
Ore deposits are generated by mineral systems (for example, orogenic and Coeur d’Alene-type). Mineral systems operate in response to geodynamics, and sometimes climatic conditions, and generate one or more deposit types that are genetically related to one another (for example, Hofstra and Kreiner, 2020, and references therein). Metamorphic shear zone hydrothermal processes can produce orogenic and Coeur d’Alene-type mineral systems. Orogenic mineral systems can generate orogenic gold, orogenic antimony, orogenic mercury, and orogenic graphite deposits, of which orogenic gold is the most economically significant and likely to produce a mine. Coeur d’Alene-type mineral systems produce Coeur d’Alene-type polymetallic sulfide, antimony, and uranium deposits. By comparing the abundance of critical minerals in each deposit type in a system, we can learn where specific critical minerals are concentrated. This systems approach can, therefore, aid exploration and assessments of critical minerals in the United States and may eventually help mitigate the reliance on imports from foreign sources.
Occurrence of Orogenic and Coeur d’Alene-Type Mineral Systems
Both orogenic and Coeur d’Alene-type mineral systems are typically generated along dilatant structures during exhumation and dewatering of crustal metamorphic zones (Hofstra and Kreiner, 2020, and references therein). However, orogenic mineral systems occur in more reduced and sulfidic metamorphic zones that locally contain volcanogenic massive sulfide deposits and generate gold, antimony, mercury, and graphite deposits. Coeur d’Alene-type mineral systems occur in more oxidized metamorphic zones that locally contain basin brine path zinc-lead and copper deposits and generate polymetallic sulfide, antimony, and uranium deposits (Hofstra and Kreiner, 2020, and references therein).
Orogenic mineral systems have also been referred to as “orogenic gold systems,” “deformation and metamorphism mineral systems,” and “metamorphic-hydrothermal mineral systems.” Orogenic gold deposits represent one of the most important lode sources for gold in the world (Goldfarb and others, 2001; Frimmel, 2008). In the United States, most orogenic gold deposits are located within accreted terranes of the western cordillera of North America (fig. 1). The highest concentration of orogenic gold deposits is in Alaska, California, and Oregon (table 1), but deposits are also in Alabama, Arizona, Georgia, Idaho, Michigan, and South Dakota (in the Homestake mine). Low-sulfide gold-quartz veins in North Carolina, Virginia, and Wyoming may also be orogenic gold deposits, but further studies are needed to confirm their classification.
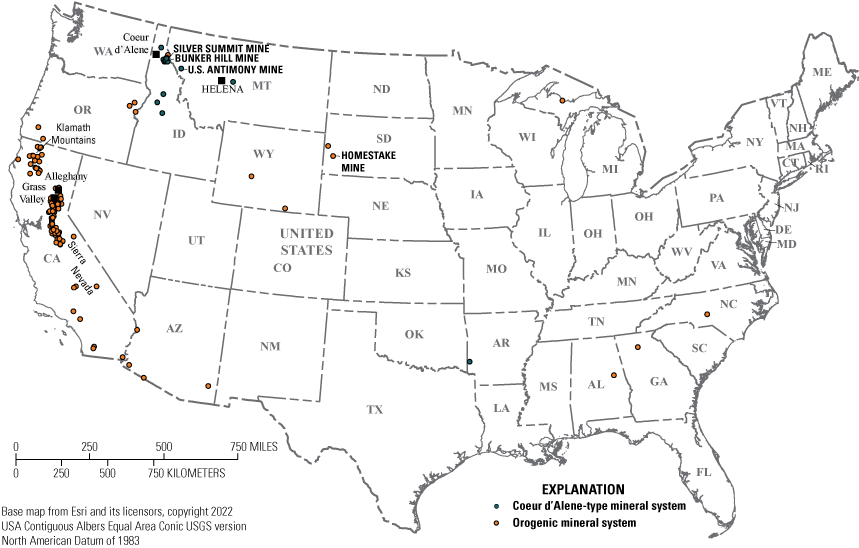
Map showing the locations of orogenic and Coeur d’Alene-type mineral systems in the continental United States.
Table 1.
Examples of orogenic gold (Au) deposits in the United States.[Modified from Long and others (1998), and references therein. —, no data; Unk, unknown; W.Y.O.D., Work Your Own Diggings; >, greater than; ≈, almost equal to. Abbreviations of U.S. States as follows: Ala., Alabama; Ariz., Arizona; Calif., California; Ga., Georgia; Mich., Michigan; N.C., North Carolina; Oreg., Oregon; S. Dak., South Dakota; Wyo., Wyoming]
The acronym “TMC” is not defined in Long and others (1998), and references therein.
The abundant placer gold that fueled the California gold rush from 1848 to 1855 was derived from large, eroded orogenic gold deposits. Orogenic gold deposits were commonly identified as mesothermal or hypothermal gold deposits in the first half of the 20th century, emphasizing the inferred depth and temperature of deposit formation (Lindgren, 1933). More recently, orogenic gold deposits have been called low-sulfide gold-quartz veins for Phanerozoic examples and Homestake gold deposits for Phanerozoic to Archean types (Cox and Singer, 1986). Some have been called turbidite-hosted gold deposits (Keppie and others, 1986) or characterized by their location, such as Mother Lode gold (not shown in fig. 1; Goldfarb and others, 2005).
Coeur d’Alene-type polymetallic sulfide deposits are important sources of silver, lead, and zinc in the United States. The Coeur d’Alene-type mineral systems are named after the Coeur d’Alene district in Idaho and Montana, which is one of the largest silver producers in the world (Long, 1998b). These systems are also referred to as “mesothermal base and precious metal systems” (Harrison and others, 1986), “silver-lead-zinc veins in clastic metasedimentary terranes” (Beaudoin and Sangster, 1992), and “orogenic base-metal systems” (Skirrow and others, 2013). Although Coeur d’Alene-type mineral systems concentrate different commodities, they share broad geometric similarities with large kilometer-scale ore shoots.
In the United States, Coeur d’Alene-type mineral systems are largely in deformed and faulted metasedimentary rocks of the Proterozoic Belt Basin of Idaho and western Montana (Leach and others, 1998), the Paleozoic Arkoma basin in southwest Arkansas (not shown in fig. 1; Howard, 1979), and the Spruce Creek sequence in the Katishna Hills at Quigley Ridge in Alaska (not shown in fig. 1; Bundtzen, 1981; fig. 1; table 2).
Table 2.
Examples of Coeur d'Alene-type deposits in the United States.[Modified from Long and others (1998), and references therein, Hofstra and others (2013), and Howard (1979). Ark., Arkansas; lbs, pounds; Mont., Montana; Neg, little or no production; Unk, unknown]
| Deposit Name | State | Longitude | Latitude | Past production tonnage (short tons) | Troy ounces of silver produced | Pounds of zinc produced | Other production | Reference |
|---|---|---|---|---|---|---|---|---|
| Quigley Ridge | Alaska | –150.947 | 63.543 | 725 | 117,305 | Neg | — | Long and others, 1998 |
| Antimony district | Ark. | –94.235 | 34.185 | Unk | Neg | Neg | 5,400 short tons antimony ore | Howard, 1979 |
| Atlas | Idaho | –115.776 | 47.466 | Unk | Unk | Unk | — | Long and others, 1998 |
| Bunker Hill—Last Chance | Idaho | –116.138 | 47.536 | 42,739,696 | 140,632,566 | 2,344,064,888 | Cadmium, antimony, barite, cobalt | Long and others, 1998 |
| Caledonia | Idaho | –116.168 | 47.524 | 263,182 | 8,092,307 | Neg | — | Long and others, 1998 |
| Coeur | Idaho | –115.992 | 47.489 | 2,476,692 | 40,259,304 | 474,912 | — | Long and others, 1998 |
| Conjecture | Idaho | –116.429 | 47.916 | Unk | Unk | Unk | — | Long and others, 1998 |
| Crescent | Idaho | –116.073 | 47.506 | 1,202,866 | 26,628,367 | 657,477 | Antimony | Long and others, 1998 |
| Dayrock | Idaho | –115.9 | 47.512 | 1,276,488 | 6,526,992 | 7,762,003 | — | Long and others, 1998 |
| Galena | Idaho | –115.965 | 47.477 | 6,287,684 | 137,169,731 | 3,851,306 | — | Long and others, 1998 |
| Gold Hunter | Idaho | –115.785 | 47.472 | 3,260,750 | 9,955,082 | 1,144,318 | — | Long and others, 1998 |
| Hecla | Idaho | –115.814 | 47.52 | 7,686,967 | 40,788,931 | 73,824,278 | — | Long and others, 1998 |
| Helena-Frisco | Idaho | –115.85 | 47.51 | 2,676,379 | 6,131,065 | 174,966,741 | — | Long and others, 1998 |
| Hercules | Idaho | –115.808 | 47.543 | 3,519,592 | 29,952,537 | 9,616,058 | — | Long and others, 1998 |
| Idora | Idaho | –115.86 | 47.566 | Unk | Unk | Unk | — | Long and others, 1998 |
| Jack Waite | Idaho | –115.744 | 48 | 693,149 | 641,863 | 20,424,000 | — | Long and others, 1998 |
| Mont. | ||||||||
| Last Chance | Idaho | –116.1486 | 47.51694 | Unk | Unk | Unk | — | Long and others, 1998 |
| Little Pittsburgh | Idaho | –116.2 | 47.485 | Unk | Unk | Unk | — | Long and others, 1998 |
| Lucky Friday | Idaho | –115.78 | 47.471 | 6,653,699 | 104,266,200 | 169,088,000 | — | Long and others, 1998 |
| Mineral Point | Idaho | –116.006 | 47.489 | 440,779 | 5,859,581 | Neg | — | Long and others, 1998 |
| Monitor (Interstate-Callahan) | Idaho | –115.887 | 47.544 | 3,708,030 | 4,210,670 | 401,256,743 | — | Long and others, 1998 |
| Murray district | Idaho | –115.834 | 47.617 | Unk | Unk | Unk | Gold | Long and others, 1998 |
| Nabob | Idaho | –116.207 | 47.488 | Unk | Unk | Unk | — | Long and others, 1998 |
| Page—Blackhawk | Idaho | –116.201 | 47.528 | 4,521,461 | 15,365,503 | 552,978,641 | — | Long and others, 1998 |
| Polaris | Idaho | –116.052 | 47.502 | 320,783 | 7,368,759 | 29,718 | — | Long and others, 1998 |
| Rex | Idaho | –115.873 | 47.535 | Unk | Unk | Unk | — | Long and others, 1998 |
| Senator Stewart | Idaho | –116.171 | 47.525 | 1,041,814 | 6,610,160 | 323,888 | — | Long and others, 1998 |
| Sherman | Idaho | –115.82 | 47.525 | 661,071 | 3,930,759 | 8,546,128 | — | Long and others, 1998 |
| Sidney | Idaho | –115.192 | 47.488 | 1,071,197 | 1,931,081 | 171,151,606 | — | Long and others, 1998 |
| Silver Summit | Idaho | –116.025 | 47.506 | 798,761 | 19,932,835 | 119,200 | — | Long and others, 1998 |
| Standard—Mammoth | Idaho | –115.836 | 47.519 | 3,763,893 | 25,542,538 | 949,832 | — | Long and others, 1998 |
| Star-Morning | Idaho | –115.812 | 47.468 | 26,439,368 | 73,078,060 | 3,324,146,000 | — | Long and others, 1998 |
| Success | Idaho | –115.872 | 47.527 | Unk | Unk | Unk | — | Long and others, 1998 |
| Sunshine | Idaho | –116.068 | 47.501 | 12,794,736 | 366,177,233 | 8,668,646 | 354,174,808 lbs antimony | Long and others, 1998 |
| Tamarack and Custer | Idaho | –115.848 | 47.536 | 2,819,472 | 8,753,391 | 156,417,665 | — | Long and others, 1998 |
| Tiger—Poorman | Idaho | –115.813 | 47.523 | 1,128,793 | 2,656,234 | 127,846 | — | Long and others, 1998 |
| Unity-Rescue | Idaho | –115.7 | 45.258 | Unk | 58,000 | Neg | — | Long and others, 1998 |
| Florence | Mont. | –110.743 | 46.942 | Unk | Unk | Unk | — | Long and others, 1998 |
| U.S. Antimony | Mont. | –115.59 | 47.572 | Unk | Unk | Unk | 15,400 tonnes antimony | Hofstra and others, 2013 |
Formation of Orogenic Mineral Systems
A temporal relationship exists between the accretion of juvenile crustal terranes and the formation of orogenic mineral systems (Goldfarb and others, 2001). Orogenic mineral systems form late during the collisional orogenic process and after regional metamorphism of the accreted terranes (Goldfarb and others, 2005). Deformation and prograde metamorphism of midcrustal rocks during an accretionary orogeny can release large volumes of fluid (Elmer and others, 2006; Phillips and Powell, 2010), bisulfide (HS–) ligands (Tomkins, 2010), and gold and other metals (Pitcairn and others, 2006, 2010) as a result of metamorphic reactions near the greenschist to amphibolite facies transition. These gold-rich hydrothermal fluids are subsequently focused and flow upwards along dilatant structures in concert with the earthquake cycle. High fluid pressure can induce fault ruptures and swarm seismicity, during which enormous volumes of metamorphic hydrothermal fluid can channel and flow upwards along major structures that only display small displacement (for example, Sibson, 1987; Sibson and others, 1988; Cox, 2016).
As the metamorphic hydrothermal fluids are pumped towards shallower depths, ore deposits may form within favorable chemical and structural traps. Metals are introduced by ascending hydrothermal fluids, but additional metals may also be derived from local aquifers and host rocks through fluid–fluid and fluid–rock reactions at the deposit site. The metals within orogenic systems are dependent upon the types of rocks undergoing metamorphism at depth, the immediate host rock of the shear zone and veins, and the depth of formation (fig. 2; Goldfarb and others, 2005). A continuum of deposits within this system goes from deeper level gold through shallower mercury deposits. The major commodity within orogenic gold deposits is gold. Other critical minerals that may be enriched in these deposits include arsenic, tellurium, and tungsten. Additionally, antimony, mercury, and graphite deposits may be present in other parts of the system; antimony and graphite are critical minerals (Hofstra and Kreiner, 2020).
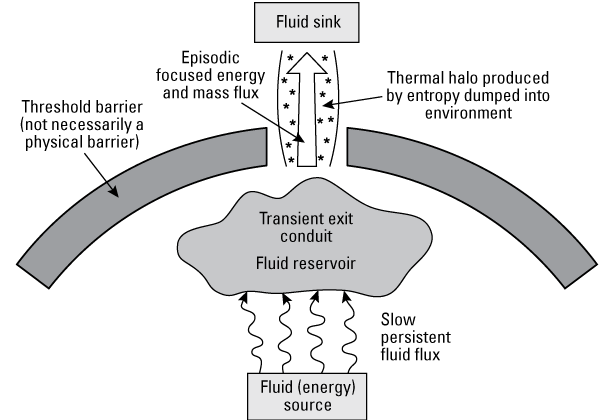
Simplified schematic model for a mineral system, including metamorphic shear zone hydrothermal systems. Modified from Wyman and others (2016).
The energy source required for forming an orogenic gold deposit is orogenesis and its associated metamorphism. Fluids, ligands, and metals are all sourced from supracrustal rocks undergoing metamorphism in the midcrust. Reduced oceanic volcanic arc and associated sedimentary rock domains containing pyrite (FeS2) are likely to be a favorable protolith (source rock) that release fluids (Elmer and others, 2006; Phillips and Powell, 2010), ligands (Tomkins, 2010), and metals (Pitcairn and others, 2006, 2010), particularly during the greenschist to amphibolite facies metamorphic transition.
Fluid inclusion studies demonstrate the predominance of low-salinity water (H2O)–carbon dioxide (CO2; ± methane [CH4], dinitrogen [N2]) fluids in orogenic gold deposits (Goldfarb and Groves, 2015); there are rare examples containing only miniscule amounts of CO2 (Taylor and others, 2021). Generation of an H2O–CO2 fluid composition would be expected through metamorphic devolatilization reactions occurring in the midcrust (Fyfe and others, 1978; Powell and others, 1991), and the general consistency in fluid characteristics between different orogenic gold deposits is suggestive of a common fluid source. Within accretionary belts such as the California Mother Lode (not shown in fig. 1), accreted oceanic volcanic arc and associated sedimentary rocks are the likely source of metamorphic fluids associated with orogenic gold deposits through dehydration reactions such as the conversion of chlorite to amphibole (Elmer and others, 2006; Phillips and Powell, 2010).
Although numerous potential ligands can be found in the hydrothermal fluid, bisulfide (HS–) is the most important ligand for gold complexing (Loucks and Mavrogenes, 1999). Desulfidation reactions of a reduced rock containing pyrite as the sulfur source are necessary to generate these gold-complexing ligands. The pyrite to pyrrhotite (Fe(1–X)S) reaction that releases sulfur occurs at the greenschist to amphibole facies transition, which is the same important fluid-generating transition detailed in the previous paragraph (Tomkins, 2010). Major ore metals—including gold, arsenic, bismuth, tellurium, and tungsten—are released through prograde metamorphic reactions in metasedimentary rocks, particularly at the greenschist to amphibolite facies transition (Pitcairn and others, 2006). These ore metals are largely stripped from pyrite (Pitcairn and others, 2010), and although sedimentary pyrite is an important source for gold, basalt may also provide a source for the ore metals (Pitcairn and others, 2015).
Orogenic gold deposits form in association with crustal-scale shear zones that act as fluid pathways that link the metamorphic area of fluid, ligand, and metal generation with the mineralization site and shallower outflow region (fig. 3). The spatial association between major orogenic gold deposits and crustal-scale regional fault zones has been established (for example, Turneaure, 1955), although the sites of mineralization are typically in lower order faults where more efficient structural and chemical traps allow gold mineralization. Geopressurized fluids are channeled along the permeable first-order structures during seismic events (Sibson and others, 1988; Cox and others, 2001; Cox, 2016). In California, these major structures commonly mark boundaries between various amalgamated terranes.
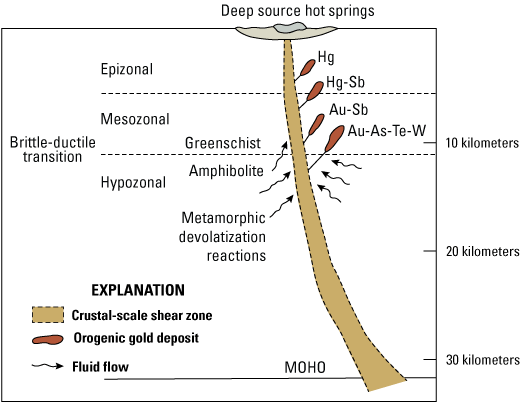
Schematic model of an orogenic system. Although different genetic models have been proposed, this model represents the generally accepted supracrustal metamorphic devolatization model. Modified from Groves and others (2020). (As, arsenic; Au, gold; Hg, mercury; MOHO, Mohorovičić discontinuity; Sb, antimony; Te, tellurium; W, tungsten)
Within orogenic gold deposits, gold may be in its native form, as gold telluride minerals, or as invisible gold found as nanoinclusions or structurally bound within sulfide minerals (generally, pyrite or arsenopyrite). Ore deposition is postulated to occur through various physicochemical processes that lower gold solubility within the ore fluid. Fluid–rock interaction is of primary importance, especially for nanoinclusions or structurally bound gold associated with sulfides. During fluid interaction of rocks with high iron (Fe) to iron plus magnesium (Mg; Fe+Mg) ratios, gold will become destabilized from its bisulfide ligand, and pyrite will form from the reaction of iron in the host rock with sulfur in the fluid along with concomitant deposition of gold (Phillips and Groves, 1983; Böhlke, 1988). In addition to iron-rich rocks, carbon-rich rocks are also important reductants of the fluid that can lead to gold mineralization (Cox and others, 1991). Hydraulic fracturing, an important process in the formation of orogenic gold deposits, can trigger pressure fluctuations within the ore-forming environment from supralithostatic to hydrostatic pressure conditions. Pressure changes alone are an effective mechanism that alter gold solubility and cause gold precipitation (for example, Groves and others, 1987; Loucks and Mavrogenes, 1999). Agglomeration of colloidal gold in the hydrothermal fluid resulting from pressure changes may result in large sponge- and dendrite-like masses of gold (Taylor and others, 2021). Additional mechanisms of lesser importance that may result in gold precipitation include pH decrease of the hydrothermal fluid, fluid mixing, changes in oxygen fugacity (ƒO2), and temperature changes.
Hydrothermal alteration related to gold precipitation occurs at the deposit site due to fluid–rock interaction and may occur pre-, syn-, and postmineralization. Early alteration may increase the competency of the host rock, allowing brittle fractures to develop that host gold mineralization (for example, Poulsen and others, 1986). The composition and structure of the wall rock plays a significant role in what alteration products are present. Quartz-sericite (muscovite)-pyrite and carbonate (calcite, ankerite, ferroan dolomite, magnesite, and siderite) alteration are fundamental alteration types. Talc and fuchsite may substitute for sericite or muscovite within ultramafic wall rocks, and magnesite and siderite are the accompanying dominant carbonate minerals.
In addition to gold and silver, other ore minerals may include pyrite, arsenopyrite (FeAsS), galena (PbS), sphalerite (ZnS), chalcopyrite (CuFeS2), stibnite (Sb2S3), scheelite (CaWO4), graphite (C), rutile (TiO2), tetrahedrite ([Cu,Fe,Zn,Ag]12[Sb,As]4S13), and various telluride minerals (fig. 4); of these ore minerals, arsenopyrite (arsenic), stibnite (antimony), scheelite (tungsten), graphite, and telluride minerals (tellurium) are important host phases for critical minerals (table 3). The most common telluride minerals in orogenic gold deposits include calaverite (AuTe2), sylvanite (AgAuTe4), hessite (Ag2Te), and petzite (Ag3AuTe2; table 3). Pyrite may contain critical metals such as arsenic, cobalt, and nickel, but the metals are likely found as minor to trace components within the crystals (Taylor and others, 2021). Gangue (the valueless rock or mineral aggregates in an ore) mineralogy is dominated by quartz and various carbonate minerals and lesser amounts of mica (such as muscovite, chlorite, and fuchsite).
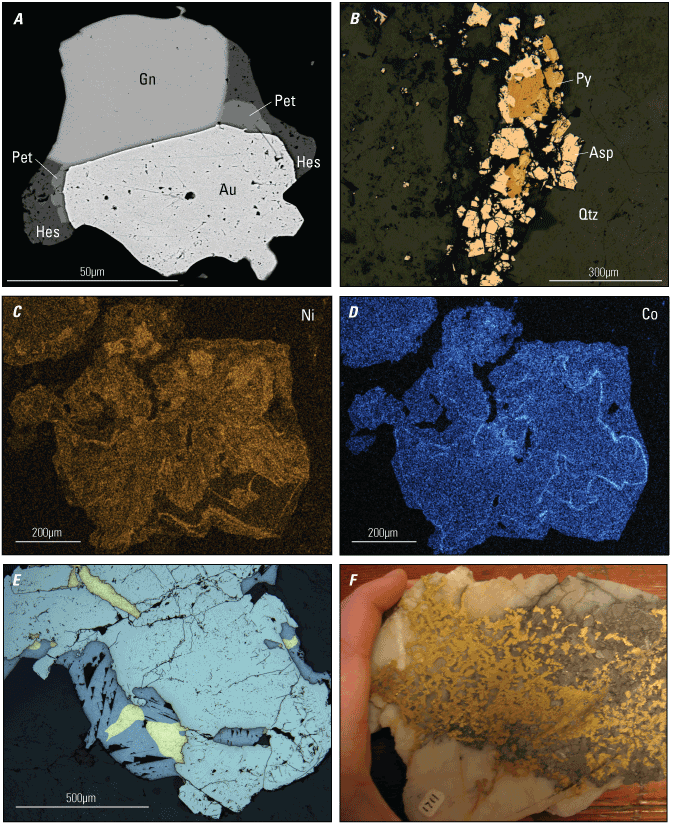
Photomicrographs and scans of orogenic gold ore showing the residence of critical minerals (µm, micrometer). A, A backscattered electron image of native gold (Au), galena (Gn), hessite (Hes), and petzite (Pet) from the Idaho-Maryland mine in Grass Valley, California. Modified from Taylor and others (2021). B, A reflected light photomicrograph of arsenopyrite (Asp) and pyrite (Py) within a quartz (Qtz) vein, Empire deposit in Grass Valley, California. (Photomicrograph by R. Taylor, U.S. Geological Survey) C–D, Qualitative energy-dispersive X-ray elemental maps illustrating nickel (Ni) and cobalt (Co) zoning within a pyrite crystal from the Idaho-Maryland mine in Grass Valley, California. Modified from Taylor and others (2021). E, Gold intergrown with galena and within fractures in pyrite. Sample from Grass Valley, California. (Photomicrograph by R. Taylor, U.S. Geological Survey) F, Photograph of high-grade gold ore with native gold and arsenopyrite from the Sixteen-to-One deposit in Alleghany, California. (Photograph by Erin Marsh, U.S. Geological Survey)
Table 3.
Ore minerals containing critical mineral metals.[CdA, Coeur d'Alene-type; OroAu, orogenic gold; X, 0 to 0.125; Abbreviations of chemical elements as follows: Ag, silver; As, arsenic; Au, gold; C, carbon; Ca, calcium; Cd, cadmium; Co, cobalt; Cu, copper; Fe, iron; Ga, gallium; Ge, germanium; In, indium; Mn, manganese; Ni, nickel; O, oxygen; Pb, lead; S, sulfur; Sb, antimony; Te, tellurium; W, tungsten; Zn, zinc]
Formation of Coeur d’Alene-type Mineral Systems
Coeur d’Alene-type mineral systems form in a manner similar to orogenic mineral systems, but there are some key differences: Coeur d’Alene-type mineral systems have different source rocks and more saline fluids, have chloride as the major ligand, and comprise a different suite of metals. Major commodities within Coeur d’Alene-type polymetallic sulfide deposits are silver, lead, zinc, and copper; minor commodities in these deposits include gold and byproduct cadmium, cobalt, antimony, and barite. Of the major and minor commodities, antimony, barite, cobalt, and zinc are considered critical minerals. Additional critical minerals that may be enriched in these polymetallic sulfide deposits include arsenic, bismuth, gallium, germanium, indium, and manganese. Antimony and uranium deposits occur in other parts of the system; antimony is a critical mineral (Hofstra and Kreiner, 2020).
Coeur d’Alene-type systems have also been called “mesothermal base and precious metal systems” (Leach and others, 1988), “polymetallic sulfide and antimony deposits” (Long, 1998a), or “silver-lead-zinc veins in clastic metasedimentary rock terranes” (Beaudoin and Sangster, 1992). In the United States, these types of deposits are largely in deformed and metamorphosed rocks of the Proterozoic Belt Basin along the Lewis and Clark line (a fault zone that extends from near Wallace, Idaho [not shown in fig. 1], to east of Helena, Montana; Wallace and others, 1990) in Idaho and Montana (fig. 1). Zinc-, lead-, silver-, and gold-rich ores are in different districts and are suggested to have formed during the Proterozoic or Late Cretaceous–early Tertiary (Zartman and Stacey, 1971; Leach and others, 1998; Ramos and Rosenberg, 2012). Metamorphism accompanying orogenesis provides the energy required to form Coeur d’Alene-type deposits. Fluids, ligands, and metals are all sourced from siliciclastic sedimentary rocks undergoing metamorphism in a similar manner to what is outlined for orogenic mineral systems (refer to the “Formation of Orogenic Mineral Systems” section).
Oxygen isotope studies of vein quartz from the Coeur d’Alene region indicate a mix of meteoric and metamorphic fluids derived from rocks of the Belt Basin were involved in ore deposition (Constantopoulos and Larson, 1991; Constantopoulos, 1994). In addition to oxygen isotopes, lead isotopes of sulfides and strontium isotopes of vein carbonate minerals further suggest that strontium and lead were derived from rocks of the Belt Basin and pre-existing lead-zinc mineralization, either in the Proterozoic or Mesozoic (Rosenberg and Larson, 1996; Leach and others, 1998; Fleck and others, 2002). Another study of lead, strontium, and neodymium isotopes in carbonate minerals suggested that these elements were also derived from Archean basement rocks (Ramos and Rosenberg, 2012). Ore deposition occurred between 250 and 350 degrees Celsius (°C), based upon fluid inclusion analysis (Leach and others, 1988). Fluid mixing of deeply sourced and meteoric fluids is an important process leading to mineralization (Beaudoin and Sangster, 1992). However, the correlation between productive veins and specific stratigraphy highlights the importance of local fluid–rock interactions and favorable rheology to mineralization; base metal veins are more commonly located within quartzite, whereas silver-rich veins are within silicified siltstone of the Proterozoic Revett Formation (Mauk and White, 2004), and quartz-stibnite veins are in the Proterozoic Prichard Formation for deposits in the Coeur d’Alene region (Hofstra and others, 2013).
Although bisulfide complexes are the most important ligand for complexing gold within orogenic gold deposits, fluid inclusion analyses by Hofstra and others (2013) indicate that antimony and silver-rich veins within the Coeur d’Alene region contain low concentrations of hydrogen sulfide (H2S). In contrast, the moderate to high salinity indicates that chloride complexes were important ligands transporting metals during formation of silver and antimony veins. Chloride complexes are also inferred to be important in the Coeur d’Alene base metal veins, which has been demonstrated for zinc and lead mobility during metamorphism (Hammerli and others, 2015).
The source of metals in Coeur d’Alene-type polymetallic veins is considered the Belt Basin. Sedimentary rocks, potentially the pyrite-bearing rocks of the lower part of the Prichard Formation, which contains sedex lead-zinc deposits in the Canadian part of the Belt Basin, likely released lead, zinc, silver, and antimony during metamorphism. This model is supported by lead isotope studies showing that Coeur d’Alene ores have Proterozoic lead signatures similar to those signatures of the Sullivan lead-zinc sedex deposit in Canada (Fleck and others, 2002). The silver-rich veins are hosted in the Revett Formation, which regionally contains sedimentary rock-hosted copper deposits (Boleneus and others, 2005), including the Snowstorm deposit at the east end of the district. The correlation between copper, silver, and antimony in these veins suggests that they formed as ascending fluids that contained antimony, silver, and variable lead and zinc mixed with copper-bearing fluids derived from the Revett Formation (table 4).
Table 4.
Correlation coefficients of select metals commonly enriched in Coeur d'Alene-type deposits using all the samples compiled in the study (n=75).[Compositional data are from Granitto and others (2020, 2021, 2025). —, not applicable; Abbreviations of chemical elements as follows: Ag, silver; Au, gold; As, arsenic; Bi, bismuth; C, carbon; Cd, cadmium; Co, cobalt; Cu, copper; Fe, iron; Ga, gallium; Ge, germanium; In, indium; Mn, manganese; Pb, lead; Pd, palladium; S, sulfur; Sb, antimony; Se, selenium; Te, tellurium; W, tungsten; Zn, zinc]
The shear zone veins of the Coeur d’Alene region are located within the western part of the Lewis and Clark line, which extends from Coeur d'Alene, Idaho, to Helena, Montana (Wallace and others, 1990). This fault zone contains high-angle faults of variable kinematics that have been intermittently active since the middle Proterozoic with major strike-slip movement in the Late Cretaceous (Bennett and Venkatakrishnan, 1982; Wallace and others, 1990). Individual faults within this fault zone may stretch for as many as 250 kilometers along strike. Ore-bearing veins are preferentially located within fractures and faults that intersect large folds within brittle host rocks; the ore province itself is located within the most deformed part of the Lewis and Clark line.
For Coeur d’Alene-type mineral systems, phyllic alteration composed of sericite, quartz, and pyrite is common for the wall rocks adjacent to veins (Beaudoin and Sangster, 1992). In the Coeur d’Alene region, however, alteration may be broader and is typified by bleaching of the rock through destruction of feldspar and hematite and the addition of siderite and sulfides (Fryklund, 1964; Mauk and Strand, 2002).
Mining and Beneficiation of Ore Deposits and Materials
Underground mining techniques have historically been the most common method of mining orogenic gold deposits, but open-pit mining is not uncommon. The grade-tonnage model of Bliss (1986) indicates that 50 percent of deposits have gold grades of at least 16 grams per tonne (g/t) and ore tonnages of at least 30,000 tonnes, which are indicative of the high-grade low-tonnage nature of these deposits. Because of the continued increase in gold prices, open-pit bulk mining of lower grade, hydrothermal alteration zones that would have previously been considered waste material has become more common since the Bliss (1986) grade-tonnage model was created. Inclusion of lower grade alteration zones has led to changes when applying the grade-tonnage model of Bliss (1986) to the current (2025) economic environment (Davies and others, 2020).
Mining techniques for Coeur d’Alene-type systems are similar to techniques for orogenic mineral systems because both are vein deposits. Underground mining methods predominate, but open-pit mining is occasionally used. Underground mining by stoping is common, but the room-and-pillar mining method is also considered a viable method. Using tailings as backfill is a common practice.
Beneficiation of ore materials is done through initial crushing and milling, gravity separation, flotation, and cyanide extraction with carbon leaching (Adams, 2016). Coarse-grained native gold from orogenic gold deposits has historically been concentrated through gravity separation techniques because of its high specific gravity that permits easy separation from other associated gangue and ore minerals in veins. The gravity separation method allows the remaining material, including critical minerals, to be collected in piles that are free of any processing chemicals. Another standard practice that is especially efficient for recovery of fine gold particles, low grade ore, or gold that is inadequately separated from the rock is cyanide extraction and carbon leaching. Cyanide extraction and carbon leaching can be done by itself after crushing and milling or after an additional step of concentrating ore minerals through froth flotation. Refractory gold, such as gold tellurides, requires oxidation, flotation, and leaching to free the gold at high recovery rates (Zhang and others, 2010). Roasting followed by cyanide leaching has been the preferred method of gold recovery from telluride ores (Ellis and Deschênes, 2016). Preleaching of tellurium from gold telluride ore prior to removal of gold has been investigated as a way to collect tellurium and to avoid any detrimental effects that this critical mineral has on the recovery of gold (Yang and others, 2021). Mercury amalgamation was an early method used for gold recovery but is rarely used today because of health and environmental hazards related to mercury.
Beneficiation of Coeur d’Alene-type ores begins with milling (crushing and grinding) and is followed by flotation or gravity separation that produces the metal concentrates (McMahon and others, 1974). Flotation reagents include sodium cyanide, zinc sulfate, lime, copper sulfate, xanthate, and methyl isobutyl carbonyl, which are common for processing polymetallic mineralization. Sintering of concentrates may be done depending on the processing methodology. Concentrates are then shipped to a smelter.
Methods
Geochemical data for altered and mineralized rocks from orogenic gold deposits discussed in this report were compiled and released by Granitto and others (2020, 2021, 2025). The data from Granitto and others (2020) include geochemical data for 44 archived orogenic gold mine samples, and 33 of those 44 samples come from the United States (13 different deposits). The other 11 samples come from Australia and South Africa and are not considered in this report. Additionally, five of the United States deposit analyses reported in Granitto and others (2020) are also excluded from this report because of controversial or unlikely classification as orogenic gold-type deposits. Granitto and others (2020) also include data for numerous samples from the Proterozoic Homestake mine in South Dakota.
Additional legacy data for orogenic gold deposits published in Granitto and others (2021) comprise 75 samples of analyzed drill core from the Idaho-Maryland mine in Grass Valley, Calif., and 12 samples previously analyzed by the Mineral Deposit Research Unit, University of British Columbia, which include 6 samples from Grass Valley, Calif.; 5 samples from the Mother Lode belt in California (not shown in fig. 1); and 1 sample from the Alleghany district, Calif. Newly produced data from 35 samples of Mesozoic–Cenozoic gold deposits compiled by Granitto and others (2025) comprise 6 samples from other mines in the Sierra Nevada foothills, Calif.; 21 samples from mines in the Klamath Mountains, Calif.; 7 samples from deposits in Alaska (not shown in fig. 1); and 1 sample from Idaho. Additionally, Granitto and others (2020, 2021, 2025) contain information regarding the analytical methods used and data sources. Orogenic gold ore samples included in this study are briefly described and tabulated in appendix 1 (table 1.1). Data on tailings or mine waste for orogenic gold deposits were not available.
Geochemical data on mineralized rock samples from Coeur d’Alene-type deposits discussed in this report were compiled and released by Granitto and others (2020, 2025). The data for Coeur d’Alene-type deposits in Granitto and others (2020, 2025) include geochemical data for 75 archived ore samples from 26 different mines and locations in the Coeur d’Alene region in Idaho and Montana. Coeur d’Alene-type ore samples included in this study are briefly described and tabulated in appendix 1 (table 1.2). Data on tailings or mine waste from Coeur d’Alene-type deposits were not available because tailings or mine waste samples were not collected.
Results
The nugget effect of gold within orogenic gold deposits causes difficulties in interpreting quantitative geochemical associations because large and valuable particles of gold may be heterogeneously distributed in the ore and can affect the results of a smaller sample analysis (Dominy, 2014). However, there should be a general correlation between higher grade samples. Additionally, the methodology for measuring metal content differs among many of the analyses and therefore has differing detection limits (Granitto and others, 2020, 2021, 2025). Median geochemical values are preferred more than mean values because numerous analyses are below detection limits and therefore do not offer a quantitative concentration.
Geochemistry of Orogenic Gold Deposits
Samples with gold values above 0.5 parts per million (ppm; 0.5 g/t or 0.16 ounces per short ton) cutoff (n=67) are plotted relative to average upper crustal abundance in figure 5. The median, minimum, and maximum concentrations of each element are listed in table 5.
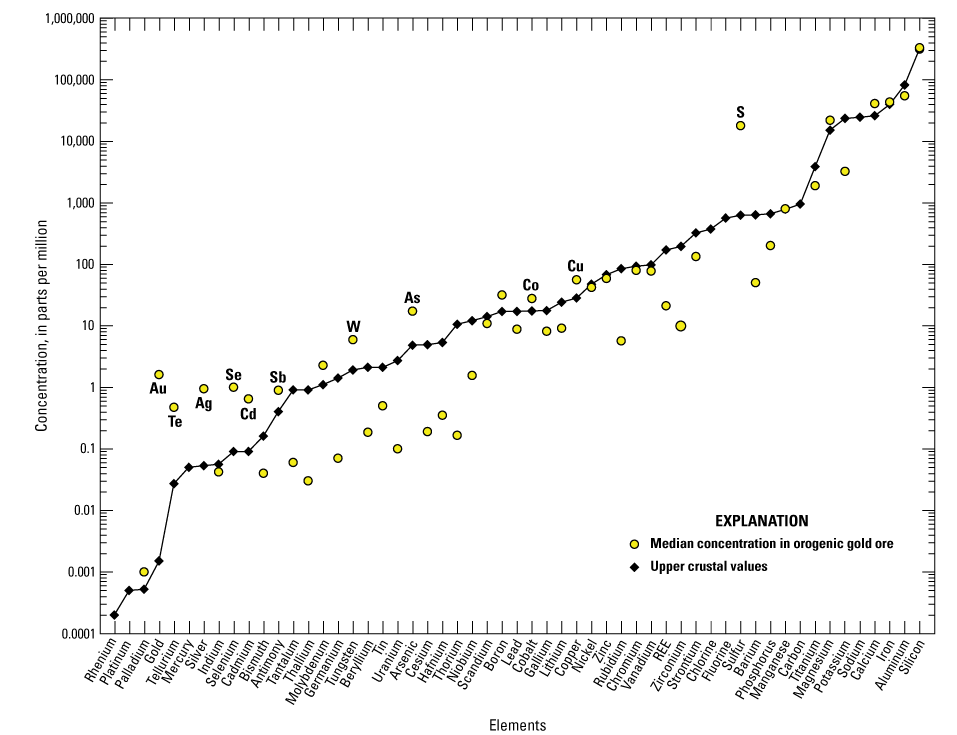
Graph showing the median concentrations of elements in orogenic gold ore with gold concentrations greater than or equal to 0.5 parts per million (equivalent to 0.5 grams per tonne; n=67) relative to the upper crust. Important potential byproduct commodities are individually labeled. Based on geochemical data from Granitto and others (2020, 2021, 2025). Crustal abundance values are from Hu and Gao (2008) for tellurium, Israel Science and Technology (2007) for carbon, and Rudnick and Gao (2014) for all other elements. (Au, gold; Te, tellurium; Ag, silver; Se, selenium; Cd, cadmium; Sb, antimony; W, tungsten; As, arsenic, Co, cobalt; Cu, copper, S, sulfur; REE, rare earth elements)
Table 5.
Basic statistics on gold-rich ore (gold concentration greater than 0.5 parts per million) from orogenic gold deposits.[Compositional data are from Granitto and others (2020, 2021, 2025); BDL, below detection limit; ppm, parts per million; wt. pct., weight percent; >, greater than. Abbreviations of chemical elements as follows: Ag, silver; Al, aluminum; As, arsenic; Au, gold; B, boron; Ba, barium; Be, beryllium; Bi, bismuth; Ca, calcium; Cd, cadmium; Ce, cerium; Co, cobalt; Cr, chromium; Cs, cesium; Cu, copper; Dy, dysprosium; Er, erbium; Eu, europium; Fe, iron; Ga, gallium; Gd, gadolinium; Ge, germanium; Hf, hafnium; Ho, holmium; In, indium; K, potassium; La, lanthanum; Li, lithium; Lu, lutetium; Mg, magnesium; Mn, manganese; Mo, molybdenum; Nb, niobium; Nd, neodymium; Ni, nickel; P, phosphorous; Pb, lead; Pd, palladium; Pr, praseodymium; Pt, platinum; Rb, rubidium; Re, rhenium; S, sulfur; Sb, antimony; Sc, scandium; Se, selenium; Si, silica; Sm, samarium; Sn, tin; Sr, strontium; Ta, tantalum; Tb, terbium; Te, tellurium; Th, thorium; Ti, titanium; Tl, thallium; Tm, thulium; U, uranium; V, vanadium; W, tungsten; Y, yttrium; Yb, ytterbium; Zn, zinc; Zr, zirconium]
Analyzed samples contain high concentrations of antimony, arsenic, cadmium, cobalt, copper, iron, molybdenum, silver, tellurium, tungsten, and zinc. Gold concentrations are plotted against the concentrations of some select critical minerals (arsenic, bismuth, cobalt, antimony, tellurium, and tungsten) for all samples in figure 6. Correlation coefficients for critical minerals with gold are reported in table 6. A much stronger correlation between gold and tellurium may be found for individual deposits, especially those deposits hosted by local intrusions within metasedimentary rock-dominated orogens (Goldfarb and others, 2005, 2017). For example, gold mined at the Kensington deposit, Alaska (not shown in fig. 1), is predominantly hosted in telluride minerals and would therefore have a very strong correlation between the two metals; no ore geochemistry for the Kensington deposit is available for this study, but analysis by Heinchon (2019) indicated a significant correlation between gold and tellurium recording a coefficient of determination (R2) value of 0.82.
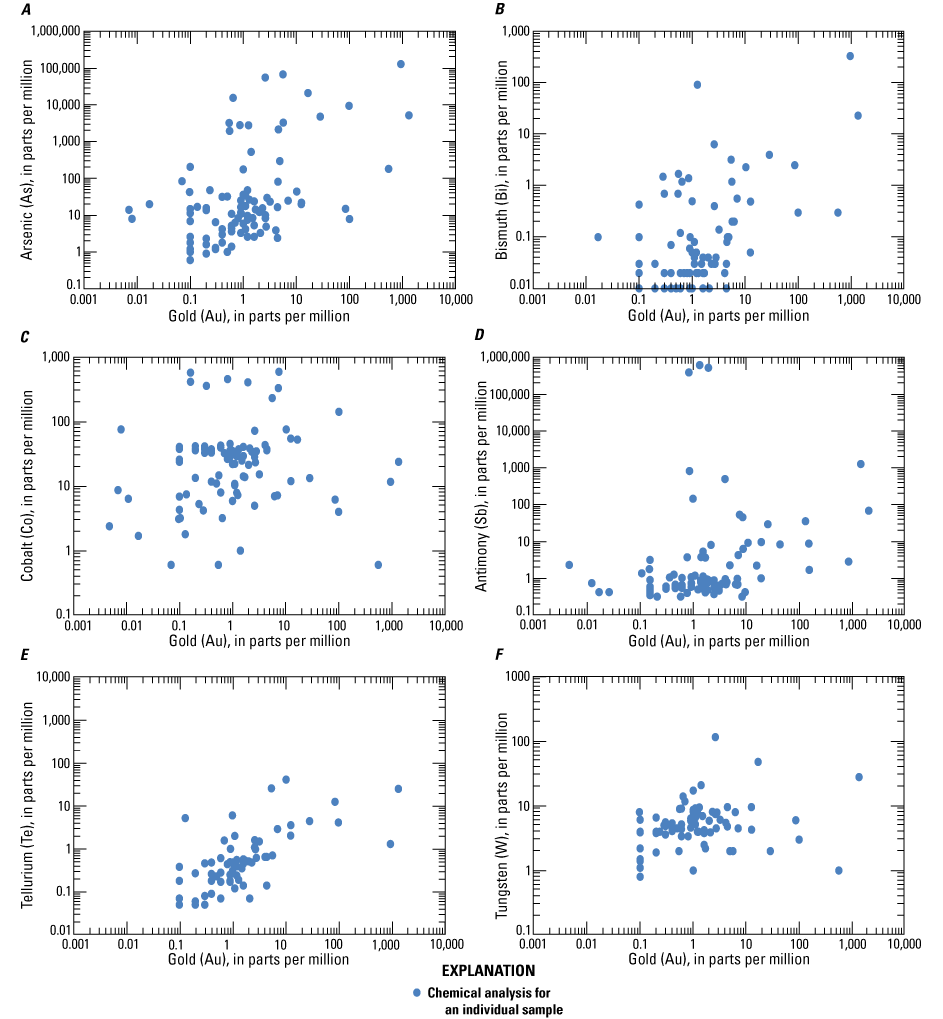
Log-log plots of gold plotted against select critical minerals A, arsenic, B, bismuth, C, cobalt, D, antimony, E, tellurium, and F, tungsten in ore from orogenic gold deposits.
Table 6.
Correlation coefficients of select metals commonly enriched in orogenic gold deposits using all samples compiled in this study (n=150).[Compositional data are from Granitto and others (2020, 2021, 2025); —, not applicable; Abbreviations of chemical elements as follows: Au, gold; As, arsenic; Bi, bismuth; Cd, cadmium; Co, cobalt; Cu, copper; Pb, lead; Sb, antimony; Te, tellurium; W, tungsten; Zn, zinc]
Geochemistry of Coeur d’Alene-type Deposits
The median, minimum, and maximum concentrations of each element in silver-rich Coeur d’Alene-type ore samples with a cut off value of 250 ppm silver (n=44) are listed in table 7 and are plotted relative to average upper crustal abundance in figure 7. The median, minimum, and maximum concentrations of each element in zinc-rich Coeur d’Alene-type ore samples with a cut off value of 3 weight percent zinc (n=36) are listed in table 8 and plotted relative to average upper crustal abundance in figure 8.
Table 7.
Basic statistics on silver-rich ore (silver concentration greater than 250 parts per million) from Coeur d'Alene-type deposits.[Compositional data are from Granitto and others (2020, 2021, 2025). BDL, below detection limit; ppm, parts per million; wt. pct., weight percent; Abbreviations of chemical elements as follows: Ag, silver; Al, aluminum; As, arsenic; Au, gold; B, boron; Ba, barium; Be, beryllium; Bi, bismuth; Ca, calcium; Cd, cadmium; Ce, cerium; Co, cobalt; Cr, chromium; Cs, cesium; Cu, copper; Dy, dysprosium; Er, erbium; Eu, europium; Fe, iron; Ga, gallium; Gd, gadolinium; Ge, germanium; Hf, hafnium; Ho, holmium; In, indium; K, potassium; La, lanthanum; Li, lithium; Lu, lutetium; Mg, magnesium; Mn, manganese; Mo, molybdenum; Nb, niobium; Nd, neodymium; Ni, nickel; P, phosphorous; Pb, lead; Pd, palladium; Pr, praseodymium; Pt, platinum; Rb, rubidium; Re, rhenium; S, sulfur; Sb, antimony; Sc, scandium; Se, selenium; Si, silica; Sm, samarium; Sn, tin; Sr, strontium; Ta, tantalum; Tb, terbium; Te, tellurium; Th, thorium; Ti, titanium; Tl, thallium; Tm, thulium; U, uranium; V, vanadium; W, tungsten; Y, yttrium; Yb, ytterbium; Zn, zinc; Zr, zirconium]
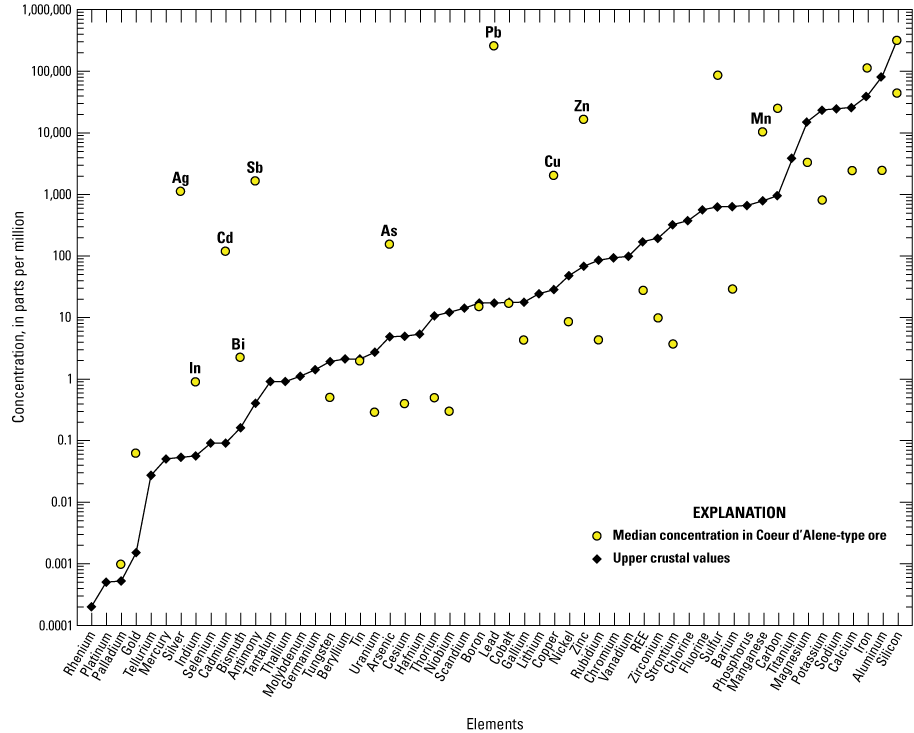
Graph showing the median concentrations of elements in silver-rich Coeur d’Alene-type ore with silver concentrations greater than 250 parts per million silver (n=44) relative to upper crust. Based on geochemical data from Granitto and others (2020, 2021, 2025). Crustal abundance values are from Hu and Gao (2008) for tellurium, Israel Science and Technology (2007) for carbon, and Rudnick and Gao (2014) for all other elements. (Ag, silver; In, indium; Cd, cadmium; Sb, antimony; Bi, bismuth; As, arsenic; Pb, lead; Cu, copper; Zn, zinc; Mn, manganese; REE, rare earth elements)
Table 8.
Basic statistics on zinc-rich ore (with zinc concentration greater than 3 weight percent) from Coeur d'Alene-type deposits.[Compositional data are from Granitto and others (2020, 2021, 2025). BDL, below detection limit; ppm, parts per million; wt. pct., weight percent; Abbreviations of chemical elements as follows: Ag, silver; Al, aluminum; As, arsenic; Au, gold; B, boron; Ba, barium; Be, beryllium; Bi, bismuth; Ca, calcium; Cd, cadmium; Ce, cerium; Co, cobalt; Cr, chromium; Cs, cesium; Cu, copper; Dy, dysprosium; Er, erbium; Eu, europium; Fe, iron; Ga, gallium; Gd, gadolinium; Ge, germanium; Hf, hafnium; Ho, holmium; In, indium; K, potassium; La, lanthanum; Li, lithium; Lu, lutetium; Mg, magnesium; Mn, manganese; Mo, molybdenum; Nb, niobium; Nd, neodymium; Ni, nickel; P, phosphorous; Pb, lead; Pd, palladium; Pr, praseodymium; Pt, platinum; Rb, rubidium; Re, rhenium; S, sulfur; Sb, antimony; Sc, scandium; Se, selenium; Si, silica; Sm, samarium; Sn, tin; Sr, strontium; Ta, tantalum; Tb, terbium; Te, tellurium; Th, thorium; Ti, titanium; Tl, thallium; Tm, thulium; U, uranium; V, vanadium; W, tungsten; Y, yttrium; Yb, ytterbium; Zn, zinc; Zr, zirconium]
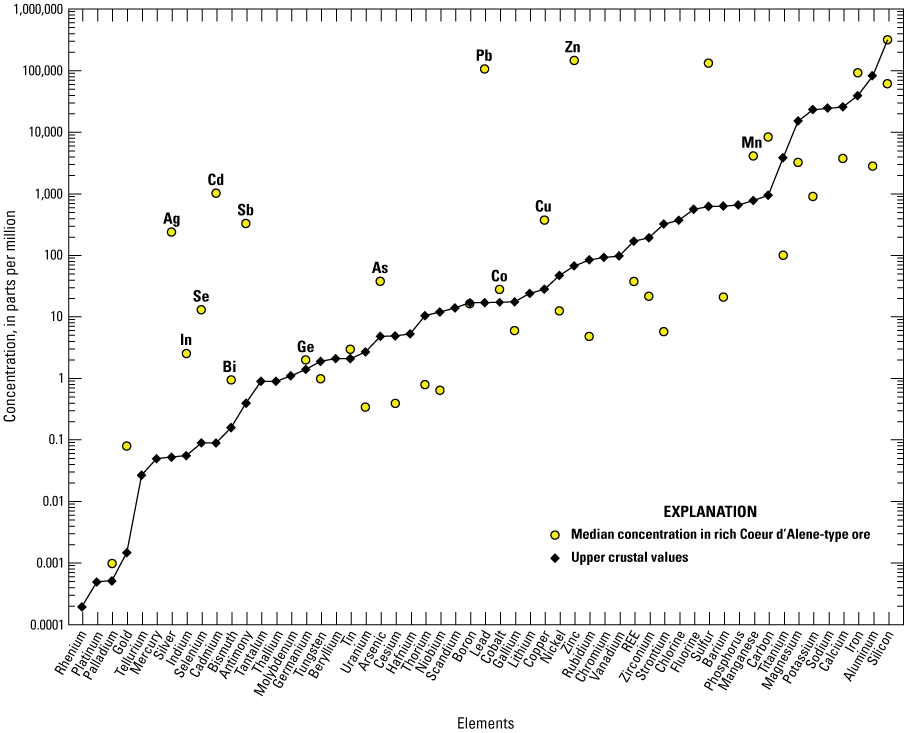
Graph showing the median concentrations of elements in zinc-rich Coeur d’Alene-type ore with zinc concentrations greater than 3 weight percent (n=36) relative to upper crust. Based on geochemical data from Granitto and others (2020, 2021, 2025). Crustal abundance values are from Hu and Gao (2008) for tellurium, Israel Science and Technology (2007) for carbon, and Rudnick and Gao (2014) for all other elements. (Ag, silver; In, indium; Se, selenium; Cd, cadmium; Bi, bismuth; Sb, antimony; Ge, germanium; As, arsenic; Pb, lead; Co, cobalt; Cu, copper; Zn, zinc; Mn, manganese)
Major ore minerals in Coeur d’Alene-type deposits include sphalerite, galena, tetrahedrite, stibnite, chalcopyrite, pyrite, and arsenopyrite (table 3). Other important minerals include boulangerite (Pb5Sb4S11) and scheelite. Gersdorffite (NiAsS) is uncommon except for at the Silver Summit mine where it was a large enough component to be considered cobalt and nickel ore (Fryklund, 1964). Pyrrhotite (Fe1-XS) from the Coeur d’Alene region contains per mille levels of cobalt and nickel (Fryklund and Harner, 1955). Common gangue mineralogy includes quartz, siderite, dolomite, and calcite. Antimony has been produced in the Coeur d’Alene region, and antimony contents are typically higher in silver-rich ores and in quartz-stibnite veins (Leach and others, 1998).
Notable enrichments of critical minerals compared to upper crustal abundance for silver-rich ore (silver concentration greater than 250 ppm) include antimony, arsenic, bismuth, indium, and manganese (table 7). Critical mineral enrichments relative to upper crustal abundance for zinc-rich ores (zinc concentration greater than 3 weight percent) include antimony, arsenic, bismuth, cobalt, germanium, indium, manganese, selenium, and zinc (table 8). Zinc is a primary commodity mined in Coeur d’Alene-type ores (Long, 1998a, b) but is still considered a critical mineral (USGS, 2022a). Tungsten is elevated in a few samples that can be either silver- or zinc-rich but is more commonly found at levels near or below the detection limit.
Of the enriched critical minerals in Coeur d’Alene ore, only a few have median concentrations in the analyzed ore greater than 50 ppm. In silver-rich ore (table 7), the highest median values for the enriched critical minerals include antimony (median value of 1,635 ppm), arsenic (median value of 154.5 ppm), manganese (median value of 1.02 weight percent), and zinc (median value of 1.62 weight percent). In zinc-rich ore (table 8), the highest median values for the enriched critical minerals include antimony (median value of 323.5 ppm), manganese (median value of 0.41 weight percent), and zinc (median value of 18.5 weight percent). The median value for cobalt in zinc-rich ores analyzed in this study is 27.95 ppm; however, cobalt was stockpiled as a byproduct at the Bunker Hill zinc smelter (Davis and Buck, 1958). The concentration of the major commodities silver, lead, and zinc are plotted against the concentrations of select critical minerals (antimony, arsenic, bismuth, cobalt, indium, manganese, selenium, tungsten) in figures 9–11, respectively, and the major commodities are plotted against each other in figure 12. Chemical data important for silver-rich ores are plotted in figure 13 for comparison with mineral chemistry data for tetrahedrite in figure 14.
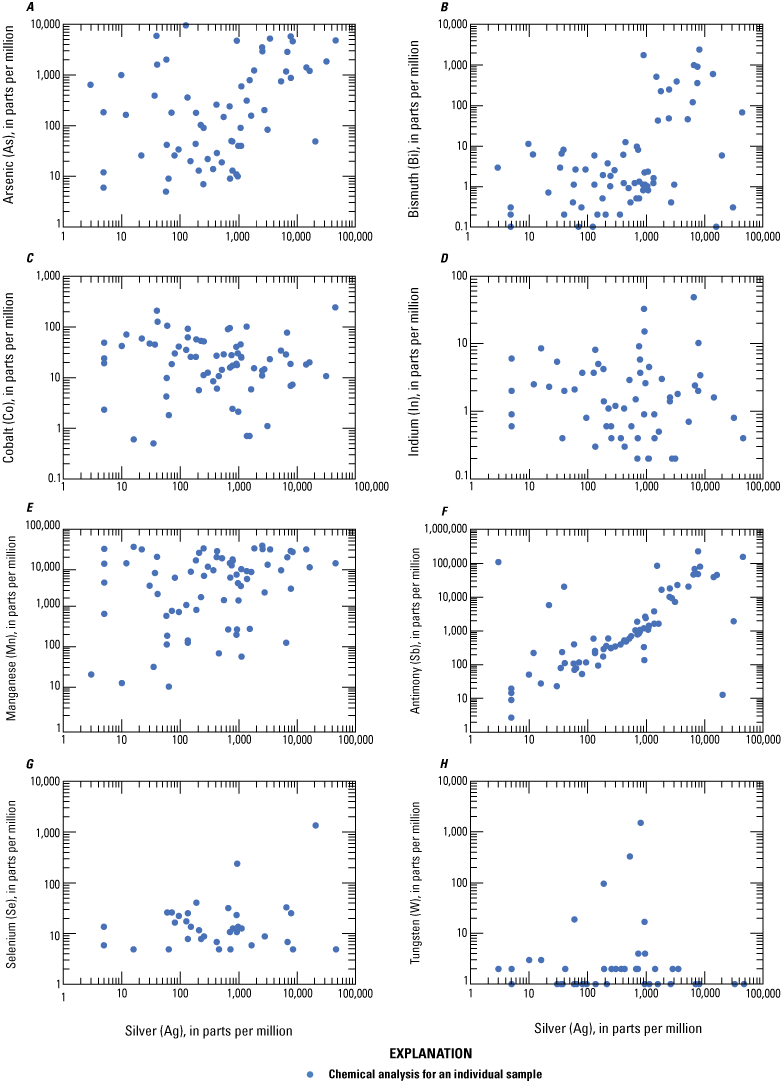
Log-log plots of silver plotted against select critical minerals A, arsenic, B, bismuth, C, cobalt, D, indium, E, manganese, F, antimony, G, selenium, and H, tungsten in ore from Coeur d’Alene-type deposits. Based on geochemical data from Granitto and others (2020, 2021, 2025).
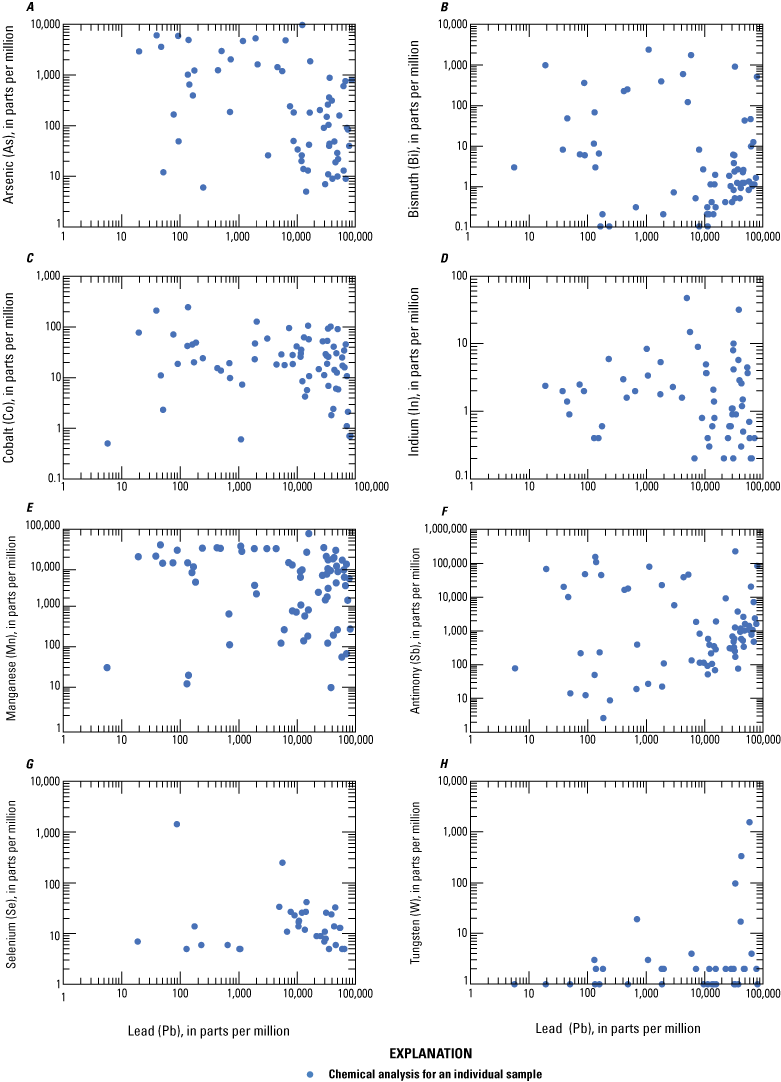
Log-log plots of lead plotted against select critical minerals A, arsenic, B, bismuth, C, cobalt, D, indium, E, manganese, F, antimony, G, selenium, and H, tungsten in ore from Coeur d’Alene-type deposits. Based on geochemical data from Granitto and others (2020, 2021, 2025).
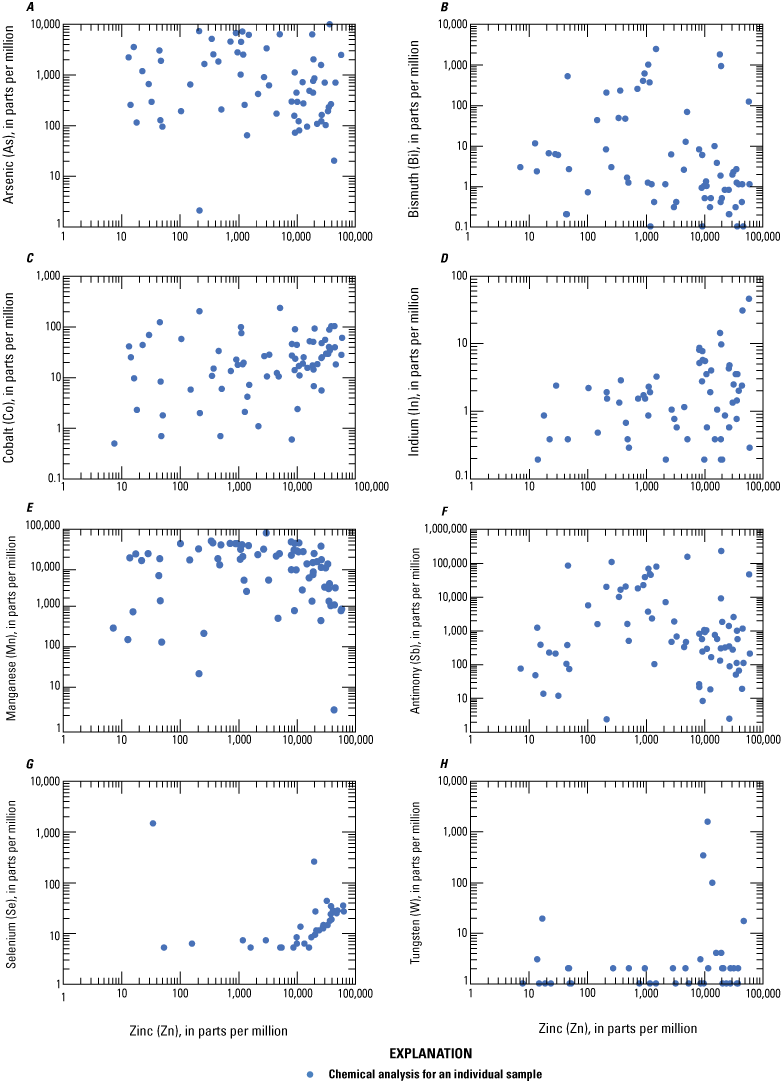
Log-log plots of zinc plotted against select critical minerals A, arsenic, B, bismuth, C, cobalt, D, indium, E, manganese, F, antimony, G, selenium, and H, tungsten in ore from Coeur d’Alene-type deposits. Based on geochemical data from Granitto and others (2020, 2021, 2025).
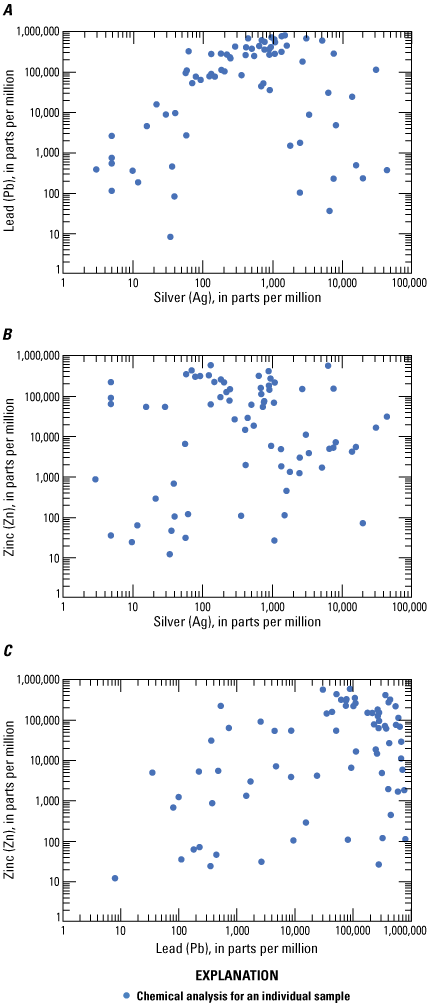
Log-log plots of the major commodities A, lead and silver, B, zinc and silver, and C, zinc and lead in ore from Coeur d’Alene-type deposits. Based on geochemical data from Granitto and others (2020, 2021, 2025).
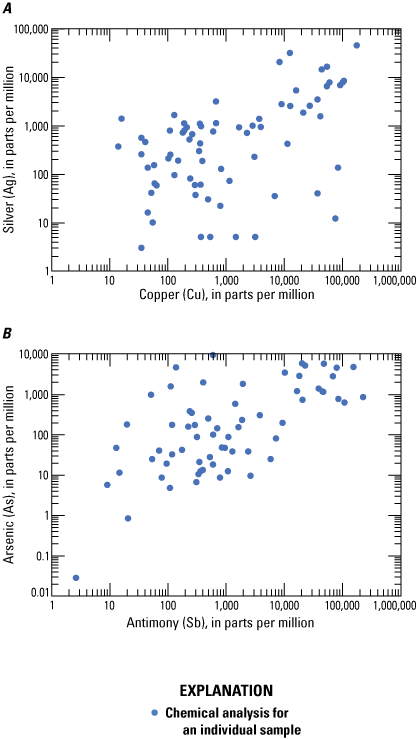
Log-log plots displaying positive correlations between A, silver and copper and B, arsenic and antimony in silver-rich veins from Coeur d’Alene-type deposits. Based on geochemical data from Granitto and others (2020, 2021, 2025).
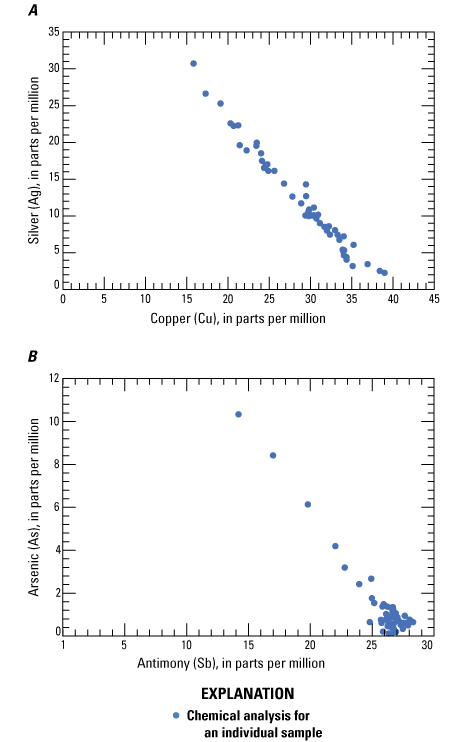
Log-log plots of A, silver plotted against copper and B, arsenic plotted against antimony for tetrahedrite from Coeur d’Alene-type deposits. Data from O’Leary and Sack (1987), Sack and others (2002, 2005), and references therein.
Using a limited dataset, Long (1998a) showed that there is neither a significant correlation among silver, lead, or zinc grades for lead-zinc veins, nor among silver, copper, and lead grades for silver veins. The additional dataset analyzed in this report supports the assertions made by Long (1998a). The strongest positive correlation coefficients with silver in Coeur d’Alene-type deposits (table 4) are for gold (0.80), copper (0.63), and palladium (0.63); the strongest positive correlation coefficients with zinc are sulfur (0.90), cadmium (0.77), and indium (0.46); the strongest positive correlation coefficient with lead is sulfur (0.27); and the strongest positive correlation coefficients with antimony are copper (0.75), gold (0.60), and silver (0.49).
Tetrahedrite ([Cu,Fe,Zn,Ag]12[Sb,As]4S13) is the main ore mineral for silver (table 3). Although the chemical formula for the tetrahedrite series of minerals contains copper, iron, zinc, antimony, and arsenic, there is no demonstrated correlation with silver and iron or zinc in ore. There is a demonstrated positive correlation between silver and copper (0.63), and arsenic and antimony in ore (fig. 13) even though tetrahedrite crystals display negative correlations between silver and copper (−0.987) and arsenic and antimony (−0.958; fig. 14) because of elemental substitutions in the tetrahedrite crystal structure (for example, Biagioni and others, 2020). Fryklund (1964) hypothesized that significant bismuth and mercury may be found within tetrahedrite ore, although the correlation coefficient between bismuth and silver is low and mercury was not analyzed.
Abundant carbonate phases, including siderite, dolomite, and calcite compose much of the gangue in Coeur d’Alene-type deposits. Calculated correlation coefficients between carbon and iron (0.77), carbon and manganese (0.80), and iron and manganese (0.67) indicate that siderite (FeCO3) is the main residence of iron and manganese (table 4). Critical minerals that may be minor constituents in sphalerite include gallium, germanium, indium, and manganese (Cook and others, 2009). The weak negative correlation between zinc and manganese (−0.34) in ore indicates that manganese does not reside in sphalerite. The low correlation coefficients between zinc and gallium (0.19) and zinc and germanium (0.20), together with the low median concentrations of gallium (6 ppm) and germanium (2 ppm) in zinc ore, suggest that these critical minerals would unlikely be economic to recover.
Discussion—Potential Recovery of Critical Minerals
Pitcairn and others (2006) showed that many elements, including antimony, arsenic, cadmium, gold, silver, and tungsten are released from a rock package undergoing prograde metamorphism and are then concentrated within an ascending package of metamorphic-hydrothermal fluid. Because metals are introduced into mineralized veins from hydrothermal fluids, there may be compositional correlation among metals in orogenic gold deposits. However, some of these metals are liberated from different source rocks during reactions occurring at different temperatures and, therefore, also precipitate out of solution at differing temperatures and depths compared to gold. For example, the lack of correlation between gold and antimony results from different depths and temperatures of their precipitation from the hydrothermal fluid (Groves and others, 1998).
Alternatively, some metals that are enriched and show a positive correlation with gold content are derived from the surrounding host rock. For example, Goldfarb and others (1997) and Haeberlin and others (2003, 2004) used lead isotopes of ore minerals in Phanerozoic deposits to show correlations with host rock and heterogeneities within individual districts that have diverse host rock types. Serpentinite host rocks would therefore offer ores that may be more enriched in metals like nickel and cobalt than ores hosted in granitoids (Taylor and others, 2021).
The most enriched critical minerals within orogenic mineral systems include antimony, arsenic, cobalt, manganese, tellurium, and tungsten. Arsenic occurs in common arsenopyrite and arsenic-rich pyrite; antimony is in stibnite; tellurium is in gold-, silver-, lead-, and nickel-bearing telluride minerals; and tungsten is in scheelite (table 3). Elemental correlations between gold and metals sourced in the host rock, such as lead, nickel, and cobalt, are dependent upon the type of host rock and relate to fluid–rock interaction that leads to gold precipitation along with other ore minerals such as galena and nickel- and cobalt-bearing pyrite. Cobalt and nickel are in growth zones in pyrite that are interpreted to indicate periods of significant fluid–rock interaction in veins hosted by mafic to ultramafic rocks, as exemplified at Grass Valley, Calif. (Taylor and others, 2021). Local fluid–rock interaction has also been interpreted as the cause of cobalt mineralization in orogenic gold deposits in northern Finland (Witt and others, 2020). Additionally, cobalt may be in pyrrhotite, pentlandite, or as cobaltite. The data in this study indicate that antimony, arsenic, cobalt, tellurium, and tungsten could potentially be recovered from orogenic gold ores.
Tungsten (for example, in Grass Valley, Calif.) and antimony (for example, in Woxi, China) have been produced from orogenic gold mines and continue to be a potential critical mineral byproduct of future resource extraction. Although gold tellurides may comprise a significant gold resource in many orogenic gold deposits, tellurium has not been produced (Goldfarb and others, 2017).
Using the ratio between median concentrations of critical minerals (CM) to gold (CM/Au), and multiplying this ratio by gold production and resources, an estimate of critical minerals that could potentially be recovered from orogenic gold deposits can be reached. Because byproducts are produced from ore, only data for samples with more than 0.5 ppm gold are used. We focus on the Idaho-Maryland mine because 41 of the 66 samples with gold values greater than the cutoff are from the Idaho-Maryland mine, and its production and resources are well constrained unlike historical gold mines in California.
From 1866 to 1955, the Idaho-Maryland mine produced 2,414,000 ounces of gold (Kulla, 2017). Total measured plus indicated mineral resources as of 2007 for the Idaho-Maryland mine indicate an additional 1,002,000 ounces of gold (Pease, 2009). In total, production plus measured plus indicated mineral resources equals 3,416,000 ounces of gold. The potential dollar value based upon the annual average commodity price from 2021 (USGS, 2022b) for antimony, arsenic, cobalt, tellurium, and tungsten from tailings (previous gold production) and remaining resources is more than $21.5 million U.S. dollars (table 9).
Table 9.
Estimated tonnes of contained gold, arsenic, cobalt, antimony, tellurium, and tungsten from the Idaho-Maryland mine in Grass Valley, California.[Element ratios are median ratios. Total commodity value based on calculated total content and 2021 annual average price for the commodity (U.S. Geological Survey, 2022b). Compositional data are from Granitto and others (2020, 2021, 2025), production data are from Kulla (2017), and resource data are from Pease (2009). t, tonnes; USD, U.S. dollars; /, per; Abbreviations of chemical elements as follows: As, arsenic; Au, gold; Co, cobalt; Sb, antimony; Te, tellurium; W, tungsten]
This study indicates that the zinc-rich veins in Coeur d’Alene-type mineral systems contain insignificant amounts of bismuth (median value of 0.95 ppm), gallium (median value of 6.02 ppm), germanium (median value of 2 ppm), and indium (median value of 2.55 ppm), although zinc is considered a critical mineral and is found at elevated concentrations (table 8). However, manganese and antimony and minor amounts of arsenic could be recovered from silver-rich veins if mineral processing procedures are optimized for their recovery. Antimony resources also reside in stibnite veins.
Using the ratio of median concentrations of critical minerals to those of silver and zinc (CM/Ag and CM/Zn) and multiplying these ratios by silver and zinc production and resources, respectively, allows for the calculation of an estimate of critical minerals that could potentially be recovered as byproducts from Coeur d’Alene-type mineral systems. Because byproducts are produced from ore, only data for samples greater than 250 parts per million silver are used. Our dataset includes 44 silver-rich samples from the Coeur d’Alene district that are used for these calculations (table 10).
Table 10.
Estimated tonnes of manganese, antimony, and arsenic released in mine waste from silver-rich ore from the Coeur d'Alene area.[Element ratios are median ratios. Total commodity value based on calculated total content and 2021 annual average price for the commodity (U.S. Geological Survey, 2022b). Compositional data are from Granitto and others (2020, 2021, 2025) and production data are from Long (1998b); t, tonnes; USD, U.S. dollars; /, per; Abbreviations of chemical elements as follows: Ag, silver; As, arsenic; Mn, manganese; Sb, antimony; Zn, zinc]
From the discovery of the Coeur d’Alene ores in 1883 through 1997, 34,300 tonnes of silver and 2,870,000 tonnes of zinc were produced (Long, 1998b). Production has continued since 1997 and is still ongoing as of 2025, so these values are minimums, and additional resources still exist. For our calculations, however, the 1883–1997 production values from Long (1998b) will be used for an estimate of antimony, arsenic, and manganese contents. Although a few mines produced antimony as a primary commodity, our calculated antimony values are only as a byproduct of silver-rich ore. The U.S. Antimony mine, which is considered the second largest quartz-stibnite vein deposit in the United States, has production and reserves of 15,400 tonnes of antimony (Hofstra and others, 2013). For comparison, our calculations estimate more than 45,500 tonnes of antimony as a potential byproduct of silver mining in Coeur d’Alene-type polymetallic sulfide ore. The potential dollar value based upon the annual average commodity price from 2021 (USGS, 2022b) for antimony, arsenic, and manganese for these critical mineral quantities that may remain in the tailings and waste is more than $525 million U.S. dollars. In addition, a minimum of 650,000 tonnes of zinc with a potential dollar value of more than $2 billion U.S. dollars (based on the annual average commodity price from 2021 [$1.45 per pound]) were disposed of downstream of mining activity (Long, 1998b).
Tailings found in the Coeur d’Alene region may be isolated in tailings impoundments, but a large total mass of the historically produced tailings were released and reside in the downstream channels, floodplains, and interconnected lakes of the Coeur d’Alene River Basin. Of the approximately 110 million tonnes of tailings material that was produced into the 1990s, it was estimated that 50–60 percent was discharged into the Coeur d’Alene River or its associated tributaries, and the remainder remains in dumps or impoundments or was backfilled into underground mine workings (Long, 1998b). The deleterious effects toward the environment of the downstream disposal of tailings necessitates proper mitigation, and superfund cleanup has already begun to consolidate tailings and waste rock from the Coeur d’Alene River Basin into centralized impoundment areas (U.S. Environmental Protection Agency, 2017). Reprocessing this material for primary commodities, along with the expected quantities of critical minerals, could potentially contribute to funding this cleanup.
Conclusions
Deposit types in orogenic gold and Coeur d’Alene-type systems are exploited for precious and base metals, but potential exists to also produce critical minerals to meet current (2025) societal needs in the United States. Publicly available geochemical data compiled for these mineral systems coupled with mineralogical characteristics, indicate that the following minerals could potentially be recovered from unmined resources and processed mine waste: arsenic, antimony, tellurium, cobalt, and tungsten from orogenic gold systems and zinc, antimony, arsenic, and manganese from Coeur d’Alene-type systems. These critical minerals reside primarily in arsenopyrite (arsenic), scheelite (tungsten), siderite (manganese), sphalerite (zinc), tetrahedrite (antimony and arsenic), stibnite (antimony), and telluride (tellurium) minerals.
References Cited
Beaudoin, G., and Sangster, D.F., 1992, A descriptive model for silver-lead-zinc veins in clastic metasedimentary terranes: Economic Geology, v. 87, no. 4, p. 1005–1021, accessed November 2023 at https://doi.org/10.2113/gsecongeo.87.4.1005.
Bennett, E.H., and Venkatakrishnan, R., 1982, A palinspastic reconstruction of the Coeur d’Alene mining district based on ore deposits and structural data: Economic Geology, v. 77, no. 8, p. 1851–1866, accessed November 2023 at https://doi.org/10.2113/gsecongeo.77.8.1851.
Biagioni, C., George, L.L., Cook, N.J., Makovicky, E.,Moëlo, Y., Pasero, M., Sejkora, J., Stanley, C.J., Welch, M.D., and Bosi, F., 2020, The tetrahedrite group—Nomenclature and classification: American Mineralogist, v. 105, no. 1, p. 109–122, accessed November 2023 at https://doi.org/10.2138/am-2020-7128.
Bliss, J.D., 1986, Grade and tonnage model of low-sulphide Au-quartz veins, in Cox, D.P. and Singer, D.A., eds., Mineral deposit models: U.S. Geological Survey Bulletin 1693, p. 239–243, accessed September 2023 at https://pubs.usgs.gov/bul/b1693/.
Böhlke, J.K., 1988, Carbonate-sulfide equilibria and “stratabound” disseminated epigenetic gold mineralization—A proposal based on examples from Alleghany, California, U.S.A.: Applied Geochemistry, v. 3, no. 5, p. 499–516, accessed September 2023 at https://doi.org/10.1016/0883-2927(88)90022-4.
Boleneus, D.E., Applegate, L.M., Stewart, J.H., and Zientek, M.L., 2005, Stratabound copper-silver deposits of the Mesoproterozoic Revett Formation, Montana and Idaho: U.S. Geological Survey Scientific Investigations Report 2005–5231, 60 p., 3 pls, accessed November 2023 at https://doi.org/10.3133/sir20055231.
Constantopoulos, J., 1994, Oxygen isotope geochemistry of the Coeur d’Alene mining district, Idaho: Economic Geology, v. 89, no. 4, p. 944–951, accessed November 2023 at https://doi.org/10.2113/gsecongeo.89.4.944.
Constantopoulos, J., and Larson, P.B., 1991, Oxygen and hydrogen isotope geochemistry of the Star-Morning mine, Coeur d’Alene district, Idaho: Geology, v. 19, no. 2, p. 131–134, accessed November 2023 at https://doi.org/10.1130/0091-7613(1991)019<0131:OAHIGO>2.3.CO;2.
Cook, N.J., Ciobanu, C.L., Pring, A., Skinner, W., Shimizu, M., Danyushevsky, L., Saini-Eidukat, B., and Melcher, F., 2009, Trace and minor elements in sphalerite—A LA–ICPMS study: Geochimica et Cosmochimica Acta, v. 73, no. 16, p. 4761–4791, accessed December 2023 at https://doi.org/10.1016/j.gca.2009.05.045.
Cox, D.P., and Singer, D.A., eds., 1986, Mineral deposit models: U.S. Geological Survey Bulletin 1693, [variously paged], accessed September 2023 at https://pubs.usgs.gov/bul/b1693/.
Cox, S.F., 2016, Injection-driven swarm seismicity and permeability enhancement—Implications for the dynamics of hydrothermal ore systems in high fluid-flux, overpressured faulting regimes—An invited paper: Economic Geology, v. 111, no. 3, p. 559–587, accessed September 2023 at https://doi.org/10.2113/econgeo.111.3.559.
Cox, S.F., Knackstedt, M.A., and Baun, J., 2001, Principles of structural control on permeability and fluid flow in hydrothermal systems: Reviews in Economic Geology, v. 14, p. 1–24, accessed September 2023 at https://doi.org/10.5382/Rev.14.01.
Cox, S.F., Wall, V.J., Etheridge, M.A., and Potter, T.F., 1991, Deformational and metamorphic processes in the formation of mesothermal vein-hosted gold deposits—Examples from the Lachlan fold belt in central Victoria, Australia: Ore Geology Reviews, v. 6, no. 5, p. 391–423, accessed September 2023 at https://doi.org/10.1016/0169-1368(91)90038-9.
Davies, R.S., Groves, D.I., Trench, A., Dentith, M., and Sykes, J.P., 2020, Appraisal of the USGS Three-Part Mineral Resource Assessment through estimation of the orogenic gold endowment of the Sandstone Greenstone Belt, Yilgarn Craton, Western Australia: Mineralium Deposita, v. 55, p. 1009–1028, accessed December 2023 at https://doi.org/10.1007/s00126-019-00916-1.
Day, W.C., 2019, The Earth Mapping Resources Initiative (Earth MRI)—Mapping the Nation’s critical mineral resources (ver. 1.2, September 2019): U.S. Geological Survey Fact Sheet 2019–3007, 2 p., accessed September 11, 2023, at https://doi.org/10.3133/fs20193007.
Dominy, S.C., 2014, Predicting the unpredictable—Evaluating high-nugget effect gold deposits, in Monitoring and exploiting the reserve, chap. 8 of Mineral resource and ore reserve estimation: Melbourne, Australia, Australasian Institute of Mining and Metallurgy, p. 659–678, accessed February 2025 at http://cdn.ceo.ca.s3-us-west-2.amazonaws.com/1esojp7-2014_D_NuggetevaluationMONO30%20%281%29.pdf.
Ellis, S., and Deschênes, G., 2016, Chapter 51—Treatment of gold-telluride ores, chap. 51 of Adams, M.D. ed., Gold ore processing—Project development and operations (2d ed.): Elsevier, p. 919–926, accessed September 2023 at https://doi.org/10.1016/B978-0-444-63658-4.00051-7.
Elmer, F.L., White, R.W., and Powell, R., 2006, Devolatilization of metabasic rocks during greenschist-amphibolite facies metamorphism: Journal of Metamorphic Geology, v. 24, no. 6, p. 497–513, accessed September 2023 at https://doi.org/10.1111/j.1525-1314.2006.00650.x.
Fleck, R.J., Criss, R.E., Eaton, G.F., Cleland, R.W., Wavra, C.S., and Bond, W.D., 2002, Age and origin of base and precious metal veins of the Coeur d’Alene mining district, Idaho: Economic Geology, v. 97, no. 1, p. 23–42, accessed November 2023 at https://doi.org/10.2113/gsecongeo.97.1.23.
Fortier, S.M., Nassar, N.T., Lederer, G.W., Brainard, J., Gambogi, J., and McCullough, E.A., 2018, Draft critical mineral list—Summary of methodology and background information—U.S. Geological Survey technical input document in response to Secretarial Order No. 3359: U.S. Geological Survey Open-File Report 2018–1021, 15 p., accessed April 18, 2020, at https://doi.org/10.3133/ofr20181021.
Frimmel, H.E., 2008, Earth’s continental crustal gold endowment: Earth and Planetary Science Letters, v. 267, no. 1–2, p. 45–55, accessed September 2023 at https://doi.org/10.1016/j.epsl.2007.11.022.
Fryklund, V.C., 1964, Ore deposits of the Coeur d’Alene district, Shoshone County, Idaho: U.S. Geological Survey Professional Paper 445, 103 p., accessed November 2023 at https://doi.org/10.3133/pp445.
Fryklund, V.C., and Harner, R.S., 1955, Comments on minor elements in pyrrhotite: Economic Geology, v. 50, no. 3, p. 339–344, accessed December 2023 at https://doi.org/10.2113/gsecongeo.50.3.339.
Goldfarb, R.J., Baker, T., Dubé, B., Groves, D.I., Hart, C.J.R., and Gosselin, P., 2005, Distribution, character, and genesis of gold deposits in metamorphic terranes, chap. 14 of Hedenquist, J.W., Thompson, J.F.H., Goldfarb, R.J., and Richards, J.P., eds., Economic Geology 100th anniversary volume: Society of Economic Geologists, p. 407–450.
Goldfarb, R.J., Berger, B.R., George, M.W., and Seal, R.R., II, 2017, Tellurium, chap. R of Schulz, K.J., DeYoung, J.H., Jr., Seal, R.R., II, and Bradley, D.C., eds., Critical mineral resources of the United States—Economic and environmental geology and prospects for future supply: U.S. Geological Survey Professional Paper 1802, p. R1–R27, accessed December 13, 2023, at https://doi.org/10.3133/pp1802.
Goldfarb, R.J., and Groves, D.I., 2015, Orogenic gold—Common or evolving fluid and metal sources through time: Lithos, v. 233, p. 2–26, accessed September 2023 at https://doi.org/10.1016/j.lithos.2015.07.011.
Goldfarb, R.J., Groves, D.I., and Gardoll, S., 2001, Orogenic gold and geologic time—A global synthesis: Ore Geology Reviews, v. 18, no. 1–25, p. 1–75, accessed September 2023 at https://doi.org/10.1016/S0169-1368(01)00016-6.
Goldfarb, R.J., Miller, L.D., Leach, D.L., and Snee, L.W., 1997, Gold deposits in metamorphic rocks of Alaska, chap. 6 of Goldfarb, R.J., and Miller, L.D., eds., Mineral deposits of Alaska: Economic Geology Monograph Series, v. 9, p. 151–190, accessed September 2023 at https://doi.org/10.5382/Mono.09.07.
Granitto, M., Emsbo, P., Hofstra, A.H., Orkild-Norton, A.R., Bennett, M.M., Azain, J.S., Koenig, A.E., and Karl, N.A., 2020, Global geochemical database for critical minerals in archived mine samples: U.S. Geological Survey data release, accessed December 13, 2023, at https://doi.org/10.5066/P9Z3XL6D.
Granitto, M., Hofstra, A.H., and Taylor, R.D., 2025, National Geochemical Database on Ore Deposits—New data featuring fusion digestion analytical methods: U.S. Geological Survey data release, https://doi.org/10.5066/P1M9HNMW.
Granitto, M., Schmidt, D.E., Karl, N.A., and Khoury, R.M., 2021, National Geochemical Database on Ore Deposits—Legacy data: U.S. Geological Survey data release, accessed December 13, 2023, at https://doi.org/10.5066/P944U7S5.
Groves, D.I., Goldfarb, R.J., Gebre-Mariam, M., Hagemann, S.G., and Robert, F., 1998, Orogenic gold deposits—A proposed classification in the context of their crustal distribution and relationship to other gold deposit types: Ore Geology Reviews, v. 13, no. 1–5, p. 7–27, accessed September 2023 at https://doi.org/10.1016/S0169-1368(97)00012-7.
Groves, D.I., Phillips, G.N., Ho, S.E., Houstoun, S.M, and Standing, C.A., 1987, Craton-scale distribution of Archaean greenstone gold deposits—Predictive capacity of the metamorphic model: Economic Geology, v. 82, no. 8, p. 2045–2058, accessed September 2023 at https://doi.org/10.2113/gsecongeo.82.8.2045.
Groves, D.I., Santosh, M., Deng, J., Wang, Q., Yang, L., and Zhang, L., 2020, A holistic model for the origin of orogenic gold deposits and its implications for exploration: Mineralium Deposita, v. 55, p. 275–292, accessed November 2023 at https://doi.org/10.1007/s00126-019-00877-5.
Haeberlin, Y., Moritz, R., and Fontboté, L., 2003, Paleozoic orogenic gold deposits in the eastern Central Andes and its foreland, South America: Ore Geology Reviews, v. 22, no. 1–2, p. 41–59, accessed October 2023 at https://doi.org/10.1016/S0169-1368(02)00108-7.
Haeberlin, Y., Moritz, R., Fontboté, L., and Cosca, M., 2004, Carboniferous orogenic gold deposits at Pataz, eastern Andean Cordillera, Peru—Geological and structural framework, paragenesis, alteration, and 40Ar/39Ar geochronology: Economic Geology, v. 99, no. 1, p. 73–112, accessed September 2023 at https://doi.org/10.2113/gsecongeo.99.1.73.
Hammerli, J., Spandler, C., Oliver, N.H.S., Sossi, P., and Dipple, G.M., 2015, Zn and Pb mobility during metamorphism of sedimentary rocks and potential implications for some base metal deposits: Mineralium Deposita, v. 50, p. 657–664, accessed December 2023 at https://doi.org/10.1007/s00126-015-0600-5.
Harrison, J.E., Leach, D.L., and Kleinkpf, M.D., 1986, Resource appraisal maps for mesothermal base- and precious-metal veins in the Wallace 1° x 2° quadrangle, Montana and Idaho: U.S. Geological Survey Miscellaneous Investigations Series IMAP 1509–I, scale 1:250,000, accessed November 2023 at https://pubs.usgs.gov/publication/i1509I.
Heinchon, S.H., 2019, Metal and mineral zoning and ore paragenesis at the Kensington Au-Te deposit, SE Alaska: Fairbanks, Alaska, University of Alaska Fairbanks, M.S. thesis, 208 p., accessed September 2023 at http://hdl.handle.net/11122/10504.
Hofstra, A.H., and Kreiner, D.C., 2020, Systems-deposits-commodities-critical minerals table for the Earth Mapping Resources Initiative: U.S. Geological Survey Open-File Report 2020–1042, 24 p., accessed September 11, 2023, at https://doi.org/10.3133/ofr20201042.
Hofstra, A.H., Marsh, E.E., Todorov, T.I., and Emsbo, P., 2013, Fluid inclusion evidence for a genetic link between simple antimony veins and giant silver veins in the Coeur d’Alene mining district, ID and MT, USA: Geofluids, v. 13, no. 4, p. 475–493, accessed November 2023 at https://doi.org/10.1111/gfl.12036.
Hu, Z., and Gao, S., 2008, Upper crustal abundances of trace elements—A revision and update: Chemical Geology, v. 253, no. 3–4, p. 205–221, accessed March 2022 at https://doi.org/10.1016/j.chemgeo.2008.05.010.
Israel Science and Technology, 2007, List of periodic table elements sorted by abundance in the Earth’s crust: Israel Science and Technology, accessed March 2, 2022, at https://www.science.co.il/elements/.
Kulla, G., 2017, Technical report on the Idaho-Maryland project—Grass Valley California, USA: Rise Gold Corp., prepared by Amec Foster Wheeler, 179 p, accessed June 2022 at https://www.risegoldcorp.com/uploads/content/I-M_Tech_Report.pdf.
Leach, D.L., Hofstra, A.H., Church, S.E., Snee, L.W., Vaughn, R.B., and Zartman, R.E., 1998, Evidence for Proterozoic and Late Cretaceous-early Tertiary ore-forming events in the Coeur d’Alene district, Idaho and Montana: Economic Geology, v. 93, no. 3, p. 347–359, accessed November 2023 at https://doi.org/10.2113/gsecongeo.93.3.347.
Leach, D.L., Landis, G.P., and Hofstra, A.H., 1988, Metamorphic origin of the Coeur d’Alene base- and precious-metal veins in the Belt Basin, Idaho and Montana: Geology, v. 16, no. 2, p. 122–125, accessed October 2023 at https://doi.org/10.1130/0091-7613(1988)016<0122:MOOTCD>2.3.CO;2.
Long, K.R., DeYoung, J.H., Jr., and Ludington, S., 1998, Database of significant deposits of gold, silver, copper, lead, and zinc in the United States: U.S. Geological Survey Open-File Report 98–206–A,B, 60 p., accessed August 2022 at https://doi.org/10.3133/ofr98206AB.
Loucks, R.R., and Mavrogenes, J.A., 1999, Gold solubility in supercritical hydrothermal brines measured in synthetic fluid inclusions: Science, v. 284, no. 5423, p. 2159–2163, accessed September 2023 at https://doi.org/10.1126/science.284.5423.2159.
Mauk, J.L., and White, B.G., 2004, Stratigraphy of the Proterozoic Revett Formation and its control on Ag-Pb-Zn vein mineralization in the Coeur d’Alene district, Idaho: Economic Geology, v. 99, no. 2, p. 295–312, accessed October 2023 at https://doi.org/10.2113/gsecongeo.99.2.295.
Nassar, N.T., and Fortier, S.M., 2021, Methodology and technical input for the 2021 review and revision of the U.S. Critical Minerals List: U.S. Geological Survey Open-File Report 2021–1045, 31 p., accessed December 13, 2023, at https://doi.org/10.3133/ofr20211045.
O’Leary, M.J., and Sack, R.O., 1987, Fe-Zn exchange reaction between tetrahedrite and sphalerite in natural environments: Contributions to Mineralogy and Petrology, v. 96, p. 415–425, accessed December 2023 at https://doi.org/10.1007/BF01166687.
Phillips, G.N., and Groves, D.I., 1983, The nature of Archaean gold-bearing fluids as deduced from gold deposits of Western Australia: Journal of the Geological Society of Australia, v. 30, no. 1–2, p. 25–39, accessed August 2023 at https://doi.org/10.1080/00167618308729234.
Phillips, G.N., and Powell, R., 2010, Formation of gold deposits—A metamorphic devolatilization model: Journal of Metamorphic Geology, v. 28, no. 6, p. 689–718, accessed August 2023 at https://doi.org/10.1111/j.1525-1314.2010.00887.x.
Pitcairn, I.K., Craw, D., and Teagle, D.A.H., 2015, Metabasalts as sources of metals in orogenic gold deposits: Mineralium Deposita, v. 50, p. 373–390, accessed September 2023 at https://doi.org/10.1007/s00126-014-0547-y.
Pitcairn, I.K., Olivo, G.R., Teagle, D.A.H., and Craw, D., 2010, Sulfide evolution during prograde metamorphism of the Otago and Alpine schists, New Zealand: The Canadian Mineralogist, v. 48, no. 5, p. 1267–1295, accessed September 2023 at https://doi.org/10.3749/canmin.48.5.1267.
Pitcairn, I.K., Teagle, D.A.H., Craw, D., Olivo, G.R., Kerrich, R., and Brewer, T.S., 2006, Sources of metals and fluids in orogenic gold deposits—Insights from the Otago and Alpine Schists, New Zealand: Economic Geology, v. 101, no. 8, p. 1525–1546, accessed September 2023 at https://doi.org/10.2113/gsecongeo.101.8.1525.
Powell, R., Will, T.M., and Phillips, G.N., 1991, Metamorphism in Archaean greenstone belts—Calculated fluid compositions and implications for gold mineralization: Journal of Metamorphic Geology, v. 9, no. 2, p. 141–150, accessed September 2023 at https://doi.org/10.1111/j.1525-1314.1991.tb00510.x.
Ramos, F.C., and Rosenberg, P.E., 2012, Age and origin of quartz-carbonate veins associated with the Coeur d’Alene mining district, Idaho and western Montana—Insights from isotopes and rare earth elements: Economic Geology, v. 107, no. 6, p. 1321–1339, accessed December 2023 at https://doi.org/10.2113/econgeo.107.6.1321.
Rudnick, R.L., and Gao, S., 2014, 4.1—Composition of the continental crust, chap. 4 of Holland, H.D., and Turekian, K.K., eds., Treatise on geochemistry (2d ed.): Oxford, Pergamon Press, v. 4, 51 p., accessed March 2022 at https://doi.org/10.1016/B978-0-08-095975-7.00301-6.
Sack, R.O., Fredericks, R., Hardy, L.S., and Ebel, D.S., 2005, Origin of high-Ag fahlores from the Galena mine, Wallace, Idaho, U.S.A.: American Mineralogist, v. 90, no. 5–6, p. 1000–1007, accessed December 2023 at https://doi.org/10.2138/am.2005.1651.
Sack, R.O., Kuehner, S.M., and Hardy, L.S., 2002, Retrograde Ag-enrichment in fahlores from the Coeur d’Alene mining district, Idaho, USA: Mineralogical Magazine, v. 66, no. 1, p. 215–229, accessed December 2023 at https://doi.org/10.1180/0026461026610024.
Sibson, R.H., 1987, Earthquake rupturing as a mineralizing agent in hydrothermal systems: Geology, v. 15, no. 8, p. 701–704, accessed July 2023 at https://pubs.geoscienceworld.org/gsa/geology/article-abstract/15/8/701/204481/Earthquake-rupturing-as-a-mineralizing-agent-in?redirectedFrom=fulltext.
Sibson, R.H., Robert, F., and Poulsen, K.H., 1988, High-angle reverse faults, fluid-pressure cycling, and mesothermal gold-quartz deposits: Geology, v. 16, no. 6, p. 551–555, accessed July 2023 at https://pubs.geoscienceworld.org/gsa/geology/article-abstract/16/6/551/190624/High-angle-reverse-faults-fluid-pressure-cycling?redirectedFrom=fulltext.
Taylor, R.D., Monecke, T., Reynolds, T.J., and Monecke, J., 2021, Paragenesis of an orogenic gold deposit—New insights on mineralizing processes at the Grass Valley district, California: Economic Geology, v. 116, no. 2, p. 323–356. [Also available at https://doi.org/10.5382/econgeo.4794.]
Tomkins, A.G., 2010, Windows of metamorphic sulfur liberation in the crust—Implications for gold deposit genesis: Geochimica et Cosmochimica Acta, v. 74, no. 11, p. 3246–3259, accessed August 2023 at https://doi.org/10.1016/j.gca.2010.03.003.
Turneaure, F.S., 1955, Metallogenic provinces and epochs, chap. 2 of Bateman, A.M., Ferguson, H.G., Chace, F.M., Burbank, W., McKinstry, H.E., Leighton, M.M., Noble, J., Broderick, T.M., Davidson, D.H., DeFord, R.K., Harder, E.C., Jahns, R.H., Legget, R.F., Sayer, A.N., and Schwartz, G.M., Economic Geology fiftieth anniversary volume—1905–1955: Lancaster, Pa., Lancaster Press, Inc., p. 38–98.
U.S. Department of Energy, 2021, Department of Energy launches Minerals Sustainability Division to enable the ongoing transformation of the U.S. energy system and help secure a U.S. critical minerals supply chain: U.S. Department of Energy, January 15, 2023, accessed September 11, 2023, at https://www.energy.gov/articles/department-energy-launches-minerals-sustainability-division-enable-ongoing-transformation.
U.S. Department of the Interior, 2017, Critical mineral independence and security: U.S. Department of the Interior, Secretarial Order no. 3359, 2 p., accessed December 13, 2023, at https://www.doi.gov/sites/doi.gov/files/uploads/so_criticalminerals.pdf.
U.S. Environmental Protection Agency, 2017, Superfund cleanup implementation plan, 2016–2025—Bunker Hill Mining and Metallurgical Complex superfund site: U.S. Environmental Protection Agency, 124 p., accessed September 11, 2023, at https://semspub.epa.gov/work/10/100038724.pdf.
U.S. Geological Survey [USGS], 2022a, U.S. Geological Survey releases 2022 list of critical minerals: U.S. Geological Survey, February 22, 2022, accessed September 11, 2023, at https://www.usgs.gov/news/national-news-release/us-geological-survey-releases-2022-list-critical-minerals.
U.S. Geological Survey [USGS], 2022b, Mineral commodity summaries 2022: U.S. Geological Survey, 202 p., accessed September 11, 2023, at https://doi.org/10.3133/mcs2022.
Wallace, C.A., Lidke, D.J., and Schmidt, R.G., 1990, Faults of the central part of the Lewis and Clark line and fragmentation of the Late Cretaceous foreland basin in west-central Montana: GSA Bulletin, v. 102, no. 8, p. 1021–1037, accessed October 2023 at https://pubs.geoscienceworld.org/gsa/gsabulletin/article-abstract/102/8/1021/182450/Faults-of-the-central-part-of-the-Lewis-and-Clark?redirectedFrom=f ulltext.
Werner, T.T., Mudd, G.M., and Jowitt, S.M., 2017, The world’s by-product and critical metal resources—Part II—A method for quantifying the resources of rarely reported metals: Ore Geology Reviews, v. 80, p. 658–675, accessed July 2023 at https://doi.org/10.1016/j.oregeorev.2016.08.008.
Witt, W.K., Hagemann, S.G., Roberts, M., and Davies, A., 2020, Cobalt enrichment at the Juomasuo and Hangaslampi polymetallic deposits, Kuusamo Schist Belt, Finland—A role for an orogenic gold fluid?: Mineralium Deposita, v. 55, p. 381–388, accessed September 2023 at https://doi.org/10.1007/s00126-019-00943-y.
Wyman, D.A., Cassidy, K.F., and Hollings, P., 2016, Orogenic gold and the mineral systems approach—Resolving fact, fiction and fantasy: Ore Geology Reviews, v. 78, p. 322–335, accessed August 2023 at https://doi.org/10.1016/j.oregeorev.2016.04.006.
Yang, W., Lan, X., Wang, Q., Dong, P., and Wang, G., 2021 Selective pre-leaching of tellurium from telluride-type gold concentrate: Frontiers in Chemistry, v. 9, 10 p., accessed September 2023 at https://doi.org/10.3389/fchem.2021.593888.
Zartman, R.E., and Stacey, J.S., 1971, Lead isotopes and mineralization ages in Belt supergroup rocks, northwestern Montana and northern Idaho: Economic Geology, v. 66, no. 6, p. 849–860, accessed October 2023 at https://doi.org/10.2113/gsecongeo.66.6.849.
Zhang, J., Zhang, Y., Richmond, W., and Wang, H.-p., 2010, Processing technologies for gold-telluride ores: International Journal of Minerals, Metallurgy, and Materials, v. 17, p. 1–10, accessed September 2023 at https://doi.org/10.1007/s12613-010-0101-6.
Appendix 1. Descriptions for Coeur d’Alene-Type and Orogenic Gold Ore Samples Used in this Study
Table 1.1.
Information on orogenic gold ore samples included in this study.[Geochemical results are in Granitto and others (2020, 2021, 2025). ID, identification; S, south; ft, foot; —, no data; No., number; approx., approximately; Mtns, mountains; WYOD, Work Your Own Diggings]
| Collection ID | State | District | Deposit or mine | Sample description |
|---|---|---|---|---|
| OD14855 | S. Dak. | Terraville-Homestake | Homestake mine | 3,800 ft level, drift S of 49 crosscut |
| OD11950 | S. Dak. | Terraville-Homestake | Homestake mine | 2,300 ft level, 26 pillar main ledge ore body |
| OD11902 | S. Dak. | Terraville-Homestake | Homestake mine | 2,450 ft level |
| 11052 | S. Dak. | Terraville-Homestake | Homestake mine | — |
| 11044 | S. Dak. | Terraville-Homestake | Homestake mine | Below water line |
| JAR4 | Mont. | Jardine-Crevasse | Jardine mine | — |
| OD22224 | Alaska | Treadwell | Juneau | Dump outside mouth of tunnel |
| OD11904 | S. Dak. | Terraville-Homestake | Homestake mine | 1,700 ft level |
| AL4 | Alaska | Juneau | Treadwell | — |
| 11054 | S. Dak. | Terraville-Homestake | Homestake mine | Homestake |
| 21830 | S. Dak. | Terraville-Homestake | Homestake mine | Ore face |
| 11034 | S. Dak. | Terraville-Homestake | Homestake mine | Homestake |
| 23424 | S. Dak. | Terraville-Homestake | Homestake mine | No. 11 ledge, 3,800 ft level |
| 19294 | S. Dak. | Terraville-Homestake | Homestake mine | 7,850 level, 25A top stope, 19 ledge |
| OD22208 | Alaska | Juneau | Perseverance | — |
| OD14851 | S. Dak. | Terraville-Homestake | Homestake mine | 3,350 ft level, 16C stope 9 ledge ore body |
| OD11940 | S. Dak. | Terraville-Homestake | Homestake mine | 1,700 ft level, 14 pillar main ledge ore body |
| OD11931 | S. Dak. | Terraville-Homestake | Homestake mine | 5,000 ft level, south drift |
| OD11943 | S. Dak. | Terraville-Homestake | Homestake mine | 4,100 ft level, W crosscut 9 ledge ore body |
| OD10459 | Calif. | Grass Valley | Original Empire | Deepest level ore approx. 8,000 ft |
| OD11942 | S. Dak. | Terraville-Homestake | Homestake mine | 2,900 ft level, 25D stope |
| OD11903 | S. Dak. | Terraville-Homestake | Homestake mine | 2,450 ft level |
| 13519 | Calif. | Shingle Springs | Big Canyon | — |
| 13518 | Calif. | Shingle Springs | Big Canyon | — |
| 13517 | Calif. | Shingle Springs | Big Canyon | — |
| 19286 | S. Dak. | Terraville-Homestake | Homestake mine | 7,400 level, 22 top stope, 19 ledge |
| 17985 | Idaho | Yellow Pine | Yellow Pine mine | — |
| OD07880 | Calif. | Rymal mine | North Fork Feather River, Meadow View | |
| EMTA-1-1 | Calif. | Grass Valley | Empire | Collected from a vein exposed in the tourist adit |
| EMTA-2-2 | Calif. | Grass Valley | Empire | Collected from a vein exposed in the tourist adit |
| EUR-D-1 | Calif. | Mother Lode | Eureka | — |
| EUR-D-2 | Calif. | Mother Lode | Eureka | — |
| HAR-1 | Calif. | Mother Lode | Harvard | — |
| HAR-2 | Calif. | Mother Lode | Harvard | — |
| IDH001-B | Calif. | Grass Valley | Idaho-Maryland | High-grade drill core intercept |
| OX-DOWN-2 | Calif. | Downieville | Oxford | — |
| SO-1 | Calif. | Allegheny | Sixteen-to-One | — |
| UHD-3A | Calif. | Grass Valley | Union Hill | Dump at the mine |
| WYOD-1B | Calif. | Grass Valley | WYOD | Dump at the mine |
| WYOD-2 | Calif. | Grass Valley | WYOD | Dump at the mine |
| C-504783 | Calif. | Klamath Mtns | Golden Eagle 1 | Collected from a dump for Taylor and others (2022) |
| C-504784 | Calif. | Klamath Mtns | Golden Eagle 2 | Collected from a dump for Taylor and others (2022) |
| C-504785 | Calif. | Klamath Mtns | Schroeder 1 | Collected from a dump for Taylor and others (2022) |
| C-504786 | Calif. | Klamath Mtns | Schroeder 2 | Collected from a dump for Taylor and others (2022) |
| C-504787 | Calif. | Klamath Mtns | Yankee John 1 | Collected from a dump for Taylor and others (2022) |
| C-504789 | Calif. | Klamath Mtns | Yankee John 2 | Collected from a dump for Taylor and others (2022) |
| C-504790 | Calif. | Klamath Mtns | McKinley 1 | Collected from a dump for Taylor and others (2022) |
| C-504791 | Calif. | Klamath Mtns | McKinley 2 | Collected from a dump for Taylor and others (2022) |
| C-504792 | Calif. | Klamath Mtns | Jillson | Collected from a dump for Taylor and others (2022) |
| C-504793 | Calif. | Klamath Mtns | New York | Collected from a dump for Taylor and others (2022) |
| C-504794 | Calif. | Klamath Mtns | McKeen | Collected from a dump for Taylor and others (2022) |
| C-504795 | Calif. | Klamath Mtns | Cleaver | Collected from a dump for Taylor and others (2022) |
| C-504796 | Calif. | Klamath Mtns | Maple | Collected from a dump for Taylor and others (2022) |
| C-504797 | Calif. | Klamath Mtns | Ozark | Collected from a dump for Taylor and others (2022) |
| C-504798 | Calif. | Klamath Mtns | Quartz Hill | Collected from a dump for Taylor and others (2022) |
| C-504799 | Calif. | Klamath Mtns | Hickey | Collected from a dump for Taylor and others (2022) |
| C-504800 | Calif. | Klamath Mtns | Washington | Collected from underground mine face for Taylor and others (2022) |
| C-504801 | Calif. | Klamath Mtns | Mojo | Collected from underground mine face for Taylor and others (2022) |
| C-504802 | Calif. | Klamath Mtns | Dean | Collected from underground mine face for Taylor and others (2022) |
| C-504803 | Calif. | Klamath Mtns | Dean #p3 | Collected from underground mine face for Taylor and others (2022) |
| C-504804 | Calif. | Klamath Mtns | Dean #p3 N-S | Collected from underground mine face for Taylor and others (2022) |
| C-506231 | Calif. | Allegheny | Oriental | — |
| C-506232 | Calif. | Mother Lode | Carson Hill 3 | — |
| C-506233 | Calif. | Honey Lake | Honey Lake 1 | — |
| C-506234 | Calif. | Mother Lode | Empire Plymouth | — |
| C-506235 | Calif. | Mother Lode | Eureka | — |
| C-506236 | Alaska | Kantishna | Stampede mine | — |
| C-506237 | Alaska | Kantishna | Stampede mine | — |
| C-506238 | Alaska | Fairbanks | Ryan Lode | Surficial vein outcrop |
| C-506239 | Alaska | Fairbanks | Ryan Lode | Surficial vein outcrop |
| C-506240 | Alaska | Fairbanks | Ryan Lode | Surficial vein outcrop |
| C-506241 | Alaska | Fairbanks | Ryan Lode | Surficial vein outcrop |
| C-506242 | Alaska | Fairbanks | Ryan Lode | Surficial vein outcrop |
| C-506244 | Calif. | Bagby district | Josephine | — |
| IM19_13_3272.95 | Calif. | Grass Valley | Idaho-Maryland | Drill core |
| IM19_13_3278 | Calif. | Grass Valley | Idaho-Maryland | Drill core |
| IM19_13_3280.4 | Calif. | Grass Valley | Idaho-Maryland | Drill core |
| IM19_13_3283.2 | Calif. | Grass Valley | Idaho-Maryland | Drill core |
| IM19_13_3286.6 | Calif. | Grass Valley | Idaho-Maryland | Drill core |
| IM19_13_3289.4 | Calif. | Grass Valley | Idaho-Maryland | Drill core |
| IM19_13_3292.8 | Calif. | Grass Valley | Idaho-Maryland | Drill core |
| IM19_13_3296.65 | Calif. | Grass Valley | Idaho-Maryland | Drill core |
| IM19_13_3300 | Calif. | Grass Valley | Idaho-Maryland | Drill core |
| IM19_13_3303.7 | Calif. | Grass Valley | Idaho-Maryland | Drill core |
| IM19_13_3307 | Calif. | Grass Valley | Idaho-Maryland | Drill core |
| IM19_13_3310.65 | Calif. | Grass Valley | Idaho-Maryland | Drill core |
| IM19_13_3313.7 | Calif. | Grass Valley | Idaho-Maryland | Drill core |
| IM19_13_3317.4 | Calif. | Grass Valley | Idaho-Maryland | Drill core |
| IM19_13_3320.2 | Calif. | Grass Valley | Idaho-Maryland | Drill core |
| IM19_13_3323.8 | Calif. | Grass Valley | Idaho-Maryland | Drill core |
| IM19_13_3326.35 | Calif. | Grass Valley | Idaho-Maryland | Drill core |
| IM19_13_3328.45 | Calif. | Grass Valley | Idaho-Maryland | Drill core |
| IM19_13_3330.5 | Calif. | Grass Valley | Idaho-Maryland | Drill core |
| IM19_13_3334 | Calif. | Grass Valley | Idaho-Maryland | Drill core |
| IM19_13_3337.7 | Calif. | Grass Valley | Idaho-Maryland | Drill core |
| IM19_13_3340.8 | Calif. | Grass Valley | Idaho-Maryland | Drill core |
| IM19_13_3344.05 | Calif. | Grass Valley | Idaho-Maryland | Drill core |
| IM19_13_3347 | Calif. | Grass Valley | Idaho-Maryland | Drill core |
| IM19_13_3350.65 | Calif. | Grass Valley | Idaho-Maryland | Drill core |
| IM19_13_3354.3 | Calif. | Grass Valley | Idaho-Maryland | Drill core |
| IM19_13_3356.8 | Calif. | Grass Valley | Idaho-Maryland | Drill core |
| IM19_13_3360.2 | Calif. | Grass Valley | Idaho-Maryland | Drill core |
| IM19_13_3364.05 | Calif. | Grass Valley | Idaho-Maryland | Drill core |
| IM19_13_3368 | Calif. | Grass Valley | Idaho-Maryland | Drill core |
| IM19_13_3371.3 | Calif. | Grass Valley | Idaho-Maryland | Drill core |
| IM19_13_3374.8 | Calif. | Grass Valley | Idaho-Maryland | Drill core |
| IM19_13_3377.85 | Calif. | Grass Valley | Idaho-Maryland | Drill core |
| IM19_13_3380.55 | Calif. | Grass Valley | Idaho-Maryland | Drill core |
| IM19_13_3384 | Calif. | Grass Valley | Idaho-Maryland | Drill core |
| IM19_13_3387.05 | Calif. | Grass Valley | Idaho-Maryland | Drill core |
| IM19_13_3389.6 | Calif. | Grass Valley | Idaho-Maryland | Drill core |
| IM19_13_3391.2 | Calif. | Grass Valley | Idaho-Maryland | Drill core |
| IM19_13_3393.65 | Calif. | Grass Valley | Idaho-Maryland | Drill core |
| IM19_13_3395.35 | Calif. | Grass Valley | Idaho-Maryland | Drill core |
| IM19_13_3397.2 | Calif. | Grass Valley | Idaho-Maryland | Drill core |
| IM19_13_3399.6 | Calif. | Grass Valley | Idaho-Maryland | Drill core |
| IM19_13_3402.45 | Calif. | Grass Valley | Idaho-Maryland | Drill core |
| IM19_13_3405 | Calif. | Grass Valley | Idaho-Maryland | Drill core |
| IM19_13_3407.6 | Calif. | Grass Valley | Idaho-Maryland | Drill core |
| IM19_13_3410.3 | Calif. | Grass Valley | Idaho-Maryland | Drill core |
| IM19_13_3413.15 | Calif. | Grass Valley | Idaho-Maryland | Drill core |
| IM19_13_3417 | Calif. | Grass Valley | Idaho-Maryland | Drill core |
| IM19_13_3420.35 | Calif. | Grass Valley | Idaho-Maryland | Drill core |
| IM19_13_3424.45 | Calif. | Grass Valley | Idaho-Maryland | Drill core |
| IM19_13_3428.4 | Calif. | Grass Valley | Idaho-Maryland | Drill core |
| IM19_13_3432.35 | Calif. | Grass Valley | Idaho-Maryland | Drill core |
| IM19_13_3436.45 | Calif. | Grass Valley | Idaho-Maryland | Drill core |
| IM19_13_3440.45 | Calif. | Grass Valley | Idaho-Maryland | Drill core |
| IM19_13_3445.8 | Calif. | Grass Valley | Idaho-Maryland | Drill core |
| IM19_13_3451.1 | Calif. | Grass Valley | Idaho-Maryland | Drill core |
| IM19_13_3457.1 | Calif. | Grass Valley | Idaho-Maryland | Drill core |
| IM19_13_3463.1 | Calif. | Grass Valley | Idaho-Maryland | Drill core |
| IM19_13_3468.65 | Calif. | Grass Valley | Idaho-Maryland | Drill core |
| IM19_13_3472.65 | Calif. | Grass Valley | Idaho-Maryland | Drill core |
| IM19_13_3476.3 | Calif. | Grass Valley | Idaho-Maryland | Drill core |
| IM19_13_3479.5 | Calif. | Grass Valley | Idaho-Maryland | Drill core |
| IM19_13_3482.9 | Calif. | Grass Valley | Idaho-Maryland | Drill core |
| IM19_13_3486.55 | Calif. | Grass Valley | Idaho-Maryland | Drill core |
| IM19_13_3490 | Calif. | Grass Valley | Idaho-Maryland | Drill core |
| IM19_13_3493 | Calif. | Grass Valley | Idaho-Maryland | Drill core |
| IM19_13_3495.5 | Calif. | Grass Valley | Idaho-Maryland | Drill core |
| IM19_13_3498.2 | Calif. | Grass Valley | Idaho-Maryland | Drill core |
| IM19_13_3502 | Calif. | Grass Valley | Idaho-Maryland | Drill core |
| IM19_13_3505.35 | Calif. | Grass Valley | Idaho-Maryland | Drill core |
| IM19_13_3508.8 | Calif. | Grass Valley | Idaho-Maryland | Drill core |
| IM19_13_3512.35 | Calif. | Grass Valley | Idaho-Maryland | Drill core |
| IM19_13_3515.9 | Calif. | Grass Valley | Idaho-Maryland | Drill core |
| IM19_13_3519 | Calif. | Grass Valley | Idaho-Maryland | Drill core |
| IM19_13_3522.1 | Calif. | Grass Valley | Idaho-Maryland | Drill core |
| CDA-GC-200 | Idaho | Summit | Golden Chest | Ore |
Table 1.2.
Information on Coeur d'Alene-type ore samples included in this study.[Geochemical results are in Granitto and others (2020, 2021, 2025). Lab, laboratory; ID, identification; oz/ton, ounce per short ton; <, less than; Co., company; ±, plus or minus; %, percent; approx., approximately; ‘, feet; N., north; Abbreviations of chemical elements as follows: Ag, silver; Al, aluminum; Au, gold; Ba, barium; C, carbon; Cu, copper; Fe, iron; Mn, manganese; Pb, lead; Sb, antimony; Zn, zinc]
References Cited
Granitto, M., Emsbo, P., Hofstra, A.H., Orkild-Norton, A.R., Bennett, M.M., Azain, J.S., Koenig, A.E., and Karl, N.A., 2020, Global geochemical database for critical minerals in archived mine samples: U.S. Geological Survey data release, accessed December 13, 2023, at https://doi.org/10.5066/P9Z3XL6D.
Granitto, M., Hofstra, A.H., and Taylor, R.D., 2025, National Geochemical Database on ore deposits—New data featuring fusion digestion analytical methods: U.S. Geological Survey data release, https://doi.org/10.5066/P1M9HNMW.
Granitto, M., Schmidt, D.E., Karl, N.A., and Khoury, R.M., 2021, National Geochemical Database on Ore Deposits—Legacy data: U.S. Geological Survey data release, accessed December 13, 2023, at https://doi.org/10.5066/P944U7S5.
Taylor, R.D., Morgan, L.E., Jourdan, F., Monecke, T., Marsh, E.E., and Goldfarb, R.J., 2022, Late Jurassic-Early Cretaceous orogenic gold mineralization in the Klamath Mountains, California—Constraints from 40Ar/39Ar dating of hydrothermal muscovite: Ore Geology Reviews, v. 141, 19 p. [Also available at https://doi.org/10.1016/j.oregeorev.2021.104661.]
Conversion Factors
Temperature in degrees Fahrenheit (°F) may be converted to degrees Celsius (°C) as follows:
°C = (°F – 32) / 1.8.
Temperature in degrees Celsius (°C) may be converted to degrees Fahrenheit (°F) as follows: °F = (1.8 × °C) + 32.
Supplemental Information
Concentrations of chemical constituents are in parts per million (ppm), grams per tonne (g/t), or weight percent (wt. pct.).
Publishing support provided by the Science Publishing Network,
Denver and Reston Publishing Service Centers
For more information concerning the research in this report, contact the
Center Director, USGS Geology, Geophysics, and Geochemistry Science Center
Box 25046, Mail Stop 973
Denver, CO 80225
(303) 236-1800
Or visit the Geology, Geophysics, and Geochemistry Science Center website at
Disclaimers
Any use of trade, firm, or product names is for descriptive purposes only and does not imply endorsement by the U.S. Government.
Although this information product, for the most part, is in the public domain, it also may contain copyrighted materials as noted in the text. Permission to reproduce copyrighted items must be secured from the copyright owner.
Suggested Citation
Taylor, R.D., and Hofstra, A.H., 2025, Critical minerals in orogenic (gold) and Coeur d’Alene-type mineral systems of the United States: U.S. Geological Survey Data Report 1198, 47 p., https://doi.org/10.3133/dr1198.
ISSN: 2771-9448 (online)
Study Area
| Publication type | Report |
|---|---|
| Publication Subtype | USGS Numbered Series |
| Title | Critical minerals in orogenic (gold) and Coeur d’Alene-type mineral systems of the United States |
| Series title | Data Report |
| Series number | 1198 |
| DOI | 10.3133/dr1198 |
| Publication Date | May 30, 2025 |
| Year Published | 2025 |
| Language | English |
| Publisher | U.S. Geological Survey |
| Publisher location | Reston VA |
| Contributing office(s) | Geology, Geophysics, and Geochemistry Science Center |
| Description | Report: v, 47 p.; Data Release |
| Country | United States |
| Other Geospatial | continental United States |
| Online Only (Y/N) | Y |