

Hydrologic Investigations of Green Infrastructure by the Central Midwest Water Science Center
Links
- Document: Report (2.31 MB pdf) , HTML , XML
- NGMDB Index Pages:
- Download citation as: RIS | Dublin Core
Acknowledgments
The authors wish to acknowledge funding support for the various studies summarized in this document from the Metropolitan Water Reclamation District of Greater Chicago; Chicago Public Schools; City of Chicago Department of Water Management; Healthy Schools Campaign; Openlands; the Great Lakes Restoration Initiative; U.S. Environmental Protection Agency; Illinois Environmental Protection Agency; City of Bloomington, Illinois; Illinois Natural Resources Department; Natural Resource Conservation Service; and Prairie Engineers of Illinois, P.C.
The authors also wish to acknowledge funding for the Next Generation Water Observing System (NGWOS) urban testbeds study provided by the U.S. Geological Survey (USGS) NGWOS program. Document reviews were provided by USGS personnel Carolyn Soderstrom and Maitreyee Bera.
Green Infrastructure in Developed Communities
The water management system within developed communities includes stormwater, wastewater, and drinking-water sources and sinks. Each water management system component provides critical services that support public health in these areas. Stormwater can be quite variable and difficult to manage in developed communities because the amount of stormwater that must be routed through a developed area depends on changing land cover and variable precipitation. In addition to flooding concerns, stormwater also is a major cause of water contamination in developed communities because it carries contaminants such as trash, bacteria, heavy metals, and sediments to local waterways (U.S. Environmental Protection Agency [EPA], 2023). Historically, communities have managed stormwater with gray infrastructure such as street gutters, culverts, sewer systems, and tunnels. Although these structures efficiently capture and route stormwater to a local waterway or treatment plant, they do not filter any contaminants. Furthermore, many older communities have combined storm sewer and sanitary sewer systems. These combined systems result in an excessive amount of wastewater to be treated before being released into receiving water or the untreated waters are released directly to receiving waters during storms.
Many communities are now incorporating green infrastructure (GI) stormwater mitigating solutions—pervious surfaces (allows water through), grassed swales, bioretention basins, and rain gardens—into their stormwater-management systems (fig. 1). GI can absorb and filter stormwater where it falls by taking advantage of natural soil and plant storage and filtration capabilities. Thus, GI projects can potentially reduce the amount of stormwater and the concentration and transport of contaminants (fig. 2). Increasing GI in a developed community may reduce the requirements for new storm sewer infrastructure, improve the water quality of nearby waterways, and enhance aesthetics.
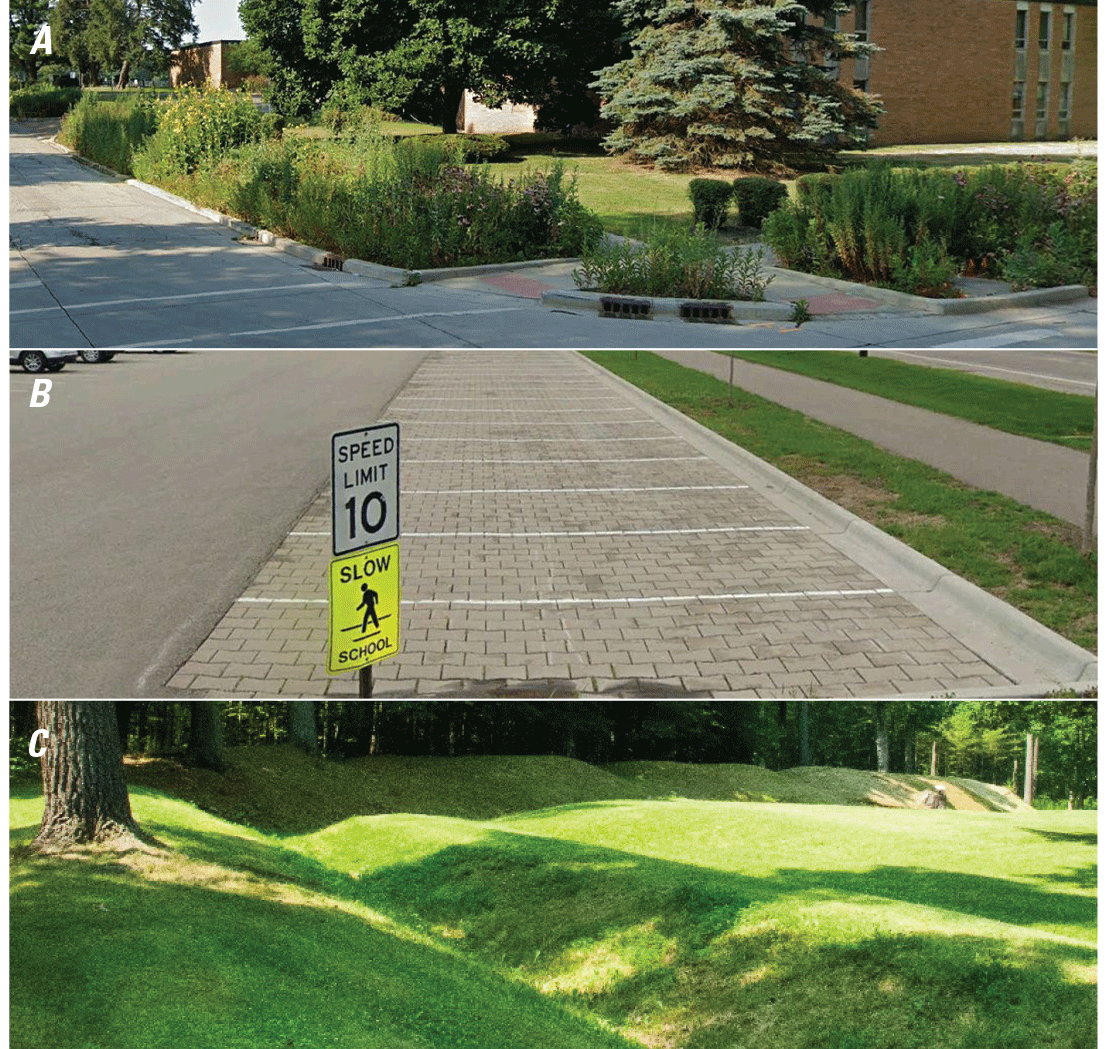
Green infrastructure transforms developed communities to more natural landscapes. A, rain garden. B, pervious pavement. C, vegetated swales; from U.S. Environmental Protection Agency, 2021.
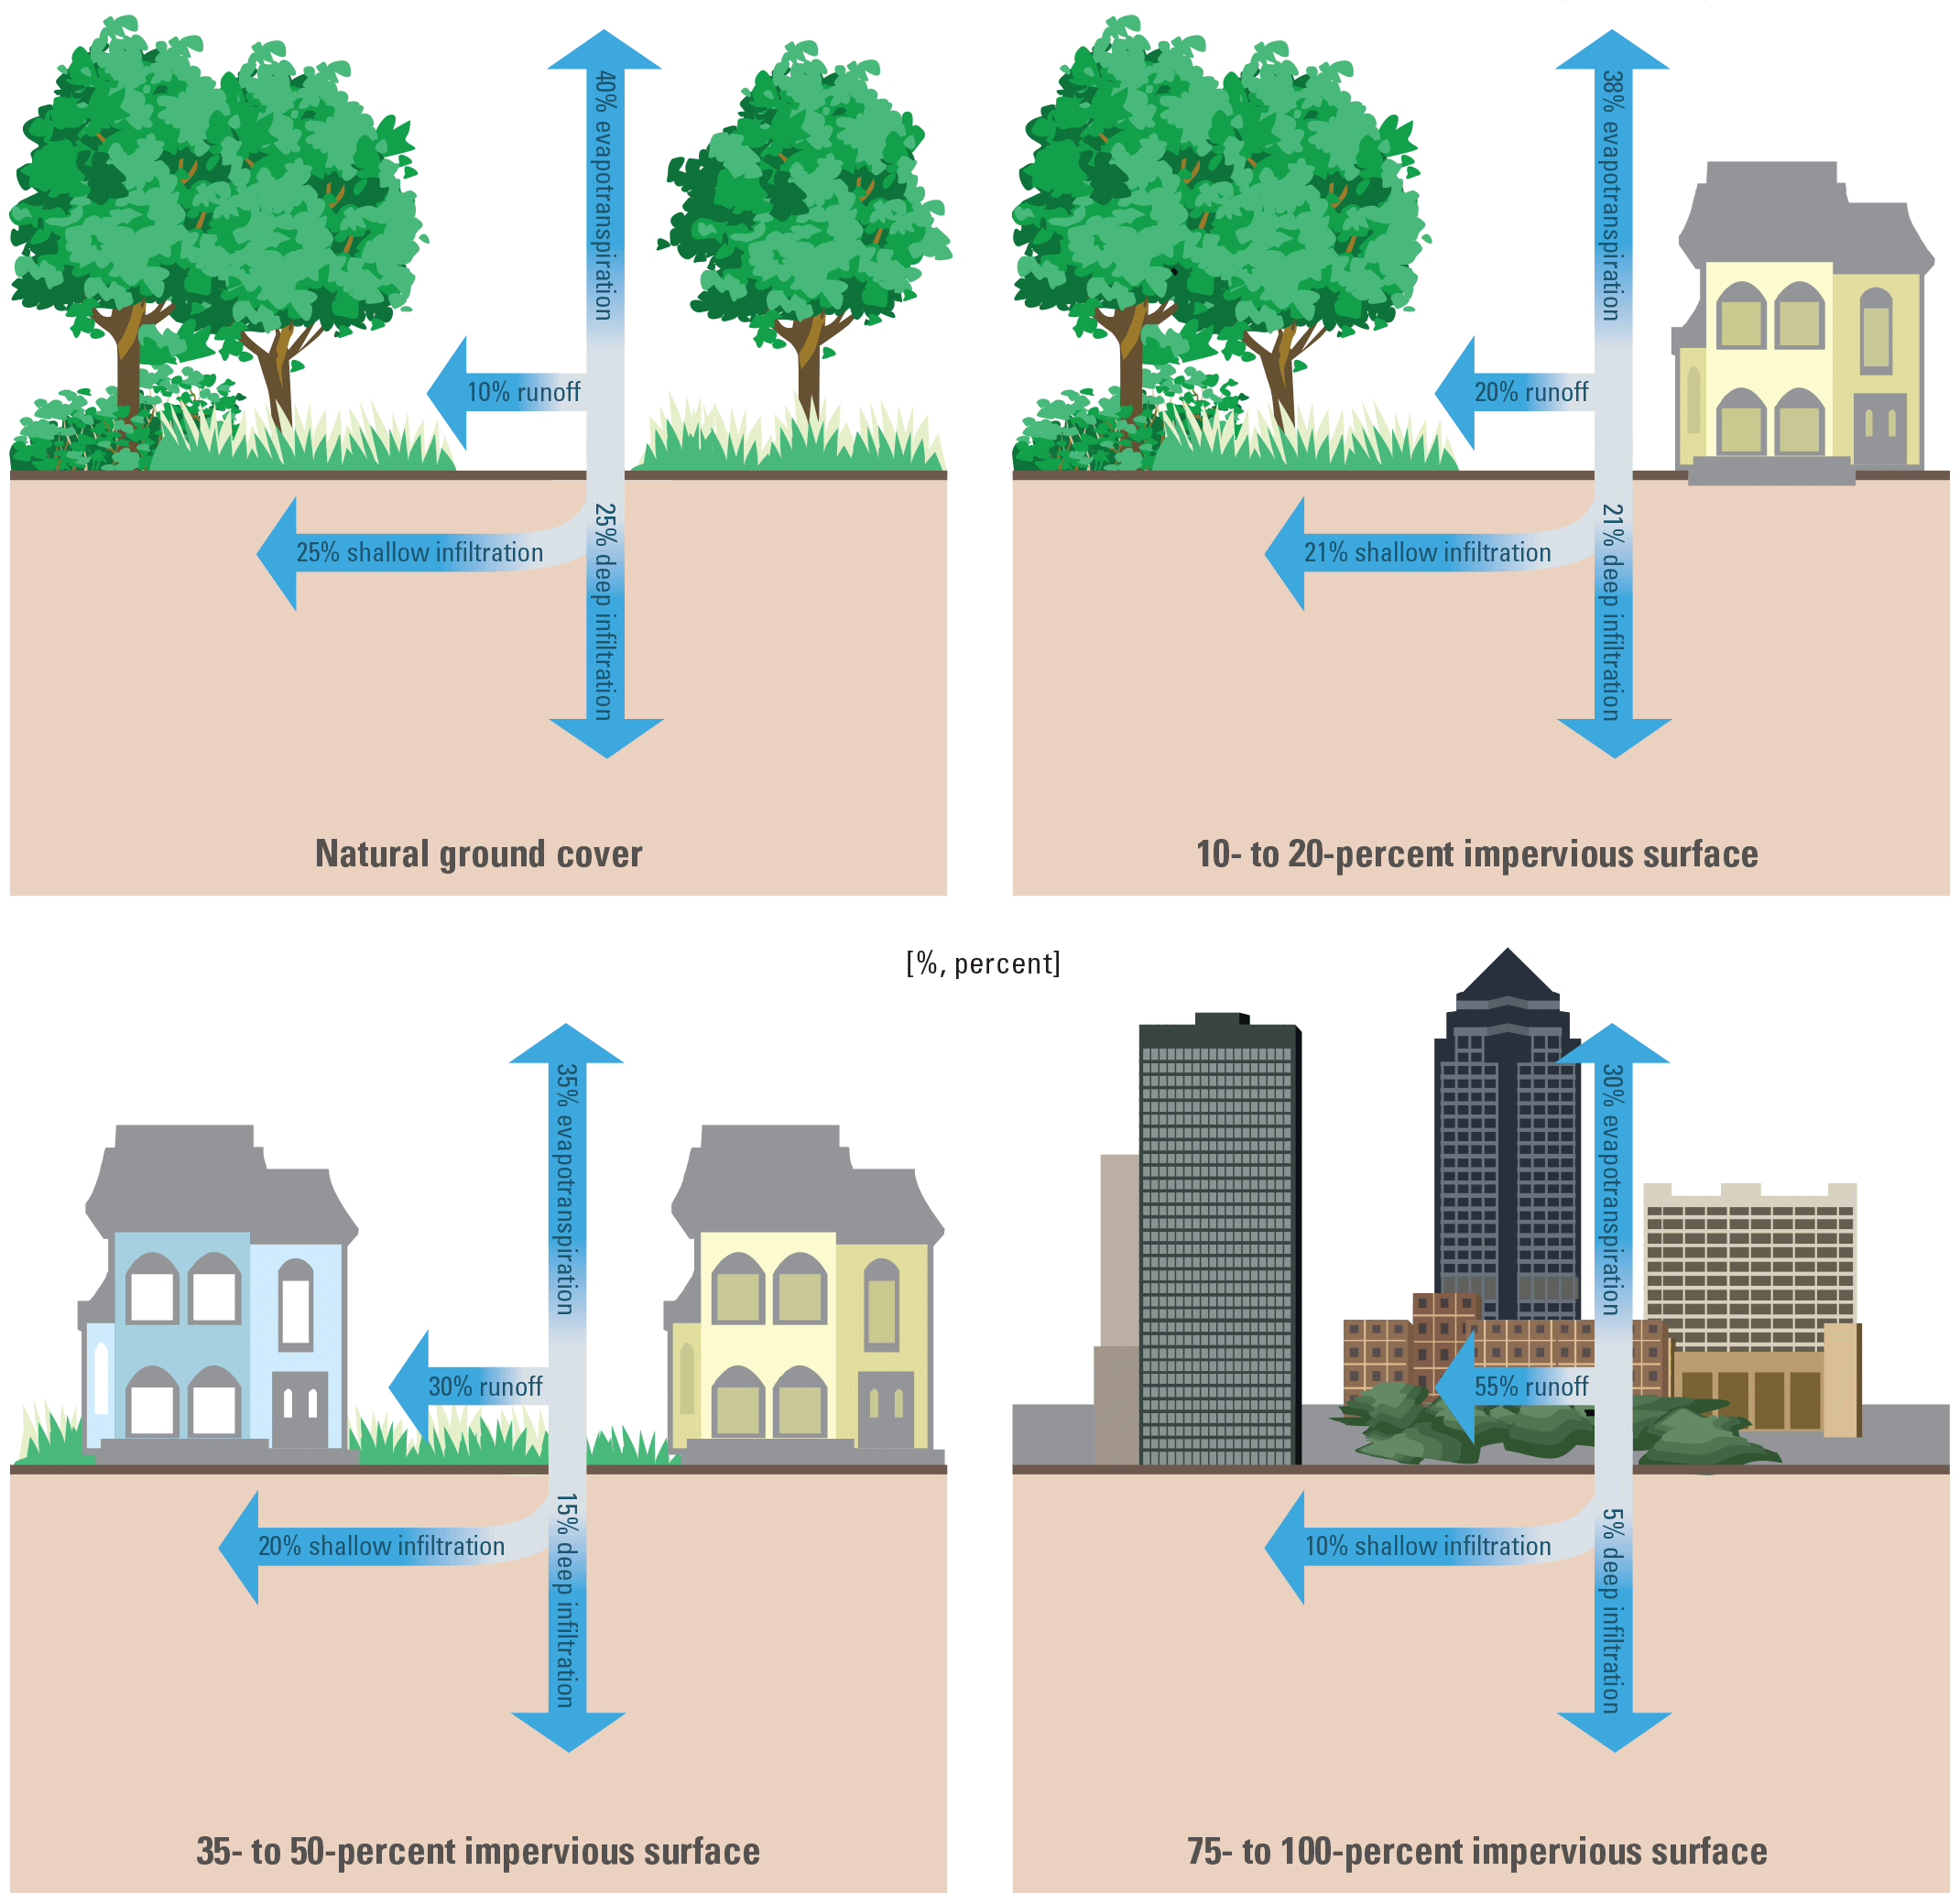
The hydrologic response of developed communities with green infrastructure mimics natural systems. Green infrastructure reduces runoff, increases evapotranspiration, and increases infiltration to shallow and deep groundwater. From Baker and others (2022), as modified from Federal Interagency Stream Restoration Working Group (1998).
The U.S. Geological Survey (USGS) has partnered with several cooperators to quantify the effects of GI projects in several developed communities throughout the central Midwest. As part of these GI projects, the USGS Central Midwest Water Science Center (CMWSC) and cooperators installed, calibrated, and monitored equipment to measure hydrologic responses (including flooding and water movement) and selected water-quality constituents in developed communities.
Chicago Schoolyards
The Chicago Schoolyards project involves monitoring water quality and runoff flow amounts from two schoolyards on the south side of Chicago: Virgil I. Grissom Fine and Performing Arts Elementary School and Morrill Math & Science Specialty School. The Grissom Elementary schoolyard, previously entirely asphalt pavement, is now about 50 percent GI (fig. 3), including pervious pavements and rain gardens.
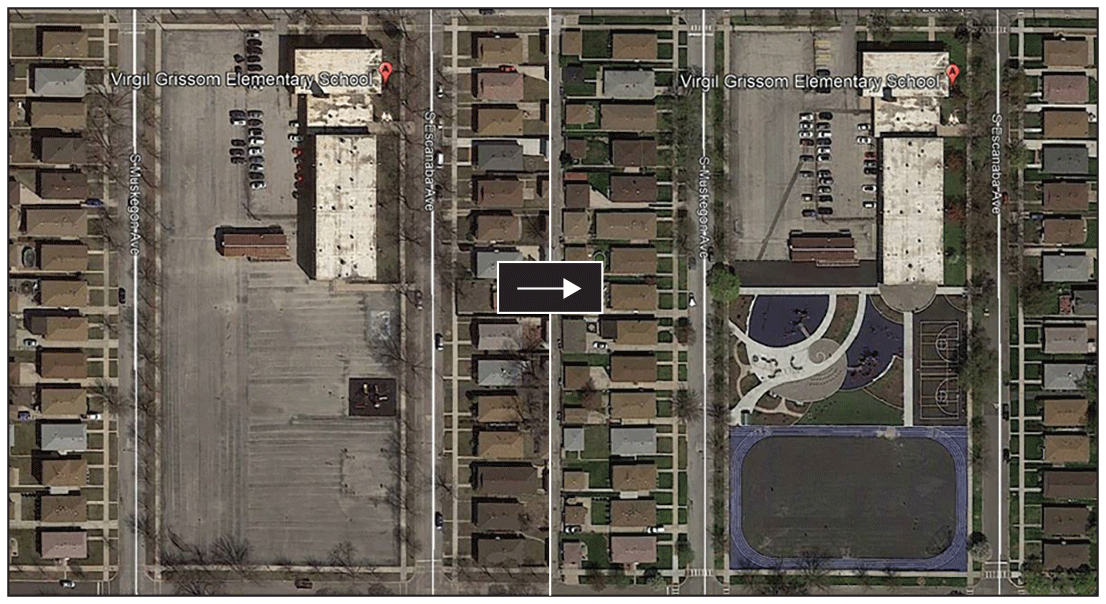
Example green infrastructure project at Virgil I. Grissom Fine and Performing Arts Elementary School in which part of an impervious parking lot was converted into a pervious recreation surface. Base

images from Google, copyright 2014, 2015.
Instruments (fig. 4) were installed in an access structure to measure and compare runoff from the impervious track area and GI area. At Morrill Math & Science School, flow meters and acoustic sensors were installed in storm sewer pipes leaving the GI project areas.
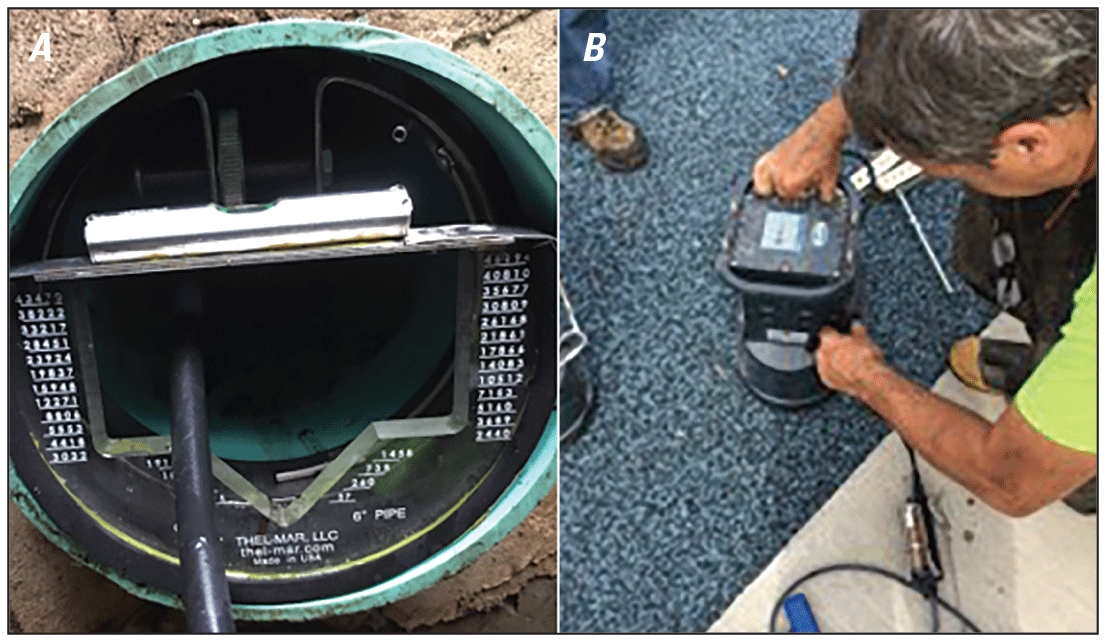
Runoff instruments installed at Virgil I. Grissom Fine and Performing Arts Elementary School. A, a six-inch V-notch weir installed with, B, a sewer flow meter in a sewer line draining the green infrastructure. Photographs by Clint Bailey, U.S. Geological Survey.
Groundwater level and water-quality data were also collected at both schools using piezometers and pressure transducers. Groundwater-level data can help determine soil infiltration and hydraulic conductivity. At Grissom Elementary School, these instruments were installed near the impervious running track and beneath the pervious rain garden to measure any differences in groundwater levels. The instruments at Morrill Math & Science Specialty School were installed within an onsite retention basin and outside of the GI area, along the perimeter of the property. Weather data including precipitation, humidity, barometric pressure, air temperature, and wind velocity and direction were also collected which may be beneficial to assess the performance of the GI during specific storms.
Great Lakes Restoration Initiative Urban Stormwater Projects
The USGS has been working with the EPA since 2015 to quantify stormwater reductions from stormwater-control measures through the Great Lakes Restoration Initiative (Baker and others, 2022). The primary focus has been on pre- and post-GI monitoring to quantify the amount of water reallocated through various parts of the water cycle by GI. This primarily has been done through field-based monitoring campaigns during pre- vs post-GI construction. Although valuable, this information represents only a small subset of the many practices used on various soils, vegetation, land use, and engineering designs throughout the Great Lakes States. The USGS developed a method to aggregate quantitative and qualitative characteristics for GI practices in the Great Lakes drainage basin. The intent of the effort is to provide information about future uses of GI by assessing practices across various site characteristics and geographic locations. These data can be statistically evaluated to determine how design, land use, soils, vegetation, maintenance, and other characteristics affect GI performance. These evaluations could then inform decision makers about potential long-term success and provide a foundation for future GI evaluations.
Next Generation Water Observing System Urban Test Beds
The USGS Next Generation Water Observing System (NGWOS) program provides innovative and accurate real-time environmental data to support decision makers in multiple selected basins across the United States including the Illinois River Basin. As part of this program, the CMWSC partnered with the Village of Harwood Heights, Illinois, to develop a flood alert system to monitor flooding and its effects on infrastructure. The flood alert system uses a Long Range Wide Area Network (LoRaWAN), that receives data from sensors (fig. 5), and an online dashboard (fig. 6) that provides the data to city officials who can warn the public of flooded intersections. When funds for large-scale storm sewer replacement projects are not available, flood alert systems provide an alternative method to protect life and property from the risks of flooding.
Eight storm sewer and surface runoff monitoring sites were selected throughout the Village of Harwood Heights based on the local community’s experiences with flooding in the area. Sensors were installed both to monitor the height of water in the underground access structures/manholes and above the street (fig. 5). The sensors and gateway combination were approximately a quarter of the cost of the typical sensor, datalogger, and modem combination of equipment often used for monitoring storm sewers.
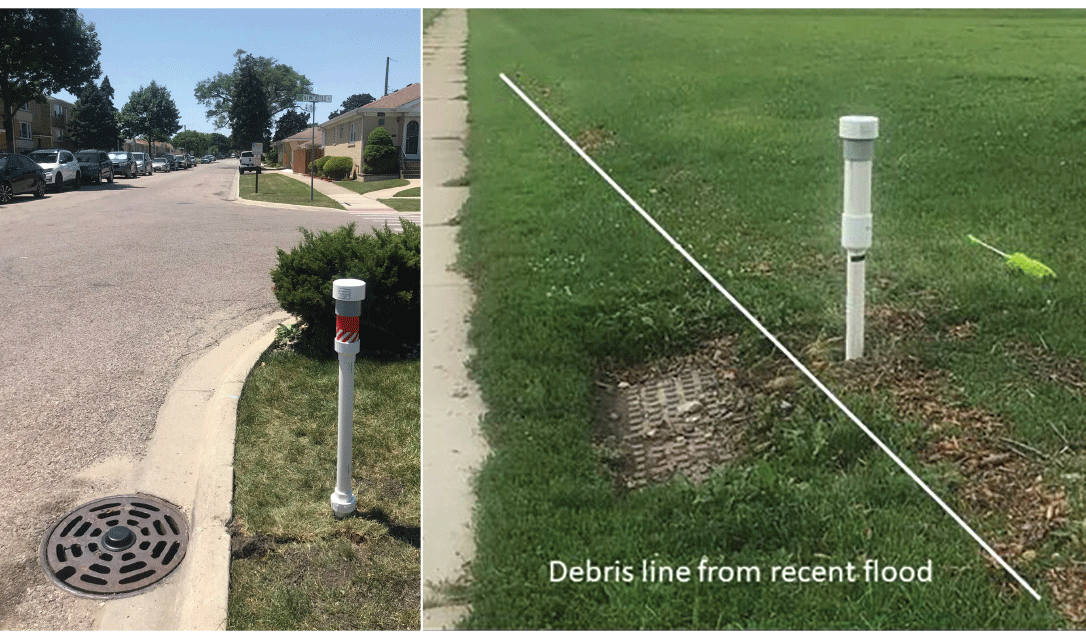
Low cost, water-level storm sensors installed in the Village of Harwood Heights, Illinois. Sensors were installed to monitor the height of water in the underground access structures or manholes and above the street. Photograph by William Selbig, U.S. Geological Survey.
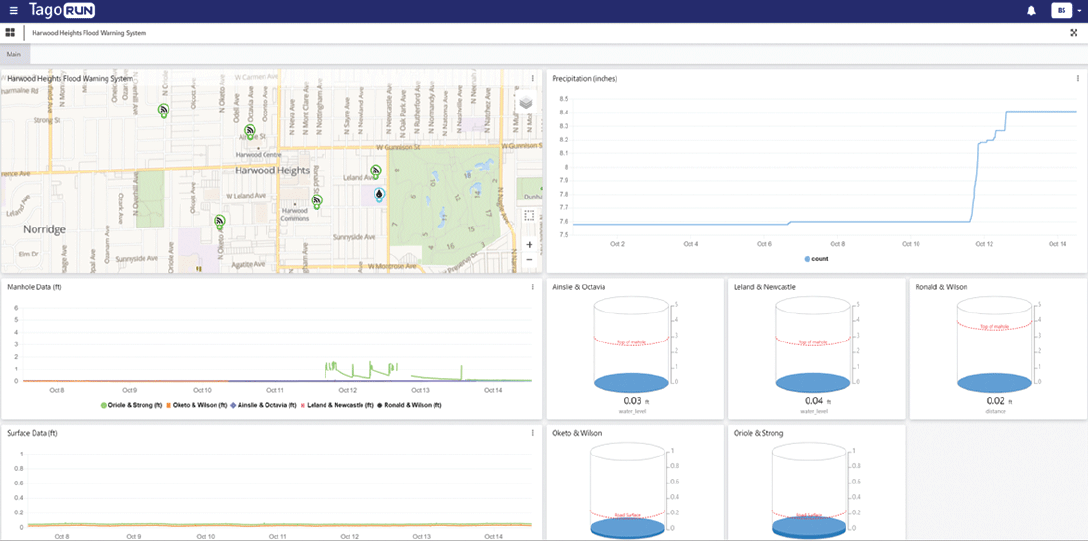
Representative dashboard for the Village of Harwood Heights, Illinois, flood alert system. The sensors transmit information to the dashboard, which illustrates the water-level and precipitation data. Image by William Selbig, U.S. Geological Survey.
The NGWOS Urban Test Bed project also includes an alert system set up that sends automated messages to city officials and the public when an intersection with a sensor is flooded. This alert system provides real-time warnings via text message, or a digital roadside display that updates with changing conditions to inform decision makers and the public. In addition to monitoring flooding in developed areas, such a system also could be used to monitor the mitigating effects of GI.
St. Louis Vacant Building Deconstruction
A declining population within the City of St. Louis, Missouri, has left thousands of properties vacant resulting in an economic, social, and environmental burden on the community. The effort to deconstruct vacant buildings, and the corresponding decrease in impervious structure area, aligns with the goal of the Metropolitan St. Louis Sewer District’s Project Clear: reduce rainfall runoff into the city’s wastewater system (Metropolitan St. Louis Sewer District, 2023). The USGS and the EPA collaborated with the City of St. Louis and the Metropolitan St. Louis Sewer District to address the question of what hydrologic response differences may exist between “legacy” (standard) and “green” (Green City Coalition, 2023) methods of building deconstruction removal (fig. 7). Differences between legacy and green removal include whether the foundation undergoes treatment or full removal and differences in fill soil depth and texture characteristics.
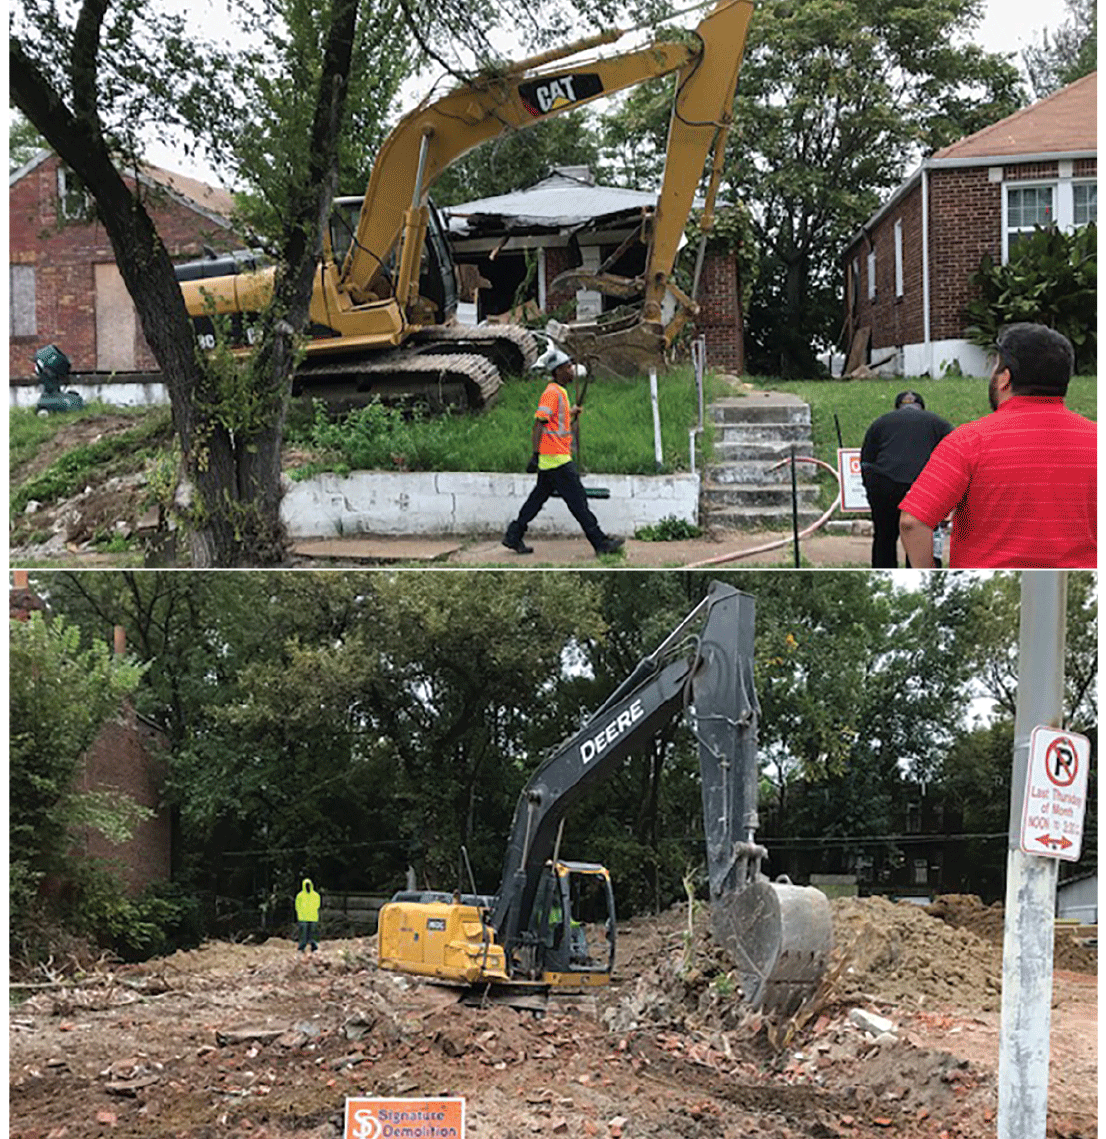
Vacant building deconstruction in St. Louis, Missouri, removes, A, impervious surfaces and, B, replaces them with pervious soil that can retain stormwater and reduce runoff. Photographs by David Heimann, U.S. Geological Survey.
Sites used for comparing the hydrologic conditions of the different building removal practices consisted of 10 legacy and green demolition lot pairs (fig. 8) that were selected at random and monitored for differences in hydrologic response to storms. At each lot, instruments continuously measured groundwater fluctuations (fig. 9) and discontinuously measured soil hydrologic characteristics (infiltration, saturated hydraulic conductivity, and compaction).
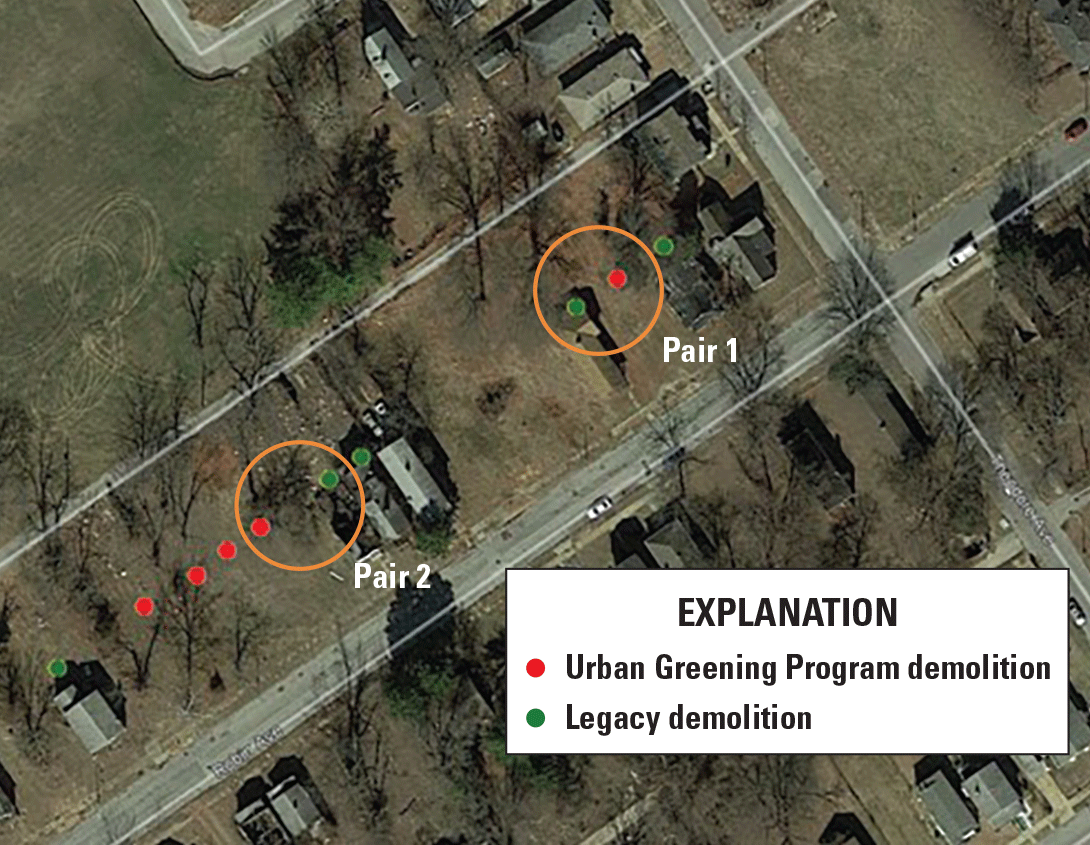
Example of legacy and green demolition pairing in St. Louis, Missouri.
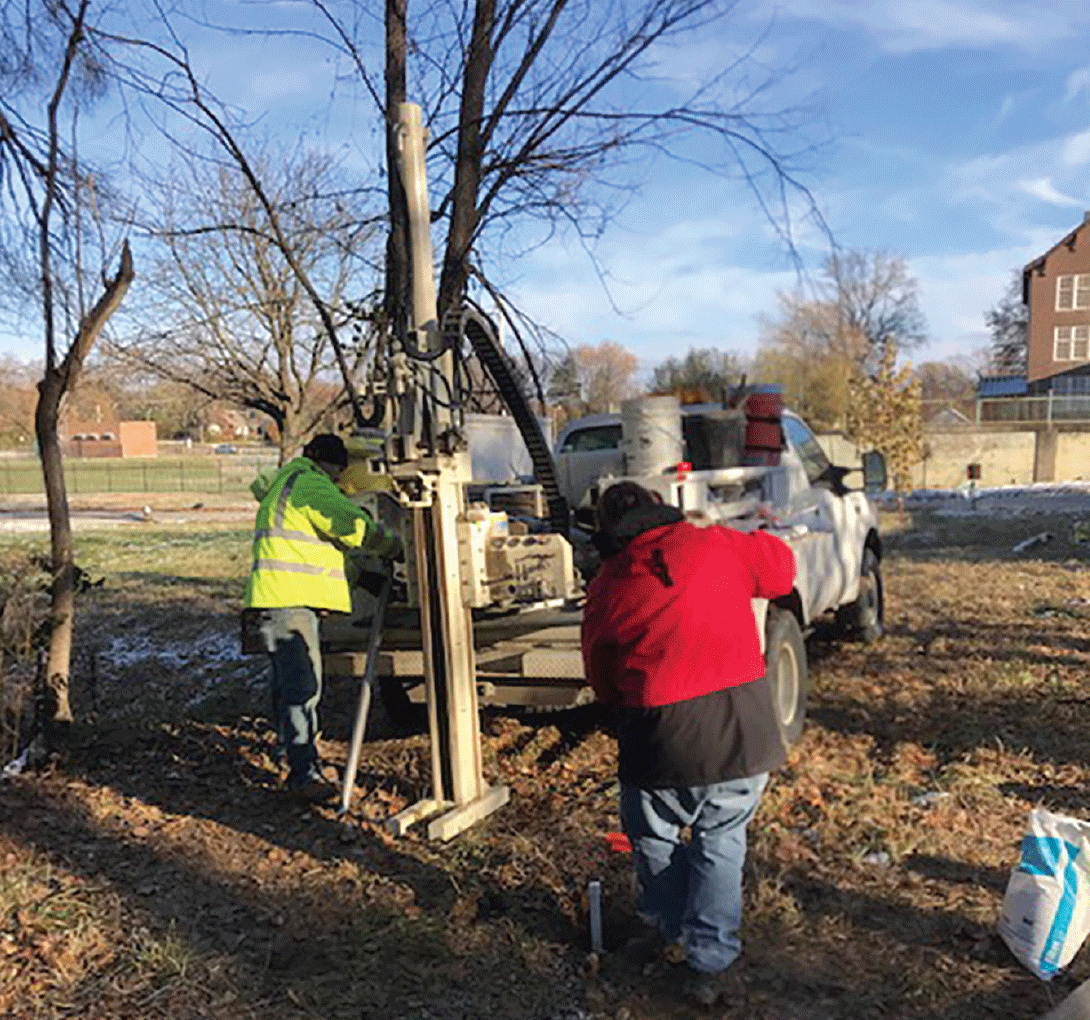
U.S. Geological Survey personnel installing a piezometer at a St. Louis, Missouri, demolition site. Photograph by David Heimann, U.S. Geological Survey.
Soil moisture and temperature also were recorded every 5 minutes at 10-centimeter increments to a depth of 90 centimeters (Heimann and Reiss, 2021). Changes in soil moisture conditions allowed for the direct comparison of the hydrologic responses between lots during rainfall. Hydrologic characteristics also were measured at a nearby restored prairie site as a “control,” or a site that represents the maximum hydrologic performance potential of the area soils.
The Grove at Bloomington, Illinois
The Grove is a residential development in Bloomington, Ill., near Kickapoo Creek. In 2006, the City of Bloomington restored 2 miles of Kickapoo Creek within a 90-acre park area near the development (fig. 10). The restoration had three goals: (1) “reduce nutrient loads,” (2) “maintain water quality to support a diverse community of biotic species,” and (3) “manage sediment transport and stormwater flows through the restored section of Kickapoo Creek” (Roseboom and Straub, 2013).
The USGS collected and analyzed streamflow and groundwater data, suspended-sediment concentrations, and water-quality indicators such as dissolved oxygen, pH, water temperature, specific conductance, and nitrate concentrations in the study reach (fig. 10; Roseboom and Straub, 2013). These data were collected using three streamgages, groundwater monitoring wells, continuous water-quality monitors, and periodic discontinuous sampling. Two of the streamgages were upstream and one was downstream from the development area to determine differences caused by the restoration efforts. These data helped researchers assess how nutrient and sediment concentrations change as runoff moves through the reconstructed creek and wetland system. Measurements by the IDNR fish survey and the IDNR and IEPA biology surveys allowed researchers to determine how well the system was supporting biotic species including fish, macroinvertebrates, and vegetation (Roseboom and Straub, 2013).
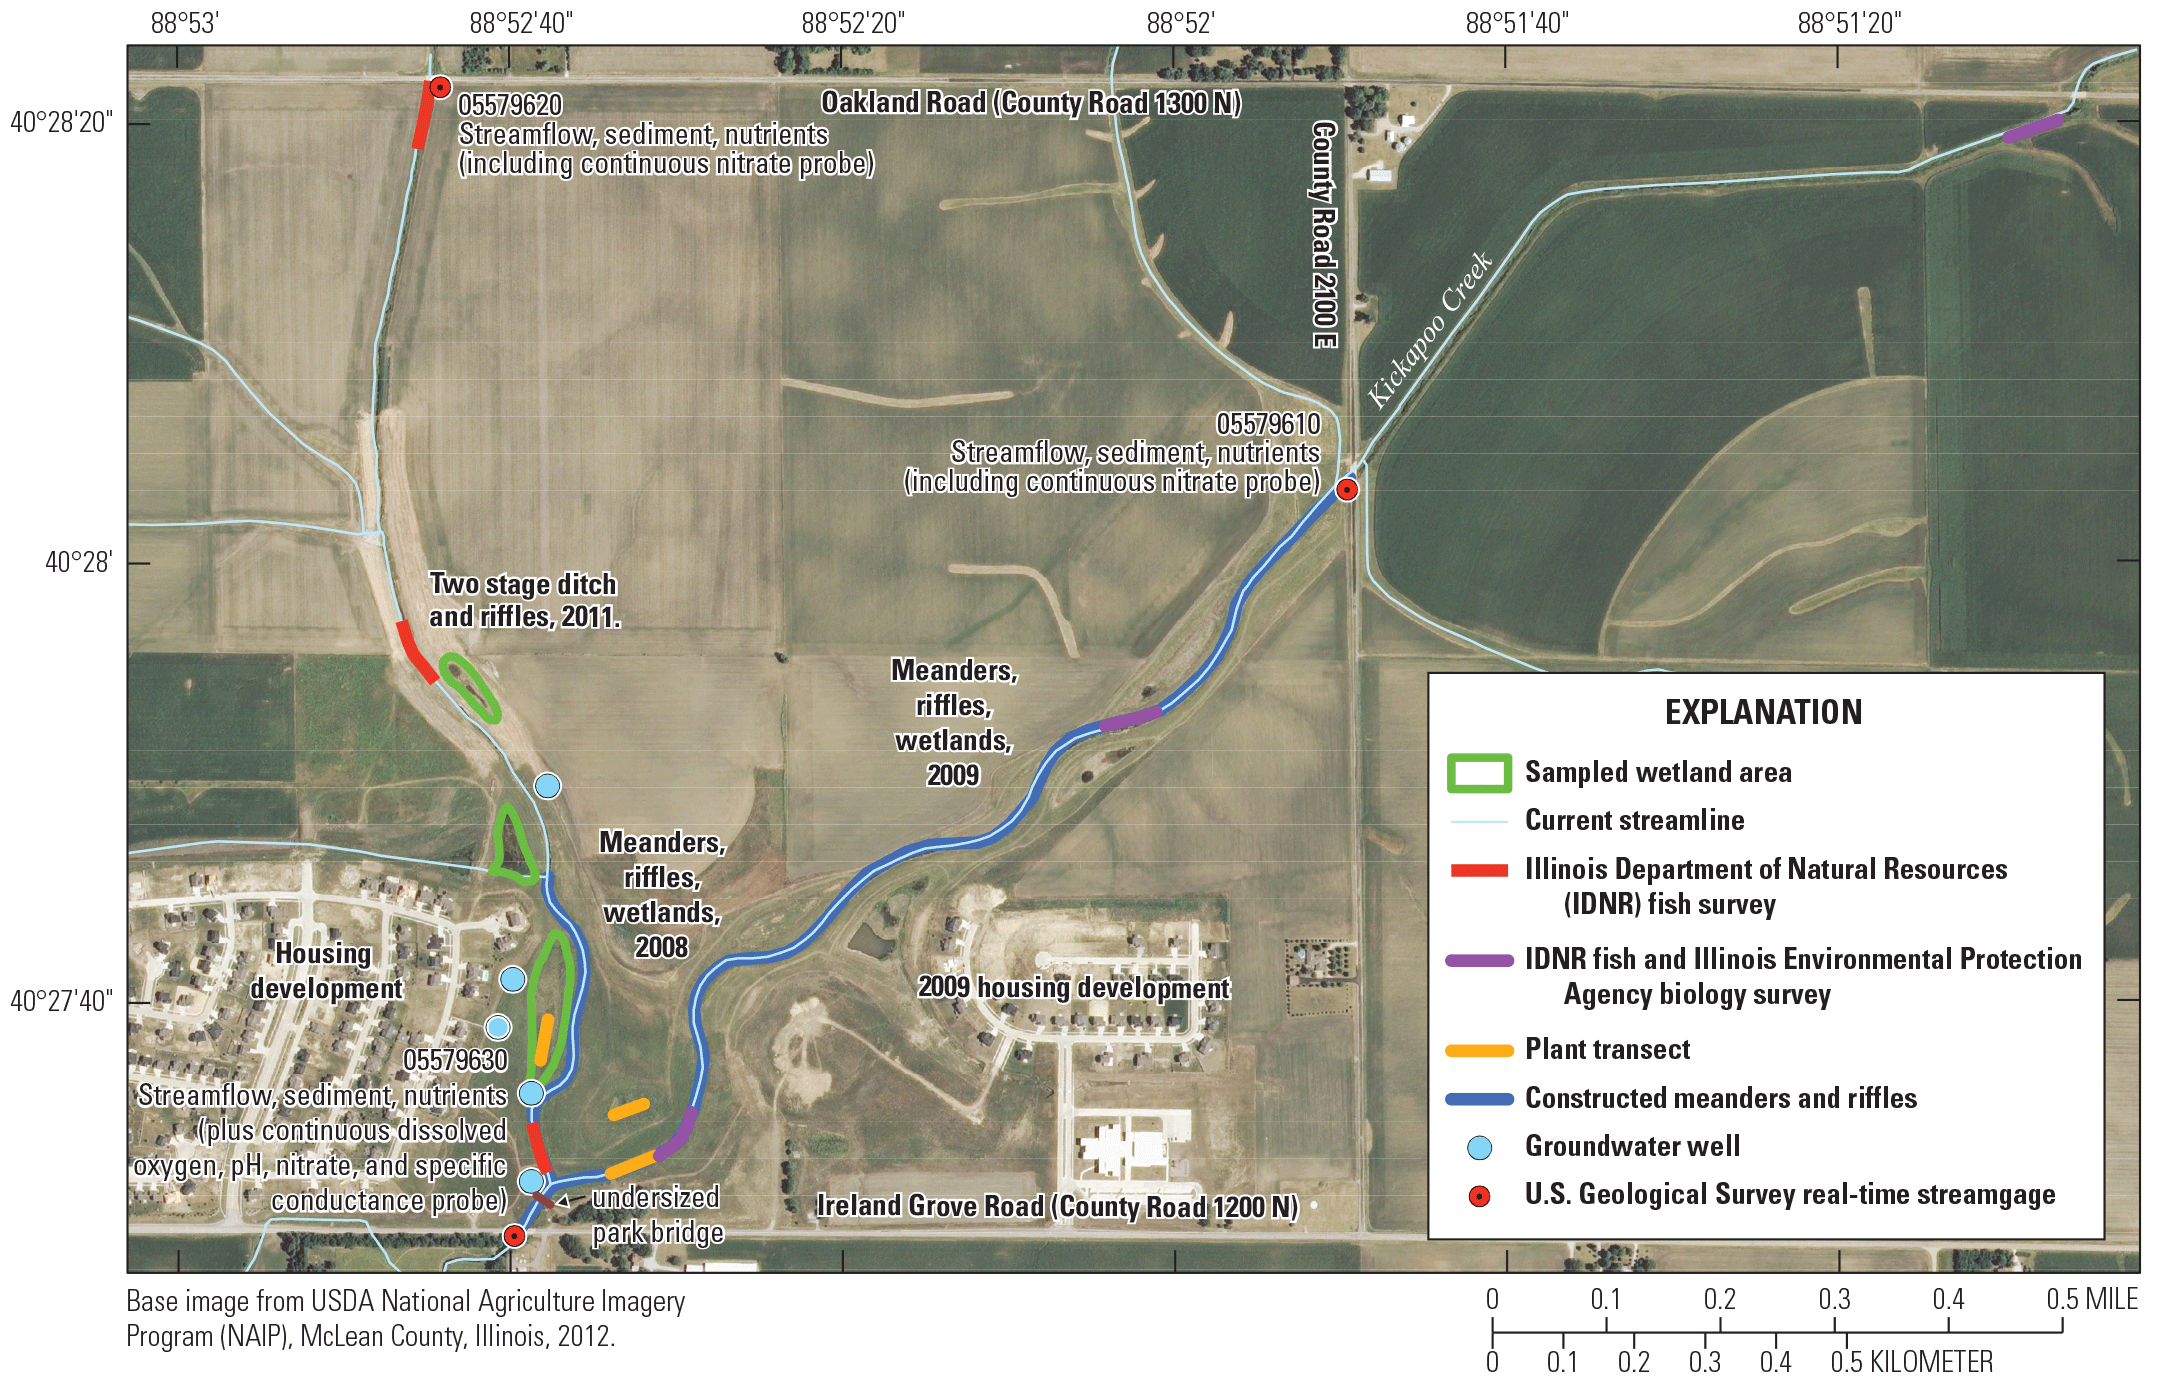
The Grove restoration site within the Kickapoo Creek watershed, McLean County, Illinois. From Roseboom and Straub (2013).
References Cited
Baker, N.T., Sullivan, D.J., Selbig, W.R., Haefner, R.J., Lampe, D.C., Bayless, R., and McHale, M.R., 2022, Green infrastructure in the Great Lakes—Assessment of performance, barriers, and unintended consequences: U.S. Geological Survey Circular 1496, 70 p., accessed May 2023 at https://doi.org/10.3133/cir1496.
Green City Coalition, 2023, Urban Greening Program: Green City Coalition web page, accessed August 25, 2023, at https://www.greencitycoalition.org/ugp.html.
Metropolitan St. Louis Sewer District, 2023, Project Clear: Metropolitan St. Louis Sewer District website, accessed August 26, 2023, at https://msdprojectclear.org/.
Roseboom, D. P., and Straub, T. D., 2013, Monitoring of green infrastructure at The Grove in Bloomington, Illinois: U.S. Geological Survey Fact Sheet 2013–3048, 1-2, 4 p., accessed May 13, 2023, at https://doi.org/10.3133/fs20133048.
U.S. Environmental Protection Agency [EPA], 2021, Stormwater best management practice—Grassed swales: U.S. Environmental Protection Agency fact sheet, EPA–832–F–21–031P, 6 p., accessed July 7, 2023, at https://www.epa.gov/system/files/documents/2021-11/bmp-grassed-swales.pdf.
U.S. Environmental Protection Agency [EPA], 2023, What is green infrastructure?: U.S. Environmental Protection Agency web page, accessed May 5, 2023, at https://www.epa.gov/green-infrastructure/what-green-infrastructure.
For more information about this publication, contact:
Director, USGS Central Midwest Water Science Center
405 North Goodwin
Urbana, IL 61801
217–328–8747
For additional information, visit: https://www.usgs.gov/centers/cm-water
Publishing support provided by the Rolla Publishing Service Center
Disclaimers
Any use of trade, firm, or product names is for descriptive purposes only and does not imply endorsement by the U.S. Government.
Although this information product, for the most part, is in the public domain, it also may contain copyrighted materials as noted in the text. Permission to reproduce copyrighted items must be secured from the copyright owner.
Suggested Citation
Atkinson, A.A., Heimann, D.C., and Bailey, C.R., 2023, Hydrologic investigations of green infrastructure by the Central Midwest Water Science Center: U.S. Geological Survey Fact Sheet 2023–3043, 4 p., https://doi.org/10.3133/fs20233043.
ISSN: 2327-6932 (online)
ISSN: 2327-6916 (print)
| Publication type | Report |
|---|---|
| Publication Subtype | USGS Numbered Series |
| Title | Hydrologic investigations of green infrastructure by the Central Midwest Water Science Center |
| Series title | Fact Sheet |
| Series number | 2023-3043 |
| DOI | 10.3133/fs20233043 |
| Publication Date | October 18, 2023 |
| Year Published | 2023 |
| Language | English |
| Publisher | U.S. Geological Survey |
| Publisher location | Reston, VA |
| Contributing office(s) | Central Midwest Water Science Center |
| Description | 4 p. |
| Online Only (Y/N) | N |
| Additional Online Files (Y/N) | N |