

June 2022 Floods in the Upper Yellowstone River Basin
Links
- Document: Report (5.2 MB pdf) , HTML , XML
- NGMDB Index Page: National Geologic Map Database Index Page (html)
- Download citation as: RIS | Dublin Core
Introduction
Extraordinary floods surged down the Yellowstone River and its tributaries in northwestern Wyoming and south-central Montana on June 13–15, 2022. Evacuations were carried out in Yellowstone National Park, the Stillwater Mine, and the towns of Belfry, Fromberg, Livingston, and Red Lodge, Montana. Campers were rescued by boat from campgrounds in the Beartooth foothills along the Stillwater River in Montana (https://www.ktvq.com/news/local-news/raging-beast-campers-rescued-from-flooded-stillwater-river; Hauter, 2022). Many roads and bridges were destroyed, including the main road to the north entrance of Yellowstone National Park from Gardiner, Mont. Homes, other buildings, and vehicles were washed away.
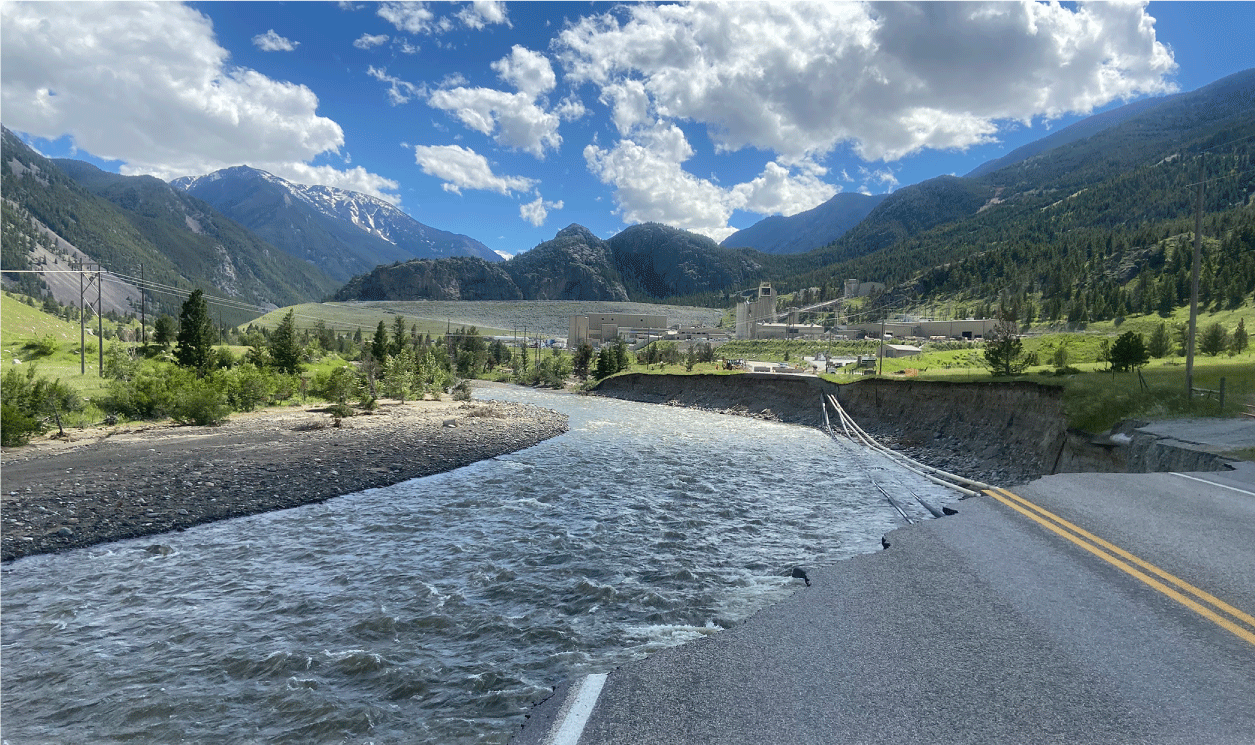
Washout on State Highway 419 along the Stillwater River, south of Nye, Montana. Photograph taken by Seth Siefken, U.S. Geological Survey, on June 21, 2022.
During the flood, U.S. Geological Survey (USGS) staff worked to maintain real-time data from streamgages by making field measurements of streamflow and repairing damaged equipment while communicating the latest streamflow information with the public and with local, State, and Federal agencies. After the flood, staff surveyed high-water marks (HWMs), computed peak streamflow at streamgages unreachable during the flood, and updated flood-frequency estimates for streamgages in the Upper Yellowstone River Basin (fig. 1).
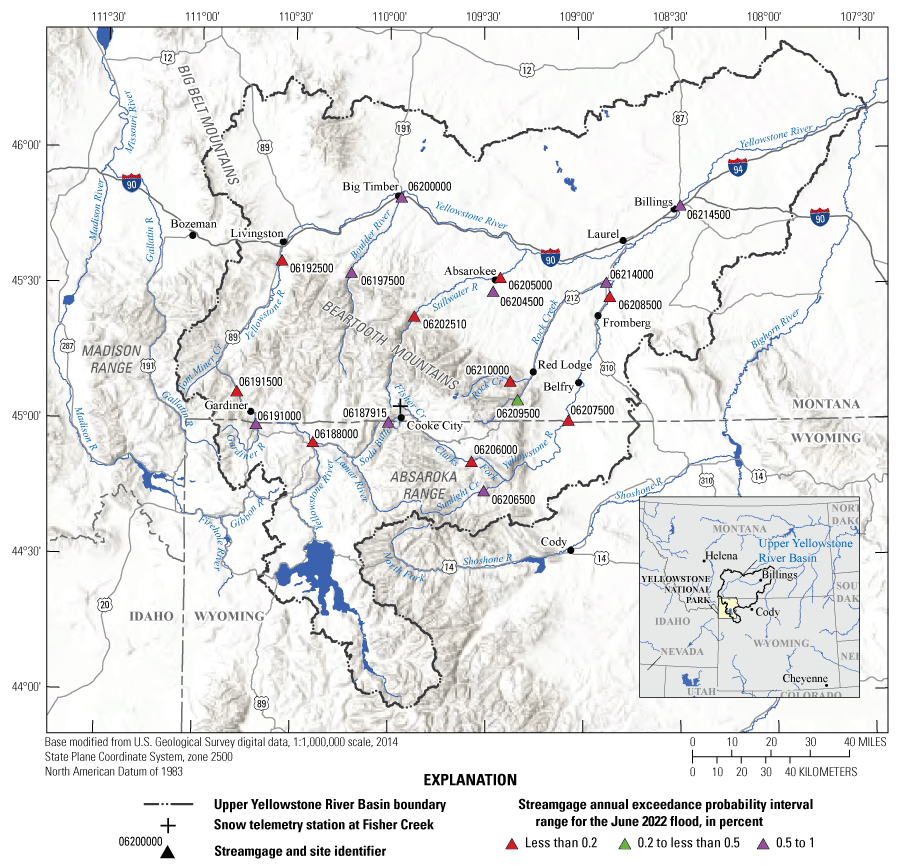
Locations of selected streamgages and a snow telemetry station in the Upper Yellowstone River Basin. Streamgage information from U.S. Geological Survey (2024) and snow telemetry information from Natural Resources Conservation Service (2024).
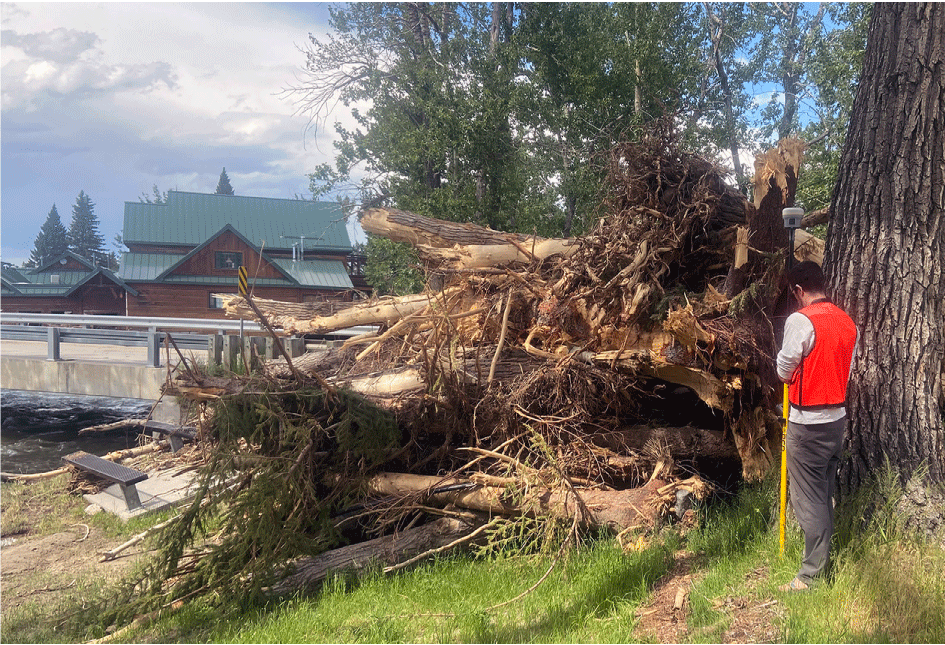
U.S. Geological Survey staff surveying a high-water mark (debris line) along Rock Creek in Red Lodge, Montana. Photograph taken by Seth Siefken, U.S. Geological Survey, on June 29, 2022.
Streamflows were the highest on record at 17 streamgages in the Upper Yellowstone River Basin. River stages were highest on record at most of those streamgages (fig. 1, table 1). The flood-related data and analyses summarized in this fact sheet are available online:
-
• USGS National Water Information System database (https://waterdata.usgs.gov/nwis; U.S. Geological Survey, 2024),
-
• StreamStats (https://streamstats.usgs.gov/ss/; Sando and others, 2016),
-
• ScienceBase landing page for USGS peak-flow frequency analyses (https://www.sciencebase.gov/catalog/item/5852f60be4b0e2663625ee71; U.S. Geological Survey, 2018), and
-
• USGS Flood Event Viewer (https://stn.wim.usgs.gov/fev/#2022JuneMTFlood; U.S. Geological Survey, 2022).
Table 1.
Peak stage and streamflow data for June 2022, previous maximum streamflow and associated stage for period of record, and annual exceedance probability (AEP) ranges at selected streamgages. Unless otherwise noted, streamflow for the 2022 flood event peaked on June 13, 2022. Also unless otherwise noted, AEP data are from Siefken and others (2023).[Peak streamflow and stage data and streamgage information are from the U.S. Geological Survey National Water Information System (U.S. Geological Survey, 2024). Dates are given in month/day/year and month/year formats. mi2, square mile; ft3/s, cubic foot per second; ft, foot; AEP, annual exceedance probability; YNP, Yellowstone National Park; <, less than; --, no data, not computed, or not determined; ab, above; Cr, Creek; nr, near; W F, west fork]
AEPs were calculated using data through 2015 (Sando and others, 2016) and do not include the 2022 flood peak.
The 2022 peak streamflow was on June 12, 2022, at Soda Butte Creek at Park Boundary at Silver Gate.
At the Yellowstone River at Corwin Springs, Montana, the 1997 peak streamflow was also 32,200 ft3/s.
June 2022 Drought, Snowpack, and Precipitation
On June 7, 2022, much of Montana and Wyoming, including parts of the Yellowstone River Basin, were in moderate to exceptional drought (National Drought Mitigation Center, 2022). In the Absaroka Range and the Beartooth Mountains, however, snowpack continued to build in late May, and by early June, the snowpack was much greater than average for the time of year (Natural Resources Conservation Service, 2024). The snow water equivalent at the Fisher Creek snow telemetry site in the Beartooth Mountains was 35.1 inches (in.), or 144 percent of the 1991–2020 average for that site (Natural Resources Conservation Service, 2024). On June 8, 2022, an atmospheric river caused heavy rain in Washington, Oregon, and California before moving inland toward Idaho and Montana (Center for Western Weather and Water Extremes, 2022). From June 9 to June 13, 2–5 in. of rain fell on melting snow over parts of the Upper Yellowstone River Basin, for a combined “total water event” of 4–9 in. (National Oceanic and Atmospheric Administration, 2022).
Flood Frequencies and Peak Timing
Frequency of floods can be described in terms of annual exceedance probability (AEP) or the percentage chance that a flood of a given size will be exceeded in any year. Larger floods are less likely and therefore correspond to smaller AEPs. The 2022 peak streamflows were greater than the 1-percent AEP flood for 18 streamgages and were greater than the 0.2-percent AEP flood for 9 streamgages (table 1).
At most streamgages in the Upper Yellowstone River Basin, streamflow peaked on June 13, 2022. Sudden increases in streamflow (fig. 2) at USGS streamgages Lamar River near Tower Ranger Station in Yellowstone National Park, Wyoming (06188000), and Yellowstone River at Corwin Springs, Mont. (06191500), just north of Yellowstone National Park, provided a warning for the downstream communities of Livingston and Billings, Mont. The time between peak streamflow at Corwin Springs and peak streamflow at Livingston (about 50 miles downstream from Corwin Springs) was about 7 hours (fig. 2). The time between peak streamflow at Livingston and peak streamflow at Billings (about 140 miles downstream from Livingston) was about 35 hours. The peak arrived at Billings on the morning of June 15, 2022.
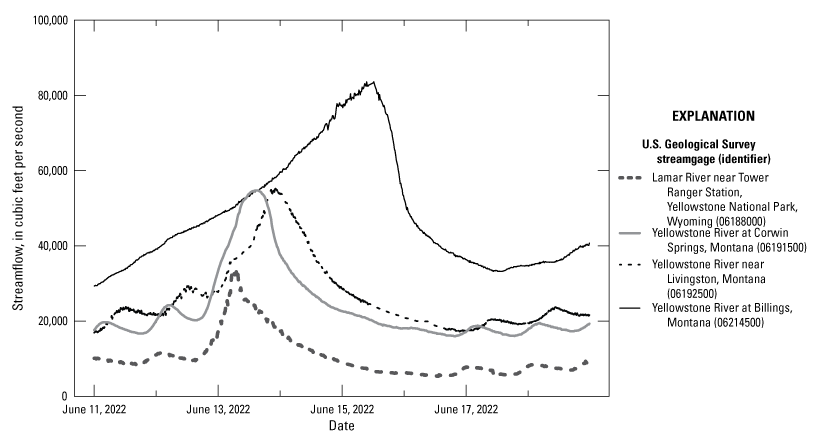
Hydrographs for streamgages on the Lamar River and Yellowstone River, Wyoming and Montana, June 11–18, 2022 (U.S. Geological Survey, 2024).
HWM Data on the USGS Flood Event Viewer
Staff from the USGS and Montana Department of Natural Resources and Conservation surveyed locations and elevations of HWMs along three streams in Montana: Rock Creek in Red Lodge, Clarks Fork of the Yellowstone River at Fromberg, and Yellowstone River from Tom Miner Creek to Laurel. The HWM descriptions, locations, and elevations are available on the USGS Flood Event Viewer (https://stn.wim.usgs.gov/fev/#2022JuneMTFlood; U.S. Geological Survey, 2022). Funding from the Federal Emergency Management Agency and Montana Department of Natural Resources and Conservation made this HWM work possible.
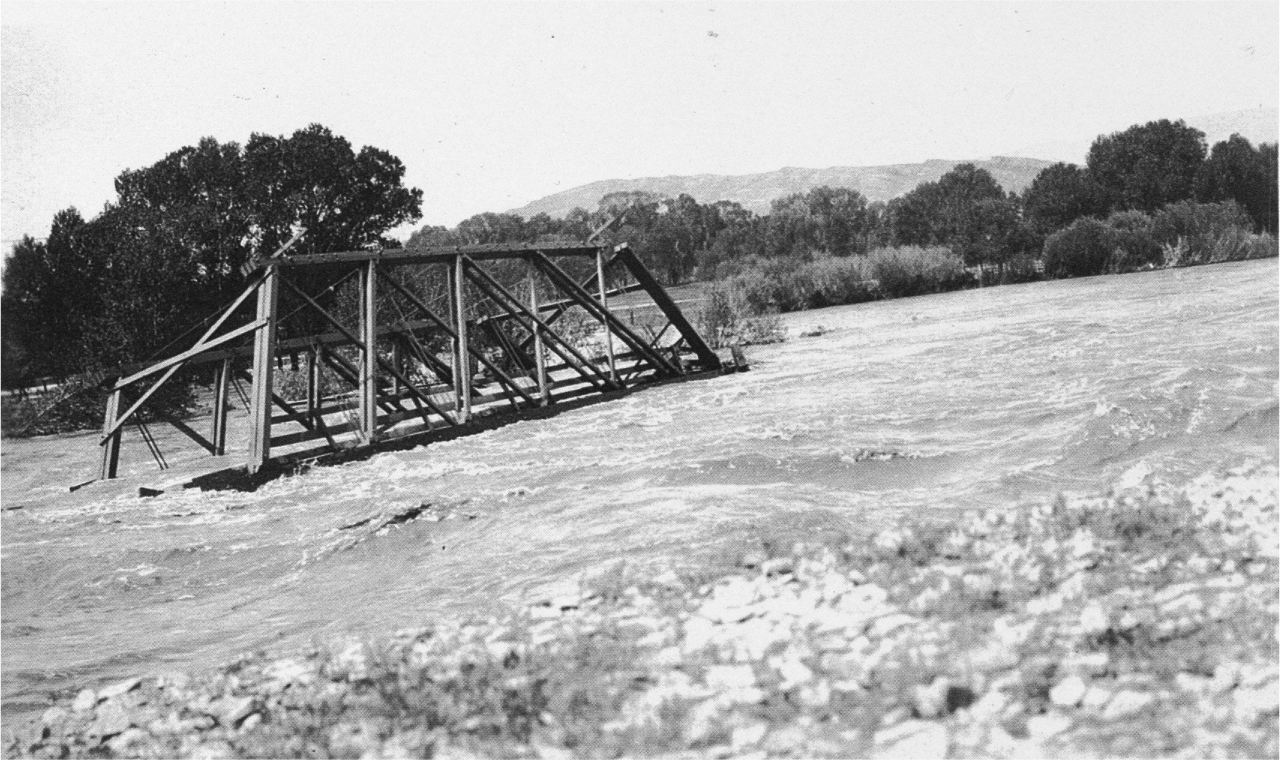
The 1918 Yellowstone River flood caused the Harvat Bridge washout in Livingston, Montana (image number 2011.010.0395 provided by the Yellowstone Gateway Museum, used with permission).
Historical Floods
The Yellowstone River is no stranger to large flood events. Written records of large floods exist as far back as 1873, and a major event was recorded in 1881. One of the largest flood events on the Yellowstone River was in 1894. Papers stated, “The Yellowstone reached the climax Wednesday (6th) when it was twenty inches above the high-water mark of last year and several inches higher than two years ago” (The Stillwater Bulletin, 1894, p. 4). Farmers, ranchers, and citizens across the State struggled with water pouring onto their lands and into their cities, thinking anything larger was unimaginable. However, 24 years later, in 1918, another drastic flood swept across cities along the Yellowstone River, devastating towns, businesses, and family homes. In Billings, Mont., reporters recorded water heights that exceeded the previously recorded HWM by 19 in. (The Billings Gazette, 1918a, b). The water rose rapidly, causing trains to overturn and bridges to be washed out. Travel came to a stop across the southern half of the State (Billings Evening Journal, 1918; The Billings Gazette, 1918c; Park City Pioneer, 1918). Smaller towns like Columbus took on mass amounts of water, and papers reported water was 3–4 feet deep over the approaches to the Yellowstone River (The Billings Gazette, 1918c). This was the largest well-recorded flood event before 2022; however, several other large flood events along the Yellowstone River have been documented in recent years, including 1978, 1996, 1997, and 2011. The 1978, 1996, and 1997 floods submerged historic sites such as Pompey’s Pillar, shutting down travel across the lower half of the State (Crisp, 1996). The flood of 1978 exceeded $33 million in damage, and 19 counties between Montana and Wyoming were listed as disaster areas (Parrett and others, 1984).
Changes in Historical Peak Streamflows
The 2022 Upper Yellowstone River Basin floods were rare compared to floods over the past century (table 1). Could climate and other changes in the basin make them more likely in the future? Scientists have searched historical climate and streamflow data for evidence that precipitation, temperature, and streamflow have been changing. Marti and others (2024) and Ryberg and others (2024) determined that annual peak streamflows have increased for one or more of the periods analyzed at most of the Upper Yellowstone River Basin streamgages included in their analyses.
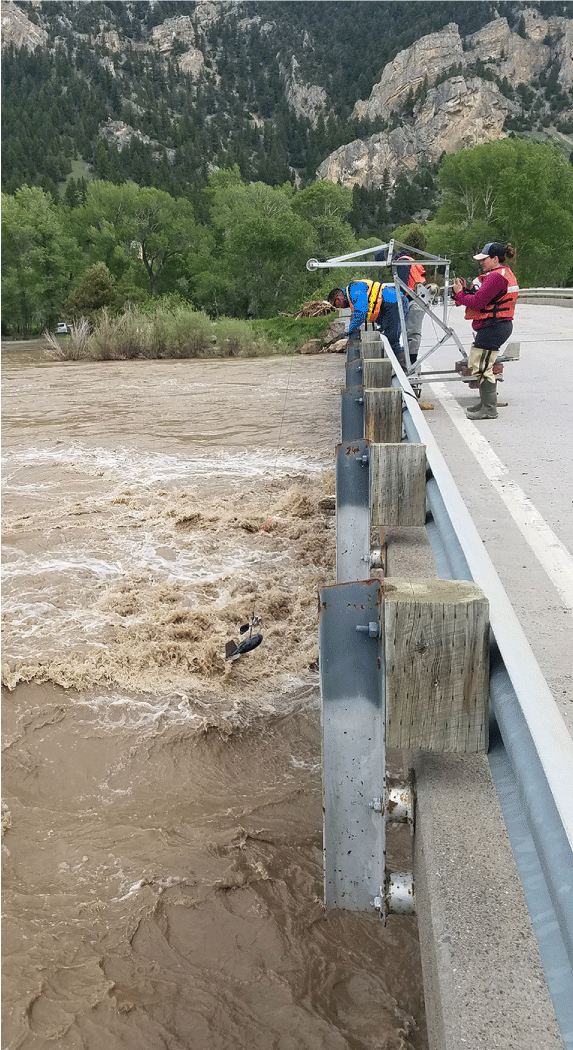
U.S. Geological Survey staff measuring streamflow on the Yellowstone River near Livingston, Montana. Photograph taken by Dan Armstrong, U.S. Geological Survey, on June 14, 2022.
Selected References
Billings Evening Journal, 1918, Flood decreases here but is rising in Livingston section: Billings, Mont., Billings Evening Journal, June 14, 1918, accessed December 2023 at https://www.newspapers.com/article/billings-evening-journal-billings-colum/137962686/.
The Billings Gazette, 1918a, Battle to keep river within its banks: Billings, Mont., The Billings Gazette, June 13, 1918, accessed December 2023 at https://www.newspapers.com/article/the-billings-gazette-billings-pg1-pg8/137962224/.
The Billings Gazette, 1918b, Fight to keep flooded river within banks—Yellowstone on worst rampage recorded in history: Billings, Mont., The Billings Gazette, June 13, 1918, accessed January 23, 2024, at https://www.newspapers.com/article/the-billings-gazette-billings-pg1-pg8/137962041/.
The Billings Gazette, 1918c, Unprecedented flood recalls experiences of days gone by: Billings, Mont., The Billings Gazette, June 19, 1918, accessed January 29, 2024, at https://www.newspapers.com/article/the-billings-gazette-billings-compared/137963401/.
Center for Western Weather and Water Extremes, 2022, CW3E event summary—9–12 June 2022: Center for Western Weather and Water Extremes, Scripps Institution of Oceanography, University of California, San Diego, web page, accessed January 29, 2024, at https://cw3e.ucsd.edu/cw3e-event-summary-9-12-june-2022/.
Crisp, D., 1996, Workers, sand help landmark stay dry: Billings, Mont., The Billings Gazette, June 14, 1996, accessed April 18, 2024, at https://www.newspapers.com/article/the-billings-gazette-1996-flood/145566400/.
Frankson, R., Kunkel, K.E., Champion, S.M., Easterling, D.R., and Jencso, K., 2022, State climate summaries 2022—Montana: National Oceanic and Atmospheric Administration Technical Report NESDIS 150–MT, 5 p., accessed March 28, 2024, at https://statesummaries.ncics.org/chapter/mt/.
Gallagher, S., 1997, State is wet—Experts—Not a flood crisis: Helena Mont., The Independent-Record, June 13, 1997, accessed April 18, 2024, at https://www.newspapers.com/article/the-independent-record-1997-pompeys-pi/145566672/.
Hauter, A., 2022, ‘Raging beast’—Campers rescued from flooded Stillwater River: Scripps Media, Inc., June 13, 2022, accessed March 28, 2024, at https://www.ktvq.com/news/local-news/raging-beast-campers-rescued-from-flooded-stillwater-river.
Marti, M.K., Wavra, H.N., Over, T.M., Ryberg, K.R., Podzorski, H.L., and Chen, Y.R., 2024, Peak streamflow data, climate data, and results from investigating hydroclimatic trends and climate change effects on peak streamflow in the Central United States, 1920–2020: U.S. Geological Survey data release, accessed March 28, 2024, at https://doi.org/10.5066/P9R71WWZ.
National Drought Mitigation Center, 2022, Map archive [June 7, 2022], U.S. Drought Monitor: National Drought Mitigation Center digital data, accessed January 29, 2024, at https://droughtmonitor.unl.edu/Maps/MapArchive.aspx.
National Oceanic and Atmospheric Administration, 2022, Storm Events Database [Carbon County flood event]: National Oceanic and Atmospheric Administration database, accessed March 30, 2024, at https://www.ncdc.noaa.gov/stormevents/eventdetails.jsp?id=1039252.
Natural Resources Conservation Service, 2024, Snow and water interactive map: Natural Resources Conservation Service Natural Water and Climate Center digital data, accessed March 30, 2024, at https://www.nrcs.usda.gov/resources/data-and-reports/snow-and-water-interactive-map.
Park City Pioneer, 1918, Local happenings: Park City, Mont., Park City Pioneer, July 19, 1918, accessed January 3, 2024, at https://www.newspapers.com/article/park-city-pioneer-friday-july-19th-191/137957555/.
Parrett, C., Carlson, D.D., Craig, G.S., and Chin, E.H., 1984, Floods of May 1978 in southeastern Montana and northeastern Wyoming: U.S. Geological Survey Professional Paper 1244, 74 p., accessed March 28, 2024, at https://doi.org/10.3133/pp1244.
Ryberg, K.R., Over, T.M., Levin, S.B., Heimann, D.C., Barth, N.A., Marti, M.K., O’Shea, P.S., Sanocki, C.A., Williams-Sether, T.J., Wavra, H.N., Sando, T.R., Sando, S.K., and Liu, M.S., 2024, Introduction and methods of analysis for peak streamflow trends and their relation to changes in climate in Illinois, Iowa, Michigan, Minnesota, Missouri, Montana, North Dakota, South Dakota, and Wisconsin, chap. A of Ryberg, K.R., comp., Peak streamflow trends and their relation to changes in climate in Illinois, Iowa, Michigan, Minnesota, Missouri, Montana, North Dakota, South Dakota, and Wisconsin: U.S. Geological Survey Scientific Investigations Report 2023–5064, 27 p., accessed March 28, 2024, at https://doi.org/10.3133/sir20235064A.
Sando, S.K., McCarthy, P.M., and Dutton, D.M., 2016, Peak-flow frequency analyses and results based on data through water year 2011 for selected streamflow-gaging stations in or near Montana: U.S. Geological Survey Scientific Investigations Report 2015–5019–C, 27 p., accessed March 28, 2024, at https://doi.org/10.3133/sir20155019C.
Siefken, S.A., Taylor, N.J., and Hamilton, W.B., 2023, Peak-flow frequency analyses for selected streamgages in the Upper Yellowstone River Basin, based on data through water year 2022: U.S. Geological Survey data release, accessed March 28, 2024, at https://doi.org/10.5066/P9J1U1GB.
U.S. Geological Survey, 2018, Peak-flow frequency analyses by the U.S. Geological Survey Wyoming-Montana Water Science Center: U.S. Geological Survey digital data, March 28, 2024, at https://www.sciencebase.gov/catalog/item/5852f60be4b0e2663625ee71.
U.S. Geological Survey, 2022, Short-Term Network Data Portal: U.S. Geological Survey digital data, accessed March 28, 2024, at https://stn.wim.usgs.gov/fev/#2022JuneMTFlood.
U.S. Geological Survey, 2024, USGS water data for the Nation: U.S. Geological Survey National Water Information System database, accessed March 28, 2024, at https://doi.org/10.5066/F7P55KJN.
For more information about this publication, contact:
Director, USGS Wyoming-Montana Water Science Center
3162 Bozeman Avenue
Helena, MT 59601
406–457–5900
For additional information, visit the USGS project website: https://www.usgs.gov/centers/wyoming-montana-water-science-center/science/peak-flow-frequency-analysis-selected-montana
Publishing support provided by the Rolla Publishing Service Center
Disclaimers
Any use of trade, firm, or product names is for descriptive purposes only and does not imply endorsement by the U.S. Government.
Although this information product, for the most part, is in the public domain, it also may contain copyrighted materials as noted in the text. Permission to reproduce copyrighted items must be secured from the copyright owner.
Suggested Citation
Chase, K.J., Dutton, D., Hamilton, W.B., Siefken, S.A., Vander Voort, C., and Whiteman, A., 2024, June 2022 floods in the Upper Yellowstone River Basin: U.S. Geological Survey Fact Sheet 2024–3035, 6 p., https://doi.org/10.3133/fs20243035.
ISSN: 2327-6932 (online)
ISSN: 2327-6916 (print)
Study Area
| Publication type | Report |
|---|---|
| Publication Subtype | USGS Numbered Series |
| Title | June 2022 floods in the Upper Yellowstone River Basin |
| Series title | Fact Sheet |
| Series number | 2024-3035 |
| DOI | 10.3133/fs20243035 |
| Publication Date | August 30, 2024 |
| Year Published | 2024 |
| Language | English |
| Publisher | U.S. Geological Survey |
| Publisher location | Reston, VA |
| Contributing office(s) | WY-MT Water Science Center |
| Description | 6 p. |
| Country | United States |
| State | Idaho, Montana, Wyoming |
| Other Geospatial | Upper Yellowstone River Basin |
| Online Only (Y/N) | N |
| Additional Online Files (Y/N) | N |