

Bascom Laser Diffraction Sedimentology Laboratory, Reston, Virginia
Links
- Document: Report (1.22 MB pdf) , HTML , XML
- Download citation as: RIS | Dublin Core
Introduction
At the Bascom Laser Diffraction Sedimentology Laboratory, which is located in the Florence Bascom Geoscience Center at U.S. Geological Survey (USGS) headquarters in Reston, Virginia, scientists use physical sedimentology and particle characterization techniques to conduct detailed sediment characterization. Scientists address research problems in collaboration with other USGS science centers, State geological surveys, commercial industry, universities, and other partners. Laboratory capabilities include laser diffractometry for quantitative particle-size analysis (fig. 1), portable x-ray fluorescence (XRF) analysis for determining elemental abundances in rock or sediment samples, petrographic analysis of geologic media, and mechanical sieve analysis. These methods are used to analyze soil and sediment core material from terrestrial, marine, and lacustrine environments, surface sediments from coastal regions, and calcareous materials. Work done by the laboratory supports geologic mapping, resource assessments, land change studies, and geohazard analyses.
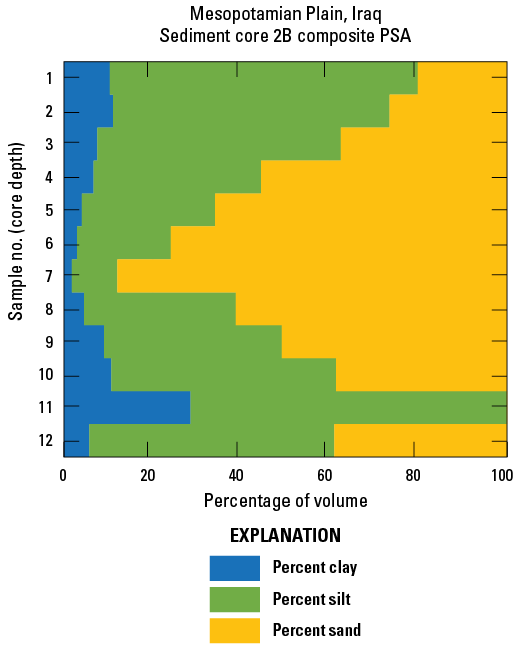
Graph showing an example of a sediment core grain-size profile that depicts percentages of clay, silt, and sand within the core.
Laser Diffractometry
The laboratory operates state-of-the-art laser diffraction systems (fig. 2) for high-resolution particle-size analysis, including a Beckman Coulter LS 13 320 XR1 and a Malvern Mastersizer 3000E.1 During analysis, sediment samples are cycled through a liquid suspension system, where they interact with laser beams to generate a characteristic diffraction pattern. This diffraction pattern is used to calculate the quantitative particle-size distribution of each sample. The use of laser diffraction combined with polarization intensity differential scattering (PIDS) technology1—which illuminates samples with vertical and horizontal polarized light at three wavelengths (approx. 450, 600, and 900 nanometers)—produces particle-size data for materials ranging from 10 nanometers to 3.5 millimeters in diameter.
Any use of trade, firm, or product names is for descriptive purposes only and does not imply endorsement by the U.S. Government.
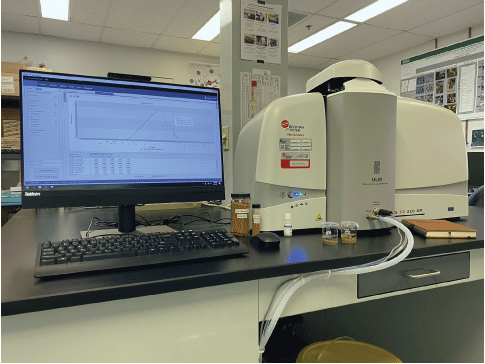
Photograph of laser diffraction equipment used for particle-size analysis. Photograph by Grant Colip, U.S. Geological Survey.
Sediment Characterization
In conjunction with particle-size analyses (fig. 3) that use laser diffractometry and traditional mechanical sieve analysis, laboratory scientists use a suite of analytical tools for detailed sample characterization. These tools include instrumentation for magnetic susceptibility, conductivity, portable XRF (which provides elemental abundance data for sediment or rock samples in the laboratory or field), and petrographic microscopy using standard or multifocus imaging. The laboratory is also equipped to disaggregate clays using physical and chemical deflocculation, remove organic content via ignition in a muffle furnace, and heat, refrigerate, and dry samples.
Laser diffraction is used to analyze a variety of sediment types:
• Sediment core and borehole materials
• Detrital critical mineral deposits
• Surficial geologic map unit subsamples
• Deep marine sediments
• Aggregates, powders, and engineering materials
• Lake and river sediments
• Soils and paleosols
• Storm deposits
• Heavy mineral host sediments
• Dune and delta sands
• Carbonate sediments
• Coastal and near-shore deposits
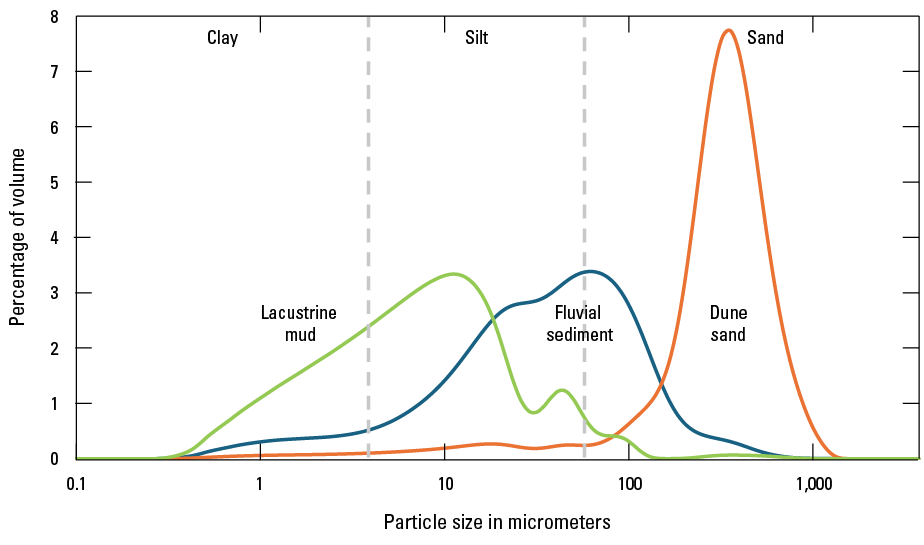
Graph showing an example of quantitative particle-size distribution curves for lacustrine mud, fluvial sediment, and dune sand.
Research Applications
Surficial Geologic Mapping
Laboratory analyses including laser diffractometry, mechanical sieve analysis, and XRF are essential for characterizing and describing surficial (Quaternary) geologic map units. Surficial geologic mapping initiatives are increasingly important to U.S. priorities, including critical mineral inventories, economic development, water and resource security, aggregate resources, and infrastructure. Detailed sediment analyses are a component of active and ongoing (2026) geologic mapping funded by the National Cooperative Geologic Mapping Program at and around Fort Drum in Jefferson and Lewis Counties, New York (fig. 4). USGS scientists are working with the Department of Defense to study issues pertaining to infrastructure development, aggregate resources, and subsurface hydrology. Sediment analysis data for the Fort Drum study are used to characterize and describe the surficial map units shown on geologic maps used and interpreted by decision makers.
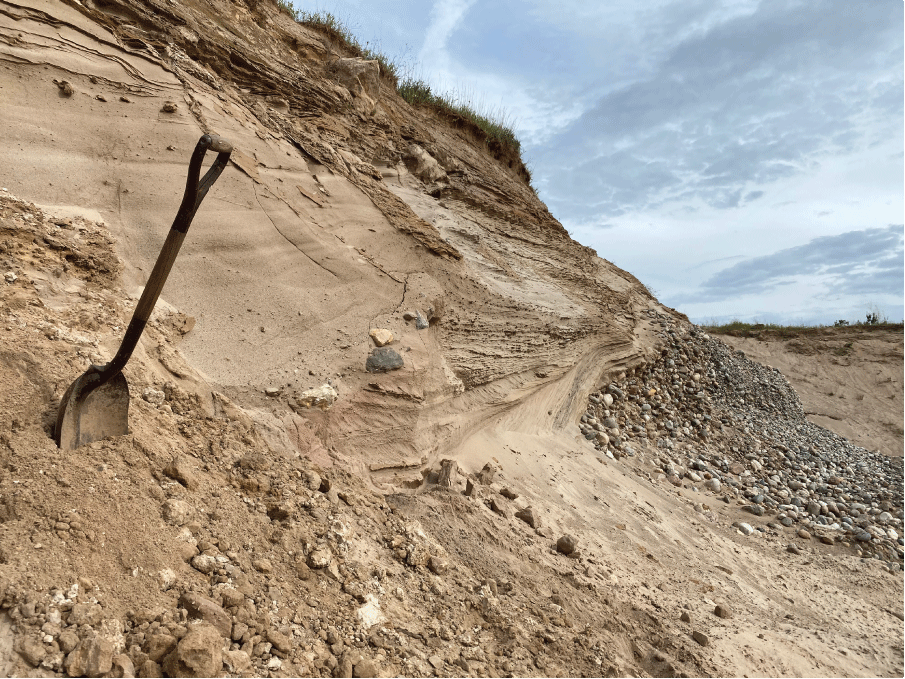
Photograph of ice-contact subaqueous fan deposits analyzed as part of a study at and around Fort Drum in Jefferson and Lewis Counties, New York. Photograph by Grant Colip, U.S. Geological Survey.
Soils, Aggregates, and Infrastructure
The size distribution of grains present in soils and aggregate materials is a physical property essential for understanding their associated hydrology, sedimentology, and geology, which can inform their suitability for use in engineering and industrial applications. Grain size and shape also influence the degree to which soils are prone to erosion. By pairing laser diffraction methods with traditional sieve analysis, the laboratory can analyze diverse particle sizes and shapes, including spherical to subrounded materials and nonspherical sediments, such as organics or platy clays. Researchers use laser diffraction and traditional sieve analysis for reconnaissance studies and detailed characterizations of soils and near-surface sediments for their subsequent use in civil engineering, agricultural development, geotechnical surveys, and other areas. Data on particle sizes and other sediment characteristics help to build and strengthen the physical infrastructure upon which the Nation relies (fig. 5).
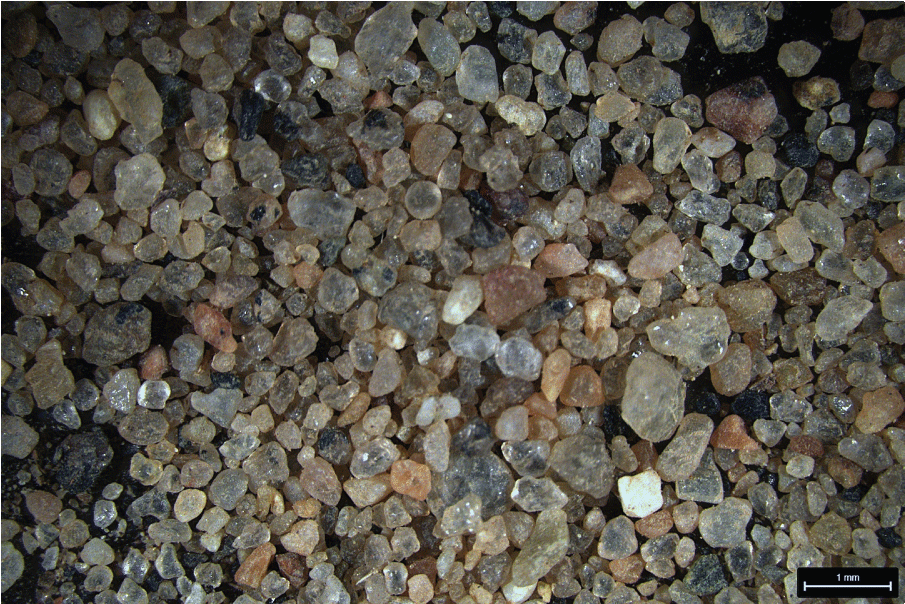
Photograph of mineral grains in dune sand. Photograph by Grant Colip, U.S. Geological Survey.
Quaternary Carbonate Sedimentology
Documenting trends in grain-size and sorting is useful for characterizing carbonate environments, such as those found in aeolian dune systems. When coupled with microscope petrography, particle-size distributions from laser diffractometry can help to quantitatively describe and differentiate intervals in geologic time when elevated sea levels (highstands) promoted sediment deposition at increased elevations. These techniques are applied to sediments sampled from recent Quaternary history in the Bahamas and other coastal regions. Information from these sources benefits sediment transport modeling and contributes to advances in coastal geomorphology, and can be used to compare aeolian deposition between carbonate and clastic environments during highstand intervals analogous to present-day conditions.
Storm Impacts and Coastal Resilience
The characteristics of sediment deposits associated with major modern storm events (such as hurricanes) can be used to (1) inform predictions about storm impacts, (2) study the recurrence of storm events throughout the late Holocene, and (3) provide information about land use and land change for researchers and decision makers. Particle size analysis via laser diffractometry was used to obtain quantitative information about storm deposits associated with Hurricane Irma, a Category 4 storm that affected Everglades National Park and the Florida coast in 2017 (fig. 6). USGS researchers are working with the National Park Service and the Army Corps of Engineers to use these results and other sediment characteristics to assess storm effects and study how future storms may affect coastlines and communities.
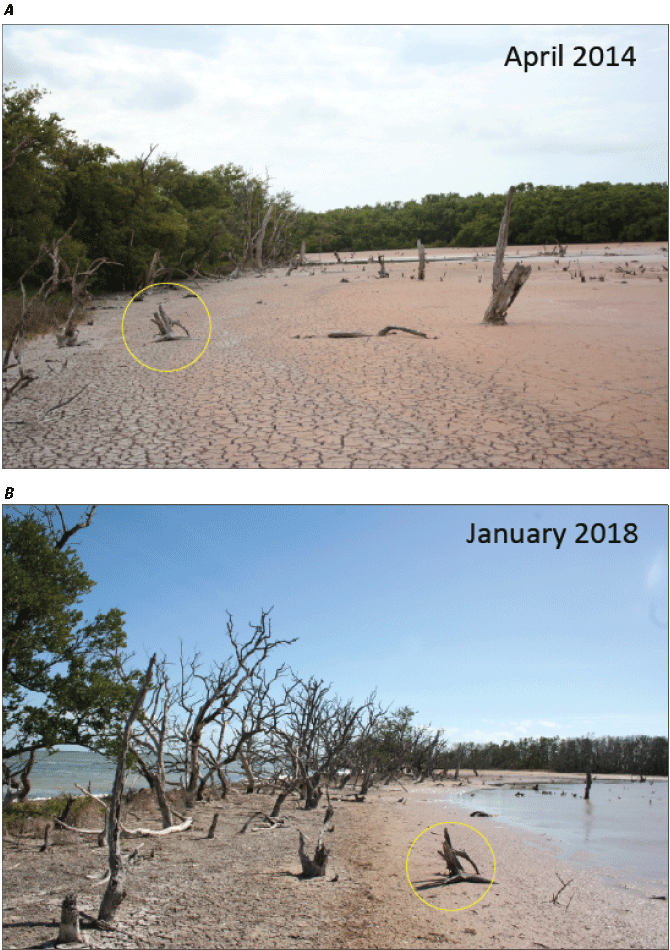
Photographs showing coastal land change (A) before Hurricane Irma (April 2014) and (B) after Hurricane Irma (January 2018). Yellow circles highlight the location of a mangrove stump used as a landmark in each photo. Photographs by Lynn Wingard, U.S. Geological Survey.
Biostratigraphy and Sedimentation
Particle size distributions across shallow to deep marine transects can be correlated with changes in microfossil biostratigraphy to identify changes in paleogeography and paleoceanography across a region and through time. Onshore cored material from the southeastern Atlantic Coastal Plain of South Carolina is compared to sediments from Long Bay (near the border of North Carolina and South Carolina) to identify and map erosional and depositional pathways of sand (fig. 7). When coupled with biostratigraphy, comparisons of changing sand and clay patterns allow researchers to identify hiatuses—breaks or interruptions in the deposition of sediment—and provide a means for producing lateral maps of sand distribution and thickness. Offshore sands are used by States as sources for beach replenishment and as potential sources for mining heavy minerals.
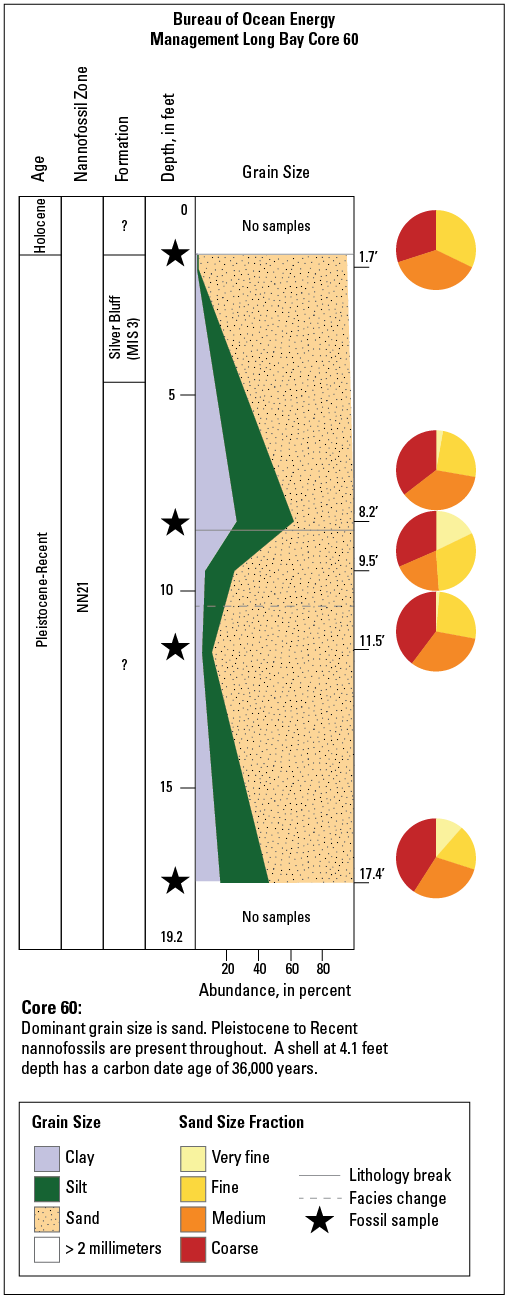
Example graph showing particle (grain) size data from a sediment core (labeled core 60) collected from the Long Bay region, South Carolina, correlated with nannofossil zones, sediment formations, and ages. Grain sizes shown as clay, silt, sand, and >2 millimeters. Size fractions of sand shown as very fine, fine, medium, and coarse. Modified image appears courtesy of Kristina Gardner, U.S. Geological Survey.
For additional information, contact:
Director, Florence Bascom Geoscience Center
U.S. Geological Survey
12201 Sunrise Valley Drive
Reston, VA 20192
https://www.usgs.gov/centers/florence-bascom-geoscience-center
Disclaimers
Any use of trade, firm, or product names is for descriptive purposes only and does not imply endorsement by the U.S. Government.
Although this information product, for the most part, is in the public domain, it also may contain copyrighted materials as noted in the text. Permission to reproduce copyrighted items must be secured from the copyright owner.
Suggested Citation
Colip, Grant D., 2026, Bascom Laser Diffraction Sedimentology Laboratory, Reston, Virginia: U.S. Geological Survey Fact Sheet 2025–3051, 4 p., https://doi.org/10.3133/fs20253051.
ISSN: 2327-6932 (online)
| Publication type | Report |
|---|---|
| Publication Subtype | USGS Numbered Series |
| Title | Bascom Laser Diffraction Sedimentology Laboratory, Reston, Virginia |
| Series title | Fact Sheet |
| Series number | 2025-3051 |
| DOI | 10.3133/fs20253051 |
| Publication Date | February 09, 2026 |
| Year Published | 2026 |
| Language | English |
| Publisher | U.S. Geological Survey |
| Publisher location | Reston, VA |
| Contributing office(s) | Florence Bascom Geoscience Center |
| Description | 4 p. |
| Online Only (Y/N) | Y |
| Additional Online Files (Y/N) | N |