

Monitoring of Wave, Current, and Sediment Dynamics Along the Fog Point Living Shoreline, Glenn Martin National Wildlife Refuge, Maryland
Links
- Document: Report (5.01 MB pdf) , HTML , XML
- Data Release: USGS data release - Field observation of wind waves and current velocity (2020) along the Fog Point Living Shoreline, Maryland
- NGMDB Index Page: National Geologic Map Database Index Page (html)
- Download citation as: RIS | Dublin Core
Acknowledgments
This report was prepared as a part of a multiple year project funded by the National Fish and Wildlife Foundation (project number 55032) to collect ecological data and models of living shoreline restoration projects for the effectiveness assessment of living shoreline structures across the northeast and mid-Atlantic coasts. This study was conducted in collaboration with Northeastern University, U.S. Fish and Wildlife Service, and Louisiana State University. We thank Leslie Valentine (Louisiana State University) for sediment laboratory analysis. We thank Jenna Brown (U.S. Geological Survey) and Anthony M. Priestas (U.S. Army Corps of Engineers) for their constructive reviews of this report.
Abstract
Living shorelines with salt marsh species, rock breakwaters, and sand nourishment were built along the coastal areas in the Glenn Martin National Wildlife Refuge, Maryland, in 2016 in response to Hurricane Sandy (2012). The Fog Point living shoreline at Glenn Martin National Wildlife Refuge was designed with the “headland - breakwater - embayment” pattern. Scientists from the U.S. Geological Survey, Northeastern University, U.S. Fish and Wildlife Service, and Louisiana State University studied wave, current, and sediment dynamics to assess the effectiveness of the Fog Point living shoreline structures in terms of wave attenuation and erosion reduction. Wave gages, current meters, sediment traps, sediment tiles, and lateral erosion pins were deployed along the Fog Point shoreline during February 10–14, 2020. Because of COVID-19 pandemic travel restrictions, sensors were not retrieved until August 25, 2021, which was 18 months after field deployment, resulting in tremendous loss or damage of sensors and sediment measurements.
Monitoring data indicated that wave heights were substantially reduced at locations behind the breakwater (headland) compared to the wave heights in the offshore location, but not at the location in the control area (the embayment). Current patterns and current velocities at the location behind the breakwater were complex and changed dramatically compared to the current patterns and current velocities offshore. Sediments were blocked by the breakwater most of the time except during periods of storms with wave heights larger than 0.9 meter, when waves overtopped the breakwater and brought sediments to the tidal flat and salt marshes behind the breakwater. Behind the breakwater, both sediment deposition and erosion were observed during the 18 months of monitoring. Continued low elevation marsh edge erosion from wave undercutting along the embayment was observed, especially at the existing wave-cut gullies.
Monitoring results indicate that the “breakwater + marsh planting” structure along the Fog Point shoreline has limited shoreline protection capacity. Marsh edge erosion behind the breakwater was likely caused by the limited sediment supply from marine sources for transport and delivery, as well as the effects of circulation and current velocity on the settling and deposition of suspended sediments from eroded marshes. Marsh edge erosion continued in the embayment or control area where no shoreline restoration structures were implemented. Long-term (decadal scale) monitoring and adaptive management of living shoreline structures could help to assess the effectiveness of wave attenuation for reducing shoreline erosion and enhancing vegetation growth for trapping sediments and the effectiveness of marsh surface elevation growth for keeping pace with sea level rise.
Introduction
Coastal shoreline erosion (retreat) is a concern for many coastal communities. Coastal shoreline erosion varies with shoreline geomorphological settings, vegetation, and soil conditions. Along the New England and mid-Atlantic coasts, shoreline retreat rates were estimated to be –0.5 (plus or minus [±] 0.09) meter per year (Hapke and others, 2011). The driving forces of coastal shoreline erosion include wind waves, sea level rise (SLR), climate change, hurricanes, storm surge, and land use change (Hapke and others, 2011; Leonardi and others, 2016; Sanford and Gao, 2018; Zhu and others, 2020). Traditionally, coastal infrastructure and shorelines have been protected from erosion by “gray” approaches (hard armoring), such as bulkheads, seawalls, revetments, groins, and breakwaters (O’Donnell, 2017). However, these approaches were found to have adverse environmental impacts, such as reduction of sediment supply along the shore and reduced habitat suitability for fish and wildlife species (Sutton-Grier and others, 2015). Hard structures tend to increase wave reflection and cause scouring at the edges of the structure, thus creating further erosion (O’Donnell, 2017). More and more “green” approaches are being used in coastal shoreline restoration and protection. “Green,” or nature-based approaches use artificial oyster reefs, such as oyster castles or oyster shells, and vegetation, such as salt marshes and seagrass. These nature-based features are also called living shorelines. Sometimes hybrid approaches that combine “green” and “grey” structures (for example, salt marsh bands with rock breakwater) are also used. Following Hurricane Sandy’s landfall in 2012, the U.S. Congress designated funds to restore shorelines along the New England and mid-Atlantic coasts in 2013. Monitoring and assessment of living shoreline ecological, environmental, and economical effects have also been conducted after the construction of living shoreline projects.
Since 2017, U.S. Geological Survey (USGS) scientists, in collaboration with Northeastern University, U.S. Fish and Wildlife Service (USFWS), Louisiana State University, The Nature Conservancy, and other State and local agencies, have been monitoring and modeling wind waves, current patterns, and sediment dynamics of the living shoreline restoration projects with funding from the National Fish and Wildlife Foundation (NFWF). Four living shoreline restoration projects (Gandys Beach, New Jersey; Chincoteague, Virginia; Fog Point, Maryland; and Shinnecock, New York) were selected from 12 restoration projects along the New England and mid-Atlantic coasts funded by NFWF Hurricane Sandy Coastal Resiliency Competitive Grant Program for the research. The objectives of the cooperative research are to (1) assess the effectiveness of living shoreline structures on wave energy attenuation, current pattern changes, and sediment deposition and erosion by using field investigations with short-duration monitoring, (2) predict the capacity of living shoreline structures to attenuate wind waves and current velocities and to reduce sediment erosion by using hydrodynamic and wave modeling with field data for calibration and validation, and (3) provide data and information for adaptive management of these living shoreline restoration projects in the face of future climate change and SLR.
The monitoring and modeling work at Gandys Beach, N.J., and Chincoteague, Va., indicate that oyster-reef-based living shoreline structures could reduce shoreline erosion and improve the habitat of fish and wildlife species through wave energy attenuation and current velocity reduction (Zhu and others, 2020; Wang and others, 2021; Salatin and others, 2022; Wang and others, 2023b).Wave attenuation, velocity reduction, and sediment erosion reduction by living shoreline structures depend on structure features (location, configuration, height, width, length), tidal range, water depth, soil properties (for example, texture, porewater salinity), and vegetation properties (for example, stem height, density, growth, integrity) (Chowdhury and others, 2019; Wiberg and others, 2019; Zhu and others, 2020; Morris and others, 2021; Wang and others, 2021). Design and implementation of sustainable living shoreline structures can help to promote resilient coastal shorelines under future climate change conditions and SLR. For oyster-reef-based living shoreline projects, sustainable living shoreline design can achieve long-term engineering and ecological benefits simultaneously (Morris and others, 2019). Oyster-reef-based living shoreline structure can prevent shoreline erosion via wave energy attenuation (Zhu and others, 2020; Wang and others, 2021). Oyster-reef-based structures can also improve habitat suitability for oyster growth, recruitment, and spat settlement via maintaining current velocity (less than [<] 15 centimeters per second [cm/s] and inundation duration (60–90 percent) (Theuerkauf and others, 2019; Salatin and others, 2022).
For the hybrid approach that uses rock breakwaters and salt marsh vegetation, sustainable living shoreline design needs to use breakwater to attenuate wave attacks on the shoreline and use vegetation to capture sediment for marsh elevation growth. Marsh vertical accretion rates need to exceed relative SLR to avoid excess inundation stress on vegetation. Coastal vegetation, including mangrove forest, salt marsh, and seagrass, plays an important role in attenuating wave and current energy, thereby protecting shorelines from erosion. Nevertheless, plant species with different biomechanical properties could perform differently in wave energy attenuation. These plant biomechanical properties include total plant height, stem height (length), stem diameter, and stem density. The effect of vegetation on wave attenuation is often incorporated in numerical wave modeling and is represented by a drag coefficient that varies with plant biomechanical properties of different species in space and time (Garzon and others, 2019; Zhu and Chen, 2019). For example, Garzon and others (2019) studied the effects of different combinations of Spartina alterniflora plant attributes on wave attenuation along the Eastern Shore of Virginia National Wildlife Refuge near the mouth of Chesapeake Bay. In their study, three stem lengths (0.4, 0.6, and 0.8 meter [m]), three stem densities (200, 300, and 400 stem per square meter [m2], and three stem diameters (4, 5.5, and 7 millimeters [mm]) were examined. Garzon and others (2019) found that wave height decays ranged from 40 to 85 percent within the first 50 m from marsh edge, given the same water depth, incoming wave height, and intermediate meadow conditions (diameter, 5.5 mm; density, 300 stems/m2; and stem length, 0.6 m). Therefore, field measurements of vegetation properties, in conjunction with wave, current, and shoreline geomorphological factors (such as topography, bathymetry, and shoreline configuration), are vital for monitoring and predicting the effects of living shoreline structures on wave attenuation and shoreline protection.
The USFWS, in collaboration with Federal, State, and local partners (Maryland Department of Natural Resources, U.S. Army Corps of Engineers, Audubon Maryland-DC, and Friends of Blackwater National Wildlife Refuge [NWR]), constructed 6,387 m (20,950 feet [ft]) of living shoreline along Fog Point at Glenn Martin National Wildlife Refuge by using rock breakwaters and salt marsh planting as the living shoreline structure. The Fog Point living shoreline construction was completed in June 2016. The specific goals of the restoration project were to (1) prevent the loss of existing tidal marsh and submerged aquatic vegetation habitats; and (2) create approximately 8 acres of dune and emergent marsh habitat through the addition of sand and marsh planting to support shoreline stabilization (USFWS, 2015). It was anticipated that more than 1,000 acres of interior tidal high marsh, sheltered water, submerged aquatic vegetation, and clam beds would be protected against the effects of future storms (USFWS, 2015). In this study, the USGS, in collaboration with Northeastern University, USFWS, and Louisiana State University, conducted field measurements of wave, current, and sediment dynamics in the Fog Point living shoreline restoration area with and without the “breakwater + marsh planting” and field survey of vegetation biophysical properties during an 18-month period from February 2020 through August 2021. Collected data were used to examine the magnitude, mechanisms, and processes in wave attenuation and reduction of current velocity. Sediment deposition and erosion and the influences of biophysical forces, including wave, current, and vegetation, on sediment dynamics along the Fog Point living shoreline were evaluated and are discussed in this report.
Study Area
The Fog Point Living Shoreline Restoration Project, funded by the U.S. Congress under the Hurricane Sandy Disaster Relief Supplemental Appropriation Act of 2013, Public Law 113-12, is located at the northern shore of Glenn Martin National Wildlife Refuge (Martin NWR), on the northern end of Smith Island, Somerset County, Md. (fig. 1). Martin NWR covers 18.41 square kilometers (km2) of coastal wetlands composed of tidal marsh, embayments, creeks, and vegetated ridges that form an important stopover and wintering area for thousands of migratory waterfowl, as well as nesting habitats for various wildlife species (https://www.fws.gov/refuge/martin). The tidal range is approximately 0.56 m, estimated from the nearby National Oceanic and Atmospheric Administration (NOAA) station (8571421). Salinity in this region ranges from 11 to 19 parts per thousand (Perini Management Services and others, 2014).
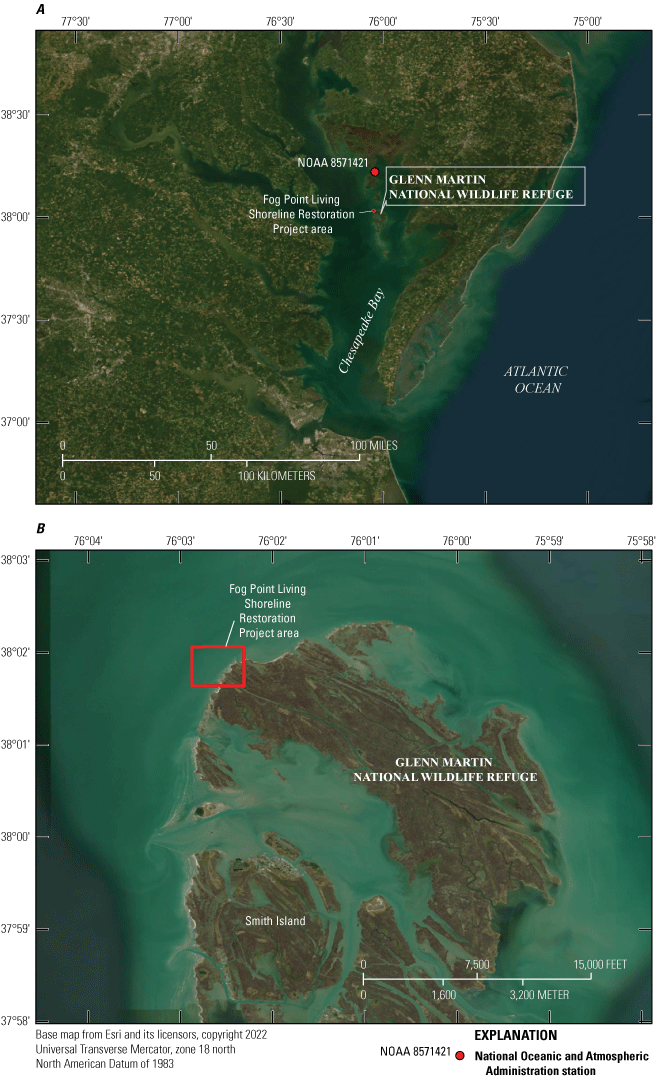
A, Location of the Glenn Martin National Wildlife Refuge in relation to Chesapeake Bay and B, location of the Fog Point Living Shoreline Restoration Project area within the Glenn Martin National Wildlife Refuge, Maryland.
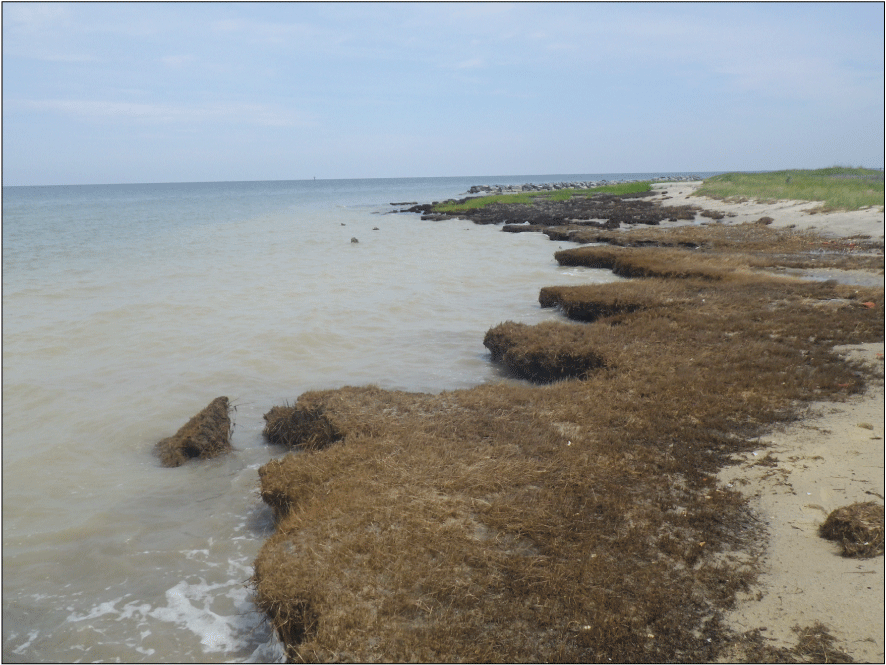
The shorelines in the Martin NWR are exposed to prevailing wind and wave energy of the open Chesapeake Bay and are highly vulnerable to storms. Therefore, shoreline erosion (fig. 2) is an imminent risk to the refuge and the human and wildlife benefits that the refuge provides. The shorelines along the northern and western shores of the refuge have retreated at a rate of 0.61 to 5.5 m per year (2 to 18 feet per year) from 2001 to 2013, resulting in the loss of nearly 3.3 acres of prime fish and wildlife habitat annually (Perini Management Services and others, 2014; USFWS, 2015).
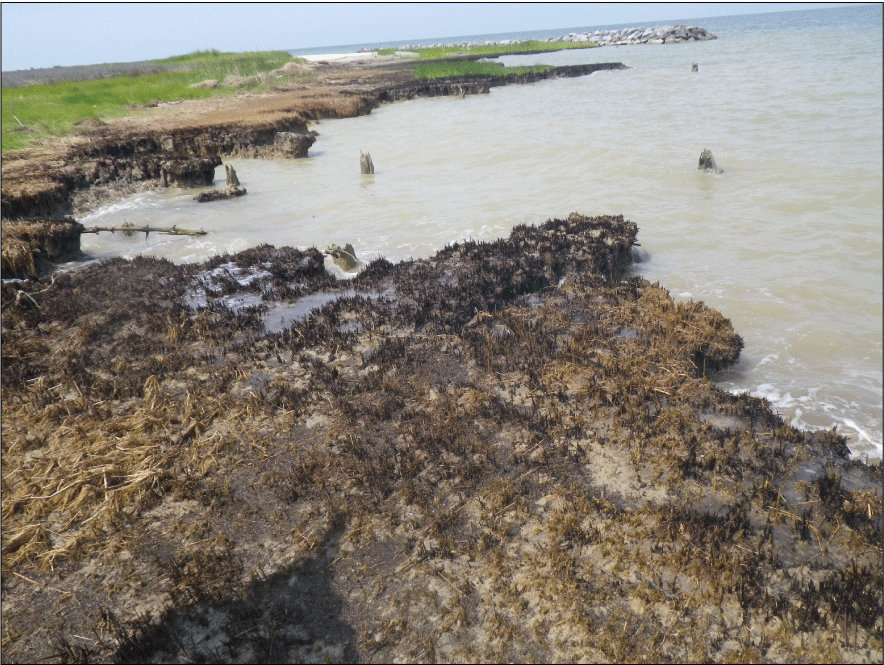
Degraded low marsh at low tide during the site visit on July 11, 2017, in the Fog Point Living Shoreline Restoration Project study area. The breakwater and healthy low marsh Spartina alterniflora can be seen in the far background. The four tree stumps in the middle of the photograph are indicative of landward migration of this coastal wetland. Brown and dark colors indicate the death of large areas of low marsh S. alterniflora (dead roots) caused by long-term sea level rise and wave action, resulting in the collapse of the low marsh and formation of shoreline scarps in the embayment area. Photograph by Hongqing Wang, U.S. Geological Survey.
In 2016, rock breakwaters, approximately 76 m (250 ft) in length, were constructed in front of existing headlands adjacent to pocket beaches. Enough sand was then added to connect the marsh and breakwater to accommodate plantings of S. alterniflora (figs. 3, 4). Within the study area, sandy storm deposits are ubiquitous, and they typically extend from the low marshland inward, spanning approximately 3 to 25 m (fig. 5).
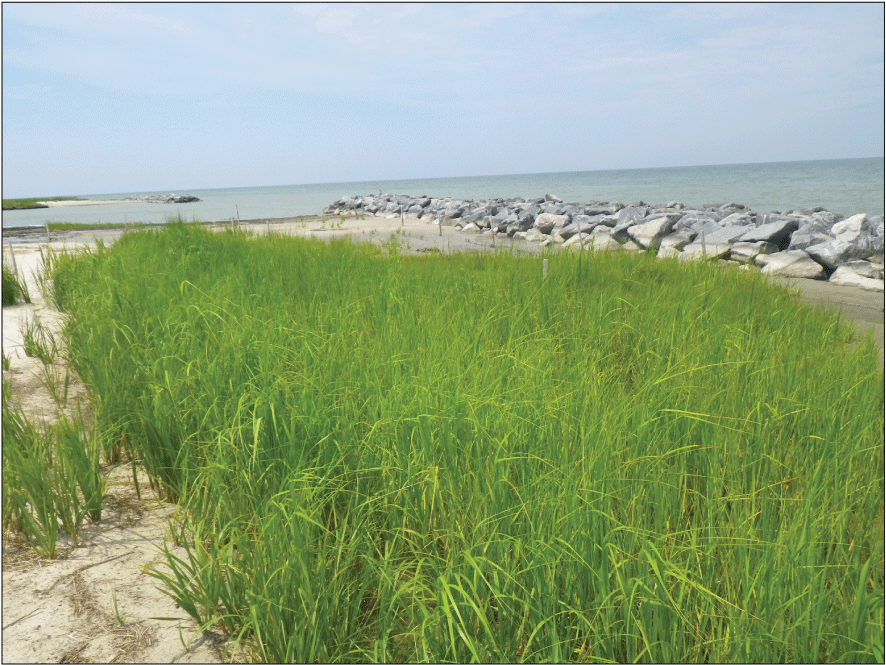
Salt marsh plants (Spartina alterniflora) growing behind the breakwater at the Fog Point Living Shoreline Restoration Project study area on July 11, 2017, nearly 1 year after breakwater construction. Photograph by Hongqing Wang, U.S. Geological Survey.
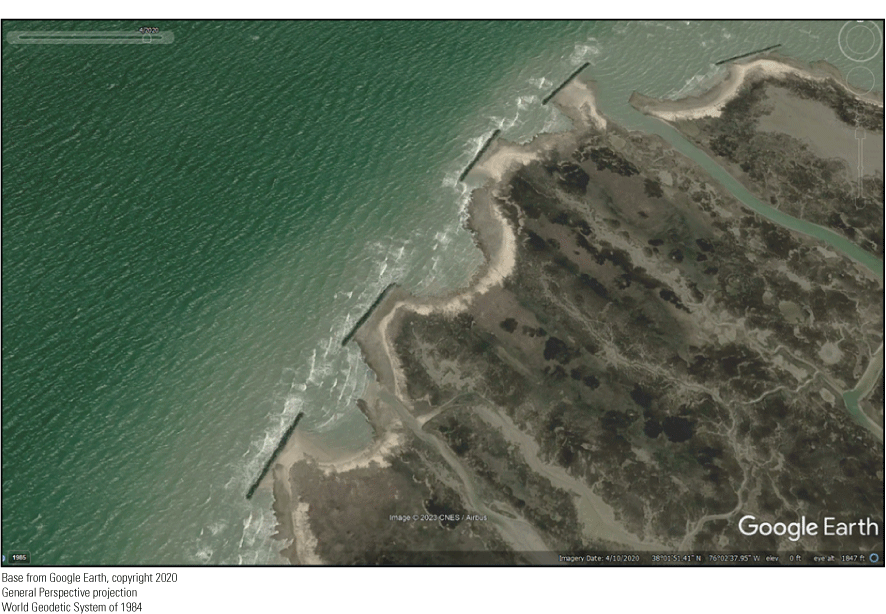
The “headland - breakwater - embayment” pattern in the Fog Point Living Shoreline Restoration Project study area within Glenn Martin National Wildlife Refuge in Maryland’s Chesapeake Bay.
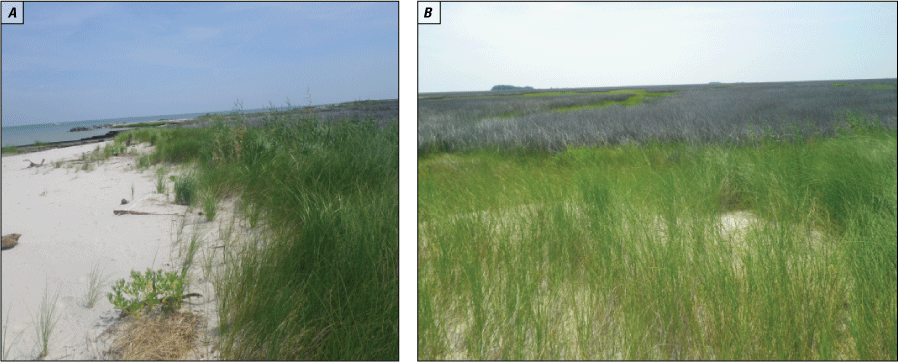
A, The sandy berm between low marsh (Spartina alterniflora) near the shoreline and high marsh (S. patens and Distichlis spicata) and B, the high marsh inside the sandy berm (sand dunes) and landward interior of the marsh area in the Fog Point Living Shoreline Project study area, July 2017. In photograph B, S. patens are green, and Juncus roemerianus are gray; an area of upland forest can be seen on the left side in the background within the Glenn Martin National Wildlife Refuge. Photographs by Hongqing Wang, U.S. Geological Survey.
The area and shape of the sandy berm were dictated by mean high tide, storm surge high water levels, and aggressive waves (Hardaway and Byrne, 1999) when debris of plants were brought to the upper berm line (fig. 5). The Fog Point Living Shoreline Restoration Project construction was completed in fall 2016.
Methods
Field Deployment of Monitoring Equipment
For this study, we chose a specific headland with a breakwater and an adjacent embayment to monitor waves, currents, and sediment deposition with and without breakwater protection. Multiple locations within the headland were selected to assess the spatial variations in wave, current and sediment dynamics. Sensors and equipment were installed at low tide from February 10 to February 14, 2020.
To collect wave data, six pressure transducers (wave gages [WGs]) from Ocean Sensor Systems, Inc. (OSSI-010-003C) were installed at a water depth in the range of 0 (behind breakwater) to 2 m (offshore location) to measure water levels in 20-minute bursts every 30 minutes using a sampling rate of 10 hertz (Hz) (fig. 6A).
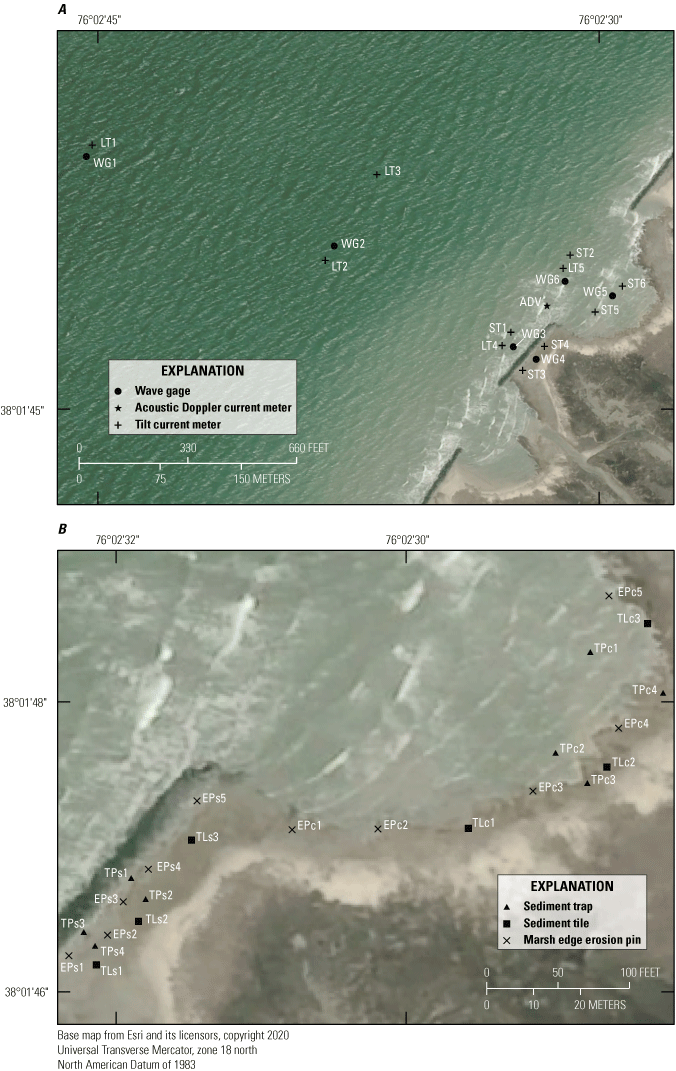
Locations of A, wave gages, tilt current meters, and an acoustic Doppler current meter and B, sediment tiles, sediment traps, and marsh edge erosion pins in the Fog Point Living Shoreline Project study area in the Glenn Martin National Wildlife Refuge, Maryland.
For measuring flow velocity and direction from offshore to nearshore, 11 tilt current meters (TCMs) were installed at a water depth in the range of 0.1 (behind breakwater) to 2 m (offshore location). These TCMs, from Lowell Instruments LLC, consisted of six long TCMs with a velocity range of 0–80 centimeters per second (cm/s) and five short TCMs with a velocity range of 0–60 cm/s. Each TCM was equipped with a tilt-corrected compass housed in a buoyant casing; the casing was then attached to a concrete paver block measuring 1 square foot on the sediment surface (see fig. 7B).
Additionally, an acoustic Doppler current meter (ADV) (Argonaut-ADV from SonTek) was deployed near the boundary between the breakwater and the embayment at a water depth of approximately 0.8 m to measure changes in circulation patterns for verification of the suitability of TCMs for measuring current velocity in shallow embayments (fig. 6A). The TCMs and ADV operated continuously at a rate of 16 Hz in bursts lasting 20 seconds. Sediment dynamics were quantified by following the specific methods from a previous NFWF-funded living shoreline restoration project (Wang and others, 2021). For this study, ceramic sediment tiles were used to quantify the sediment mass accumulation on the marsh surface, while pin/trap sets were used to quantify the mass flux of sediment located approximately 1.0 ft (0.3 m) above the marsh or sediment bed.
To measure sediment accumulation, six sites were selected in the study area: three behind the breakwater and three in the embayment (fig. 6B). At each site, three replicates of ceramic tiles (15.24 centimeters [cm] x 15.24 cm) were placed. Additionally, eight sediment pin/trap sets were installed, with four located behind the breakwater and four in the embayment (fig. 6B). To quantify lateral marsh erosion, 10 marsh edge erosion pins (1.25-inch PVC pipes) were placed vertically behind the shoreline along the study area to measure any horizontal movement of the marsh edge during the monitoring period. Among these pins, five were placed behind the breakwater and five along the embayment (fig. 6B). Examples of equipment installation are shown in figure 7.
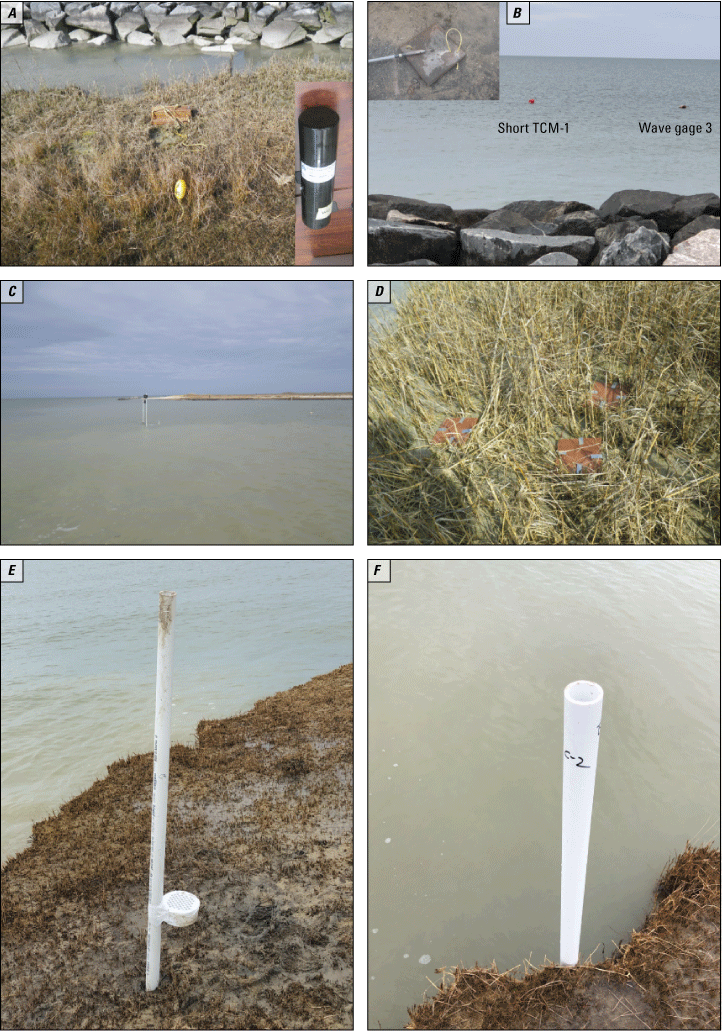
Examples of field deployment of A, wave gages, B, tilt current meters, C, an acoustic Doppler current meter with two GoPro cameras on top of the tripod, D, sediment tiles, E, sediment traps, and F, marsh edge erosion pins along the Fog Point living shoreline in the Glenn Martin National Wildlife Refuge, February 2020. Photographs by Hongqing Wang, U.S. Geological Survey, and Qin Chen, Northeastern University.
The coordinates and elevations of WGs, TCMs, ADV, sediment trap/pin sets, sediment tiles, and marsh erosion pins were measured by using a survey-grade Global Positioning System during the deployment (fig. 8). An elevation survey was conducted by using a static Global Navigation Satellite System with a horizontal accuracy of ±0.015 m (0.05 ft) and a vertical accuracy of ±0.03 m (0.10 ft).
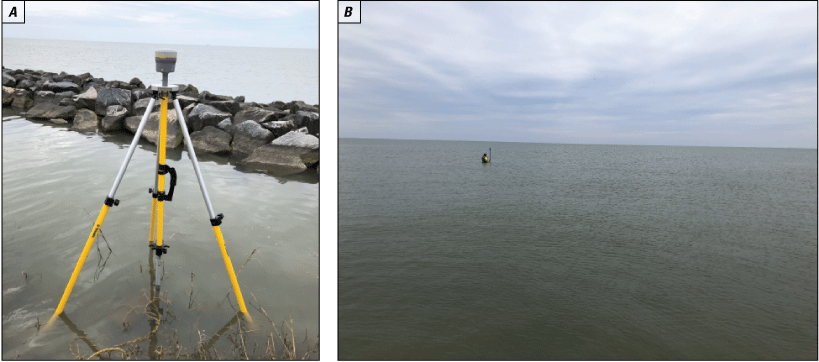
A Global Positioning System being used to measure A, the elevation of the wave gage (WG4) behind the breakwater and B, wave gages (WG5, WG6) in the embayment (and nearby tilt current meters) in the Fog Point Living Shoreline Project study area, February 2020. Photographs by Hongqing Wang, U.S. Geological Survey.
Retrieval of Equipment
A site visit to retrieve instruments and conduct additional measurements was originally scheduled for May 2020. However, travel was restricted owing to the COVID-19 pandemic. Local fishermen were asked to help with the sensor retrievals. Only two wave gages were retrieved in the summer of 2020. During August 2021, the remaining sensors were retrieved, and onsite measurements were made. On August 25, 2021, other WGs and current meters, including the ADV, were retrieved, and onsite measurements were made. One additional WG and one TCM were found and retrieved, but other WGs and current meters were lost. The ADV was completely damaged by storms and other disturbances over this 18-month period in the water. The locations where the WGs and the current meter were retrieved are shown in figure 9.
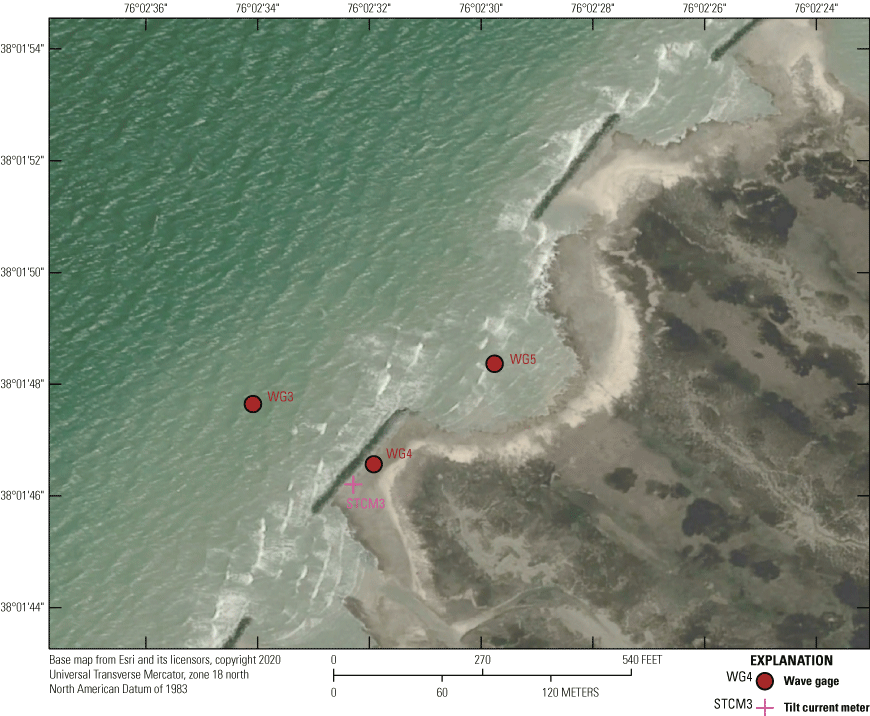
Locations of the retrieved three wave gages and one tilt current meter along the Fog Point living shoreline in the Glenn Martin National Wildlife Refuge, Maryland, 2020.
During August 2021, sediment tiles behind the breakwater were retrieved, but sediment tiles in the embayment area were lost. Of the eight sediment traps, only the four behind the breakwater and one in the embayment (TPc2 on fig. 6B) were found. The vertical movement of the traps was measured onsite, and water and sediment inside the traps were transferred to 500-milliliter (mL) bottles and shipped to Louisiana State University for laboratory analysis of sediment mass and grain size distribution. The erosion pins along the marsh edge in the embayment area were all lost, but all erosion pins protected by the breakwater survived; the distances from marsh edge to the pins were measured to determine marsh horizontal accretion or deposition at these pin locations from deployment (February 12, 2020) to retrieval (August 25, 2021).
During the retrieval phase in the summer of 2021, we also measured plant biophysical parameters, including total plant height, stem height, stem diameter, and stem density at two randomly selected 0.5-m x 0.5-m square plots. The plot behind the breakwater was dominated by S. alterniflora, and the plot in the control area was dominated by S. patens. According to Zhu and Chen (2019), total plant height is the length between the plant base and the tip of the plant with all blades aligned along the stem; stem height is the length between the plant base and the location of the topmost blade along the stem or the point at which the last leaf branches from the plant; stem diameter is the diameter measured at one-fourth of the distance of the stem from the ground; and stem density is the number of stems in an area (for example, 1 square meter).
Data Processing and Analysis
The WG-recorded raw gage pressure data were converted to desired wave parameters (water depth, wave heights, and periods) following the protocols described in Zhu and others (2020) and Wang and others (2021). The instrument measures a different atmospheric pressure from the reference pressure on calm days (in this study, it is the atmospheric pressure recorded at the nearby NOAA station 8571421 Bishops Head, which is 21.3 kilometers north of the study site). The difference in pressures was considered to be the instrument offset. The gage pressure (p) was calculated by subtracting the atmospheric pressure (patm) from the corrected water pressure data (ṕ) as p = ṕ−patm. The gage pressure was then converted to the water depth (h) as h = p/ρg, where ρ (=1,014 kilograms per cubic meter [kg/m3]) is the seawater density and g (=9.81 meters per second squared [m/s2]) is the gravitational acceleration. Then, each burst of water depth was converted to free surface elevation based on linear wave theory and was transformed to a wave energy spectrum by using the Ocean Wave Analyzing Toolbox (OCEANLYZ, version 2.0) (Karimpour and Chen, 2017). From the wave energy spectrum (Sηη), bulk wave characteristics such as zero-moment wave height (Hm0) and peak wave period (Tp) were extracted by using the following equations:
wherem0
is the zeroth moment of the wave energy spectrum,
f
is the frequency,
fmin-cutoff
is the minimum cutoff frequency,
fmax-cutoff
is the maximum cutoff frequency, and
fp
is the peak frequency associated with the maximum value of Sηη(f),
The raw current data collected from the TCMs underwent two processing steps:
-
1. Time-averaging over a 20-minute interval and
-
2. Capping the time-averaged current speed at 60 cm/s.
In this study, the flood and ebb tides were determined from the water level measurements at WG3 (fig. 6A). This procedure follows the methodology outlined in Wang and others (2021). The bearing angle (θ) of the mean current is defined as the angle relative to the northward velocity component. Mean current speeds and directions during flood and ebb tides were calculated for the location of the TCM. Monitoring data on wave height, peak period, water depth and current velocity are available in Wang and others (2023a).
Results
Wave Dynamics
WG3 was installed in front of the rock breakwater, WG4 was installed behind the breakwater, and WG5 was installed as a control location in the embayment without the protection of the headland breakwaters. The measured zero-moment wave heights (Hm0) and peak wave periods (Tp) at Fog Point from February to June 2020 ranged between 0 and 1.26 m and between 1 and 7 seconds (s), respectively (figs. 10–12). The time series of water depth, Hm0, and Tp at WG3, WG4, and WG5 during the monitoring period are shown in figures 10–12.
The wave height at WG3 was higher than at the other two gages. The wave height at WG4 behind the breakwater was lowest, ranging from 0 to 0.25 m. Note that the wave data collected at WG5 after May 11 were inaccurate; the measured water depth at WG5 deviated substantially from the tide after May 11, possibly due to the gage being disturbed by an unknown force. The cumulative distribution of wave height at the three gages is shown in figure 13. The wave height was highest at WG3 and lowest at WG4.
To better compare the wave parameters at the three gages, we generated scatter plots (fig. 14). As expected, the Hm0 at WG3 (offshore location) was the highest. The Hm0 at WG4, which was protected by structures, was the lowest among the three gages. The Tp values at WG3 and WG5 (embayment location) were similar and generally smaller than those observed at WG4, indicating that short waves were dissipated more by the low-crested breakwater. Throughout the deployment period, the average Hm0 values measured at WG3, WG4, and WG5 were 0.28 m, 0.04 m, and 0.25 m, respectively. The average Tp values were 2.77 seconds, 3.85 seconds, and 2.78 seconds at WG3, WG4, and WG5, respectively (Wang and others, 2023a). The decrease in wave height observed from WG3 to WG4 may be attributed to a combination of factors, including bathymetry (waves breaking because of varying depths), bottom friction, and the presence of breakwaters.
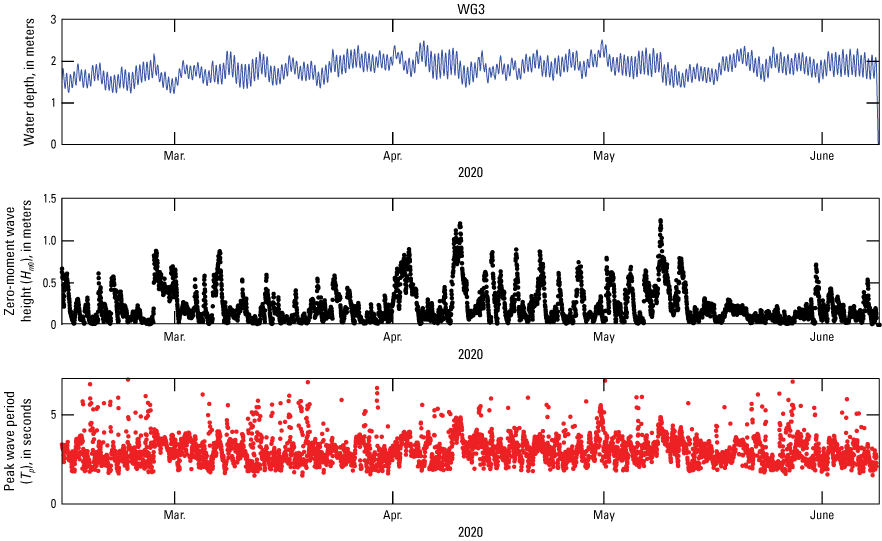
Time series of measured water depth, zero-moment wave height (Hm0), and peak wave period (Tp) at wave gage WG3, February–June 2020, Fog Point Living Shoreline Project study area in the Glenn Martin National Wildlife Refuge, Maryland.
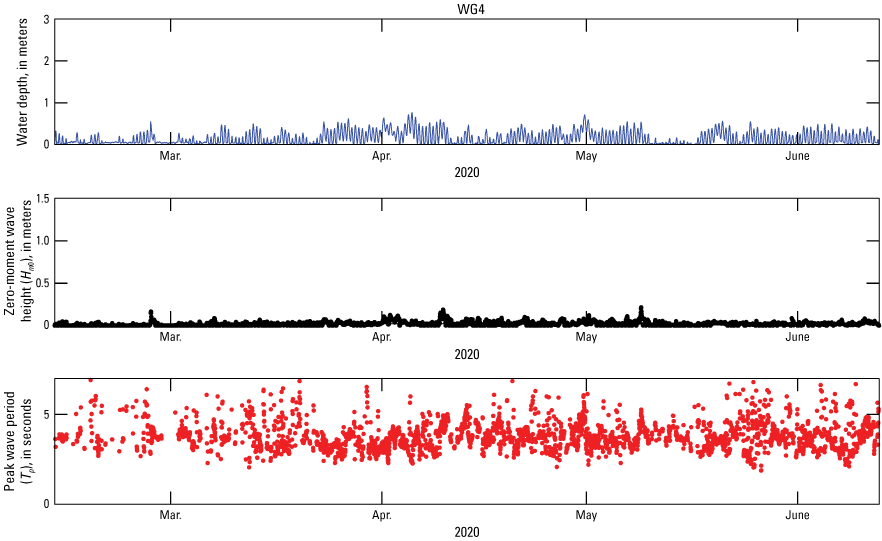
Time series of measured water depth, zero-moment wave height (Hm0), and peak wave period (Tp) at wave gage WG4, February–June 2020, Fog Point Living Shoreline Project study area in the Glenn Martin National Wildlife Refuge, Maryland.
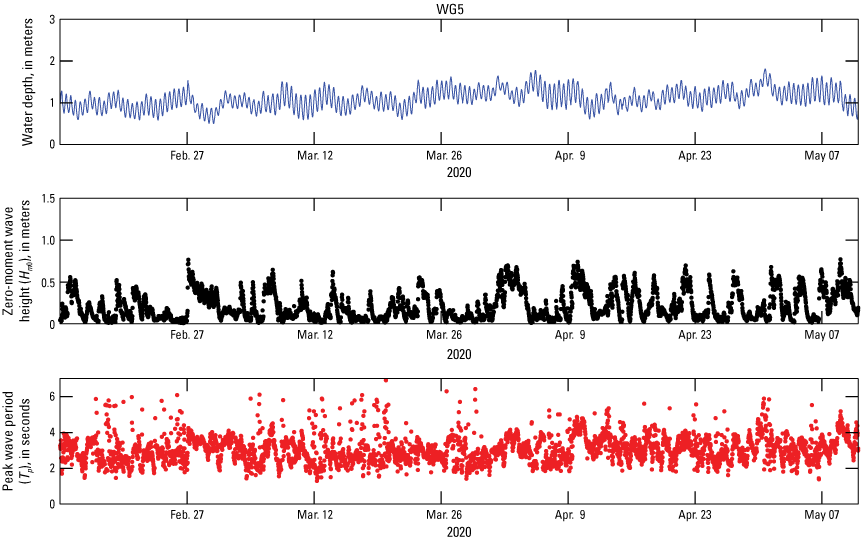
Time series of measured water depth, zero-moment wave height (Hm0), and peak wave period (Tp) at wave gage WG5, February–June 2020, Fog Point Living Shoreline Project study area in the Glenn Martin National Wildlife Refuge, Maryland. The data were removed after May 11, 2020, because the data were inaccurate.
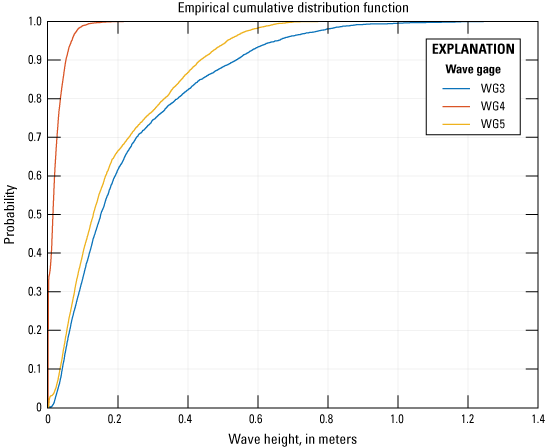
Cumulative distribution of wave height at three wave gages in the Fog Point Living Shoreline Project study area in the Glenn Martin National Wildlife Refuge, Maryland.
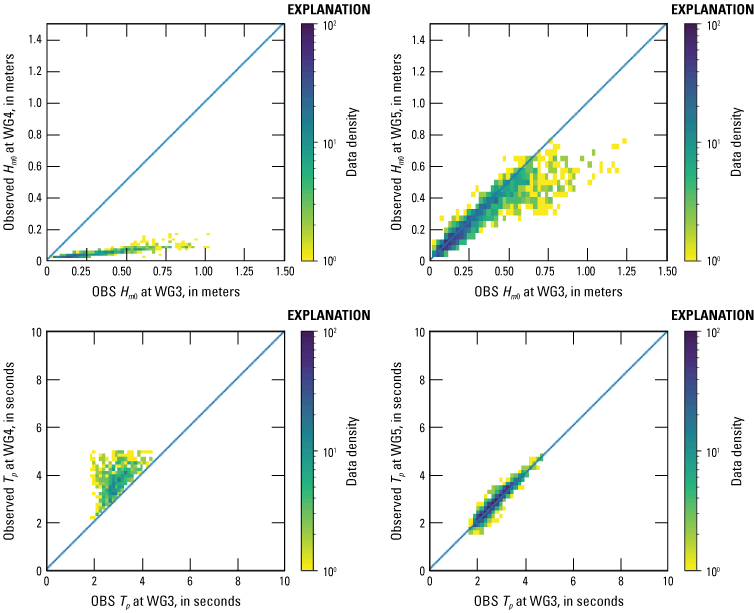
Comparison of observed zero-moment wave heights (Hm0) and peak wave periods (Tp) at wave gages WG3, WG4, and WG5 in the Fog Point Living Shoreline Project study area in the Glenn Martin National Wildlife Refuge, Maryland.
Current Dynamics
The temporal variations of current vector, current speed, and water depth during flood and ebb tides were recorded at STCM3 (for current parameters) and WG4 (for water depth) (fig. 9) behind the structure (fig. 15). The flood and ebb tides were defined based on the water level changes at WG4. The current vector data indicate a circulation pattern of currents. The average speed was about 10 cm/s, and the maximum average current speed recorded was 35 cm/s for a water depth greater than 30 cm.
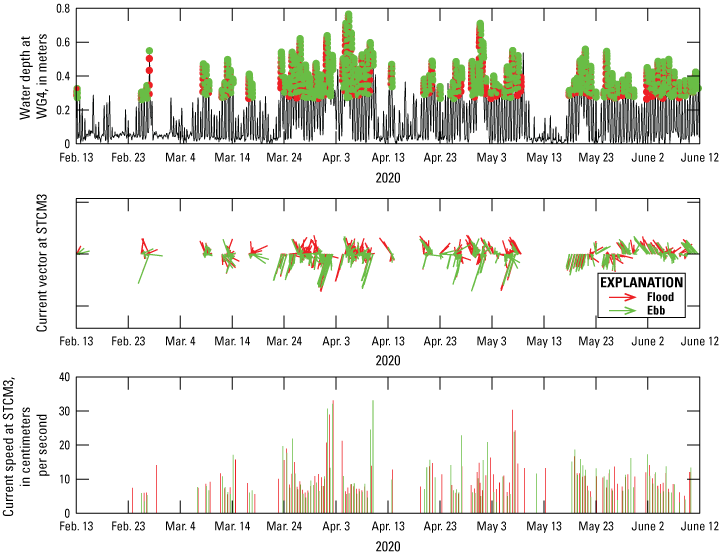
Time series of water depth measured at WG4 and current vectors and current speed measured at STCM3, February–June 2020, Fog Point Living Shoreline Project study area in the Glenn Martin National Wildlife Refuge, Maryland. The current speed was calculated by averaging the measured speed over the duration of flood or ebb tides. The length of the current vector shows the current speed (legend arrows = 10 centimeters per second).
Sediment Dynamics
Sediment tiles behind the breakwater were clean except for the one at location TLs2 toward the breakwater in the lower elevation (fig. 6B). TLs2 had a large mud deposit about 3 cm tall on the tile after the 18 months of monitoring (fig. 16B). The mud deposit indicates that fine sediment could be delivered and deposited onto salt marshes behind the breakwater; however, for most of the salt marsh areas, very little sediment accumulated during the 18-month period on the marsh surface, even with the breakwater protection in the large wave energy environment at the Fog Point project area (fig. 17).
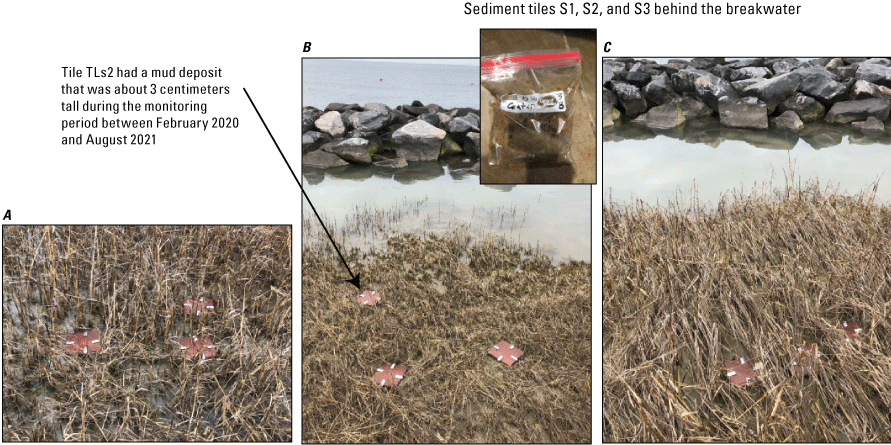
Sediment tiles deployed behind the breakwater with collected mud in the plastic bag in the middle photo, February 2020, Fog Point Living Shoreline Project study area in the Glenn Martin National Wildlife Refuge, Maryland. Photographs by Qin Chen, Northeastern University.
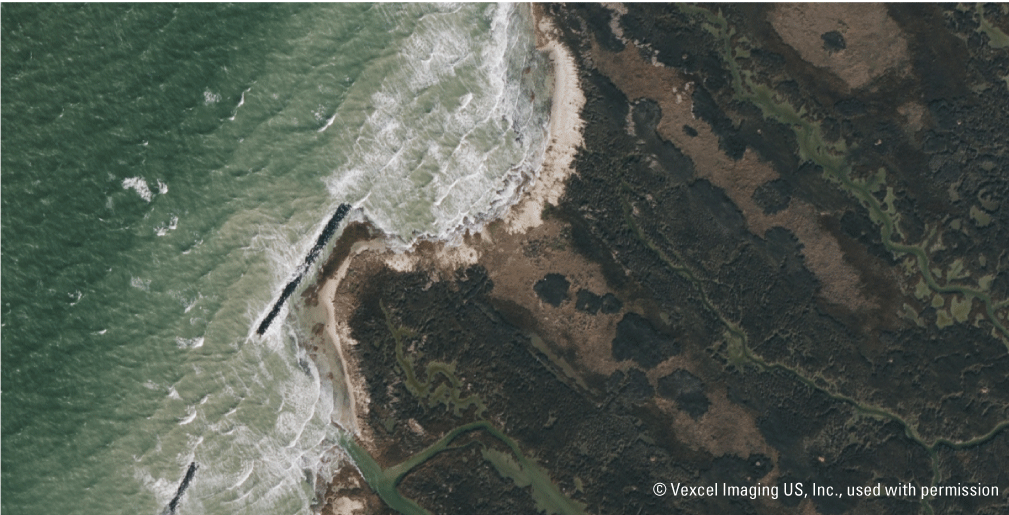
Wave overtopping at the breakwaters during November 23, 2020, storm surge (wave height was greater than 0.9 meter). Fringing low marsh Spartina alterniflora behind the structures was protected from wave impact. A low marsh zone in the embayment (gaps between segmented breakwaters) was inundated, however, and waves reached the sand berm line and high marsh (S. patens) zone. Image courtesy of Vexcel Imaging, used with permission.
Sediment traps measured sediment mass accumulation in the water column and the grain size distribution of sediment at the Fog Point Living Shoreline Restoration Project site (table 1). All four sediment traps behind the breakwater and one trap (TPc2; fig. 6B) in the embayment (control) area were retrieved. During the monitoring period, total sediment mass behind the breakwater ranged from 8.05 to 121.17 grams (g), with a mean value of 48.57 ± 44 g. The median sediment particle size (D50) behind the breakwater ranged from 9.56 to 17.35 micrometers (µm), with a mean D50 of 14.38 ± 3.11 µm. In comparison, the mass of trapped sediment in the embayment area tended to be larger (83.21 g) than the trapped sediment behind the breakwater (48.57 g), and the D50 value of the trapped sediment in the control area tended to be less (9.45 µm) than that behind the breakwater (14.38 µm). Because only one sediment trap in the embayment was retrieved, large uncertainty in the total mass and grain size distribution exists. Further studies are needed to evaluate the total mass of sediment and grain size distribution in the embayment area.
Table 1.
Sediment mass accumulation in a water column and grain size distribution of sediment in the Fog Point Living Shoreline Project area during February 2020–August 2021.[g, gram; D50, median sediment particle size; µm, micrometer; %, percent; TP, sediment trap; BW, breakwater; Std, standard deviation]
| Sediment trap (fig. 6B) |
Total mass (g) | D50 (µm) | Mean (µm) | Clay (%) | Silt (%) | Sand (%) |
|---|---|---|---|---|---|---|
| TPs1 | 8.05 | 16.88 | 22.55 | 14.37 | 80.32 | 5.31 |
| TPs2 | 45.06 | 9.56 | 13.18 | 26.62 | 73.07 | 0.31 |
| TPs3 | 19.98 | 17.35 | 24.85 | 16.20 | 75.50 | 8.31 |
| TPs4 | 121.17 | 13.75 | 17.34 | 20.13 | 77.10 | 2.77 |
| Average ± Std (behind BW) | 48.57±44.00 | 14.38±3.11 | 19.48±4.54 | 19.33±4.70 | 76.50±2.63 | 4.18±2.97 |
| TPc2 (control) | 83.21 | 9.45 | 14.29 | 26.63 | 72.21 | 1.16 |
Based on the composition of clay, silt, and sand, trapped sediments in the embayment area were silty loam, and sediments behind the breakwater were silty clay loam. Fewer but relatively larger sized sediments were trapped in locations behind the breakwater than in the embayment area, indicating that the living shoreline structure (breakwater and salt marsh planting) indeed affected sediment transport and deposition along the shoreline. The data from WG4 indicated reduced wave heights behind the breakwater, which could lead to reduced shoreline erosion; however, fewer sediments could be transported and deposited in the area behind the structure, resulting in less sediment available to deposit to maintain shoreline morphology.
The vertical accretion during the monitoring period (February 2020–August 2021) was determined by using data from the sediment traps (table 2). Behind the breakwater, vertical sediment deposition was 1.71–2.32 cm in the high elevation vegetated locations, whereas sediment erosion was 2.56–9.57 cm in the low elevation nonvegetated tidal flat locations (table 2; fig. 18). In contrast, a large amount of sediment erosion (28.77 cm) was measured at the control site in the embayment (table 2). These measurements indicate that the living shoreline structure (“breakwater + marsh planting”) could substantially reduce sediment erosion and that vegetation plays a function in trapping sediment and protecting the shoreline from erosion.
Table 2.
Vertical accretion during February 2020–August 2021 in the Fog Point Living Shoreline Restoration Project area.[cm, centimeter; TP, sediment trap; Height change values greater than 0 indicate erosion, and height change values less than 0 indicate accretion]
| Sediment trap (fig. 6B) | Height from bottom at deployment (cm) | Height from bottom at retrieval (cm) | Height change (cm) |
|---|---|---|---|
| TPs1 | 30.48 | 33.04 | 2.56 |
| TPs2 | 30.48 | 28.16 | −2.32 |
| TPs3 | 30.48 | 40.05 | 9.57 |
| TPs4 | 30.48 | 28.77 | −1.71 |
| TPc2 (control) | 30.48 | 59.25 | 28.77 |
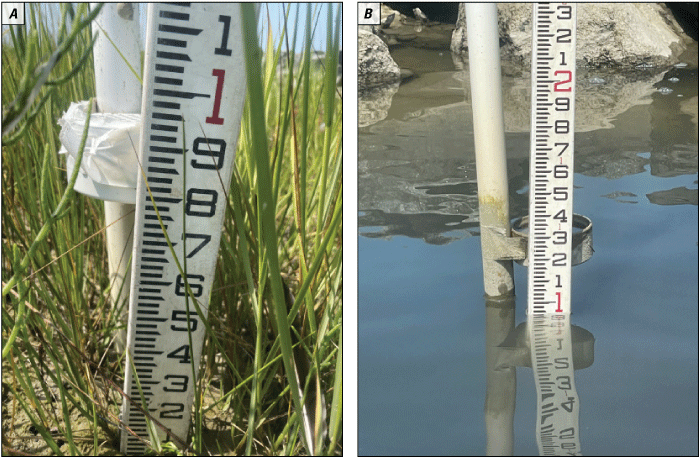
Vertical accretion or deposition measured with the sediment traps behind the breakwater at A, TPs4 (a high elevation location) and B, TPs3 (a low elevation location), August 2021, in the Fog Point Living Shoreline Restoration Project study area in the Glenn Martin National Wildlife Refuge, Maryland. Photographs by William D. Capurso, U.S. Geological Survey.
Lateral edge erosion measurements were also made during retrieval by using the erosion pins as shown in figure 19. Marsh edge lateral accretion and erosion were observed at locations behind the breakwater during the monitoring period from February 2020 to August 2021. At EPs1 and EPs3 (fig. 6B), lateral erosion was measured as 7.42 cm, accretions ranged from 14.09 to 39.85 cm at EPs2, EPs4, and EPs5 (table 3).
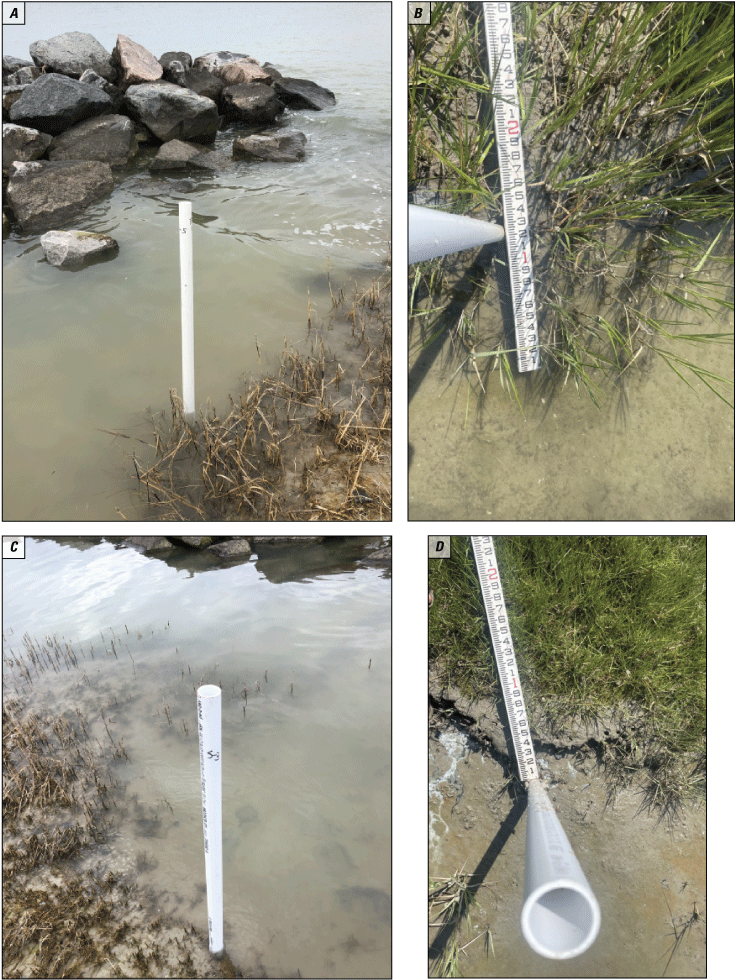
A and B, Lateral marsh accretion at Eps5 behind the breakwater during deployment in February 2020 and C and D, erosion at Eps3 behind the breakwater during retrieval in August 2021 at the Fog Point Living Shoreline Restoration Project site in the Glenn Martin National Wildlife Refuge, Maryland. Photograph A by Qin Chen, Northeastern University. Photographs B and D by William D. Capurso, U.S. Geological Survey. Photograph C by Hongqing Wang, U.S. Geological Survey.
Table 3.
Marsh edge changes behind the breakwater during February 2020–August 2021 in the Fog Point Living Shoreline Restoration Project area.[cm, centimeter; EP, erosion pin; Distance change values greater than 0 indicate erosion, and distance change values greater than 0 indicate accretion]
| Marsh edge erosion pin (fig. 6B) | Pin distance to marsh edge at deployment (cm) | Pin distance to marsh edge at retrieval (cm) | Final distance change (cm) |
|---|---|---|---|
| EPs1 | 0.20 | 7.62 | 7.42 |
| EPs2 | 2.20 | −11.89 | −14.09 |
| EPs3 | 0.20 | 7.62 | 7.42 |
| EPs4 | 1.40 | −24.99 | −26.39 |
| EPs5 | 4.80 | −35.05 | −39.85 |
Marsh edges that expanded into previously open water area (fig. 19B) and eroded (fig. 19D) are clearly seen in the photographs taken during retrieval. Erosion pins along the shoreline in the embayment area were all lost during the monitoring period; therefore, quantification of marsh edge lateral erosion in the embayment area was not possible. By comparing photographs taken on July 11, 2017, and August 25, 2021, we did observe increased marsh edge lateral erosion near wave-cut gullies in the embayment area (fig. 20).
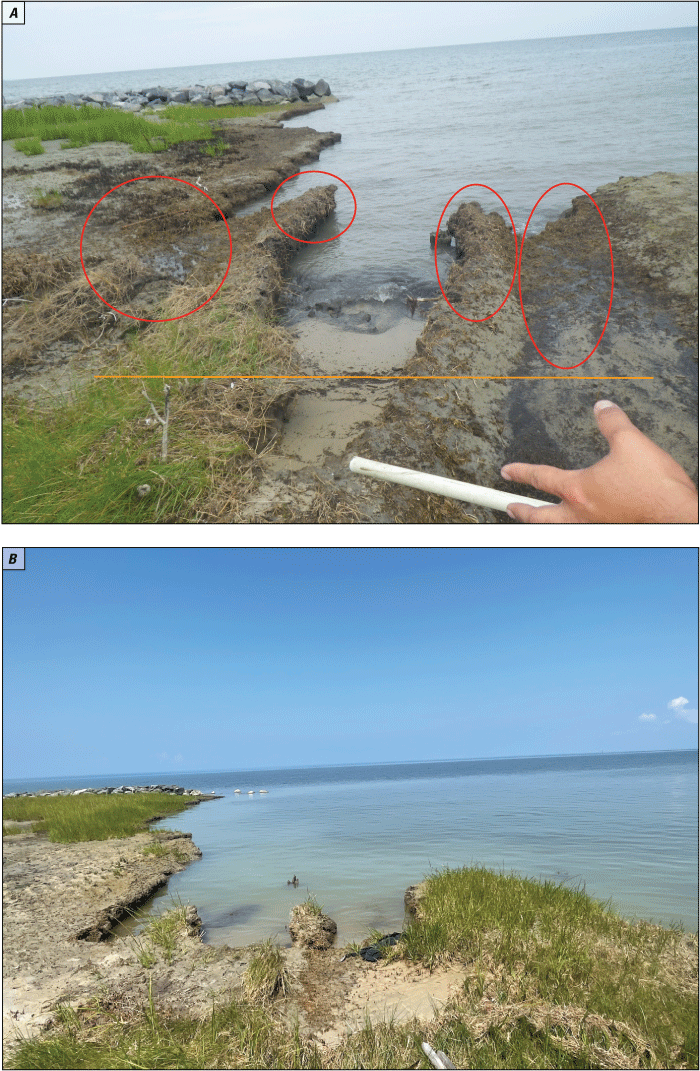
Increased marsh edge erosion in the embayment area along the Fog Point Living Shoreline Restoration Project area, A, on July 11, 2017, during a field visit and B, on August 25, 2021, during sensor retrieval. The low marshes in the red circles in photograph A were eroded by the time photograph B was taken. The orange line indicates the deepest new marsh cutting. Photograph A by Hongqing Wang, U.S. Geological Survey. Photograph B by William D. Capurso, U.S. Geological Survey.
Vegetation Survey
Total plant height, stem height, diameter, and density of S. alterniflora and S. patens were measured at the Fog Point living shoreline sites (table 4). By using the mean ± standard deviation of total plant height (44.14 ± 3.51 cm), S. alterniflora (was slightly shorter than S. patens (50.11 ± 10.17 cm). In comparison, the stem height of S. alterniflora (11.89 ± 4.73 cm) was 55 percent smaller than that of S. patens (26.21 ± 5.49 cm). The mean stem diameter of S. alterniflora was 3.29 mm, larger than that of S. patens (1.52 mm). The stem density of S. alterniflora was 128 stems per square meter, 80 percent less than that of S. patens (648 stems per square meter).
Discussion
Effects of Wave Energy on Sediment Dynamics Along Fog Point Shoreline
The low sediment accumulation in the headland behind the breakwater during the 18-month study period can be explained by the block of sediment transported from the bay sediment source northwest of the breakwater (crest height of 0.76 m relative to the North American Vertical Datum of 1988; USFWS, 2016) under wind-induced wave height (0.3–0.61 m) experienced between March and May 2020 (fig. 10) (Perini Management Services and others, 2014). Perini Management Services and others (2014) found that marsh edge sediments were transported southward in the project area (in other words, along the west of the coast) most of the time. Nevertheless, during storm conditions when wave heights range from 0.91 to 1.52 m, waves can overtop the breakwater, bringing sediments to the headland behind the breakwater (fig. 17). This occasional overtopping (less than 10 percent of the time) during storm periods could be responsible for the large amount of mud deposition measured on one tile in the middle of the marsh edge behind the breakwater. Maximum wave height in our study area (WG3, offshore) during the monitoring period was 1.35 m, which is just 0.23 m less than the estimated maximum wave height (1.58 m) along the Martin NWR coast, driven by an approximate 45-mile-per-hour northwest wind with a storm surge greater than (>) 1.37 m and determined by using a wind/wave model developed by the U.S. Army Corps of Engineers (Perini Management Services and others, 2014).
The small amount of sediment that was transported and deposited on tidal flat and salt marsh areas behind the breakwater is opposite the expectation that more sediment (mud accumulation) would have been trapped in areas protected by living shoreline structures. At the Gandys Beach, N.J., living shoreline and the Chincoteague, Va., living shoreline constructed oyster reefs (oyster castles) are used as living shoreline structures; more sediments were trapped and accumulated in areas behind the living shoreline structures than sites without structures (Wang and others, 2021, 2023b32). Coarser sediments were trapped at the Gandys Beach site (Wang and others, 2021), and finer sediments were trapped at the Chincoteague site (Wang and others, 2023b). Sediment size depended on the characteristics and availability of sediments and hydrodynamic forces including wave, current, and vegetation effects that drive sediment transport, deposition, and erosion. Additionally, sediments were composed of mostly silts or clays regardless of location behind the structure and in the embayment, reflecting the fine sandy silts and clay sediments of late Pleistocene age in this region (Perini Management Services and others, 2014; USFWS, 2015).
At Martin NWR, marsh edge lateral accretion and erosion were observed in the area behind the breakwater, indicating a large variation in erosive forces (for example, wave energy) and processes that transport sediments after the construction of the breakwater and marsh planting. This finding is consistent with our studies at Gandys Beach, N.J., and Chincoteague, Va., where constructed oyster reefs (or oyster castles) were used as living shoreline structures (Wang and others, 2021, 2023b). Under higher wind wave energy and storm surge conditions, erosion was measured at seaward and leeward sides of constructed oyster reefs, despite reduced erosion compared to sites in the control area without oyster reefs (Chowdhury and others, 2019; Wang and others, 2021, 2023b). By using wave flume and field experiments, Feagin and others (2009) found that salt marsh provided no significant direct protection from wave-induced erosion at marsh edges. In this study, our limited monitoring data demonstrated that salt marsh vegetation along the Fog Point shoreline provided limited direct erosion protection under the prevailing energy environment. This limited protection could be attributed to the low stem height and density in marsh areas along the Fog Point shoreline (refer to the “Limited Role of Vegetation in Wave Energy Reduction Along Fog Point Shoreline” section of this report) capturing less mineral sediment, especially fine-grained sediment, and binding the sediment to the soils with plant roots.
Long-Term Erosion in the Embayment of Fog Point Shoreline
SLR and sustained or repetitive wave action are two long-term processes that cause shorelines to recede (Hardaway and Byrne, 1999; McLoughlin and others, 2015). The effects of SLR and wave action are noticeable in the Fog Point project area. A preliminary analysis of imagery from 1998 to 2015 showed that sand beach bands and high marsh lines had receded by approximately 43 m, with an annual shoreline retreat rate of 2.53 m/yr. Multiple wave-cut gullies (V-shaped notches) with varying lengths and widths were observed along the low marsh in the embayment area (figs. 21, 22). Wave-cut gullies are sub-triangular incisions that are common along deteriorating marsh scarps (Schwimmer and Pizzuto, 2000; Priestas and Fagherazzi, 2011; Priestas and others, 2015). At the study site, gullies tended to form along the shoreline with dead vegetation. During normal and stormy conditions, waves incised the marsh platform, causing erosions at gully heads and ends and marsh collapse at gully ends (Fagherazzi and others, 2013). Wave shoaling by wave crest compression is hypothesized to concentrate wave energy at gully heads, leading to accelerated marsh incision (Priestas and Fagherazzi, 2011; Leonardi and others, 2016). Jagged marsh boundaries may be indicative of relatively low wave energy and high marsh strength, whereas the converse can result in a more uniform morphology (Leonardi and Fagherazzi, 2015). The occurrence of wave gullies is a sign of accelerated marsh deterioration (Priestas and Fagherazzi, 2011). Furthermore, once gullies are formed, shoreline erosion tends to increase, because erosion rates increase with boundary sinuosity at a small spatial scale (tens of meters) (Priestas and others, 2015).
Wave-cut gullies along the low marsh edge in the embayment area of the Fog Point Living Shoreline Restoration Project site, July 2017. Photograph by Hongqing Wang, U.S. Geological Survey.
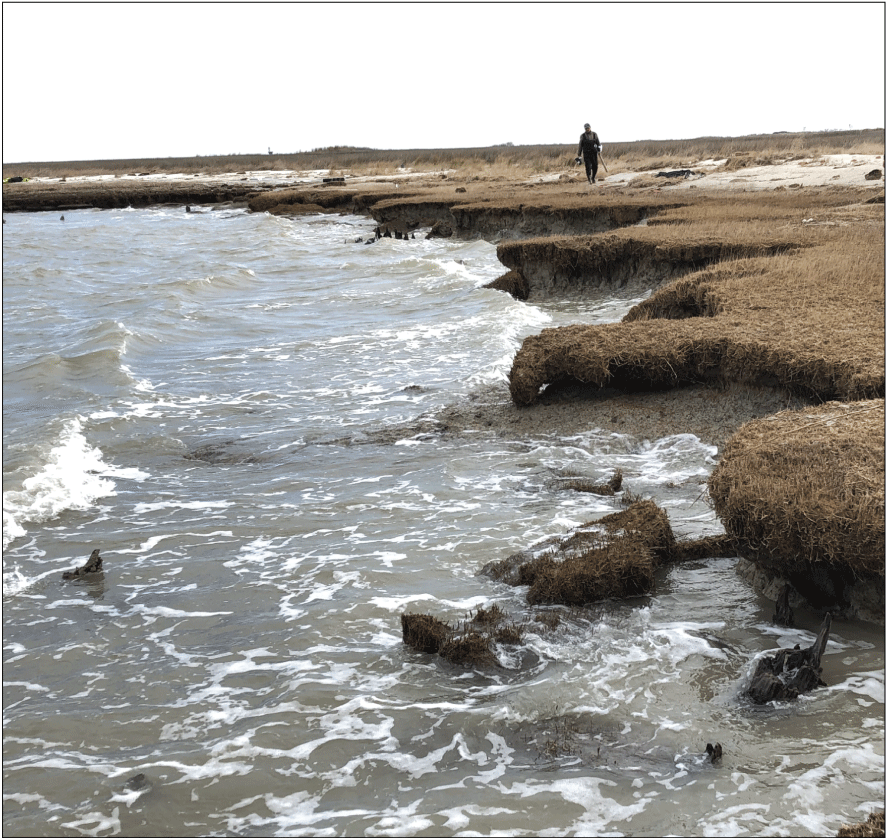
Scarps and undercuts at marsh edge in the embayment along the Fog Point Living Shoreline Restoration Project study area under low tide condition during field deployment on February 13, 2020. Photograph by Hongqing Wang, U.S. Geological Survey.
Priestas and Fagherazzi (2011) reported that the formation of wave gullies requires areas of cohesive mud substrate along the scarped edges and waves with heights greater than 20–30 cm to impact the scarp with enough force to remove material. Wave gullies do not form in marsh shorelines with very shallow offshore slopes because of wave energy dissipation by depth-limited wave breaking, even with large offshore waves, nor do they form in scarped edges without sufficient wave power (Priestas and Fagherazzi, 2011; Priestas and others, 2015). Furthermore, Priestas and Fagherazzi (2011) reported that the size and spacing of wave gullies could be related to the strength of the eroding material relative to the wave power. Waves exert significant force on the scarp and can cause marsh erosion when the water elevation equals the marsh platform elevation, a condition conducive to increased dynamic wave pressure (Tonelli and others, 2010). However, it is important to also consider the findings of Priestas and others (2023), which demonstrate that maximum impact pressures can occur under optimal (plunging) wave-breaking conditions, emphasizing the significance of wave shoaling, breaking dynamics, and water depth in the erosion process. One of the consequences of salt marsh erosion is the loss of sediment-trapping capacity by vegetation. The sediment-trapping capacity of salt marsh platforms could decrease exponentially with salt marsh erosion (for example, up to 50 percent of the sediment mass trapped by vegetation is lost once 25 percent of the marsh area is eroded) (Donatelli and others, 2018). Therefore, maintaining the physical conditions (for example, tolerant inundation duration at marsh surface elevation) for optimal vegetation growth and trapping inorganic sediments is an important component for the success of living shoreline restoration.
Limited Role of Vegetation in Wave Energy Reduction Along Fog Point Shoreline
In salt marshes of Chesapeake Bay, the stem density of S. alterniflora averaged 344 stems per square meter with a range of 270–425 stems per square meter and a standard deviation of 80 stems per square meter (Garzon and others, 2019). Garzon and others (2019) found that the average and the standard deviation of stem height were 71 and 22 cm, respectively, and stem diameters varied between 4 and 7 mm, with an average of 5 mm and a standard deviation of 1.5 mm. Marsooli and others (2017) found that the density of S. alterniflora varied between 20 and 390 stems/m2, and stem height ranged between 26 and 58 cm in salt marshes in Jamaica Bay, N.Y., along the North Atlantic coast. Zhu and Chen (2019) found that the representative total plant height and stem density of S. alterniflora in Terrebonne Bay along the Louisiana coast were 63 cm and 422 stems/m2, respectively. Few studies have measured S. patens plant attributes for the purpose of detecting the effects of this species on wave attenuation in vegetated shorelines along the Atlantic and Gulf coasts. Hu and others (2015) found that in brackish marshes dominated by S. patens along the Louisiana coast, the average stem height, stem diameter, and stem density were 50 cm, 1.50 mm, and 740 stems/m2, respectively. A 3-year study of living shoreline using sill and salt marsh along the North Carolina coast showed that S. alterniflora stem height, stem density, and percentage of cover were lower in the restoration sites than in the natural marsh sites (Currin and others, 2008).
The stem height and density of S. alterniflora and S. patens measured at the Fog Point living shoreline sites (table 4) tended to be smaller or in the lower range measured along the Atlantic and Gulf coasts in the limited studies. The short stem height and relatively low stem density of these two species in the Fog Point living shoreline area reflected the harsh environmental conditions such as large wind-driven and storm-induced waves from the west or southwest that can cause high wave energy to pass the breakwater, which is oriented southwest to northeast. Because tall stem height is more effective in mitigating wave energy than short stems (Zhu and others, 2023), salt marshes along the Fog Point living shoreline were expected to have a limited role in attenuating wave energy, even with the breakwaters constructed. It should be noted that while the S. alterniflora community behind the breakwater was planted after the construction in late 2016, the S. patens community in the control area had grown under natural conditions. Therefore, the S. alterniflora community at the Fog Point shoreline area is expected to take longer than 5 years to develop into a stage with tall stems and high stem densities such as those reported to be capable of playing an effective role in wave energy attenuation and sediment trapping.
Further Research Opportunities
The Fog Point shoreline with the “headland - breakwater - embayment” pattern is representative of one major type of shoreline along the Chesapeake Bay coast. Integration of rock breakwaters, sand nourishment, and salt marsh plant species is a popular living shoreline restoration technique that has been used to restore and protect the shorelines with salt marshes, beaches, and dunes. These shorelines provide ecosystem services, including wave attenuation, surge reduction, and enhancement of habitat for fish and wildlife species. Although living shoreline restoration projects, such as the Fog Point Living Shoreline Restoration Project, have been constructed along these shorelines, very few field studies have been conducted to simultaneously monitor wave, current, and sediment dynamics as well as vegetation characteristics, with and without the living shoreline structures, especially during storms when large wave energy is generated (Wang and others, 2021).
In this study, we collected wave, current, sediment, and vegetation data along the Fog Point living shoreline in Martin NWR in early 2020, during the occurrence of large wind- and storm-induced waves were the major drivers of shoreline erosion and retreat. Our study represents a critical step to understanding the mechanisms of shoreline erosion, including the hydrodynamic forces (wave and current) on sediment transport, deposition, and erosion, and the role of vegetation in sediment trapping and accumulation. Because of COVID-19 pandemic travel restrictions, we were unable to collect wave, current, and sediment measurements at all deployed locations, especially in the control (embayment) area. The loss of data made it difficult to quantify the spatial patterns in wave, current, and sediment dynamics, especially in the control area. Therefore, uncertainties remain in assessing the variability in wave height, peak period, current velocity, circulation pattern, and sediment transport, deposition, and erosion with and without the breakwaters along the Fog Point living shoreline. Thus, long-term monitoring (decadal scale) of spatial wave, current, sediment, and vegetation dynamics, including shoreline morphological changes (both lateral and vertical) along the living shoreline, could help to assess the effectiveness of these types of living shoreline structures under future climate change and SLR conditions.
Because of a limited sediment supply behind the breakwater and continued marsh edge erosion along the embayment, use of external sources of sediments (for example, dredging materials) could help to supplement sediments for marsh accretion both laterally and vertically. Marsh planting is a crucial component of this type of living shoreline structure; maintenance of physical conditions (for example, tolerant inundation duration at marsh surface elevation) for optimal vegetation growth and trapping inorganic sediments is important for sustainable living shoreline development. Furthermore, process-driven models of wave, hydrodynamic, sediment transport, and shoreline morphology could be coupled to examine the effects of the “breakwater + marsh planting” structure on wave attenuation, circulation patterns, sediment deposition, erosion, and shoreline change, and to develop the optimal design of living shoreline structures.
Summary
Rock breakwaters, sand nourishment, and planting of salt marsh species as living shoreline structures were constructed along the Fog Point shoreline in Glenn Martin National Wildlife Refuge, Maryland, in 2016, in response to the impact of Hurricane Sandy in 2012. This type of living shoreline structure (breakwater + marsh planting) has been applied to shorelines that have marsh headlands with spiral embayment (pocket beaches) between the headlands. Wave, current, and sediment dynamics were studied at a section along the Fog Point shoreline to assess the effectiveness of the living shoreline structure in terms of wave attenuation and erosion reduction. Multiple wave gages, current meters, sediment traps, sediment tiles, and lateral erosion pins were deployed around one marsh headland and one embayment during February 10–14, 2020. Because the COVID-19 pandemic affected travel, only three wave gages, one current meter, and half of the sediment traps, sediment tiles, and erosion pins were retrieved 18 months after field deployment on August 25, 2021.
Monitoring data indicated that wave heights were significantly reduced at locations behind the breakwater, but not at the location in the control area (the embayment). Current patterns and current velocities at the location behind the breakwater were complex and changed dramatically compared to the current patterns and current velocities offshore. Sediments were blocked by the breakwater most of the time except during periods of storms with wave heights larger than 0.9 meter, when waves overtopped the breakwater and brought sediments to the tidal flat and salt marshes behind the breakwater. Behind the breakwater, lateral and vertical sediment deposition and erosion were observed during the 18 months of monitoring. Continued erosion of low elevation marsh edge caused by wave undercutting along the embayment, especially at the original wave-cut gullies, was observed from field observations.
Monitoring results indicate that the “breakwater + marsh planting” living shoreline structure along the Fog Point shoreline has limited capacity in preventing shoreline erosion and retreat in the marsh headland. This type of living shoreline structure does not facilitate sediment deposition for all the salt marsh areas behind the breakwaters along the Fog Point shoreline. Marsh edge erosion behind the breakwater, even though wave energy was reduced, was still likely caused by the limited sediment supply from marine sources, as well as the effects of circulation and current velocity on settling and deposition of suspended sediments from eroded marshes. The restored salt marsh plants behind the breakwaters of some marsh headlands did not grow well and had sparse vegetation coverage, indicating that the protection capacity of breakwater and marsh planting is limited. Marsh edge erosion was observed to continue and increase in the control (the embayment) area where no shoreline protection structures were implemented.
Because of the impact of the COVID-19 pandemic, not all of the deployed wave gages, current meters, sediment traps, sediment tiles, and erosion pins covering headland with breakwater and embayment areas could be retrieved. This situation resulted in limited wave, current velocity, and sediment data, and uncertainty in the analysis of the spatial dynamics in wave energy, circulation patterns, and sediment transport along the Fog Point shoreline. Additionally, the retrieved data covered only one winter period; thus, the variations in wave, velocity, and sediment dynamics from varying storms over different years with and without living shoreline structures could not be determined.
Spatial and long-term (decadal scale) monitoring and adaptive management of living shoreline structures can help to ensure the realization of wave attenuation for reducing shoreline erosion, enhancing vegetation growth for trapping sediments, and enhancing marsh surface elevation growth to keep pace with sea level rise. Coupling models of wave, hydrodynamic, sediment transport, and shoreline morphology could give researchers a better understanding of the wave, current, and sediment dynamics and feedback mechanisms, including vegetation effects on these physical processes. Once the models are calibrated and validated against field data, simulations could be run for scenarios of different types of living shoreline structures, with different configurations (arrangement, distance to shore, size [length, width, height], site location) for headland and embayment areas under various sea level rise conditions to achieve optimal designs for living shoreline structures. Combined, these efforts could help to sustain the engineering and ecological benefits (for example, shoreline erosion eliminated, marsh surface elevation growth enhanced) and ecosystem services (wave attenuation, storm surge reduction, habitat for fish and wildlife species improved) of coastal shorelines.
References Cited
Chowdhury, M.S.N., Walles, B., Sharifuzzaman, S.M., Hossain, M.S., Ysebaert, T., and Smaal, A.C., 2019, Oyster breakwater reefs promote adjacent mudflat stability and salt marsh growth in a monsoon dominated subtropical coast: Scientific Reports, v. 9, no. 1, article 8549, accessed January 5, 2023, at https://doi.org/10.1038/s41598-019-44925-6.
Currin, C.A., Delano, P.C., and Valdes-Weaver, L.M., 2008, Utilization of a citizen monitoring protocol to assess the structure and function of natural and stabilized fringing salt marshes in North Carolina: Wetlands Ecology and Management, v. 16, p. 97–118, accessed January 25, 2023, at https://doi.org/10.1007/s11273-007-9059-1.
Donatelli, C., Ganju, N.K., Zhang, X., Fagherazzi, S., and Leonardi, N., 2018, Salt marsh loss affects tides and the sediment budget in shallow bays: Journal of Geophysical Research—Earth Surface, v. 123, no. 10, p. 2647–2662, accessed February 2, 2023, at https://doi.org/10.1029/2018JF004617.
Fagherazzi, S., Mariotti, G., Wiberg, P.L., and McGlathery, K.J., 2013, Marsh collapse does not require sea level rise: Oceanography, v. 26, no. 3, p. 70–77, accessed January 25, 2023, at https://doi.org/10.5670/oceanog.2013.47.
Feagin, R.A., Lozada-Bernard, S.M., Ravens, T., Möller, I., Yeager, K.M., and Baird, A.H., 2009, Does vegetation prevent wave erosion of salt marsh edges?: Proceedings of the National Academy of Sciences of the United States of America, v. 106, no. 25, p. 10109–10113, accessed February 5, 2023, at https://doi.org/10.1073/pnas.0901297106.
Garzon, J.L., Maza, M., Ferreira, C.M., Lara, J.L., and Losada, I.J., 2019, Wave attenuation by Spartina saltmarshes in the Chesapeake Bay under storm surge conditions: Journal of Geophysical Research—Oceans, v. 124, no. 7, p. 5220–5243, accessed May 8, 2023, at https://doi.org/10.1029/2018JC014865.
Hapke, C.J., Himmelstoss, E.A., Kratzmann, M.G., List, J.H., and Thieler, E.R., 2011, National assessment of shoreline change—Historical shoreline change along the New England and mid-Atlantic coasts: U.S. Geological Survey Open-File Report 2010–1118, 57 p., accessed January 5, 2023, at https://doi.org/10.3133/ofr20101118.
Hu, K., Chen, Q., and Wang, H., 2015, A numerical study of vegetation impact on reducing storm surge by wetlands in a semi-enclosed estuary: Coastal Engineering, v. 95, p. 66–76, accessed February 16, 2023, at https://doi.org/10.1016/j.coastaleng.2014.09.008.
Karimpour, A., and Chen, Q., 2017, Wind wave analysis in depth limited water using OCEANLYZ, a MATLAB toolbox: Computers & Geosciences, v. 106, p. 181–189, accessed January 25, 2023, at https://doi.org/10.1016/j.cageo.2017.06.010.
Leonardi, N., and Fagherazzi, S., 2015, Effect of local variability in erosional resistance on large-scale morphodynamic response of salt marshes to wind waves and extreme events: Geophysical Research Letters, v. 42, no. 14, p. 5872–5879, accessed March 5, 2023, at https://doi.org/10.1002/2015GL064730.
Leonardi, N., Ganju, N.K., and Fagherazzi, S., 2016, A linear relationship between wave power and erosion determines salt-marsh resilience to violent storms and hurricanes: Proceedings of the National Academy of Sciences of the United States of America, v. 113, no. 1, p. 64–68, accessed March 3, 2023, at https://doi.org/10.1073/pnas.1510095112.
Marsooli, R., Orton, P.M., and Mellor, G., 2017, Modeling wave attenuation by salt marshes in Jamaica Bay, New York, using a new rapid wave model: Journal of Geophysical Research—Oceans, v. 122, no. 7, p. 5689–5707, accessed March 8, 2023, at https://doi.org/10.1002/2016JC012546.
McLoughlin, S.M., Wiberg, P.L., Safak, I., and McGlathery, K.J., 2015, Rates and forcing of marsh edge erosion in a shallow coastal bay: Estuaries and Coasts, v. 38, p. 620–638, accessed April 5, 2023, at https://doi.org/10.1007/s12237-014-9841-2.
Morris, R.L., Bilkovic, D.M., Boswell, M.K., Bushek, D., Cebrian, J., Goff, J., Kibler, K.M., La Peyre, M.K., McClenachan, G., Moody, J., Sacks, P., Shinn, J.P., Sparks, E.L., Temple, N.A., Walters, L.J., Webb, B.M., and Swearer, S.E., 2019, The application of oyster reefs in shoreline protection—Are we over-engineering for an ecosystem engineer?: Journal of Applied Ecology, v. 56, no. 7, p. 1703–1711, accessed May 6, 2023, at https://doi.org/10.1111/1365-2664.13390.
Morris, R.L., La Peyre, M.K., Webb, B.M., Marshall, D.A., Bilkovic, D.M., Cebrian, J., McClenachan, G., Kibler, K.M., Walters, L.J., Bushek, D., Sparks, E.L., Temple, N.A., Moody, J., Angstadt, K., Goff, J., Boswell, M., Sacks, P., and Swearer, S.E., 2021, Large-scale variation in wave attenuation of oyster reef living shorelines and the influence of inundation duration: Ecological Applications, v. 31, no. 6, article e02382, accessed April 6, 2023, at https://doi.org/10.1002/eap.2382.
O’Donnell, J.E.D., 2017, Living shorelines—A review of literature relevant to New England coasts: Journal of Coastal Research, v. 33, no. 2, p. 435–451, accessed January 6, 2023, at https://doi.org/10.2112/JCOASTRES-D-15-00184.1.
Perini Management Services, Coastline Design, P.C., Vanasse Hangen Brustlin, Inc., Coastal Design & Construction, Inc., and Sustainability Science LLC, 2014, Smith Island, Martin National Wildlife Refuge Hurricane Sandy Resiliency Project #31, Fog Point Living Shoreline Restoration, Ewell, Maryland: Hadley, Mass., U.S. Fish and Wildlife Service, Division of Contracting and General Services.
Priestas, A.M., and Fagherazzi, S., 2011, Morphology and hydrodynamics of wave-cut gullies: Geomorphology, v. 131, no. 1–2, p. 1–13, accessed May 6, 2023, at https://doi.org/10.1016/j.geomorph.2011.04.004.
Priestas, A.M., Mariotti, G., Leonardi, N., and Fagherazzi, S., 2015, Coupled wave energy and erosion dynamics along a salt marsh boundary, Hog Island Bay, Virginia, USA: Journal of Marine Science and Engineering, v. 3, no. 3, p. 1041–1065, accessed May 8, 2023, at https://doi.org/10.3390/jmse3031041.
Priestas, A.M., Styles, R., and Bain, R., 2023, Vessel wake impact forces on marsh scarps: Journal of Coastal Research, v. 39, p. 207–220, accessed May 2023 at https://doi.org/10.2112/JCOASTRES-D-22-00056.1.
Salatin, R., Wang, H., Chen, Q., and Zhu, L., 2022, Assessing wave attenuation with rising sea levels for sustainable oyster reef-based living shorelines: Frontiers in Built Environment, v. 8, article 884849, accessed May 6, 2023, at https://doi.org/10.3389/fbuil.2022.884849.
Sanford, L.P., and Gao, J., 2018, Influences of wave climate and sea level on shoreline erosion rates in the Maryland Chesapeake Bay: Estuaries and Coasts, v. 41, no. S1, p. 19–37, accessed May 2, 2023, at https://doi.org/10.1007/s12237-017-0257-7.
Schwimmer, R.A., and Pizzuto, J.E., 2000, A model for the evolution of marsh shorelines: Journal of Sedimentary Research, v. 70, no. 5, p. 1026–1035, accessed March 24, 2023, at https://doi.org/10.1306/030400701026.
Sutton-Grier, A.E., Wowk, K., and Bamford, H., 2015, Future of our coasts—The potential for natural and hybrid infrastructure to enhance the resilience of our coastal communities, economies and ecosystems: Environmental Science & Policy, v. 51, p. 137–148, accessed January 5, 2023, at https://doi.org/10.1016/j.envsci.2015.04.006.
Theuerkauf, S.J., Eggleston, D.B., and Puckett, B.J., 2019, Integrating ecosystem services considerations within a GIS-based habitat suitability index for oyster restoration: PLoS One, v. 14, no. 1, article e0210936, accessed March 8, 2023, at https://doi.org/10.1371/journal.pone.0210936.
Tonelli, M., Fagherazzi, S., and Petti, M., 2010, Modeling wave impact on salt marsh boundaries: Journal of Geophysical Research, v. 115, no. C9, article C09028, 17 p., accessed May 2023 at https://doi.org/10.1029/2009JC006026.
U.S. Fish and Wildlife Service, 2015, Draft Environmental Assessment—Fog Point Living Shoreline Project, Sandy Resiliency #31, Martin National Wildlife Refuge, Somerset County, Maryland: U.S. Fish and Wildlife Service web page, accessed October 10, 2016, at https://www.fws.gov/uploadedFiles/Region_5/NWRS/South_Zone/Chesapeake_Marshlands_Complex/Martin/Martin_NWR_DRAFT_EA_Fog_Point_Sandy_31_19_Feb_2015.pdf.
Wang, H., Capurso, W., Chen, Q., Zhu, L., Niemoczynski, L., and Snedden, G., 2021, Assessment of wave attenuation, current patterns, and sediment deposition and erosion during winter storms by living shoreline structures in Gandys Beach, New Jersey: U.S. Geological Survey Open-File Report 2021–1040, accessed May 8, 2023, at https://doi.org/10.3133/ofr20211040.
Wang, H., Chen, Q., Capurso, W.D., Wang, N., Niemoczynski, L.M., Whitbeck, M., Zhu, L., and Snedden, G.A., 2023a, Field observation of wind waves and current velocity (2020) along the Fog Point Living Shoreline, Maryland: U.S. Geological Survey data release, https://doi.org/10.5066/P9TXZX5W.
Wang, H., Chen, Q., Wang, N., Capurso, W.D., Niemoczynski, L.M., Zhu, L., Snedden, G.A., Holcomb, K.S., Lusk, B.W., Wilson, C.A., and Cornell, S.R., 2023b, Monitoring of wave, current and sediment dynamics along the Chincoteague living shoreline, Virginia: U.S. Geological Survey Open-File Report 2023–1020, 32 p., accessed April 6, 2023, at https://doi.org/10.3133/ofr20231020.
Wiberg, P.L., Taube, S.R., Ferguson, A.E., Kremer, M.R., and Reidenbach, M.A., 2019, Wave attenuation by oyster reefs in shallow coastal bays: Estuaries and Coasts, v. 42, p. 331–347, accessed February 8, 2023, at https://doi.org/10.1007/s12237-018-0463-y.
Zhu, L., and Chen, Q., 2019, Discussion of “Field-based numerical model investigation of wave propagation across marshes in the Chesapeake Bay under storm conditions” by Juan L. Garzon, Tyler Miesse and Celso M. Ferreira: Coastal Engineering, v. 149, p. 1–3, accessed March 8, 2023, at https://doi.org/10.1016/j.coastaleng.2019.03.005.
Zhu, L., Chen, Q., Wang, H., Capurso, W., Niemoczynski, L., Hu, K., and Snedden, G., 2020, Field observations of wind waves in upper Delaware Bay with living shorelines: Estuaries and Coasts, v. 43, no. 4, p. 739–755, accessed February 8, 2023, at https://doi.org/10.1007/s12237-019-00670-7.
Zhu, L., Chen, Q., Ding, Y., Jafari, N., Wang, H., and Johnson, B.D., 2023, Towards a unified drag coefficient formula for quantifying wave energy reduction by salt marshes: Coastal Engineering, v. 180, article 104256, accessed May 16, 2023, at https://doi.org/10.1016/j.coastaleng.2022.104256.
Conversion Factors
U.S. customary units to International System of Units
International System of Units to U.S. customary units
Datums
Vertical coordinate information is referenced to the North American Vertical Datum of 1988 (NAVD 88).
Horizontal coordinate information is referenced to the North American Datum of 1983 (NAD 83), unless otherwise noted.
Elevation, as used in this report, refers to distance above the vertical datum.
Supplemental Information
Wave and current data are available in an associated data release at https://doi.org/10.5066/P9TXZX5W.
Abbreviations
>
greater than
<
less than
≤
less than or equal to
ADV
acoustic Doppler current meter
Martin NWR
Glenn Martin National Wildlife Refuge
NFWF
National Fish and Wildlife Foundation
NOAA
National Oceanic and Atmospheric Administration
NWR
national wildlife refuge
SLR
sea level rise
TCM
tilt current meter
USFWS
U.S. Fish and Wildlife Service
USGS
U.S. Geological Survey
WG
wave gage
For more information about this publication, contact
Director, Wetland and Aquatic Research Center
U.S. Geological Survey
700 Cajundome Blvd.
Lafayette, LA 70506–3152
For additional information, visit
https://www.usgs.gov/centers/wetland-and-aquatic-research-center-warc
Publishing support provided by
Lafayette Publishing Service Center
Disclaimers
Any use of trade, firm, or product names is for descriptive purposes only and does not imply endorsement by the U.S. Government.
Although this information product, for the most part, is in the public domain, it also may contain copyrighted materials as noted in the text. Permission to reproduce copyrighted items must be secured from the copyright owner.
Suggested Citation
Wang, H., Chen, Q., Capurso, W.D., Niemoczynski, L.M., Wang, N., Zhu, L., Snedden, G.A., Whitbeck, M., Wilson, C.A., and Brownley, M., 2024, Monitoring of wave, current, and sediment dynamics along the Fog Point Living Shoreline, Glenn Martin National Wildlife Refuge, Maryland: U.S. Geological Survey Open-File Report 2024–1004, 32 p., https://doi.org/10.3133/ofr20241004.
ISSN: 2331-1258 (online)
Study Area
| Publication type | Report |
|---|---|
| Publication Subtype | USGS Numbered Series |
| Title | Monitoring of wave, current, and sediment dynamics along the Fog Point Living Shoreline, Glenn Martin National Wildlife Refuge, Maryland |
| Series title | Open-File Report |
| Series number | 2024-1004 |
| DOI | 10.3133/ofr20241004 |
| Publication Date | February 15, 2024 |
| Year Published | 2024 |
| Language | English |
| Publisher | U.S. Geological Survey |
| Publisher location | Reston, VA |
| Contributing office(s) | Maryland Water Science Center, New Jersey Water Science Center, New York Water Science Center, Wetland and Aquatic Research Center |
| Description | Report: x, 32 p.; Data Release |
| Country | United States |
| State | Maryland |
| Other Geospatial | Glenn Martin National Wildlife Refuge |
| Online Only (Y/N) | Y |