

Genetic Structure and Diversity in Wild Populations of the Light-Footed Ridgway’s Rail Reflect 20 Years of Augmentation Through Captive Breeding and Release
Links
- Document: Report (2.5 MB pdf) , HTML , XML
- Data Release: USGS data release - Microsatellite genotypes for light-footed Ridgway's rail (Rallus obsoletus levipes) sampled in southern California
- Download citation as: RIS | Dublin Core
Acknowledgments
This research was supported by the U.S. Fish and Wildlife Service (USFWS), Carlsbad Fish and Wildlife Office, U.S. Geological Survey Ecosystems Mission Area, and contributions from the San Diego Foundation. This project could not have been completed without the efforts of many individuals and organizations. We thank Heather Parsons, Eamon Harrity, and Kathryn Sliwa from the University of Idaho; Kylie Curtis and Claire Andrews from the U.S. Geological Survey; and Hans Sin and Kyle Rice from the California Department of Fish and Wildlife for their contributions to fieldwork. Fieldwork was made possible with assistance and site access from the following people and organizations: Loni Byer and Joyce Sisson (U.S. Naval Base Coronado); Martin Ruane (U.S. Naval Air Station Point Mugu); Jon Rishi and Cristan Caviel (U.S. Army Corps of Engineers Santa Ana River Mainstem Salt Marsh); Rob Haskell (Surf Cup), Shawna Anderson (San Diego River Park); Amanda Swanson, Melissa Borde, Hans Sin, Gabriel Penaflor and Kyle Rice (California Department of Fish and Wildlife: Upper Newport Bay, Bolsa Chica, Buena Vista and Agua Hedionda); John Villa (Huntington Beach Wetlands Conservancy’s Lagoon); Mark Berninger and Sara Allen (City of San Diego: Los Penasquitos Creek and San Diego River); Cara Stafford, (California State Parks: Los Penasquitos Marsh); Doug Gibson and Tito Marchant (The Nature Collective: San Elijo Lagoon); Isabelle Kay (University of California Kendall-Frost Mission Bay Marsh Reserve); Edward Owens, Justyn Stahl and Jill Terp (USFWS: Sweetwater and Tijuana Slough National Wildlife Refuge). Aiyana Reissman and her team at the Living Coast Discovery Center were key collaborators in allowing access to captive rails. We thank Justin Brackett and Todd Glazebrook from SeaWorld for providing a crucial blood sample. Rob Fleischer and the Smithsonian Institute provided 1989 rail blood and deoxyribonucleic acid (DNA) samples. Philip Unitt (San Diego Natural History Museum), Kevin Burns (San Diego State University), and Catherine Zeeman (USFWS) provided additional rail samples. Sandra Hamilton (USFWS) provided studbook data and assisted greatly with our questions throughout the project. Steve Bogdanowicz at Cornell University assisted with marker development and bioinformatics. We especially thank Richard Zembal for sharing his experience, annual report data, and assisting with site access. Finally, we especially thank Brian Collins (USFWS, retired), for supporting collaborations that led to the inclusion of genetic research in the rail recovery program.
Abstract
Captive breeding and release programs aimed at recovery of rare species can be informed by genetic data to help select high-diversity source populations, make pairing decisions to minimize inbreeding, and manage release strategies. We developed a set of 54 microsatellite loci to assess genetic structure and diversity across the United States range of the Light-footed Ridgway’s Rail (Rallus obsoletus levipes), a federally endangered marsh bird for which populations have been augmented by a captive breeding program annually since 2001. We identified three regional genetic clusters, with the highest genetic diversity reported in the central cluster, which included all sampled wetlands in north San Diego County. Recent (2019–24) captive-breeding adults all clustered within the northernmost cluster (Orange and Ventura Counties), which was expected given that this cluster included the source wetland for the captive breeding program. Gene flow rates, which approximate the proportions of individuals in a population originating from other populations, were relatively high among clusters (4–24 percent) and may have been enhanced through the release of captive-bred rails. Based on the genetic data analyzed in a genetic rescue decision framework, sourcing new breeding birds from the north San Diego County cluster could provide the greatest genetic diversity benefits. The northernmost cluster, which included Mugu Lagoon and all sampled Orange County wetlands, was considered the most in need of genetic rescue. Recent breeding pairs in the captive breeding program have comparatively low diversity and high interrelatedness. Sourcing birds from wetlands with high genetic diversity and population sizes, assessing genetic relatedness before pairing, and focusing releases in areas that have low estimates of genetic diversity could improve the distribution of genetic diversity across wild populations in the future.
Introduction
Genetic monitoring is frequently used along with ecological monitoring tools to assess and manage populations of endangered species (Schwartz and others, 2007; Antao and others, 2011). Genetic diversity data can be particularly informative for managing captive breeding and release programs aimed at restoring declining species. The maintenance of genetic diversity can reduce the potential for inbreeding depression and improve fitness in the short term (a few generations; Reed and Frankham, 2003; Spielman and others, 2004; Markert and others, 2010), and preserve adaptive potential in the long term (many generations; Kardos and others, 2021). For these reasons, measuring the amount and distribution of genetic diversity among wild populations can help to identify appropriate source populations and release sites to manage for diversity. In addition, genetic monitoring pre- and post-release can be used along with mark-recapture, telemetry, and other techniques to assess survival and integration of released individuals, and their genes, into wild populations (Bubac and others, 2019). Finally, genetic relatedness information can be incorporated into studbook management to help guide pairing decisions in captive settings to ensure that inbreeding is minimized and that multiple family lineages are consistently represented in captive populations (Ivy and Lacy, 2010).
Light-footed Ridgway’s Rails (Rallus obsoletus levipes; hereafter rails) are restricted to coastal wetlands within a small geographic range spanning from Ventura County, California, to Ensenada, Baja California, Mexico (fig. 1; Eddleman and Conway, 2020). The subspecies was listed as federally endangered in 1969 (Secretary of the Interior, 1969), state endangered in California in 1971, and was added to the official list of at-risk species in Mexico in 2002 (Secretaría del Medio Ambiente y Recursos Naturales, 2002). Annual call-broadcast surveys throughout the subspecies’ U.S. range began in 1980 and have continued to the present (Zembal and others, 2024). During this period, total pair counts have fluctuated from year to year, but have increased slightly since range-wide counts began (U.S. Fish and Wildlife Service, 2020). These trends vary regionally, with an apparent increase in north San Diego County marshes but an apparent decline in Orange County (fig. 2); although changes in pair counts over time were not tested statistically (Zembal and others, 2024). In 1989, genetic samples were obtained from four consistently occupied populations (at that time) throughout the rails’ range (Mugu Lagoon, Ventura County, Seal Beach and Newport Bay, Orange County, and Tijuana Slough National Wildlife Refuge (NWR), San Diego County; fig. 1). Genetic analyses of these samples (Fleischer and others, 1995; Nusser and others, 1996), reported low genetic diversity within populations and suggested that movement of individual rails from larger populations into smaller ones could be a possible management strategy.
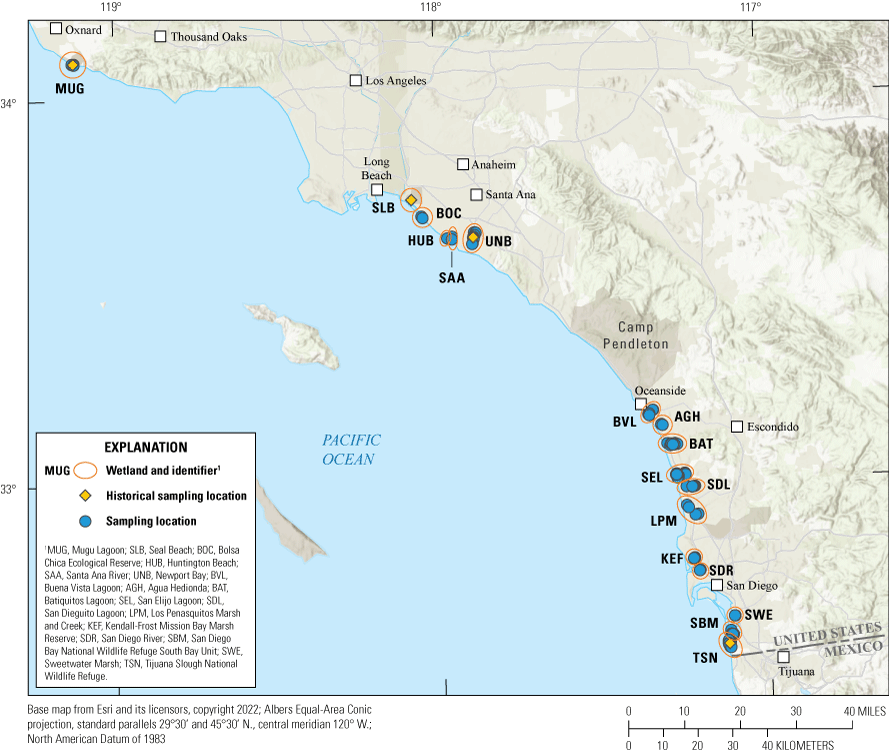
Locations of wetlands where Light-footed Ridgway’s Rails (Rallus obsoletus levipes) were sampled in southern California for this study between 2020 and 2022 (blue points) and in 1989 (Historical sampling location; yellow points).

Annual pair counts of Light-footed Ridgway’s Rails (Rallus obsoletus levipes) over time between 2001 (year 1) and 2024 (year 24) summed by region (data taken from Zembal and others, 2024). Points represent total pair counts, and lines are locally weighted (LOESS) smoothers. The Orange County region has declined, whereas north San Diego County has increased. Mugu Lagoon (the only population in Ventura County) has remained relatively low in comparison to all other regions.
Starting in 2001, a captive-release program was initiated with founders (birds and eggs) sourced from Newport Bay. Subsequently, eggs from Newport Bay have been brought in to replenish the breeding program (maintained at 3–6 pairs annually) about every 2–3 generations. Juvenile rails from this program have been released annually as part of species recovery efforts, with over 600 individuals released across southern California marshes between 2001 and 2023 (fig. 3). All breeding birds in the captive program were either taken from the Newport Bay wild population or from descendant captive offspring. All released birds can be traced to 76 wild founders through their pedigree between 2001 and 2023 (table 1.1).
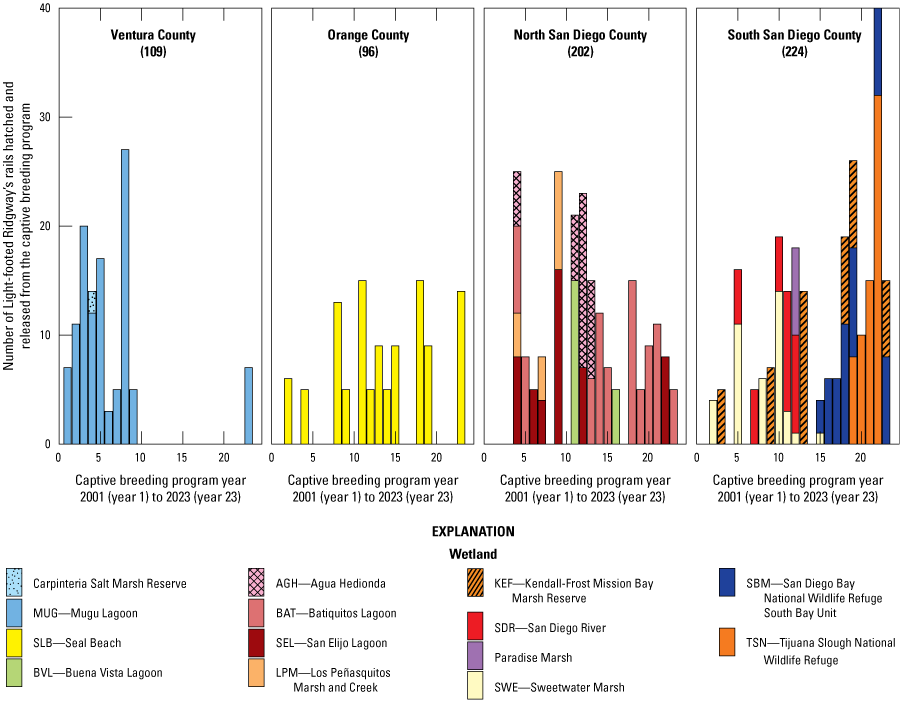
The number of Light-footed Ridgway’s Rails (Rallus obsoletus levipes) hatched and released from the captive breeding program between 2001 (year 1) and 2023 (year 23) by wetland (colored bars) and grouped into geographic regions. Numbers in parentheses are the total number of releases in each region.
Purpose and Scope
Although counts have been completed annually at most occupied wetlands since the 1980s, monitoring of movement and survivorship of released juvenile rails had not occurred until very recently (Zembal and others, 2017; Sawyer, 2024; Sawyer and Conway, in press). In addition, genetic monitoring of wild populations and genetic assessment of captive birds have been lacking until this study. Therefore, little is known about the cumulative effects of releases on population genetic structure and diversity of recipient populations. To address these uncertainties, we developed a set of microsatellite markers to allow for genetic monitoring of wild and captive rails. We evaluated the recent (2020–22) genetic population structure and diversity of rail populations throughout their U.S. range. We also compared the recent genetic structure to the pre-augmentation structure by comparing recent blood samples with blood samples available from the initial 1989 genetic surveys. Moreover, we examined genetic connectivity and diversity across the subspecies’ U.S. range to identify extant populations with high genetic diversity that could be considered for future captive-rearing sources.
Methods
Field Sampling
We visited and captured wild individuals at 17 wetlands throughout the U.S. range for genetic sampling and banding between 2020 and 2022. Sites were visited during the breeding season, roughly between April and September of each year. We used carpet traps (Harrity and Conway, 2020) with a broadcast of Ridgway’s Rail vocalizations to lure rails to the carpet traps (Pickens and King, 2013; Harrity and Conway, 2020). We removed rails from carpet traps immediately after capture, and we measured, weighed, photographed, and attached a federal leg band (Smith, 2013) to each rail. We collected blood samples from each captured rail via metatarsal venipuncture using a sterile, 26-gauge needle and transferred to a GenSaver 2.0 (AHLSTROM, Escondido, California, cat no. 8.566.0002.B-N) blood card with a non-heparinized capillary tube (Thermo Fisher Scientific, Waltham, Massachusetts, cat no. 22-260943). We then released rails at the capture location. All fieldwork was authorized following guidelines specified in Federal and State permits held by C. Conway (Federal Endangered Species Permit TE039466; Bird Banding Permit #22524; California Memorandum of Understanding (SCP-S-193610002-20008-001), and as approved by the University of Idaho Institutional Animal Care and Use Committee (2015-51).
Sampling of Captive-Bred Rails
Beginning in 2019, we collected blood samples from all captive-bred and released rails, and, when available, breeding adults. Blood samples were not regularly taken from captive rails before 2019. Rails were sampled before release, using metatarsal venipuncture, as described in the “Field Sampling” section; we attached a federal leg band (Smith, 2013) to each released bird.
1989 Baseline Samples
We received archived blood and genomic deoxyribonucleic acid (DNA) samples from the Smithsonian Museum which were used in previous population genetic analyses (Fleischer and others, 1995; Nusser and others, 1996). These samples were collected in the fall of 1989, before the start of the captive breeding program from four wetlands across the subspecies’ U.S. range: Mugu Lagoon, Seal Beach, Newport Bay, and Tijuana Slough NWR (fig. 1; table 1.2). Although the number of available historical samples per wetland was small by contemporary standards, these samples represent the best available baseline dataset for comparison to recent genetic structure and diversity metrics. All samples were sent to the Western Ecological Research Center’s San Diego Field Station genetic laboratory for extraction and amplification.
Marker Development
Microsatellite libraries were developed for R. obsoletus at Cornell University’s Evolutionary Genetic Core Facility using genomic DNA extracted from four individuals. The Evolutionary Genetic Core Facility sequenced a tetrameric, enriched genomic library on an Illumina MiSeq with paired 250 base-pair reads (Nali and others, 2014), used SeqMan NGen (version 11, DNAStar, Madison, Wisconsin) to generate a de novo assembly from the paired fastq files (raw data), and used the program msatcommander 1.0.8_beta (Faircloth, 2008) to scan for candidate microsatellite loci and design primer pairs. To design a panel of highly multiplexed microsatellite markers, we randomly selected and evaluated approximately 500 candidate microsatellite loci (500 forward primers tagged at the 5-prime end with the sequence TCGTCGGCAGCGTCAGATGTGTATAAGAGACAG, and 500 reverse primers, tagged at the 5’ end with the sequence GTCTCGTGGGCTCGGAGATGTGTATAAGAGACAG) for multiplex polymerase chain reaction (PCR) suitability using Multiple Primer Analyzer (MPA; Thermo Fisher Scientific, Sunnyvale, California). We used the MPA output in the package igraph (Csárdi and Nepusz, 2006) to cluster the loci into an arrangement that would minimize primer-dimer formation. This process resulted in four multiplexes, composed of 30–40 loci each. These loci were individually amplified in two individuals, and only loci with successful amplification in both samples (as confirmed by gel electrophoresis) were retained in the final multiplexes. All samples were genotyped using the resulting panel of 108 loci (table 1.3) arranged into four multiplexes (Mpx1-4), as described in the following section.
DNA Extraction, Amplification and Sequencing
We extracted genomic DNA from blood cards or capillary tubes using the Puregene kit (QIAGEN, Germantown, Maryland) according to the manufacturer’s protocol, with minor modifications including the addition of Proteinase K to cell lysis with an overnight incubation at 58 degrees Celsius (°C), and final resuspension in 100 microliter (µL) Tris Low ethylenediaminetetraacetic acid (EDTA; TLE) buffer (10 millimolar [mM] Tris, 0.1 mM EDTA, pH 8.0). We quantified extractions using Qubit Broad Range (Thermo Fisher Scientific) and standardized to 10–40 nanograms per microliter (ng/µL) before amplification with the Type-it Microsatellite PCR Kit (QIAGEN). We amplified loci by using four primer cocktails (Mpx1-4; table 1.3), with each primer at a 1.6 micromolar (µM) concentration in the primer cocktail. Each of four 10 µL PCR reactions contained 5 µL 2X Type-it Master Mix, 1 µL of Mpx1, Mpx2, Mpx3 or Mpx4, and 15–60 ng/µL DNA. Amplifications included 30 cycles of 95 °C for 5 minutes, 94 °C for 30 seconds, 56 °C for 1.5 minutes, 72 °C for 1.5 minutes, followed by a 12 °C hold. Upon completion, the four multiplexed PCRs per sample were pooled together, and the pooled PCR product was barcoded using Nextera N5/600 and N7/800 indexes to produce individual dual-indexed amplicon libraries for each sample. Individual sample libraries were then pooled together into one tube per 96-well plate and bead-cleaned to remove primer dimers. Pooled and bead-cleaned libraries from each plate of sample libraries were combined in equimolar proportions and sent for sequencing at MedGenome, Inc. (Foster City, California) on the NovaSeq 6000 (Illumina, San Diego, California), using the Illumina SP 300 cycle reagent kit v1.5.
Bioinformatics
We used the Python script amplicon (https://bitbucket.org/cornell_bioinformatics/amplicon) to extract reads from the Illumina runs and assign them to the appropriate locus and individual. Specifically, the script (1) trims adapters and low-quality reads, (2) creates contigs from overlapping reads (for paired-end sequencing), (3) identifies reads corresponding to each locus, (4) collapses identical reads for each individual, and (5) identifies the top two haplotypes for individuals at all loci (in other words, their diploid genotypes). We used the default options except for the following parameters: -c 1 (minimum number of samples per haplotype), -a 0.001 (minimum minor allele frequency), -l 75 (minimum haplotype length), -r 5 (maximum read count ratio between the two alleles in each sample). We then calculated the total number of reads per locus per individual, whether a locus was heterozygous or homozygous (and if heterozygous, the minimum number of minor allele reads per locus per individual). We scored loci as missing data if the total number of reads was less than (<) 200. Heterozygous loci were recoded as homozygous if the minor allele read count was low (<300), or if the total number of reads was low (<500). Before population genetic analyses, we used the R packages adegenet v. 2.1.10 (Jombart, 2008) and poppr v. 2.9.3 (Kamvar and others, 2014) to assess the quality of loci and samples using several filters. First, we removed any locus with greater than 10 percent missing data, and then removed any individual samples with greater than 10 percent missing data. Next, we applied a minor allele frequency cutoff (MAF=0.01) to identify monomorphic or uninformative loci. Once these loci and samples were removed, we used the R package genepop v. 1.2.2 (Rousset, 2008) to evaluate the dataset for linkage disequilibrium using the exact test for genotypic linkage disequilibrium with 10,000 dememorizations and 5,000 iterations; the significance of linkage disequilibrium was confirmed for loci with p-values below 0.0001. We also used the method described by Brookfield (1996) to estimate the frequency of null alleles for each locus with the R package popgenreport (Adamack and Gruber, 2014). We retained loci with null allele frequencies less than 0.2, following the recommendations of Dakin and Avise (2004).
Population Genetic Dataset
During field sampling, we captured and sampled hatch-year and adult rails. However, we removed hatch-year birds from the population structure and diversity analyses to avoid biases resulting from unequal sampling of family groups and to focus on the adult breeding populations present at the time of sampling. We included captive adults used in the breeding program to represent the captive “population” (hereafter “captive breeders”). We separated the captive breeders into two temporal groups: (1) parents of the captive offspring released before and during the wild sampling period (2019–21; group I), and (2) captive breeders held in the breeding program at the time of this report (2023–24; group II). Group I birds were included along with wild birds in structure and gene flow analyses to help evaluate the influence of the breeding program on genetic structure and diversity. Diversity metrics were calculated for groups I and II to provide information relevant to the breeders in captive breeding facilities at the time of this report. We analyzed the 1989 baseline samples separately from recent samples to compare population structure and diversity pre- and post-augmentation.
Loci were screened for deviations from Hardy-Weinberg equilibrium (HWE) at four wetland sites with greater than 20 samples (Newport Bay, Batiquitos Lagoon, San Elijo Lagoon, Tijuana Slough NWR) using an exact test based on 1,000 Monte Carlo permutations of alleles (Guo and Thompson, 1992) and applying the Benjamini and Yekutieli (2001) correction for multiple tests. We removed loci if they deviated significantly (corrected p-value less than 0.05) from HWE at three or more sites.
Population Structure and Gene Flow
We used multiple methods to assess population structure. First, we used STRUCTURE (Pritchard and others, 2000) to determine the supported number of genetic clusters (K) that conform to populations in genetic equilibrium. We specified a range for the maximum number of clusters that individuals could be assigned (K=1–10) and completed 10 replicate runs per K using 500,000 iterations of the Markov chain Monte Carlo algorithm following a burn-in of 500,000 iterations to verify consistency across chains. The optimal K was inferred by comparing the results from the maximum mean log-posterior probability for K estimated by STRUCTURE and the change in K (∆ K) criterion (Evanno and others, 2005). Second, we used principal component analysis (PCA) to visualize genotypes in multidimensional space with adegenet v2.1.10 (Jombart, 2008), in R v4.1.2 (R Core Team, 2018). We used the program PopCluster (Wang, 2022a) to estimate gene flow among populations. PopCluster provides estimates of recent gene flow rates (last 3 generations) from an admixture model. We first evaluated up to 10 clusters (K) with 20 replicate runs. After selecting the optimal K, we ran the PopCluster model with migration for 20 replicate runs to estimate gene flow rates among clusters from the individual admixture estimates.
We calculated allelic richness (Ar), private allelic richness (PAr), observed heterozygosity (Ho) and unbiased expected heterozygosity (He), and inbreeding coefficients across marsh sites, and clusters and groups of captive breeders. There was some geographic overlap between cluster assignments in Mission Bay (Kendall-Frost Mission Bay Marsh Reserve and San Diego River). For the purpose of reporting genetic diversity indices by cluster, we grouped these two wetlands in the south San Diego County cluster. The effective population size (Ne) was estimated in NeEstimator v2 (Do and others, 2014) for each cluster and period. We used the linkage disequilibrium method with monogamy and a minimum allele frequency of 0.02, and calculated 95-percent confidence intervals (CI) of point estimates by jackknifing across samples.
We compared genetic differentiation (FST), relatedness (R), allelic richness (Ar), and unbiased expected heterozygosity (He) between the baseline and recent sample periods by using group comparisons in FSTAT v2.9.4 (Goudet, 2001), with p-values derived from 10,000 permutations. We restricted our analysis to the three wetlands that were sampled in both periods (Mugu Lagoon, Newport Bay, Tijuana Slough NWR). During the time of our field sampling, only a handful of birds were observed in Seal Beach; we did not pursue sampling there to avoid disturbing the remaining rails. We also ran a PCA across paired wetlands to visualize any changes in genetic clustering over time.
Decision Framework for Genetic Rescue
Following the decision framework presented in Frankham and others (2017), we assessed whether populations met certain criteria indicating genetic erosion and whether genetic rescue could improve genetic diversity in local populations. We calculated the mean inbreeding coefficient (F):
whereHinbred
is the average heterozygosity of the receiver (inbred) population, and
Houtbred
is the average heterozygosity of the donor (outbred) population.
F values greater than 0.1 indicate that genetic diversity is sufficiently higher in donor population(s) to benefit the receiver population (Frankham and others, 2017). We used our estimates of expected heterozygosity to calculate F for each regional cluster in relation to the following donors: (1) captive breeders, (2) Orange County cluster, (3) north San Diego County cluster, and (4) south San Diego County cluster.
Comparing Coancestry and Inbreeding Coefficients from Studbook and Genetic Data
We calculated pedigree-based coancestry and inbreeding coefficients for captive breeders using the R package kinship2 (Sinnwell and others, 2014). We then estimated the genetic-based relatedness and inbreeding coefficients for captive breeders in the software EMIBD9 (Wang, 2022b). The EMIBD9 software implements a likelihood expectation maximization (EM) method, updating allele frequencies and identity-by-descent coefficients for each pair of sampled individuals until convergence. The EM method estimates relatedness and allele frequencies simultaneously from a small sample of genotypes, in contrast to traditional methods, which rely on unbiased allele frequencies obtained from a large sample of unrelated genotypes (for example, relatedness presented in table 1). We then compared the productivity, pedigree-based metrics and genetic-based metrics for recent breeding pairs.
Table 1.
Number of Light-footed Ridgway’s Rails (Rallus obsoletus levipes) sampled (N) per wetland and regional clusters and corresponding genetic diversity statistics including allelic richness (Ar) rarified to 10 gene copies, private allelic richness (PAr), rarified to 10 gene copies, observed heterozygosity (Ho), unbiased expected heterozygosity (He) and average pairwise relatedness among individuals (R; Lynch and Ritland, 1999).[Diversity statistics were not calculated (NC) for wetlands with fewer than five individuals sampled. Abbreviations: ER, Ecological Reserve; NWR, National Wildlife Refuge; —, no samples were taken]
Results and Discussion
During locus and sample evaluations, we identified 17 loci with greater than 10 percent missing data and 24 additional loci that were monomorphic. We also identified nine loci that deviated significantly from HWE, four loci with significant linkage disequilibrium, and no loci with null allele frequencies greater than 0.2. These 54 loci were removed before further analysis. The final dataset retained the remaining 54 loci and included 143 wild adult birds sampled from 17 wetlands (table 1). We included 10 captive parents of the offspring released just before and during the sampling period (group 1; 2019–21) and 10 breeding adults in the captive breeding program at the time of this report (group II; 2023–24). We also included 27 baseline samples from four wetlands sampled in 1989, before augmentation efforts (table 1). Genotype data are available as a USGS data release in Mitelberg and others (2025).
Recent Population Structure
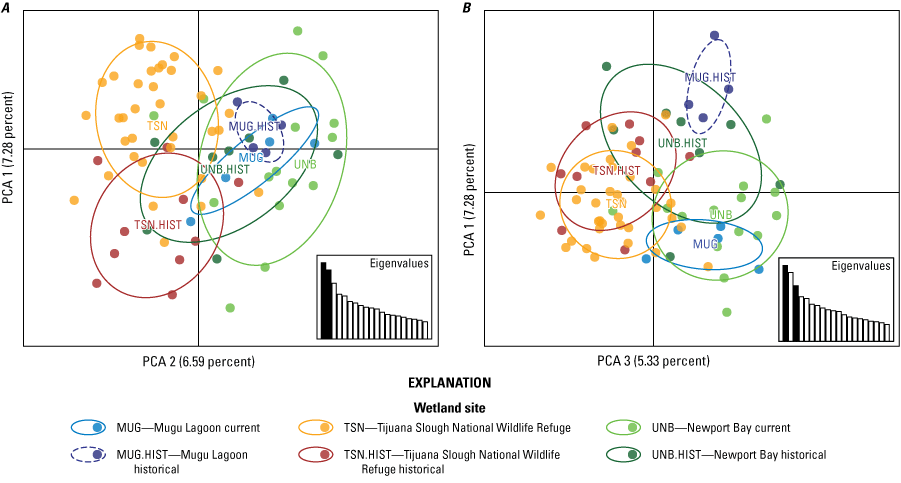
Structure analyses best supported three genetic clusters across the range (fig. 4) that roughly corresponded to sampled regions ([1] Orange County plus Mugu Lagoon and the captive breeders, [2] north San Diego County plus San Diego River, and [3] Kendall-Frost Mission Bay Marsh Reserve and south San Diego County; fig. 5). Individuals of mixed assignment were reported in all clusters, indicating recent or ongoing dispersal and gene flow occur directly among wetlands, or that gene flow is facilitated through the efforts of the captive breeding program. Principal component analysis also grouped individuals into three regional clusters (fig. 6A) along axes 1 (7 percent of the total genetic variation) and 2 (6 percent of the variation), while axis 3 (5 percent of the variation) separated individuals within marsh sites, particularly within the Orange County cluster (fig. 6B). PopCluster also supported three clusters and estimated recent gene flow rates among clusters ranging from 4.1 percent (from north San Diego County to Orange County) up to 23.5 percent (from Orange County to north San Diego County; table 2). Recent gene flow estimates among clusters were high, especially into the north San Diego County cluster. However, natural versus augmented levels of gene flow are difficult to separate in this system given the approximately 20 years (10–20 generations) of captive breeding and releases before genetic monitoring efforts. Higher rates of recent gene flow (last 3 generations) from the Orange County cluster (the source of the captive program) into the other two clusters could reflect these captive release efforts. Recent telemetry data indicate rail movement is usually localized. In a group of transmittered wild (N=42) and captive released (N=46) hatch year rails, only one captive rail moved between wetlands (from Tijuana Slough NWR to the San Diego Bay NWR South Bay Unit, about 4 kilometers [km]); all other rails stayed close to the initial capture locations (Sawyer, 2024). Similar average distances are reported from earlier studies, although occasional long-distance movements of up to 258 km have been recorded (U.S. Fish and Wildlife Service, 2020). The structuring of individual wetlands into three broader genetic populations that appear to be connected by moderate levels of gene flow provides important context for population management, supporting an inclusive regional approach consistent with genetic structure, rather than focused on individual wetlands as independent populations.
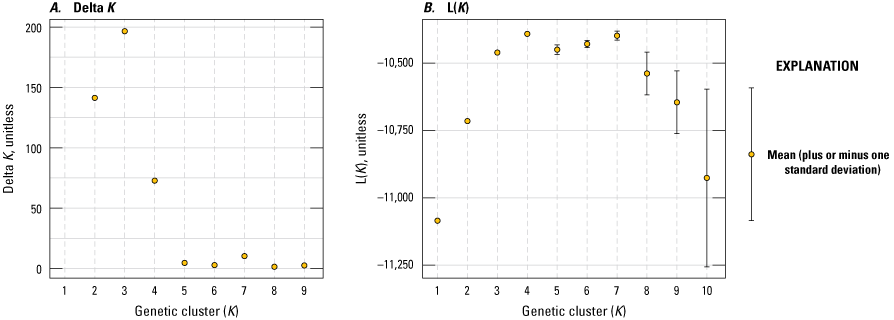
Results of STRUCTURE analyses of Light-footed Ridgway’s Rails (Rallus obsoletus levipes) supporting three genetic clusters (K=3). A, Delta K (Evanno and others, 2005) for 1 to 9 clusters (K). B, mean log-posterior probability of K (L[K]) from STRUCTURE (Pritchard and others, 2000) for 1 to 10 clusters.
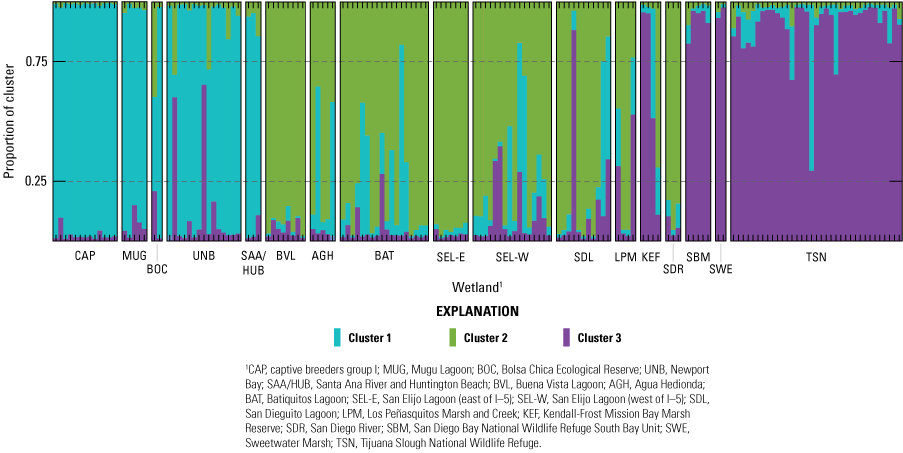
Individual assignment plot for three clusters estimated with STRUCTURE. Light-footed Ridgway’s Rails (Rallus obsoletus levipes) from Ventura County (Mugu Lagoon), Orange County, and the captive breeders were mainly assigned to Cluster 1 (blue). Cluster 2 (green) was mainly reported in north San Diego County wetlands. Birds from south San Diego County were mostly assigned to Cluster 3 (purple). Mixed assignments indicate genetic exchange across clusters, and the effect of the captive breeding program.

Principal component analysis (PCA) plots of major axes of all contemporary sampled Light-footed Ridgway’s Rails (Rallus obsoletus levipes). Points representing individuals are colored by wetland with standard ellipses around wetlands. A, PCA axes 1 and 2 roughly group wetlands into three overlapping regional clusters (Orange County plus Mugu Lagoon and the captive breeders; north San Diego County; south San Diego County). Inset histograms show the proportions of variance explained by each vector, with plotted vectors shaded black; B, PCA axis 3 (plotted with PCA axis 1) appears less geographically informative, and further separates some individuals, particularly in the Orange County cluster.
Table 2.
Estimated gene flow rates among regional populations of Light-footed Ridgway’s Rails (Rallus obsoletus levipes).[Columns denote the source populations and rows the receiver populations. Proportions to and from the same populations represent non-migrant sources. Sums greater than 1 indicate overall source populations]
Comparisons with Historical Samples
Comparing our recent samples to the 1989 baseline samples across the same set of wetlands suggests that genetic differentiation has declined slightly, relatedness has increased, and allelic richness has decreased over time (table 3). Although none of these changes were statistically significant, the direction of these respective measures is consistent with a small decline in overall genetic diversity in rail populations, which is noteworthy given the increase in sample size in two of three wetlands. The slight decline in FST may reflect the effect of the captive-bred individuals being sourced from a single site (Newport Bay) and released throughout the range or could reflect an increase in naturally occurring dispersal and gene flow among regions, facilitated by the increased population sizes in the center of the range. The PCA of baseline and contemporary samples separated sites spatially along the primary axis (fig. 7A). The second axis separated the temporal sampling periods at Tijuana Slough NWR and the third separated the temporal sampling periods within Mugu Lagoon and Newport Bay (figs. 7A, B). Mugu Lagoon seems to be the most distinctive over time, with non-overlapping point clouds (fig. 7B). Genetic differentiation over time is consistent with genetic drift (loss of genetic diversity over time), which is more extreme in smaller and more isolated populations.
Table 3.
Tests for differences in genetic differentiation (FST), relatedness (R), allelic richness (Ar) and unbiased expected heterozygosity (He) in populations of Light-footed Ridgway’s Rails (Rallus obsoletus levipes) by period.[P-values were all greater than 0.1 and were considered not statistically significant. Abbreviations: MUG, Mugu Lagoon; TSN, Tijuana Slough National Wildlife Refuge; UNB, Newport Bay]
Principal component analysis (PCA) plots of historical baseline and recent samples of Light-footed Ridgway’s Rails (Rallus obsoletus levipes) colored by wetland. A, PCA axes 1 and 2 separate the northern and southern sites and historical and contemporary samples in Tijuana Slough National Wildlife Refuge (TSN and TSN.HIST); B, PCA axis 3 separates baseline and recent samples from Mugu Lagoon and Newport Bay, respectively.
Genetic Diversity and Effective Population Size
By all measures, north San Diego County has the highest genetic diversity of all sampled regions, followed by south San Diego County, Orange County and, having the lowest genetic diversity, Mugu Lagoon (table 1). Low genetic diversity at Mugu Lagoon could reflect its position at the northern range edge and consistently low survey numbers. Despite augmentation attempts with more than 100 captive-reared birds between 2001 and 2009, the maximum number of pairs observed at Mugu Lagoon during the last two decades was in the low 20s, and only a handful of pairs were observed during the past few years (fig. 2; Zembal and others, 2024). Newport Bay also appears to have relatively low levels of genetic diversity compared with its baseline sample. Counts during annual surveys have rapidly declined since 2017 in Newport Bay and in surrounding wetlands in Orange County. Declining numbers here have been attributed to increasing tidal inundation (Zembal and others, 2024). We could not estimate effective population size (Ne) at Mugu Lagoon due to low sample size. Among the other three regions, the contemporary Ne point estimate was lowest in Orange County and highest in north San Diego County (table 4), which is consistent with all other diversity metrics. Contemporary Ne point estimates were lower than baseline samples, although CIs overlapped (table 4). General guidelines suggest Ne should be greater than 50–100 to avoid inbreeding, and greater than 500–1,000 to preserve allelic richness and long-term adaptive potential (Frankham and others, 2014). Orange County may be at or below these lower thresholds (upper 95-percent CI=113), whereas north San Diego (upper 95-percent CI=486) and south San Diego County (upper 95-percent CI=559) may be at or below the upper thresholds.
Table 4.
Linkage disequilibrium estimates of genetic effective population size (Ne) of Light-footed Ridgway’s Rails (Rallus obsoletus levipes) populations assuming a monogamous breeding system and using alleles with a frequency of greater than 1 percent.[Corresponding 95-percent confidence intervals (CI) were jackknifed across samples. Estimates for Mugu Lagoon could not be calculated (NC) because of low sample size. An upper CI of infinity (INF) indicates that there is not enough information in the dataset to estimate the upper bound. This can occur when sample sizes are small or when Ne is large. Abbreviation: —, no data]
Genetic Rescue
Frankham and others (2017) provides decision tables for determining whether a population could benefit from genetic rescue and state that appropriate source populations should have higher heterozygosity than the receiver population (F>0.1). Because it was estimated to have greater heterozygosity than the other genetic clusters, the north San Diego County cluster could be a genetically beneficial source for all other regions examined, producing F>0.1 in the receiver populations (table 5). Mugu Lagoon, with the lowest heterozygosity of any site, could benefit from genetic rescue from any other source (table 5). Finally, because the captive breeders have low diversity when compared to wild populations, augmentation results in negative F for all sites except for Mugu Lagoon (table 5). New source populations could improve diversity in the captive breeding program (see the “Managing Genetic Diversity in the Captive Program” section).
Table 5.
Genetic rescue decision table for source populations of Light-footed Ridgway’s Rails (Rallus obsoletus levipes).[In all cases, birds sourced from the north San Diego County Cluster could provide the greatest potential improvements to genetic diversity. Abbreviations: F, inbreeding coefficient; He, unbiased expected heterozygosity]
Whether or not wild regional clusters could benefit from genetic rescue can also be assessed with information about population size and isolation. Although Mugu Lagoon and the Orange County cluster have low or declining survey numbers, low effective population sizes, and are geographically more isolated, the north and south San Diego County clusters have larger survey numbers based on recent call-broadcast surveys (fig. 3) and higher effective population sizes. Although gene flow estimates among clusters were high, augmentation through the captive release program could account for some of this, and rates were lowest into the Orange County cluster.
Managing Genetic Diversity in the Captive Program
Adjustments to captive rearing source populations and release strategies, informed by new empirical estimates of population genetic diversity and structure, could help preserve genetic diversity. The pool of captive breeders has lower genetic diversity than all wild genetic clusters except for Mugu Lagoon. Therefore, the recently released hatch year birds likely added little or no genetic diversity benefit to the receiver populations into which they have been released (table 5). Two factors may contribute to this. First, breeding birds for the captive program have been consistently sourced from one wetland across the range (Newport Bay). However, this wetland has recently declined in size and has low genetic diversity and low effective population size, suggesting it may benefit from genetic rescue itself (tables 4, 5). Second, the captive breeding program is small, composed of up to six pairs annually. Some of the recent breeding birds have high inbreeding coefficients and some pairs have elevated (non-zero) genetic relatedness, despite efforts to minimize pairings between known relatives based on the pedigree (table 6). These genetic estimates could indicate non-zero relatedness among the wild ancestors. Given the small number of breeding birds in the captive program at any one time, efforts to rotate in wild birds more frequently could help to incorporate new genetic diversity. Retaining later generations of offspring in the breeding program could increase relatedness, depending on pairings. Large differences in productivity among breeding pairs may also skew the genetic makeup of captive-released cohorts. This could be reduced by limiting the number of clutches produced by each captive pair each season. Limiting breeding windows, especially to the beginning of the season, may also help increase the probability of survival for captive-released juvenile rails. Analysis of telemetry data indicated that captive rails released early in the summer had higher survival rates than those released later (Sawyer, 2024; Sawyer and Conway, in press). Finally, ensuring receiver sites receive a mix of clutches produced by unrelated pairs could decrease the overall relatedness of birds released at a single site and season.
Table 6.
Recent breeding pairs in the captive breeding program of Light-footed Ridgway’s Rails (Rallus obsoletus levipes), including hatch years, number of offspring produced, pedigree and genetic-based coancestry/relatedness and individual inbreeding coefficients (±standard deviations).[Pedigree-based statistics were calculated in kinship2 and genetic statistics were calculated in EMIBD9. Superscripts following sire and dam studbook numbers denote the maximum number of generations the individual is removed from wild ancestors. Abbreviations: ±, plus or minus; NC, not calculated because a genetic sample was not available]
Wetlands in north San Diego County have the highest heterozygosity, allelic richness, and private allelic richness across all surveyed regions and the lowest relatedness. Sourcing birds or eggs from the larger wetlands within the north San Diego County cluster could provide the greatest increase to the genetic diversity and representation within the captive breeding population for future population augmentation (table 4). Because relatedness values were generally higher within than among wetlands even within the same regional clusters, pairing birds sourced from different wetlands instead of a single wetland could also help reduce the chances of including closely related birds in the captive program. Finally, genotyping all candidate parents could directly estimate genetic relatedness and suggest pairings to minimize inbreeding.
Wetland Restoration
Given that wetlands in north San Diego County appeared largely unoccupied before the mid-2000s, it could be possible that a combination of habitat restoration coupled with captive releases (fig. 3) are responsible for the increase in numbers of pairs and high genetic diversity in north San Diego County. In addition, given estimated gene flow rates of 8–11 percent between south and north San Diego County genetic clusters, it is possible that natural dispersal of wild birds may be sufficiently high to maintain genetic diversity and connectivity across this part of the subspecies’ range.
Although opportunities to restore wetlands may be rare throughout the northern part of the subspecies’ range, restored wetlands could provide more stepping stones for increased connectivity. In the more immediate time frame, our genetic analyses suggest that Orange County and Mugu Lagoon clusters could benefit from augmentation and genetic rescue from a higher-diversity source population.
Another important factor in maintaining high diversity is retaining large populations to minimize the erosion of local genetic diversity. Habitat management and restoration can assist in maintaining large populations and could become even more critical given predicted sea-level rise, which may threaten wetland habitat in areas without sufficient upland habitat for marsh retreat (Osland and others, 2022), and may already be affecting the population at Newport Bay (Zembal and others, 2024). Models of California wetland vulnerabilities to sea-level rise, including three marshes occupied by rails (Newport Bay, Sweetwater, and Tijuana Slough NWR) predicted significant loss of high and middle marsh habitat by 2050 and between 50- and 100-percent conversion to bare mudflats by 2100 under moderate to high sea-level rise scenarios (Thorne and others, 2018). Survival of juvenile rails is affected by elevation, and the timing and water level at high tide (Sawyer, 2024; Sawyer and Conway, in press). The abundance of raptors may also have a negative effect on survival, especially for captive-released rails (Sawyer, 2024; Sawyer and Conway, in press). A recent 5-year study of mortality in California Ridgway’s Rails in San Francisco Bay indicated that avian predators accounted for most of the observed mortalities (Casazza and others, 2016).
Preliminary Conclusions and Future Research Objectives
In collaboration with researchers from Mexico, USGS has received samples from the southernmost part of the range in Ensenada, Baja California, Mexico (Estero de Punta Banda and Bahía de San Quintín). Genetic and genomic analyses of these samples can help characterize genetic diversity across the full subspecies range. A larger, genome-wide set of single nucleotide polymorphisms (Peterson and others, 2012) may provide greater sensitivity to discern any additional structure among sampled wetlands, could help assess genomic diversity, and may better resolve effective population sizes given small sample sizes (Andrews and others, 2016). Nevertheless, results to date suggest that the microsatellite loci described and analyzed here identified regional patterns in genetic diversity in wild populations and estimates of genetic relatedness and inbreeding of captive rails. These markers could provide a cost-effective tool to monitor genetic diversity in the breeding program moving forward.
References Cited
Adamack, A.T., and Gruber, B., 2014, PopGenReport—Simplifying basic population genetic analyses in R: Methods in Ecology and Evolution, v. 5, no. 4, p. 384–387. [Available at https://doi.org/10.1111/2041-210X.12158.]
Andrews, K.R., Good, J.M., Miller, M.R., Luikart, G., and Hohenlohe, P.A., 2016, Harnessing the power of RADseq for ecological and evolutionary genomics: Nature Reviews Genetics, v. 17, no. 2, p. 81–92. [Available at https://doi.org/10.1038/nrg.2015.28.]
Antao, T., Pérez‐Figueroa, A., and Luikart, G., 2011, Early detection of population declines—High power of genetic monitoring using effective population size estimators: Evolutionary Applications, v. 4, no. 1, p. 144–154. [Available at https://doi.org/10.1111/j.1752-4571.2010.00150.x.]
Benjamini, Y., and Yekutieli, D., 2001, The control of the false discovery rate in multiple testing under dependency: The Annals of Statistics, v. 29, no. 4, p. 1165–1188. [Available at https://doi.org/10.1214/aos/1013699998.]
Brookfield, J.F.Y., 1996, A simple new method for estimating null allele frequency from heterozygote deficiency: Molecular Ecology, v. 5, no. 3, p. 453–455. [Available at https://onlinelibrary.wiley.com/doi/abs/10.1046/j.1365-294X.1996.00098.x?msockid=39b2000a98bd61b52c5f158599396039.]
Bubac, C.M., Johnson, A.C., Fox, J.A., and Cullingham, C.I., 2019, Conservation translocations and post-release monitoring—Identifying trends in failures, biases, and challenges from around the world: Biological Conservation, v. 238, 8 p. [Available at https://doi.org/10.1016/j.biocon.2019.108239.]
Casazza, M.L., Overton, C.T., Bui, T.D., Takekawa, J.Y., Merritt, A.M., and Hull, J.M., 2016, Depredation of the California Ridgway’s Rail—Causes and distribution: Proceedings of the Vertebrate Pest Conference, v. 27, p. 226–235. [Available at https://doi.org/10.5070/V427110553.]
Dakin, E.E., and Avise, J.C., 2004, Microsatellite null alleles in parentage analysis: Heredity, v. 93, no. 5, p. 504–509. [Available at https://doi.org/10.1038/sj.hdy.6800545.]
Do, C., Waples, R.S., Peel, D., Macbeth, G.M., Tillett, B.J., and Ovenden, J.R., 2014, NeEstimator v2—Re-implementaion of software for the estimation of contemporary effective population size (Ne) from genetic data: Molecular Ecology Resources, v. 14, no. 1, p. 209–214. [Available at https://doi.org/10.1111/1755-0998.12157.]
Eddleman, W.R., and Conway, C.J., 2020, Ridgway’s Rail (Rallus obsoletus), version 1.0, in Rodewald, P.G., ed., Birds of the World: Ithaca, N.Y., Cornell Lab of Ornithology. [Available at https://doi.org/10.2173/bow.ridrai1.01.]
Evanno, G., Regnaut, S., and Goudet, J., 2005, Detecting the number of clusters of individuals using the software STRUCTURE—A simulation study: Molecular Ecology, v. 14, no. 8, p. 2611–2620. [Available at https://doi.org/10.1111/j.1365-294X.2005.02553.x.]
Faircloth, B.C., 2008, MSATCOMMANDER—Detection of microsatellite repeat arrays and automated, locus-specific primer design: Molecular Ecology Resources, v. 8, no. 1, p. 92–94. [Available at https://doi.org/10.1111/j.1471-8286.2007.01884.x.]
Fleischer, R.C., Fuller, G., and Ledig, D.B., 1995, Genetic structure of endangered Clapper Rail (Rallus longirostris) populations in southern California: Conservation Biology, v. 9, no. 5, p. 1234–1243. [Available at https://doi.org/10.1046/j.1523-1739.1995.9051225.x-i1.]
Frankham, R., Ballou, J.D., Ralls, K., Eldridge, M.D.B., Dudash, M.R., Fenster, C.B., Lacy, R.C., and Sunnucks, P., 2017, Genetic management of fragmented plant and animal populations: Oxford, United Kingdom, Oxford University Press, 400 p. [Available at https://doi.org/10.1093/oso/9780198783398.001.0001.]
Frankham, R., Bradshaw, C.J.A., and Brook, B.W., 2014, Genetics in conservation management—Revised recommendations for the 50/500 rules, Red List criteria and population viability analyses: Biological Conservation, v. 170, p. 56–63. [Available at https://doi.org/10.1016/j.biocon.2013.12.036.]
Goudet, J., 2001, FSTAT, a program to estimate and test gene diversities and fixation indices (ver. 2.9.4): Université de Lausanne [Switzerland] software release, accessed May 7, 2024, at https://www2.unil.ch/popgen/softwares/fstat.htm.
Guo, S.W., and Thompson, E.A., 1992, Performing the exact test of Hardy-Weinberg proportion for multiple alleles: Biometrics, v. 48, no. 2, p. 361–372. [Available at https://doi.org/10.2307/2532296.]
Harrity, E.J., and Conway, C.J., 2020, Noose carpets—A novel method to capture rails: Wildlife Society Bulletin, v. 44, no. 1, p. 15–22. [Available at https://doi.org/10.1002/wsb.1068.]
Ivy, J.A., and Lacy, R.C., 2010, Using molecular methods to improve the genetic management of captive breeding programs for threatened species, chap. 11 of DeWoody, J.A., Bickham, J.W., Michler, C.H., Nichols, K.M., Rhodes, G.E., and Woeste, K.E., eds., Molecular approaches in natural resource conservation and management: Cambridge, United Kingdom, Cambridge University Press, p. 267–295. [Available at https://doi.org/10.1017/CBO9780511777592.012.]
Jombart, T., 2008, adegenet—A R package for the multivariate analysis of genetic markers: Oxford, United Kingdom, Bioinformatics, v. 24, no. 11, p. 1403–1405. [Available at https://doi.org/10.1093/bioinformatics/btn129.]
Kamvar, Z.N., Tabima, J.F., and Grünwald, N.J., 2014, Poppr—An R package for genetic analysis of populations with clonal, partially clonal, and/or sexual reproduction: PeerJ, v. 2, 14 p. [Available at https://doi.org/10.7717/peerj.281.]
Kardos, M., Armstrong, E.E., Fitzpatrick, S.W., Hauser, S., Hedrick, P.W., Miller, J.M., Tallmon, D.A., and Funk, W.C., 2021, The crucial role of genome-wide genetic variation in conservation: Proceedings of the National Academy of Sciences, v. 118, no. 48, 10 p. [Available at https://doi.org/10.1073/pnas.2104642118.]
Lynch, M., and Ritland, K., 1999, Estimation of pairwise relatedness with molecular markers: Genetics, v. 152, no. 4, p. 1753–1766. [Available at https://doi.org/10.1093/genetics/152.4.1753.]
Markert, J.A., Champlin, D.M., Gutjahr-Gobell, R., Grear, J.S., Kuhn, A., McGreevy, T.J., Jr., Roth, A., Bagley, M.J., and Nacci, D.E., 2010, Population genetic diversity and fitness in multiple environments: BMC Evolutionary Biology, v. 10, no. 205, 13 p. [Available at https://doi.org/10.1186/1471-2148-10-205.]
Mitelberg, A., Wood, D.A., Smith, J.G., and Vandergast, A.G., 2025, Microsatellite genotypes for Light-footed Ridgway’s Rail (Rallus obsoletus levipes) sampled in southern California: U.S. Geological Survey data release. [Available at https://doi.org/10.5066/P14CYDJC.]
Nali, R.C., Zamudio, K.R., and Prado, C.P.A., 2014, Microsatellite markers for Bokermannohyla species (Anura, Hylidae) from the Brazilian Cerrado and Atlantic Forest domains: Amphibia-Reptilia, v. 35, no. 3, p. 355–360. [Available at https://doi.org/10.1163/15685381-00002950.]
Nusser, J.A., Goto, R.M., Ledig, D.B., Fleischer, R.C., and Miller, M.M., 1996, RAPD analysis reveals low genetic variability in the endangered light‐footed clapper rail: Molecular Ecology, v. 5, no. 4, p. 463–472. [Available at https://doi.org/10.1111/j.1365-294X.1996.tb00339.x.]
Osland, M.J., Chivoiu, B., Enwright, N.M., Thorne, K.M., Guntenspergen, G.R., Grace, J.B., Dale, L.L., Brooks, W., Herold, N., Day, J.W., Sklar, F.H., and Swarzenzki, C.M., 2022, Migration and transformation of coastal wetlands in response to rising seas: Science Advances, v. 8, no. 26, 9 p. [Available at https://doi.org/10.1126/sciadv.abo5174.]
Peterson, B.K., Weber, J.N., Kay, E.H., Fisher, H.S., and Hoekstra, H.E., 2012, Double digest RADseq—An inexpensive method for de novo SNP discovery and genotyping in model and non-model species: PLoS ONE, v. 7, no. 5, 11 p. [Available at https://doi.org/10.1371/journal.pone.0037135.]
Pickens, B.A., and King, S.L., 2013, Microhabitat selection, demography and correlates of home range size for the King Rail (Rallus elegans): Waterbirds, v. 36, no. 3, p. 319–329. [Available at https://doi.org/10.1675/063.036.0309.]
Pritchard, J.K., Stephens, M., and Donnelly, P., 2000, Inference of population structure using multilocus genotype data: Genetics, v. 155, no. 2, p. 945–959. [Available at https://doi.org/10.1093/genetics/155.2.945.]
R Core Team, 2018, R—A language and environment for statistical computing: Vienna, Austria, R Foundation for Statistical Computing web page. [Available at https://www.r-project.org/.]
Reed, D.H., and Frankham, R., 2003, Correlation between fitness and genetic diversity: Conservation Biology, v. 17, no. 1, p. 230–237. [Available at https://doi.org/10.1046/j.1523-1739.2003.01236.x.]
Rousset, F., 2008, GENEPOP'007—A complete re-implementation of the GENEPOP software for Windows and Linux: Molecular Ecology Resources, v. 8, no. 1, p. 103–106. [Available at https://doi.org/10.1111/j.1471-8286.2007.01931.x.]
Sawyer, K.A., 2024, Survival and habitat selection of Light-footed Ridgway’s Rails differs between captive-released and wild juveniles—Effects of time in captivity, release date, and tidal stage: Moscow, Idaho, University of Idaho, M.S. thesis, 55 p. [Available at https://www.proquest.com/docview/3058372826?pq-origsite=primo.]
Schwartz, M.K., Luikart, G., and Waples, R.S., 2007, Genetic monitoring as a promising tool for conservation and management: Trends in Ecology & Evolution, v. 22, no. 1, p. 25–33. [Available at https://doi.org/10.1016/j.tree.2006.08.009.]
Secretary of the Interior, 1969, List of endangered species: Federal Register, v. 34, no. 46, p. 5034–5035. [Available at https://www.govinfo.gov/app/details/FR-1969-03-08.]
Sinnwell, J.P., Therneau, T.M., and Schaid, D.J., 2014, The kinship2 R package for pedigree data: Human Heredity, v. 78, no. 2, p. 91–93. [Available at https://doi.org/10.1159/000363105.]
Smith, G.J., 2013, The U.S. Geological Survey Bird Banding Laboratory—An integrated scientific program supporting research and conservation of North American birds: U.S. Geological Survey Open-File Report 2013–1238, 88 p. [Available at https://doi.org/10.3133/ofr20131238.]
Spielman, D., Brook, B.W., and Frankham, R., 2004, Most species are not driven to extinction before genetic factors impact them: Proceedings of the National Academy of Sciences, v. 101, no. 42, p. 15261–15264. [Available at https://doi.org/10.1073/pnas.0403809101.]
Thorne, K., MacDonald, G., Guntenspergen, G., Ambrose, R., Buffington, K., Dugger, B., Freeman, C., Janousek, C., Brown, L., Rosencranz, J., Holmquist, J., Smol, J., Hargan, K., and Takekawa, J., 2018, U.S. Pacific coastal wetland resilience and vulnerability to sea-level rise: Science Advances, v. 4, no. 2, 10 p. [Available at https://doi.org/10.1126/sciadv.aao3270.]
U.S. Fish and Wildlife Service, 2020, Light-footed Ridgway’s Rail (Rallus obsoletus levipes) 5-year review—2020 summary and evaluation: Carlsbad, Calif., U.S. Fish and Wildlife Service report, 58 p. [Available at https://ecos.fws.gov/docs/five_year_review/doc6448.pdf.]
Wang, J., 2022a, Fast and accurate population admixture inference from genotype data from a few microsatellites to millions of SNPs: Heredity, v. 129, no. 2, p. 79–92. [Available at https://doi.org/10.1038/s41437-022-00535-z.]
Wang, J., 2022b, A joint likelihood estimator of relatedness and allele frequencies from a small sample of individuals: Methods in Ecology and Evolution, v. 13, no. 11, p. 2443–2462. [Available at https://doi.org/10.1111/2041-210X.13963.]
Zembal, R., Hoffman, S.M., and Stahl, J., 2024, Light-footed Ridgway's (Clapper) Rail in California 2024 season: Final Report to U.S. Fish and Wildlife Service and California Department of Fish and Wildlife, 33 p. [Available at https://doi.org/10.13140/RG.2.2.30357.23526.]
Appendix 1. Supplementary Tables
Table 1.1.
Founder contribution to the release program by region and overall, expressed as percentage of the 655 Light-footed Ridgway’s Rails (Rallus obsoletus levipes) released in southern California wetlands between 2001 and 2024.Table 1.2.
Baseline blood and DNA samples of Light-footed Ridgway's Rails (Rallus obsoletus levipes) collected in 1989 and provided by R. Fleischer, Smithsonian Institution.[DNA, deoxyribonucleic acid; ID, identification; NWR, National Wildlife Refuge]
Table 1.3.
Microsatellite primers and multiplex mixes designed for Light-footed Ridgway’s Rails (Rallus obsoletus levipes). All primer sequences are presented 5’ to 3’.Abbreviations
>
greater than
<
less than
CI
confidence interval
DNA
deoxyribonucleic acid
F
inbreeding coefficient
FST
genetic differentiation
HWE
Hardy-Weinberg equilibrium
Ne
effective population size
NWR
National Wildlife Refuge
PCA
principal component analysis
PCR
polymerase chain reaction
USGS
U.S. Geological Survey
USFWS
U.S. Fish and Wildlife Service
For more information concerning the research in this report, contact the
Director, Western Ecological Research Center
U.S. Geological Survey
3020 State University Drive East
Sacramento, California 95819
https://www.usgs.gov/centers/werc
Publishing support provided by the Science Publishing Network,
Sacramento Publishing Service Center
Disclaimers
Any use of trade, firm, or product names is for descriptive purposes only and does not imply endorsement by the U.S. Government.
Although this information product, for the most part, is in the public domain, it also may contain copyrighted materials as noted in the text. Permission to reproduce copyrighted items must be secured from the copyright owner.
Suggested Citation
Vandergast, A.G., Smith, J.G., Mitelberg, A., Wood, D.A., Sawyer, K.A., and Conway, C.J., 2025, Genetic structure and diversity in wild populations of the Light-footed Ridgway’s Rail reflect 20 years of augmentation through captive breeding and release: U.S. Geological Survey Open-File Report 2025–1011, 24 p., https://doi.org/10.3133/ofr20251011.
ISSN: 2331-1258 (online)
Study Area
| Publication type | Report |
|---|---|
| Publication Subtype | USGS Numbered Series |
| Title | Genetic structure and diversity in wild populations of the Light-footed Ridgway’s Rail reflect 20 years of augmentation through captive breeding and release |
| Series title | Open-File Report |
| Series number | 2025-1011 |
| DOI | 10.3133/ofr20251011 |
| Publication Date | April 25, 2025 |
| Year Published | 2025 |
| Language | English |
| Publisher | U.S. Geological Survey |
| Publisher location | Reston, VA |
| Contributing office(s) | Western Ecological Research Center |
| Description | Report: viii, 24 p.; Data Release |
| Country | United States |
| State | California |
| Online Only (Y/N) | Y |