

Black Abalone Surveys at Naval Base Ventura County, San Nicolas Island, California—2023 Annual Report
Links
- Document: Report (10.7 MB pdf) , HTML , XML
- Download citation as: RIS | Dublin Core
Acknowledgments
We would like to thank the U.S. Navy for funding and facilitating this research project. Additional funding was received from the National Marine Fisheries Service. We also would like to thank our field assistants for 2023: Melissa Neuman, Susan Wang, and Jhen Cabasal (National Oceanic and Atmospheric Administration) and Ken Collins and Taylor Leischner (U.S. Geological Survey). Finally, thanks to Amy King-Henry (University of California, Irvine) and Barbara Kus (U.S. Geological Survey) for their constructive comments on an earlier draft of this report.
Abstract
The U.S. Geological Survey monitors a suite of intertidal black abalone (Haliotis cracherodii) sites at San Nicolas Island, California, in cooperation with the U.S. Navy, which owns the island. The nine rocky intertidal sites were established in 1980 to study the potential effect of translocated sea otters on the intertidal black abalone population at the island. The sites were monitored from 1981 to 1997, typically annually or biennially. Monitoring resumed in 2001 and has been completed annually thereafter. Since 2018, the work has been carried out by the U.S. Geological Survey Western Ecological Research Center. The study sites became particularly important, from a management perspective, after a virulent disease decimated black abalone populations throughout southern California beginning in the mid-1980s. The disease, withering syndrome (Candidatus Xenohaliotis californiensis), was first observed on San Nicolas Island in 1992 and over the next few years, withering syndrome reduced the black abalone population on San Nicolas Island by more than 99 percent. In 2009, the black abalone subsequently was listed as endangered under the Endangered Species Act.
The subject of this report is the 2023 survey of the sites and the status of the measured population in comparison to long-term patterns (based on data collected since 1981) at San Nicolas Island. Between the years 2000 and 2023, the total monitored black abalone population at the island has grown from roughly 200 to more than 2,500 abalone following disease-related decline. Since it was first consistently measured in 2005, the average distance between adjacent black abalone has decreased substantially from approximately 50 centimeters to less than 15 centimeters, indicating that abalone are sufficiently close together at several of the sites to reproduce successfully. The total abalone count in 2023 was 2,570, which was 19.2 percent higher than in 2022 and the highest count since 1993. All nine sites had higher counts in 2023 than in the previous year. Over 25 percent of the black abalone counted in 2023 were classified as recruits, defined as having a shell length of 3 centimeters or less.
Plain Language Summary
The 2023 monitoring of black abalone at San Nicolas Island shows strong signs of population recovery following the severe declines caused by withering syndrome in the 1990s. The island-wide summed count from the study sites reached 2,570 individuals—the highest since 1993—and increased nearly 20 percent from 2022, with higher numbers recorded at all nine study sites. Recruitment was particularly strong, with over a quarter of individuals classified as young abalone, and densities and spacing between individuals indicate increasing likelihood of successful reproduction. Although one historically important transect at Site 8 continues to show reduced numbers of larger adults despite high recruitment, the overall population trend across the island remains positive. Continued monitoring is important to track long-term recovery, habitat conditions, and potential risks.
Introduction
This report focuses on the black abalone surveys performed in 2023 on monitoring sites at San Nicolas Island, a part of Naval Base Ventura County. The U.S. Geological Survey conducted the surveys in cooperation with the U.S. Navy. The text, tables, and figures from Kenner and Yee (2025b) are updated herein to include the 2023 data and examine the status of the measured population of black abalone in comparison to long-term patterns (based on data collected since 1981). In this section, we introduce the black abalone and discuss its reproduction, the devastating disease that has imperiled black abalone populations in California, and the resulting Federal listing as an endangered species. A history of the San Nicolas Island black abalone monitoring project also is presented for context.
Haliotis
The black abalone (Haliotis cracherodii) is one of seven species of Haliotis endemic to the west coast of North America and present in California waters (California Department of Fish and Game, 2004). The other Haliotis species that are native to California are the green abalone (H. fulgens), the red abalone (H. rufescens), the pink abalone (H. corrugata), the white abalone (H. sorenseni), the pinto abalone (H. kamtschatkana) and the flat abalone (H. walallensis). There are 55 species and several subspecies of Haliotis recognized worldwide by the Integrated Taxonomic Information System (ITIS, www.ITIS.gov) and World Registry of Marine Species (WoRMS, www.marinespecies.org). The genus consists of prosobranch gastropods typified by ear-shaped shells that are perforated by several small spiracle holes. The shells are prized for their iridescent pearly appearance and have been used in jewelry, decorations, and tools for millennia (Morris and others, 1980; Rick and others, 2002). Historically, abalone meat has commanded high prices because the large muscular foot of the invertebrate is considered a delicacy. Though varying considerably in size, several of the California species are large for gastropods, with maximum shell lengths ranging from 20 to almost 30 centimeters (cm) depending on the species. Of the seven species, six were fished extensively, and although black abalone are considered inferior because of their tougher flesh, ease of availability in the intertidal made them a favorite of indigenous tribes inhabiting the California Channel Islands (Haas and others, 2019). Later, they sustained a recreational and commercial fishery until the 1990s. The annual commercial take for this species peaked in 1973 at about 873,000 kilograms (kg; California Department of Fish and Game, 2004).
Black abalone inhabit rocky shores from the high intertidal to a depth of approximately 6 meters (m), which is shallower than the other local Haliotis species. The range of the black abalone extends from Point Arena, California, to Isla de Cedros, Baja California Sur, Mexico, but they are most abundant from central California southward (VanBlaricom and others, 2009). Smaller black abalone feed on algal and diatom films (National Marine Fisheries Service, 2020), whereas larger individuals are thought to feed mainly on drift kelp, such as giant kelp (Macrocystis pyrifera), feather boa kelp (Egregia menziesii), and southern sea palm (Eisenia arborea; VanBlaricom and Kenner, 2020). Black abalone can attain a shell length of as much as 20 cm. In addition to humans, natural predators of the black abalone include octopuses (Octopus spp.), sea stars (especially ochre stars, Pisaster ochraceus), cabezon (Scorpaenichthys marmoratus), and sea otters (Enhydra lutris; Morris and others, 1980). Black abalone are relatively sedentary, and some large specimens can go years without apparent movement. However, VanBlaricom and others (2009) have reported that smaller individuals are more mobile and capable of movement on the order of several centimeters to a few meters in a day.
Reproduction
Like many marine invertebrates, black abalone reproduce by broadcast spawning, a reproductive strategy in which mature male and female individuals release large numbers of gametes into the environment with no mutual physical contact necessary. Successful fertilization requires temporal synchrony and relatively close spatial proximity of adults. Black abalone are thought to become reproductive at 3–4 years of age and may live 20–30 years (VanBlaricom and others, 2009). Although several studies have concluded that black abalone populations spawn in late summer (Boolootian and others, 1962; Leighton and Boolootian, 1963; Webber and Giese, 1969), the actual trigger for spawning is unknown. In fact, unlike several other species of Haliotis, spawning of H. cracherodii in the laboratory has been met with limited success.
As noted in the previous section, black abalone are somewhat sedentary and do not aggregate to spawn, so the density and distribution of individuals in abalone populations are of interest in assessing population viability. Because gamete concentration diminishes precipitously with distance from their source, the proximity of spawning individuals is central to successful fertilization. However, there are many confounding factors to consider when attempting to calculate critical reproductive distance in intertidal organisms, such as turbulence, channeling of water through crevices, and residency time of gametes in pools (Blaud, 2013). However, distances greater than a few meters between black abalone likely result in reduced reproductive success compared with shorter distances (VanBlaricom and others, 2009), and average adult densities below 0.34 per square meter (m2) led to recruitment failure in some populations (Neuman and others, 2010). There is a positive correlation between adult black abalone density and the presence of juveniles, with no substantial recruitment at densities less than one adult per m2 (Miner and others, 2006). Abalone produce non-feeding larvae with a relatively short larval planktonic period. For this reason, bolstered by genetic evidence, it is thought that black abalone likely disperse relatively short distances (Chambers and others, 2006).
Withering Syndrome
Withering syndrome (WS) is a disease that affects many species of Haliotis and results in atrophy of the foot and a diminished ability to cling to hard substrate. Animals showing signs of WS undergo body shrinkage as the disease progresses because of a combination of reduced food intake and changes in the structure of the digestive gland. The progressive degeneration eventually leads to death. The causative agent has been identified as a Rickettsiales-like prokaryotic organism (often referred to in the literature as “RLO”), specifically Candidatus Xenohaliotis californiensis (CaXc; Friedman and others, 2002; National Institutes of Health, 2026). First observed in black abalone on the Channel Islands of California, WS began at Santa Cruz Island in 1985 and spread through the Channel Islands over the next few years, arriving at San Nicolas Island in 1992 (Lafferty and Kuris, 1993; VanBlaricom and others, 1993).
Black abalone populations in southern California declined by more than 95 percent after infection with WS. It then moved into central California populations, where it caused serious levels of mortality (Neuman and others, 2010). Although CaXc has been detected in black abalone throughout its range, populations north of San Luis Obispo County have not experienced the high levels of mortality associated with the WS in coastal areas to the south (National Marine Fisheries Service, 2020). Elevated water temperatures may accelerate disease transmission and mortality rates (Raimondi and others, 2002). Friedman and others (2014) indicated that there may now be genetic resistance to WS infection in some black abalone populations on San Nicolas Island. More conclusively, they discovered a viral bacteriophage that infects CaXc and provides some protection from the disease. The effectiveness of genetic resistance and viral bacteriophages at protecting wild populations is still unknown.
Endangered Species Status
The National Marine Fisheries Service (NMFS) listed H. cracherodii as an endangered species in January 2009. This action was taken to address concerns about the serial near-extirpation of populations in southern California and Mexico, the continued movement of WS northward, and potential recruitment failures (74 Federal Register 1937, January 14, 2009c; National Oceanic and Atmospheric Administration, 2009).
In their critical habitat designation for the black abalone, the NMFS excluded San Nicolas Island because of revisions in the Navy’s Integrated Natural Resource Management Plan (INRMP) that provide conservation and recovery benefits to black abalone (76 Federal Register 66806, October 27, 2011; National Oceanic and Atmospheric Administration, 2011). One of the management strategies for marine invertebrates set forth in the INRMP was to “promote and discuss current long-term monitoring of black abalone populations established in the late 1970s (VanBlaricom and others, 1993) and ensure that survey information on existing populations and trends are made available to the general scientific community” (U.S. Navy, 2015).
Project History
The original impetus for monitoring at San Nicolas Island was the planned reintroduction of the southern sea otter (Enhydra lutris nereis), a top marine carnivore that feeds almost exclusively on shellfish (VanBlaricom, 1993). The southern sea otter historically lived at San Nicolas Island but had been absent from the island for nearly a century because of overhunting. Between 1987 and 1990, 139 sea otters were translocated to San Nicolas Island from the central California coast population (Rathbun and others, 2000). In much of their reoccupied range, sea otters (Enhydra lutris) have substantially decreased subtidal red abalone populations, driving them below commercially viable levels (Watson, 2000). However, the potential effect of sea otter predation on intertidal abalone populations was uncertain because sea otters do not regularly use the intertidal zone for foraging (VanBlaricom, 1993).
Nine sites were established for monitoring black abalone on San Nicolas Island in 1980 (fig. 1, app. 1) and first sampled in 1981 by Glenn VanBlaricom, then of the U.S. Fish and Wildlife Service. The sites were in the rocky intertidal in areas where dense patches of abalone occurred. Throughout the rest of the report, unless otherwise specified, the term “abalone” will refer specifically to “black abalone.” Each site consisted of several permanently-marked band transects of variable length and typically 2 m in width, along which abalone were counted during negative tidal height series. One complete survey of all the sites was termed a cycle, but sampling of some sites was not completed in cycles 1 and 2 (1981 and 1982, respectively). More detail is provided in the “Methods” section.
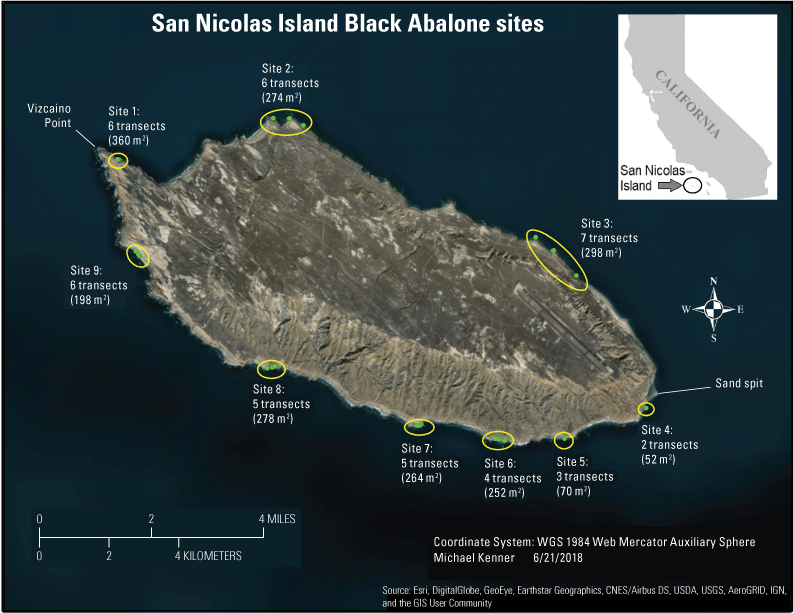
Monitoring sites for black abalone (Haliotis cracherodii) on San Nicolas Island, California, showing location, number of transects, and total sampling area at each site. Abbreviations: m2, square meter; WGS, World Geodetic System.
During the first 10 years of monitoring, black abalone were densely aggregated at the sites, with mean site densities ranging from about 4 to 28 per m2 and sometimes exceeding 100 abalone stacked several individuals deep within a square meter (Kenner and Yee, 2025b). Total counts of abalone on the combined sites usually exceeded 20,000, and although cycles were usually completed in about 12 months, cycles 4 and 7 took closer to 2 years to complete.
During the 1980s and 1990s, in addition to abalone counts on the transects, some shell length data were collected opportunistically. Samples of 100 or more abalone were measured during several cycles between 1983 and 1993, resulting in nearly 3,400 measurements made during 2 to 4 cycles at each site.
No sampling was performed in 1998–2000 but since the resumption of surveys in 2001, sampling of all sites has been completed every year, and most abalone on the transects have been measured. All sampling trips through 2017 were led by Glenn VanBlaricom of the U.S. Geological Survey. Monitoring cycles from 2018 to 2023 were supported by the U.S. Navy and led by Michael C. Kenner (U.S. Geological Survey). Additional support was received from NMFS since 2021. The 2023 field season represented the 33rd cycle of sampling the sites since they were established. A timeline of important events is shown on figure 2. The figure also shows when sampling protocols described in the “Methods” section were initiated or modified in recent years to better characterize the size structure, spatial distribution, and microhabitat use of the abalone.
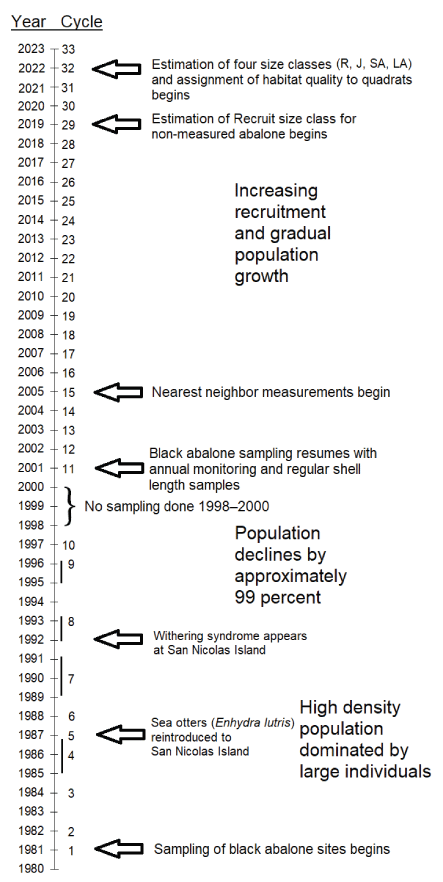
A timeline of sampling cycles with arrows indicating timing of major changes in sampling or changes in black abalone (Haliotis cracherodii) populations at San Nicolas Island, California. Bars along the line indicate cycles lasting more than 1 year. No sampling was done from 1998 to 2000. Size class abbreviations: R, recruits; J, juvenile; SA, small adult; LA, large adult
The extent to which the densities recorded at the sites before WS were a natural baseline is debatable because of major changes at San Nicolas Island over the prior century. Pressure from sea otter foraging was removed because of the otter population’s extirpation by fur hunters in the 19th and early 20th century (VanBlaricom, 1993). Furthermore, human harvest of abalone, which had been part of the system for millennia, was greatly reduced after the removal of indigenous people from San Nicolas Island in 1835. Additionally, the establishment of active military control of the island in 1942 likely reduced access for most commercial and sport take (U.S. Navy, 2015).
Disease, not sea otter predation, caused the black abalone populations at San Nicolas Island to dramatically decline. From the time WS appeared at San Nicolas Island in 1992 until 2001, when regular annual sampling resumed, the population among the nine monitoring sites was reduced by more than 99 percent (Kenner and Yee, 2022).
Methods
We used field survey methods to track abalone density, population growth, recruitment, and size distribution. The original methods, established in 1980, were consistently performed on a nearly annual frequency and expanded in recent years to include additional data that inform recovery criteria prescribed by the black abalone recovery plan (fig. 2; National Marine Fisheries Service, 2020). The recovery criteria data are analyzed separately (Kenner and Yee, 2025a). For this report, we used statistical trend models to analyze changes in population growth rate.
Surveys
There are 9 abalone monitoring sites distributed around the island, each consisting of 2 to 7 permanent transects (fig. 1) that range in length from 7 to 40 m depending on the availability of suitable habitat (rock substrate, ideally with crevices, between approximately −0.5 m and +2.0 m tidal height). These transects were established in areas that supported high densities of intertidal abalone in 1980 (VanBlaricom, 1993) and are distributed around the island with a range of swell and current. Although H. cracherodii can occur at depths of several meters below 0-m tidal height, we have not attempted examination or monitoring of the sublittoral population at San Nicolas Island because of hazardous surf conditions. The transects are marked by multiple stainless-steel eyebolts, typically 5–10 m apart, that are epoxied into holes drilled in the rock. During surveys, a meter tape is attached to the eyebolts and a 2-m-wide area centered on the transect is surveyed along the length of the transect. To provide better repeatability of effort and allow for finer scale data assessments, the belt transects are further divided into 1-m2 quadrats on either side of the transect tape; for example, a 30-m transect has 60 quadrats and samples 60 m2 of area. The only exceptions are at site 2, where transects 3 and 4 are treated as 1-m wide because the transect tapes there each run along a single crevice for their length. The total sampled area for all nine sites is 2,054 m2. However, the actual surface area sampled is much greater because of the heterogeneity of the rocky shore, including numerous crevices, ridges, and boulders. The transects are useful for tracking changes in density, spatial distribution, and size distribution, but because transects were specifically established in areas where abalone were most dense and were not randomly placed, they cannot be used to estimate an island-wide population size or density.
Sampling cycles typically began in January, but in some years, they began in late December to take advantage of particularly low negative tide series that sometimes occur then. When possible, sampling cycles were completed in winter when negative low tides usually occur during daylight. From April to October, negative tide series are usually during the night or are not low enough for sampling to be productive, but sampling during 2021 was successfully done in May–July because of delays in sampling owing to the Covid-19 outbreak. As mentioned in the “Project History” section, some of the earlier cycles were not completed in a 1-year period. The order in which sites were sampled was determined largely by tidal height and surf conditions.
Each quadrat was carefully and sequentially searched for black abalone with the aid of handheld lights to assist in searching the cracks and crevices. Black abalone that were discovered were measured for maximum shell length to the nearest millimeter (mm; fig. 3) by using divider calipers and a ruler. Frequently, it was not possible to obtain a measurement because abalone often occurred in crevices where they could not be reached with measuring tools. In recent years, size was estimated and binned into size classes in these instances. The target sample size for shell measurements was at least 200 per site at sites where that many could be found. Due to the meticulous search process, shell measurements are best collected at the time of each abalone discovery, before completing the total count of abalone at that site. Consequently, random sampling was not a feasible option for reaching the target sample size for measurements, and instead, abalone were systematically measured using a repeatable protocol until the target was reached. At sites 7 and 8, where there have been more than 200 measurable abalone most years since 2013, the remaining abalone on transects were counted without further measurement. At both of these sites, transects were sampled in the same order and from the same starting point each year to minimize spatial sampling variation that might be associated with the quadrats where the first 200 abalone were found and measured. Additional abalone beyond the targeted number were measured opportunistically as timing and logistics allowed.
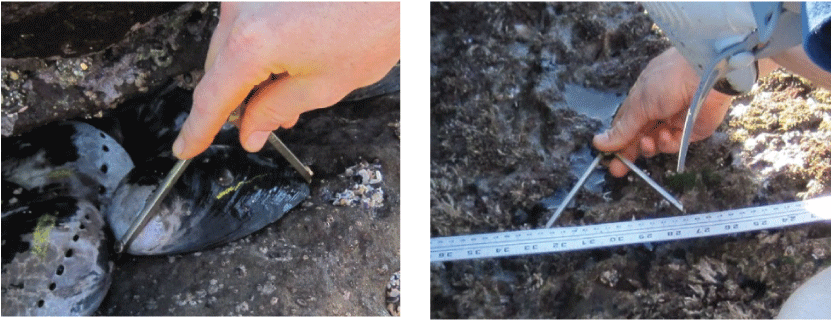
Black abalone (Haliotis cracherodii) shell length is measured to the nearest millimeter by using divider calipers and a ruler, San Nicolas Island, California. Photographs taken by M.C. Kenner, U.S. Geological Survey, January 22, 2019.
Before 2001 (cycle 11), shell sizes were not recorded as part of the regular sampling effort but were measured opportunistically. These opportunistic measurements were made as follows. At a given site, beginning at a randomly chosen starting point along a randomly selected transect, researchers moved a random direction along the transect, measuring all accessible abalone to the nearest millimeter, until at least 100 animals were measured on the site.
Beginning in sampling cycle 29 (2019), most abalone that were not measured, either because they were inaccessible or were encountered after 200 measurements were made at a site, were assigned by visual estimation to one of two size bins (fig. 2). These size bins were less than or equal to 3 cm (recruit) or greater than 3 cm (non-recruit). Beginning in cycle 32 (2022), abalone greater than 3 cm were further subdivided into three size classes (fig. 2): juvenile (less than or equal to 5 cm but greater than 3 cm), small adult (less than or equal to 10 cm but greater than 5 cm), and large adult (greater than 10 cm). These size classes correspond to those prescribed by the black abalone recovery plan (National Marine Fisheries Service, 2020) for population analysis. Although 3 cm represents an abalone that likely settled as long as two years prior, it is considered here as a recruit into the counted population because smaller abalone are very cryptic and thus poorly represented in count data. Abalone in the recruit and juvenile size classes are non-reproductive, whereas the small adult and large adult classes are considered reproductive (Leighton and Boolootian, 1963).
Beginning in 2005, for every black abalone on a transect, including non-measured individuals, the distance to the closest conspecific (nearest neighbor) was measured (or estimated) to the nearest cm (fig. 2). Nearest neighbors were recorded even if they occurred outside of the transect.
The microhabitat of each abalone on a transect was recorded as one of three classes: open horizontal, open vertical, or crevice. The first two categories are characterized by open, non-cryptic habitats that are either less than or greater than a 45-degree angle from a horizontal plane, respectively. Crevice habitat consists of cracks, crevices, or pockets of any orientation. Additionally, the cover of exposed sand, greater than approximately 1-centimeter depth, was estimated to the nearest 10 percent for each quadrat.
In 2022 (cycle 32), each quadrat was subjectively assigned to one of three habitat quality classes (fig. 2): good, moderate, or poor (National Marine Fisheries Service, 2020). Good habitat contains cracks, crevices, or overhangs that are deep and narrow enough to provide some protection from predation. Moderate habitat contains a range of features from shallow or very wide cracks and crevices to small ridges and depressions that provide marginal protection. Poor habitat is relatively flat and bare or filled with sand, providing either no shelter or no appropriate substrate for abalone attachment. This habitat quality classification will not be repeated every year because the physical structure of the quadrats should remain relatively stable over time. Occasionally, quadrat quality will change owing to factors such as erosion, boulder movement, sand burial, or infilling of crevice space by colonial sandcastle worms (Phragmatopoma californica).
Unavoidably, counts were subject to error because some abalone remained hidden in cryptic rock or biological refugia despite efforts to thoroughly search for them. In addition, surging water during moderately low tides or high surf sometimes complicated field efforts.
Statistical Analysis
For each of the nine study sites and for the total of all sites combined, we characterized the recovery and percentage changes of abalone by first summing abalone counts across transects and analyzing the respective time series for the recovery period from 2001, when the smallest number of abalone were counted, to 2023. These 10 time series were subject to variations and nonlinear patterns over time; therefore, we used generalized additive models (GAMs) to model the summed counts within each time series as randomly distributed observations around a smooth nonlinear function of year. The variation in counts was statistically modeled as an over-dispersed Poisson distribution (data dispersion beyond that expected from a Poisson model), or quasi-Poisson distribution, centered around the smooth function. Each GAM function represents a process average, that is, the mean number of abalone on the surveyed transects as a function of time around which the observed counts are distributed. The quasi-Poisson distribution was fitted by the gam function with a log link function from the mgcv package in R statistical software (https://www.r-project.org/), representing trends using a smooth spline function based on year (Hastie and Pregibon, 1992; Wood, 2017; R Core Team, 2023). We fit the set of 10 time series simultaneously by including it as a factor in the model.
Following visually apparent inflexions in the GAM curve based on the total combined count from all the sites, the subperiods 2001–07, 2007–14, 2014–23, and the period from 2001 to 2023, were examined. Period percentage changes (% Change) were calculated from the GAM-based estimates of mean abalone abundance between the first and the last years of each period, denoted N1 and N2, respectively. Specifically, % Change is defined as follows:
whereN1
is the GAM-based estimate of mean number of abalone at the first year of a period, and
N2
is the GAM-based estimate of mean abalone abundance at the last year of a period.
Percent per annum changes (% Per Annum Change) also were calculated for each period from annualized rates of growth:
whereN1
is the GAM-based estimate of mean abalone abundance at the first year of a period,
N2
is the GAM-based estimate of mean abalone abundance at the last year of a period, and
y
is the number of years between the first and last years in the period of interest.
We calculated 95-percent confidence bands for the percentage changes by first transforming the estimates from the log-scale used by GAM back to the original scale. Percentage change in equation (1) can be expressed in terms of log(N1) and log(N2) as follows, dropping the percentage notation for simplicity:
whereN1
is the GAM-based estimate of mean abalone abundance at the first year of a period,
N2
is the GAM-based estimate of mean abalone abundance at the last year of a period,
log()
is the natural logarithmic function, and
exp()
is the natural exponential function, also known as the antilogarithmic function.
Because of the flexible properties of GAM functions, we treated the estimates for log(N1) and log(N2) as independent and applied the variance formula for the difference of two independent variables, log(N2) − log(N1), in other words, the sum Var(log(N2)) + Var(log(N1)), where Var() is the variance function. We then calculated the square root of this variance to derive the standard error and then calculated 95-percent confidence bands by adding and subtracting two standard errors from the log difference. Finally, we exponentiated the interval limits and subtracted one in accordance to equation (3) to obtain the 95-percent confidence bands for the percentage change. We used similar methods to calculate the 95-percent confidence bands for percent per annum change, except we used the following equation:
whereN1
is the GAM-based estimate of mean abalone abundance at the first year of a period,
N2
is the GAM-based estimate of mean abalone abundance at the last year of a period,
log()
is the natural logarithmic function,
exp()
is the natural exponential function, also known as the antilogarithmic function, and
y
is the number of years in the period of interest.
In the final transformation of the confidence bands for percent per annum change, we divided the 95-percent confidence bands of the log difference by y before exponentiating and subtracting one.
This approach results in symmetric confidence bands on the log-scale, but after transformation, the intervals are asymmetric on the original data scale. The asymmetry is to be expected because Poisson distributions and count distributions in general are skewed with longer tails to the right (toward higher values) compared to the left, which is bounded by the minimum limit of 0. Furthermore, our approach to calculating confidence bands for percentage change is conservative because we treated the estimates at N1 and N2 as independent; therefore, our variance estimates for percentage differences may be larger than true variability if the estimates are correlated.
Results and Discussion
The cycle 33 sampling of the sites took place between January 6 and March 18, 2023, and was done during five trips to the island. It was a stormy winter in California, and conditions ranged from very good to unworkable over the course of the season, with rain and large surf sometimes interfering with fieldwork.
Counts
A total of 2,570 abalone were counted at all 9 sites in 2023. This total was 414 more than in 2022 and the highest since the population began to decline following the initial outbreak of WS on the island in 1992 (table 1). All nine sites had higher counts in 2023 than in the previous year. The largest increases in counts were at site 7 (129 abalone) and site 1 (79 abalone), but the largest percentage increases were at site 3 (103.9 percent) and site 4 (62.7 percent). Site 8, which for many years had the highest counts of all the sites, had a lower count in 2021–23 than it did in 2017–20. Sites 7 and 8 continued to have the highest counts, with a combined 68.4 percent (1,759) of the total abalone counted, and year 2023 was the third consecutive year that counts at site 7 exceeded those at site 8, reversing the ranking that prevailed for most of the previous 25 years. Site densities ranged from 0.2 to 3.5/m2 with sites 4, 7, and 8 having mean densities above 1.0 per m2 (table 2) and the year 2023 marking the sixth consecutive year that the mean overall density of all sites combined remained at or above this value. Before the onset of WS in 1992, overall density ranged from 10.8 to 12.4/m2 when all quadrats were sampled, and site means ranged from 3.8 to 31.6/m2.
Table 1.
Total counts of black abalone (Haliotis cracherodii) by site for each sampling cycle, San Nicolas Island, California, 1981–2023.[Far right column has cycle total. Percentage change from 2022 to 2023 at each site and overall is shown at bottom. Asterisk (*) indicates sites or totals with missing transect data in cycles 1 (transect 4 and one-third of transect 1 at site 7) and cycle 2 (transect 6 at site 1 and sites 3 and 8). Abbreviations: ND, no data (site was not sampled); +, increase; —, not applicable]
Table 2.
Average density per square meter of black abalone (Haliotis cracherodii) by site for each sampling cycle, San Nicolas Island, California, 1981–2023.[Far right column has total average density for cycle as a mean of all sampled quadrats. Asterisk (*) indicates sites or totals with missing data in cycles 1 and 2 (refer to the “Project History” section for details of missed counts). Abbreviation: ND, no data (site not sampled)]
Among transects, transect 2 of site 8, which previously had the highest count every year since 2002 but declined by 341 abalone (62.3 percent) in 2021, increased by 73 abalone in 2023 over the previous year (table 3). In fact, transect 2 accounted for most of the increase in counts observed at site 8 in 2023, whereas three of the other transects at this site had lower counts. Most of the increase observed at site 7 in 2023 was on transect 4 (93 abalone). Of the 44 total transects, changes in 2023 ranged from a decrease of 47 abalone to an increase of 93, and the counts of 13 transects declined, 26 transects increased, and 5 transects remained the same. As in 2022, zero abalone were counted on only 3 of the 44 transects in 2023.
Table 3.
Number of black abalone (Haliotis cracherodii) counted at each site by transect, San Nicolas Island, California, 2018–23.[Total count for each year is in bottom row]
The whole island population trend during 2001–23 showed three visually apparent general phases (fig. 4; table 4). During the initial 7 years, from 2001 to 2007, total abalone counts showed a relatively modest increase of 142 percent (16-percent per annum average). This modest increase was followed by a higher growth period from 2007 to 2014, with an increase of 276 percent (21-percent per annum average). During the last 10 years, from 2014 to 2023, growth declined to a slower rate, increasing only 51 percent (5-percent per annum average). Over the period from 2001 to 2023, the population had average per annum growth of 13 percent.
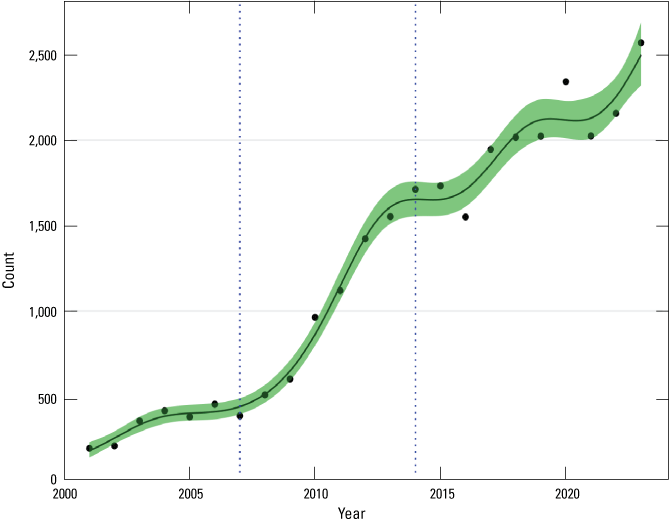
Black abalone (Haliotis cracherodii) total counts from all sites combined, generalized additive model (GAM) nonlinear regression, and 95-percent confidence band, San Nicolas Island, California, 2001–23. The GAM for total counts was fitted simultaneously with nine site-level GAM functions (fig. 5) for an overall adjusted R-square of 0.992.
Table 4.
Period (top) and per annum (bottom) percentage changes in mean black abalone (Haliotis cracherodii) counts during given periods calculated from general additive model (GAM) analysis, San Nicolas Island, California, 2001–23.[Values in parentheses indicate 95-percent confidence band for GAM estimate each year]
Population growth has varied among sites since 2001 (table 4). Negative and positive changes in population growth were significant if the 95-percent confidence bands calculated from the GAM nonlinear regression did not overlap zero; confidence bands overlapping zero were considered not significant. All sites showed growth during the period from 2001 to 2023, as indicated by estimates and confidence bands exceeding zero. Site 5 had the lowest overall rate of growth during the period from 2001 to 2023, with an average per annum rate of 7 percent, whereas site 4 had the highest at 29 percent. Site 8, which has accounted for 78.5–31.8 percent of the surveyed population since 2001, had a low overall average per annum rate of increase from 2001 to 2023 (8 percent). Sites 2 and 9 sustained consistent average per annum rates of growth across the three periods spanning 2001–23, with 14–17 percent and 11 percent, respectively.
Most of the sites had their highest population growth rate during the first and second periods (2001–07 and 2007–14; table 4). Site 1 experienced no significant change during the first period (2001–07), and site 5 had no significant change during the second period (2007–14). During the 2014 to 2023 period, site 3 experienced negative change, and site 8 had no significant change, as indicated by estimates and confidence bands falling below or overlapping with zero, respectively. These patterns are illustrated on figure 5, which shows the logarithmic count trajectories, the calculated GAM curve, and the 95-percent confidence band for each of the sites.
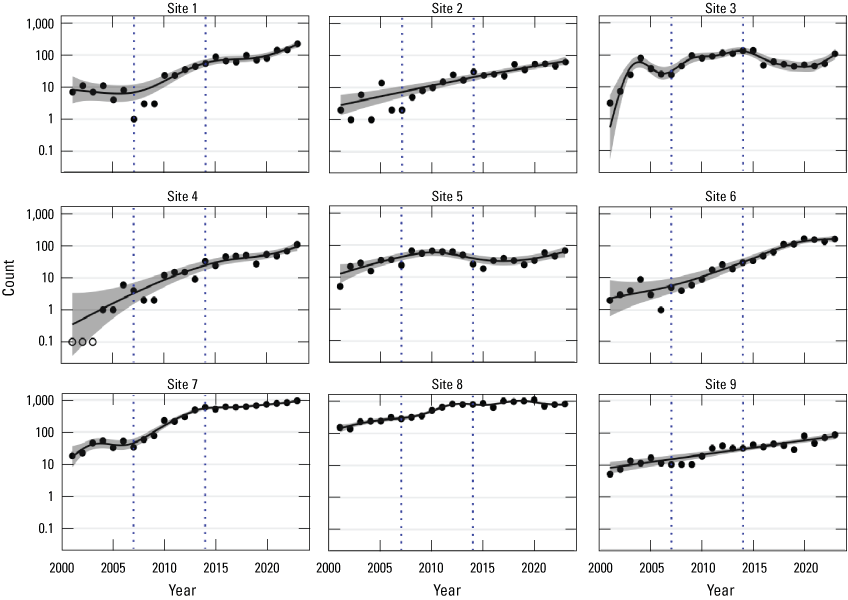
Black abalone (Haliotis cracherodii) counts at each site, plotted on a log scale, San Nicolas Island, California, 2001–23. Curves and 95-percent confidence bands were generated by generalized additive model (GAM). Zero values at site 4 are replaced with 0.1 to allow plotting on log-scaled axis and shown as open circles. Site-level GAM functions were fitted simultaneously with the GAM for total counts (fig. 4) for an overall adjusted R-square of 0.992.
Abalone counts at all nine sites declined rapidly in the mid-1990s (table 1, fig. 6A) after WS was first observed at San Nicolas Island in 1992 (VanBlaricom and others, 1993). Population growth following the minimum observed in 2001 has been uneven among the sites (figs. 6B, 7). During this time, site 8 had the highest count every year until 2021 when the count declined by 36 percent. Site 7 became the site with the highest black abalone counts in 2021–23. Site 1 had the third highest counts in 2022 and 2023, exceeding those at site 6 in those years.
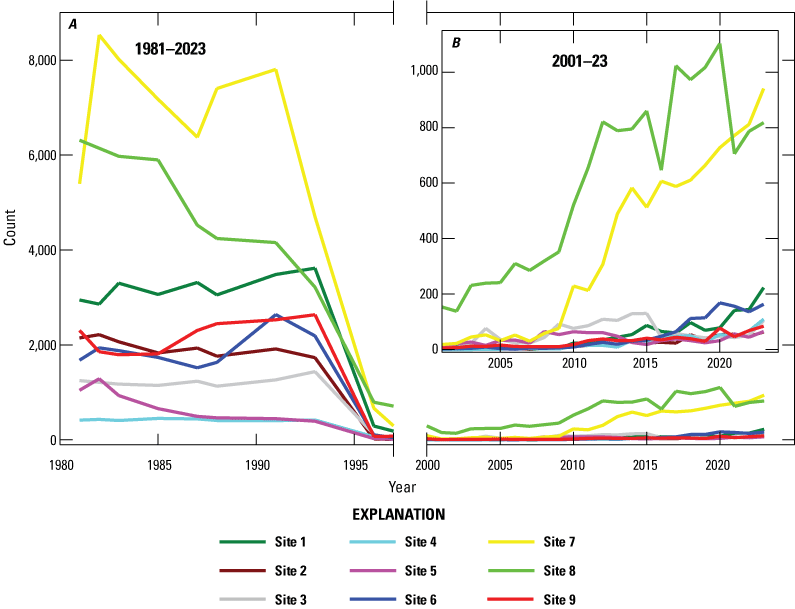
Total black abalone (Haliotis cracherodii) count at each of the nine San Nicolas Island, California, sites A, during the study (1981–2023) and B, during the 2001–23 recovery phase after the withering syndrome outbreak (inset). No counts were made between 1997 and 2001.
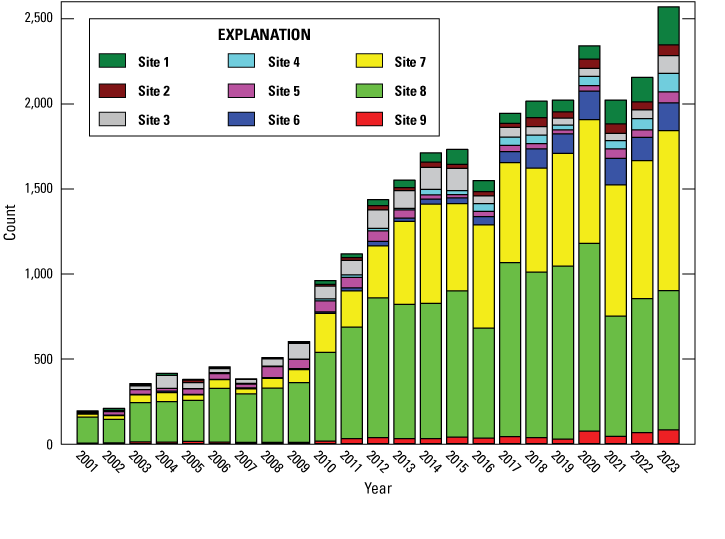
Contribution of each site to total black abalone (Haliotis cracherodii) counts, San Nicolas Island, California, 2001–23.
At sites 7 and 8, the two sites with the most abalone during the 2019–23 sampling period, abalone on the transects had a clumped distribution (figs. 8, 9). There was a persistence of high-density and low-density regions along the transects, although counts changed over time.
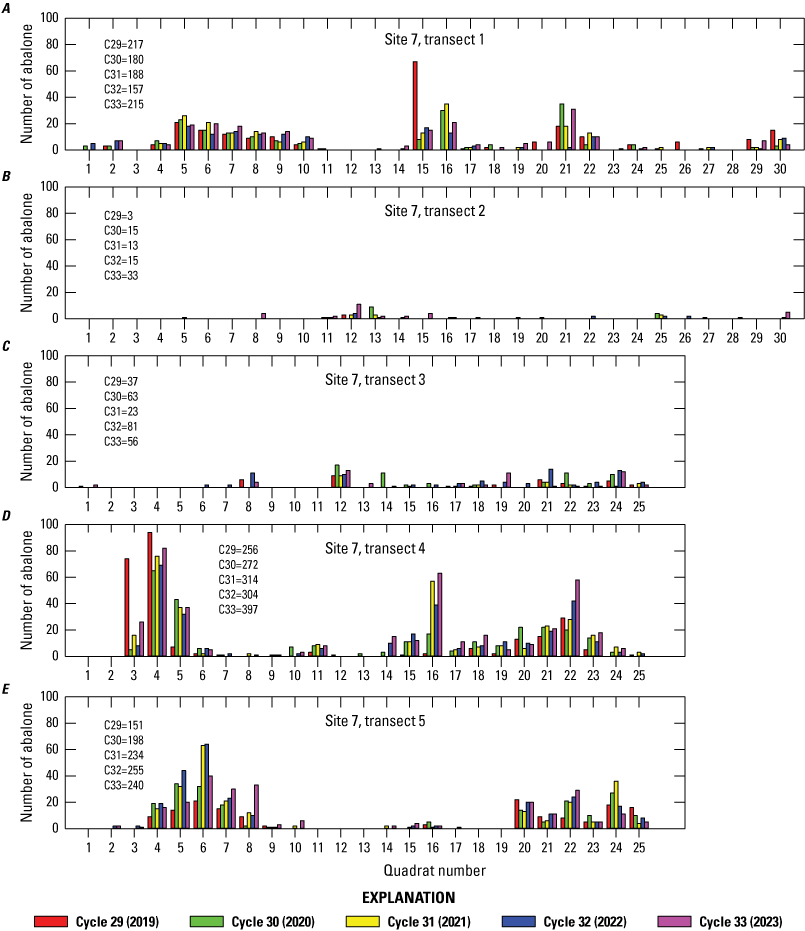
Distribution of black abalone (Haliotis cracherodii) along each transect at site 7, San Nicolas Island, California, 2019–23. The quadrat totals are for the left and right sides of the transect combined (2 square meters). The total transect count for each cycle is shown on the graph.
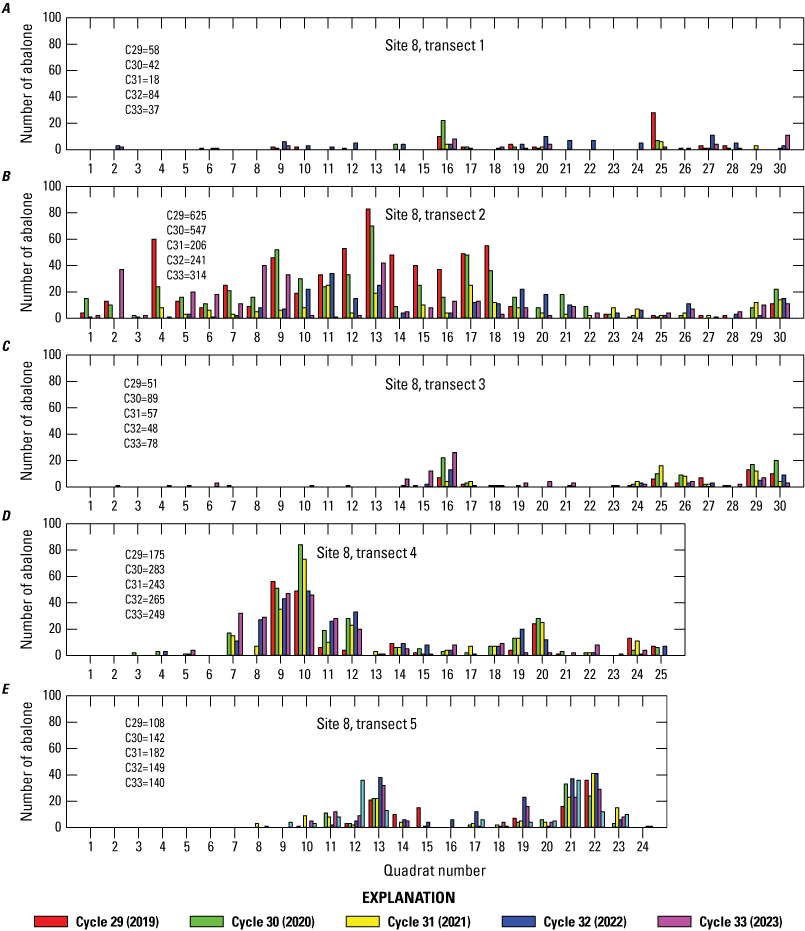
Distribution of black abalone (Haliotis cracherodii) along each transect at site 8, San Nicolas Island, California, 2019–23. The quadrat totals are for the left and right sides of the transect combined (2 square meters).The total transect count for each cycle is shown on graph.
In 2023, the highest 1-m2 quadrat count was 48 abalone compared to 57 in 2022 and 61 in 2021. The 2023 high quadrat count was the lowest since cycle 21 in 2011. However, of the 2,054 total 1-m2 quadrats, the number of quadrats having zero abalone decreased to 1,591 in 2023 from 1,627 in 2022, which was the lowest number of zero quadrats since cycle 9 in 1996. The decline in the number of zero count quadrats has been the trend over two decades, but the maximum quadrat count has declined across 2019–23, suggesting a recent trend toward a more even distribution of abalone, with more quadrats occupied at slightly lower maximum density. There was no change in the count in 1,504 quadrats (1,442 with no abalone and 62 with abalone), but the counts in 319 quadrats increased, and the counts decreased in 231 quadrats from 2022 to 2023. Eighty-four percent of those that changed did so by 5 abalone or fewer, but differences ranged from an increase of 42 abalone to a decrease of 28.
Abalone were most often observed in the crevice microhabitat (table 5). Between 1983, when microhabitat was first recorded, and 1993, an average 65.9 percent of counted abalone were in the crevice microhabitat category. In surveys completed between 2001 and 2023, after the WS induced population decline, the average rose above 95 percent. In 2023, 98.2 percent of abalone recorded were in the crevice microhabitat (table 5). Site 6, the site with the least amount of relief and complexity, had the highest percentage of non-crevice microhabitat use.
Table 5.
Number of black abalone (Haliotis cracherodii) in each microhabitat by site and transect, San Nicolas Island, California, 2023.The habitat quality classifications assigned in the field in 2022 showed that, at each site (table 6), the density of abalone was greater in good (overall mean = 3.51 abalone per m2) than in moderate habitat (overall mean = 0.52 abalone per m2), and greater in moderate than in poor habitat (overall mean = 0.19 abalone per m2; table 6), but there was considerable variation among sites within each habitat quality class.
Size Distribution and Recruitment
Before WS reached San Nicolas Island in the early 1990s, the size distribution of black abalone at the sampling sites was dominated by large adults (VanBlaricom, 1993). During 2001–23, the period after WS dramatically reduced the population, recruits, here defined as abalone less than or equal to 3 cm in shell length (fig. 10), became more common. This phenomenon, in concert with the dramatic reduction of the existing population, led to a change in the overall shape of the size distribution. Of the 3,971 abalone measured before 1994 (Kenner and Yee, 2025b), only 18 were in the recruit size class (0.45 percent), and over 96 percent were larger than 5 cm. All of the samples from a site contained less than 5-percent recruits.
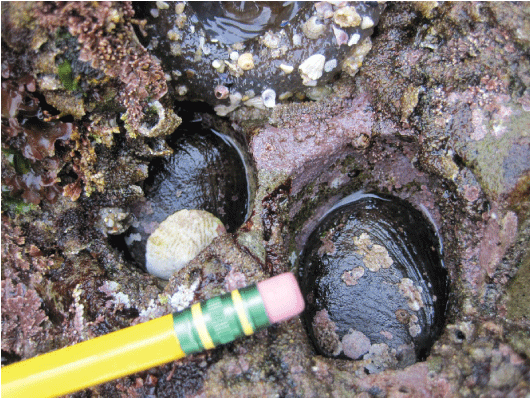
Two black abalone (Haliotis cracherodii) with shell length of approximately 2 centimeters (cm) in abandoned urchin cavities at site 5, San Nicolas Island, California. Photograph taken by M.C. Kenner, U.S. Geological Survey, January 2018.
Because densities were very high and abalone were stacked upon each other, juveniles and small recruits were more difficult to see, resulting in some bias in the length data from the pre-WS years. This bias likely changed over time as abalone became much less abundant and crowded. The potential for bias in the counts and measurements made at different sites and transects likely also varied because of local topography. The lack of recruits during these years contrasts with the size distributions after 2001 when the percentage of recruits among all the abalone counted only fell below 4 percent a few times, and in the samples after 2009, recruits often made up more than 10 percent of the total counted (table 7).
Table 7.
Number and percentage of measured black abalone (Haliotis cracherodii) at each site that were recruits (less than or equal 3 centimeters [cm]) for cycles 11–33 (2001–23) and total recruits for each cycle, San Nicolas Island, California.[Values in parentheses indicate percentage]
In 1988 (cycle 6), a size sample was acquired from all nine sites (Kenner and Yee, 2025b) and is used in this report for comparison with the more recent size structures (fig. 11). The size classes are much more evenly represented in later years, and several of the recent years were dominated by smaller size classes. All these samples show at least a few individuals in the recruitment size class. In their first year, recently settled abalone are thought to primarily inhabit cryptic habitat, such as Mytilus beds, or under boulders. As a result, individuals less than 2 or 3 cm likely are under-represented in size samples (VanBlaricom, 1993). The percentage of measured individuals that were less than or equal to 3 cm was as high as 25.4 percent in 2017. In 2022, there was a recruitment pulse of similar magnitude (21.7 percent), but 2023 was also a high recruitment year (17.2 percent).
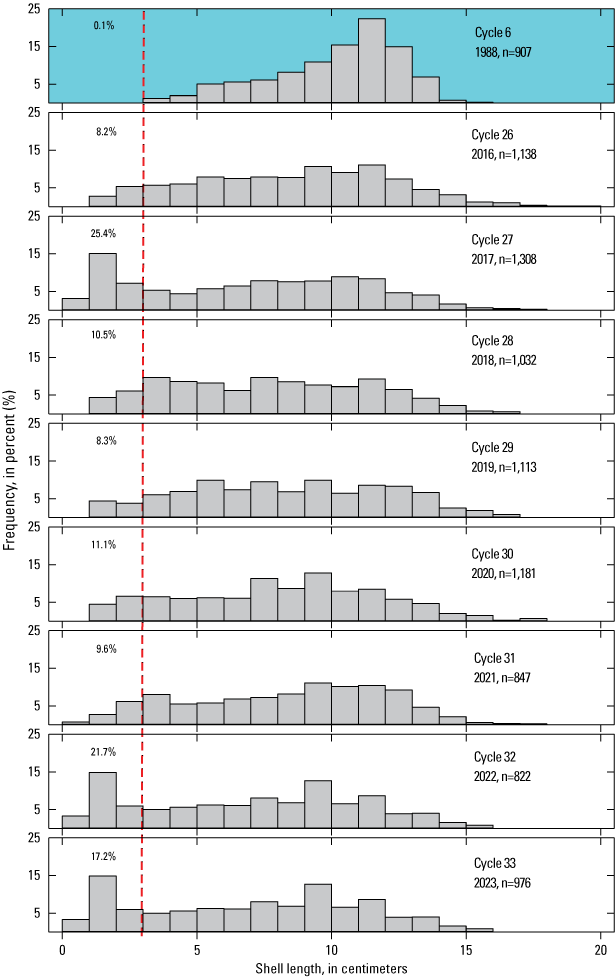
Whole island size distributions (total shell length in centimeters [cm]) of black abalone (Haliotis cracherodii) in 1988 (colored background) and 2016–23, San Nicolas Island, California. The total number of abalone measured in each cycle is indicated by n. Sizes to the left of the dashed red line are considered recruits, and the percentage of each sample in that category is indicated.
The percentage distribution of size classes (recruit, juvenile, small adult, and large adult, as defined in the “Methods” section) varied among the nine sites in 2023 (table 8). For example, sites 1 and 2 had similar distributions, in that most of the abalone were in the large adult size class, whereas site 5 had very few large individuals, and most were in the recruit class. Sites 4, 5, and 9 were dominated by small adults.
Table 8.
Percentage of black abalone (Haliotis cracherodii) at each site that were in each of the four size classes (either visually estimated or measured to nearest millimeter [mm]) at San Nicolas Island, California, 2023.[Definitions: recruit, less than or equal 3 centimeters (cm); juvenile, less than or equal 5 cm and greater than 3 cm; small adult, less than or equal 10 cm and greater than 5 cm; large adult, greater than 10 cm]
In 2022, both site 5 and site 8 had a substantial recruitment pulse, with 3-cm and smaller abalone making up over 40 percent of the animals whose shell lengths were measured (fig. 12). In 2023, this level of recruitment was observed again at site 5 but also at site 3. Eight of the nine sites had some measured individuals in the recruitment cohort in 2023 (table 7), but all sites had some individuals in the recruitment size class if visually estimated sizes are included (table 9). At sites 3, 5, and 8, recruits accounted for the largest proportion of individuals. Because of both accessibility problems and numbers of abalone surpassing the 200 measurements threshold, the inclusion of visually-estimated recruits makes a large difference at site 7 and particularly site 8 in terms of recruit numbers. These two sites generally had the most recruits after 2009 (tables 8, 9).
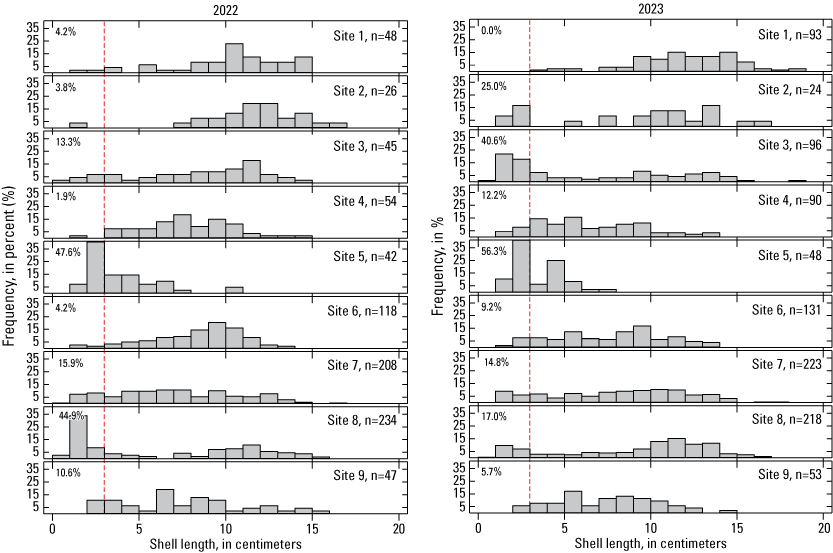
Size distribution (percentage frequency) of black abalone (Haliotis cracherodii) for each site in 2022 (left) and 2023 (right), San Nicolas Island, California. The total number of abalone measured in each cycle is indicated by n. Sizes to the left of the dashed red line are considered recruits, and the percentage of each sample in that category is indicated.
Table 9.
Number of black abalone (Haliotis cracherodii) at each site that were classified as recruits (measured or visually estimated shell length less than or equal 3 centimeters [cm]) at San Nicolas Island, California in 2019–23.[The far-right column shows the percentage of the total count for the cycle that was in the recruit size class. Before 2019, non-measured abalone were not estimated into size bins]
Even relatively large recruitment pulses may only temporarily raise population counts. Several recruitment pulses have been recorded on transect 1 at site 8 beginning in 2017 (fig. 13). By 2023, 325 measured recruits had been recorded on the transect, but the number of non-recruit size individuals declined from 14 to 7. On transect 2 at site 8, 265 measured recruits were recorded during the same period. The true number is much higher on this transect due to the inaccessibility of abalone in this crevice-rich transect, as evidenced by the 537 non-measured abalone that were classified as recruits since that protocol began in 2019. This finding means that at least 802 recruits were on this transect since 2017, but the total count on the transect fell from 476 to 314, of which only 111 were non-recruits (table 10). Some of the smaller recruit-class abalone likely were counted again the next year as larger recruits, but even several years of relatively high recruitment rates do not always result in local population growth.
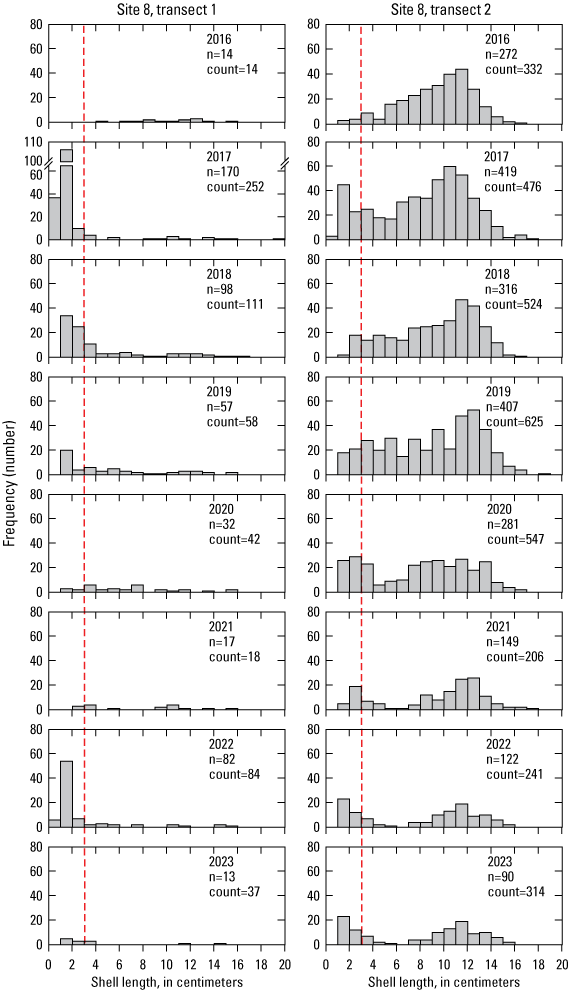
Recruitment pulse, as observed in the size distribution, of black abalone (Haliotis cracherodii), measured at site 8, transects 1 (left) and 2 (right), San Nicolas Island, California, 2016–23. Frequencies are presented here as numbers rather than percentage of sample size. Sizes to the left of the dashed red lines are considered recruits. Slashes indicate a broken vertical axis on the 2017 graph to accommodate the much greater number of recruits in that year's sample. Abbreviations: n, measured sample size; count, total count on transect
Nearest Neighbors
The mean nearest neighbor distance at San Nicolas Island has declined as the population density has increased since 2005 when consistent efforts first were made to measure this parameter (fig. 14). In addition, the percentage of each sample within 10 cm and within 100 cm of the nearest conspecific has increased. The trend for all three metrics has been toward closer proximity, but there was an uptick in the mean distance in 2022, and the percentage within 10 cm dropped by nearly 5 percent. It is not clear what caused this change in trajectory, but in 2023, the mean nearest neighbor distance was the smallest since measurements of this parameter began in 2005. We identified nearest neighbors regardless of size, but proximity of reproductive individuals should increase the probability of fertilized gametes from a given area (Blaud, 2013).
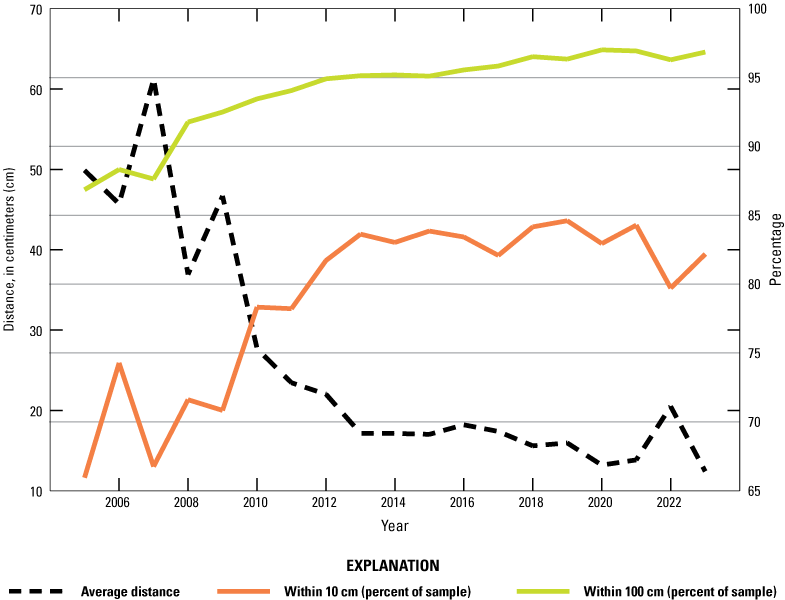
Mean nearest neighbor distance between black abalone (Haliotis cracherodii) and percentage of sample within 10 centimeters (cm) and within 100 cm of neighbor, San Nicolas Island, California, in 2005–23.
Sites 7 and 8, which dominate in terms of total abalone count, also drive the high numbers in close proximity (fig. 15A). These two sites contained 68.4 percent of the counted population, and 94.4 percent of these 1,759 abalone were within 10 cm of another black abalone (fig. 15B). In general, abalone at the other sites are more evenly spread among the bins, but the other sites still had a combined 68.1 percent of the counted abalone within 10 cm of another.
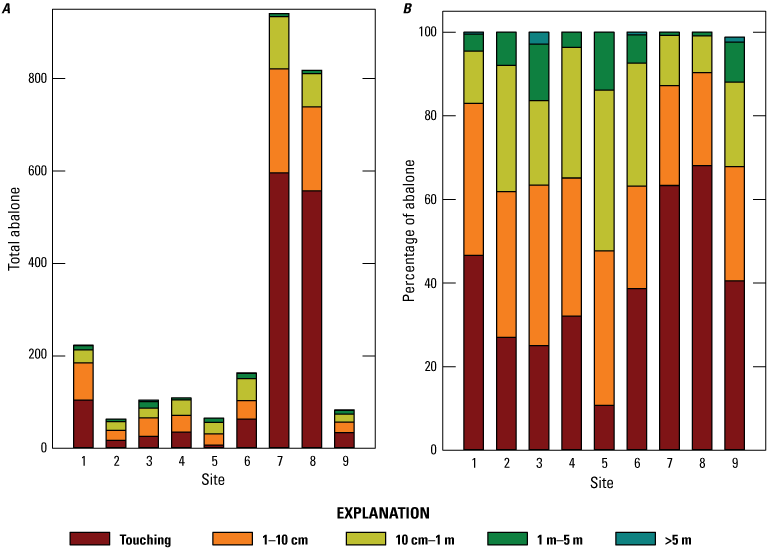
Nearest neighbor distance bins by site as A, frequency of bins showing total number of black abalone (Haliotis cracherodii) and B, percentage of black abalone, San Nicolas Island, California, 2023. Abbreviations: cm, centimeter; m, meter; >, greater than
Sedimentation
Sand cover measured by visual estimation in the quadrats did not follow any obvious trends, across sites or by transect (fig. 16). Although sand cover varied interannually and between transects, there was no evidence of temporal trends. There seems to be only weak synchrony in the sand cover among the transects; however, in 2016, sand cover appeared to peak on several of them. It should be noted that, for the one site where it is thought that sand burial caused mass mortality of abalone (decline recorded in winter 2016, site 3, transects 1 and 2), zero sand cover was recorded at the time. The sand cover there apparently was brief and catastrophic and could have resulted from a temporary change, observed in October 2015, in the size and shape of the sand spit on the east end of the island (Brian Hatfield, U.S. Geological Survey, written commun., 2015). The sand cover recorded on most transects in 2023 was lower than the previous year. An exception was transect 2 on site 1, but the increased cover there was primarily in higher intertidal quadrats where abalone are rare, and in fact, abalone counts increased on that transect. How sand cover affects abalone is likely to be a result of several factors, including depth of burial, duration of the event, and the availability of protruding rock refugia.
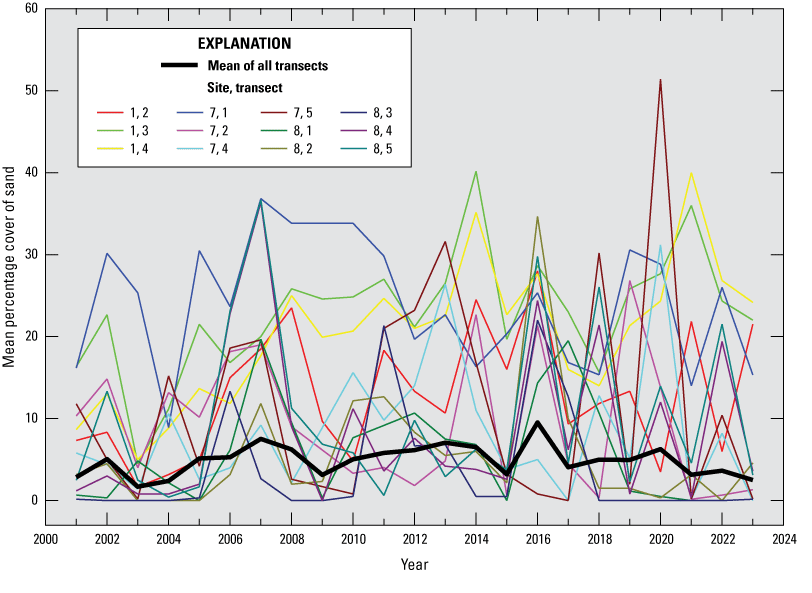
Mean percentage cover of sand on selected transects (those with generally higher sand cover), San Nicolas Island, California, 2001–23. Heavy black line shows total mean cover over time.
Conclusions
The total 2023 San Nicolas Island black abalone count of 2,570 for all sites combined was the highest since 1993. All sites yielded higher counts than in 2022, but most of the increase was a result of relatively large numbers of recruit-sized individuals.
Counts on site 8, transect 2, declined considerably in 2021. In prior years, it accounted for over 20 percent of the counted population and had double the counts of other high count transects. Although there was a sizeable recruitment on that transect in 2022 and 2023 (59 and 64.6 percent, respectively), the number of abalone greater than 3 cm continued to decline in 2022 and only rose slightly in 2023 (refer to non-recruits, in table 10) and the number of large adult abalone also continued to decline. Although declines of transect counts are not uncommon, the number of abalone lost on a single transect is noteworthy. It remains unclear what cause or causes are responsible.
The island-wide recruitment rate of 17.2 percent for measured abalone was the third highest detected since consistent measurements began in 2001. The rate calculated by including abalone with estimated size classes was even higher (25.2 percent, table 9) but cannot be compared with data from before 2019. These data indicate an influx of recruits with at least a few at every site and high numbers at sites 7 and 8. However, the lack of eventual population growth at two transects of site 8 (fig. 13) indicates that large recruitment events may not always result in population growth at an individual site. It is the nature of broadcast spawners to produce vastly more offspring than will survive. The recruit class that we track, the size bin of young that can be identified consistently in the field, has already survived a brief planktonic phase, settlement, and often, more than a year in the rocky intertidal, and most (based on observed shell color) have already transitioned their diet from microfilm to drift macroalgae before we count them (Leighton and Boolootian, 1963). These young often may succeed in microhabitats that are favorable for settlement and small abalone but not for adults due to microtopography, macroalgae drift supply and retention, or other factors. The fact that these transects all historically supported large adult populations suggests that they contain appropriate habitat, but they may have become dominated by competing species, such as purple urchins (S. purpuratus) or sandcastle worms (Phragmatopoma spp.), in the absence of a sizable abalone presence. Sandcastle worms, which often form large colonies with three-dimensional structure formed from hardened mucus and sand, can cover rock substrate and fill crevice space, potentially degrading good black abalone habitat. Alternatively, for long-lived species, such as abalone, it may take a succession of favorable years for recruiting cohorts to succeed in reaching the large size class.
Data from 2001 to 2023 show that a higher percentage of abalone inhabit crevice habitat than was the case before WS. The greater utilization of exposed microhabitats that was observed before WS was likely a result of crowding of the more preferred crevice habitats when the population size was at unnaturally high levels (National Marine Fisheries Service, 2020) because of the absence of sea otters and most human predation. Abalone in crevice habitat likely experience less extreme temperatures at low tide (Adams, 2007). Crevice habitat also may help protect abalone from dislodgement by wave born rocks and boulders (Shanks and Wright, 1986). Finally, crevices can provide a refuge from predators like sea otters (Lowry and Pearse, 1973). It is unclear if predation by sea otters is helping to shape the apparent microhabitat choice, but sites 6 and 4, the sites showing the lowest proportion of crevice use in recent years, are both relatively flat sites, suggesting that availability is an important factor in the microhabitat distribution.
The habitat quality classifications subjectively assigned in the field in 2022 continued to support the expected trend of higher abalone density with better habitat quality. At each site, the density of abalone was greatest in good habitat, less in moderate habitat, and much less in poor habitat, but there was considerable variation in relative densities among sites and within habitat quality classes (table 6).
Measurement of nearest neighbor distance showed that more than 95 percent of the monitored black abalone were within 1m of another abalone, and more than 80 percent were within 10 cm (fig. 14). The overall proportion of abalone that were closer than 1 m to another has shown a positive trend since first measured in 2005.
Although burial by sedimentation has occurred at San Nicolas Island sites in the past and can have devastating consequences for local populations (Glenn VanBlaricom, retired U.S. Geological Survey employee, written commun., 2020), there is no evidence that typical seasonal sand movement has an effect on black abalone density. However, more intense storms or changes in swell angle might cause future mortality from sand burial.
Our monitoring sites continue to indicate that the black abalone population on San Nicolas Island is on a trajectory toward recovery. San Nicolas Island is one of the few places within the species’ range where that is the case. Increasing numbers and densities of abalone as well as several successful recruitment events have been identified in the black abalone recovery plan (National Marine Fisheries Service, 2020) as important metrics for assessing recovery of black abalone populations. Continued monitoring of the San Nicolas Island populations will provide recovery dynamics data to the Black Abalone Recovery Team and resource managers.
References Cited
Blaud, B.M., 2013, Spatial and temporal patterns of fertilization in black abalone (Haliotis cracherodii Leach, 1814)—Analysis of surrogate gamete spawning experiments with application towards populations on San Nicolas Island: Seattle, Wash., University of Washington, Master’s thesis, 94 p. [Available at https://digital.lib.washington.edu/server/api/core/bitstreams/07aa837e-ea0e-4080-9bfe-d99c9396a49b/content.]
Boolootian, R.A., Farmanfarmaian, A., and Giese, A.C., 1962, On the reproductive cycle and breeding habits of two western species of Haliotis: The Biological Bulletin, v. 122, no. 2, p. 183–193, accessed December 15, 2025, at https://doi.org/10.2307/1539587.
California Department of Fish and Game, 2004, Annual status of the fisheries report through 2003—Report to the Fish and Game Commission as directed by the Marine Life Management Act of 1998. California Department of Fish and Game, Marine Region, [variously paged; 182 p.]. [Available at https://wildlife.ca.gov/Conservation/Marine/Status.]
Chambers, M.D., VanBlaricom, G.R., Hauser, L., Utter, F., and Friedman, C.S., 2006, Genetic structure of black abalone (Haliotis cracherodii) populations in the California islands and central California coast—Impacts of larval dispersal and decimation from withering syndrome: Journal of Experimental Marine Biology and Ecology, v. 331, no. 2, p. 173–185, accessed December 15, 2025, at https://doi.org/10.1016/j.jembe.2005.10.016.
Friedman, C.S., Wight, N., Crosson, L.M., VanBlaricom, G.R., and Lafferty, K.D., 2014, Reduced disease in black abalone following mass mortality—Phage therapy and natural selection: Frontiers in Microbiology, v. 5, article 78, 10 p., accessed December 15, 2025, at https://doi.org/10.3389/fmicb.2014.00078.
Haas, H., Braje, T.J., Edwards, M.S., Erlandson, J.M., and Whitaker, S.G., 2019, Black abalone (Haliotis cracherodii) population structure shifts through deep time—Management implications for southern California’s northern Channel Islands: Ecology and Evolution, v. 9, no. 8, p. 4720–4732, accessed December 15, 2025, at https://doi.org/10.1002/ece3.5075.
Hastie, T.J., and Pregibon, D., 1992, Generalized linear models, chap. 6 of Chambers, J.M., and Hastie, T.J., eds., Statistical models in S: Boca Raton, Fla., Chapman & Hall/CRC, p. 195–248, accessed June 20, 2025, at https://doi.org/10.1201/9780203738535.
Kenner, M.C., and Yee, J.L., 2022, Black abalone surveys at Naval Base Ventura County, San Nicolas Island, California—2021 annual report: U.S. Geological Survey Open-File Report 2022–1107, 34 p., accessed January 15, 2025, at https://doi.org/10.3133/ofr20221107.
Kenner, M.C., and Yee, J.L., 2025a, Black abalone (Haliotis cracherodii) population density, recruitment, size structure, and population growth at Naval Base Ventura County, San Nicolas Island, California, 2013–22: U.S. Geological Survey Open-File Report 2025–1015, 10 p., accessed June 20, 2025, at https://doi.org/10.3133/ofr20251015.
Kenner, M.C., and Yee , J.L., 2025b, Black abalone surveys at Naval Base Ventura County, San Nicolas Island, California—2022 annual report: U.S. Geological Survey Open-File Report 2025–1014, 34 p., accessed June 20, 2025, at https://doi.org/10.3133/ofr20251014.
Lafferty, K.D., and Kuris, A.M., 1993, Mass mortality of abalone Haliotis cracherodii on the California Channel Islands—Tests of epidemiological hypotheses: Marine Ecology Progress Series, v. 96, p. 239–248, accessed December 15, 2025, at https://doi.org/10.3354/meps096239.
Leighton, D., and Boolootian, R.A., 1963, Diet and growth in the Black Abalone, Haliotis cracherodii: Ecology, v. 44, no. 2, p. 227–238, accessed December 15, 2025, at https://doi.org/10.2307/1932170.
Lowry, L.F., and Pearse, J.S., 1973, Abalones and sea urchins in an area inhabited by sea otters: Marine Biology, v. 23, no. 3, p. 213–219, accessed December 15, 2025, at https://doi.org/10.1007/BF00389487.
Miner, C.M., Altstatt, J.M., Raimondi, P.T., and Minchinton, T.E., 2006, Recruitment failure and shifts in community structure following mass mortality limit recovery prospects of black abalone: Marine Ecology Progress Series, v. 327, p. 107–117, accessed December 15, 2025, at https://doi.org/10.3354/meps327107.
National Institutes of Health, 2026, Candidatus Xenohaliotis californiensis: National Institutes of Health web page, National Library of Medicine, National Center for Biotechnology Information, accessed April 29, 2026, at https://www.ncbi.nlm.nih.gov/taxonomy/?term=Xenohaliotis+californiensis.
National Marine Fisheries Service, 2020, Final endangered species act (ESA) recovery plan for Black Abalone (Haliotis cracherodii): Long Beach, Calif., National Oceanic and Atmospheric Administration, National Marine Fisheries Service, West Coast Region, 93 p., accessed December 15, 2025, at https://repository.library.noaa.gov/view/noaa/27415.
National Oceanic and Atmospheric Administration, 2009, Endangered and threatened wildlife and plants; endangered status for black abalone [final rule]: Federal Register, v. 74, no. 9, p. 1937–1946, accessed December 15, 2025, at https://www.federalregister.gov/documents/2009/01/14/E9-635/endangered-and-threatened-wildlife-and-plants-endangered-status-for-black-abalone.
National Oceanic and Atmospheric Administration, 2011, Endangered and threatened wildlife and plants—Final rulemaking to designate critical habitat for black abalone: Federal Register, v. 76, no. 208, p. 66806–66844, accessed December 15, 2025, at https://www.federalregister.gov/documents/2011/10/27/2011-27376/endangered-and-threatened-wildlife-and-plants-final-rulemaking-to-designate-critical-h abitat-for.
Neuman, M., Tissot, B., and Vanblaricom, G., 2010, Overall status and threats assessment of black abalone (Haliotis Cracherodii Leach, 1814) populations in California: Journal of Shellfish Research, v. 29, no. 3, p. 577–586, accessed December 15, 2025, at https://doi.org/10.2983/035.029.0305.
R Core Team, 2023, R—A language and environment for statistical computing: Vienna, Austria, R Foundation for Statistical Computing, accessed December 20, 2023, at https://www.R-project.org/.
Raimondi, P.T., Wilson, C.M., Ambrose, R.F., Engle, J.M., and Minchinton, T.E., 2002, Continued declines of black abalone along the coast of California—Are mass mortalities related to El Niño events?: Marine Ecology Progress Series, v. 242, p. 143–152, accessed December 15, 2025, at https://doi.org/10.3354/meps242143.
Rathbun, G.B., Hatfield, B.B., and Murphey, T.G., 2000, Status of translocated sea otters at San Nicolas Island, California: The Southwestern Naturalist, v. 45, no. 3, p. 322–328, accessed December 15, 2025, at https://doi.org/10.2307/3672835.
Rick, T.C., Vellanoweth, R.L., Erlandson, J.M., and Kennett, D.J., 2002, On the antiquity of the single-piece shell fishhook—AMS radiocarbon evidence from the southern California coast: Journal of Archaeological Science, v. 29, no. 9, p. 933–942, accessed December 15, 2025, at https://doi.org/10.1006/jasc.2001.0788.
Shanks, A.L., and Wright, W.G., 1986, Adding teeth to wave action—The destructive effects of wave-borne rocks on intertidal organisms: Oecologia, v. 69, no. 3, p. 420–428, accessed December 15, 2025, at https://doi.org/10.1007/BF00377065.
U.S. Navy, 2015, Integrated natural resources management plan for Naval Base Ventura County, San Nicolas Island, California—December 2010 [updated December 2015]: San Diego, Calif., Naval Base Ventura County, San Nicolas Island, Environmental Division and Naval Facilities Engineering Command, Southwest, 1,760 p.
VanBlaricom, G.R., 1993, Dynamics and distribution of black abalone populations at San Nicolas Island, California in Hochberg, F.G., ed., Third California Islands Symposium—Recent advances in research on the California Islands [Proceedings]: Santa Barbara, Calif., Santa Barbara Museum of Natural History, p. 323–334.
VanBlaricom, G.R., and Kenner, M.C., 2020, Dietary patterns in black abalone Haliotis cracherodii Leach, 1814 as indicated by observation of drift algal and seagrass capture at San Nicolas Island, California, USA, 1982 to 2019: Journal of Shellfish Research, v. 39, no. 1, p. 113–124, accessed December 15, 2025, at https://doi.org/10.2983/035.039.0111.
VanBlaricom, G., Neuman, M., Butler, J., DeVogelaere, A., Gustafson, R., Mobley, C., Richards, D., Rumsey, S., and Taylor, B.L., 2009, Status review report for black abalone (Haliotis cracherodii Leach, 1814): Long Beach, Calif., National Oceanic and Atmospheric Administration, National Marine Fisheries Service, 135 p., accessed December 15, 2025, at https://repository.library.noaa.gov/view/noaa/16216.
Watson, J., 2000, The effects of sea otters (Enhydra lutris) on abalone (Haliotis spp.) populations, in Campbell, A., ed., Workshop on Rebuilding Abalone Stocks in British Columbia, Nanaimo, British Columbia, Canada, February 23–26, 1999, [Proceedings]: Ottawa, National Research Council of Canada, Canadian Special Publication of Fisheries and Aquatic Sciences 130, p. 123–132. [Available at https://publications.gc.ca/collections/collection_2016/mpo-dfo/Fs41-31-130-eng.pdf.]
Webber, H.H., and Giese, A.C., 1969, Reproductive cycle and gametogenesis in the black abalone Haliotis cracheroidii (Gastropoda: Prosobranchiata): Marine Biology, v. 4, no. 2, p. 152–159, accessed December 15, 2025, at https://doi.org/10.1007/BF00347041.
Wood, S.N., 2017, General additive models—An introduction with R (2d ed.): Boca Raton, Fla., CRC Press, 496 p., accessed December 15, 2025, at https://doi.org/10.1201/9781315370279.
Appendix 1. Sites
Table 1.1.
Transect lengths, areas, and the number of quadrats in the three habitat quality classes at each of the nine black abalone (Haliotis cracherodii) monitoring sites, San Nicolas Island, California.[Most transects are 2 meters (m) wide. Those marked with an asterisk (*) are 1 m wide (refer to the “Methods” section). Good habitat contains deep cracks or crevices. Moderate habitat contains wide or shallow crevices or ridges. Poor habitat is flat or sandy (refer to the “Methods” section). Abbreviations: m, meter; m2, square meter; —, not applicable]
References Cited
Kenner, M.C., 2020, Black abalone surveys at Naval Base Ventura County, San Nicolas Island, California—2019, annual report: U.S. Geological Survey Open-File Report 2020–1047, 41 p., accessed December 20, 2023, at https://doi.org/10.3133/ofr20201047.
U.S. Navy, 2015, Integrated natural resources management plan for Naval Base Ventura County, San Nicolas Island, California—December 2010 [updated December 2015]: San Diego, Calif., Naval Base Ventura County, San Nicolas Island, Environmental Division and Naval Facilities Engineering Command, Southwest, 1,760 p.
For more information concerning the research in this report, contact the
Director, Western Ecological Research Center
U.S. Geological Survey
3020 State University Drive East
Sacramento, California 95819
https://www.usgs.gov/centers/werc
Publishing support provided by the USGS Science Publishing Network,
Sacramento Publishing Service Center
Disclaimers
Any use of trade, firm, or product names is for descriptive purposes only and does not imply endorsement by the U.S. Government.
Although this information product, for the most part, is in the public domain, it also may contain copyrighted materials as noted in the text. Permission to reproduce copyrighted items must be secured from the copyright owner.
Suggested Citation
Kenner, M.C., and Yee, J.L., 2026, Black abalone surveys at Naval Base Ventura County, San Nicolas Island, California—2023 annual report: U.S. Geological Survey Open- File Report 2026–1015, 39 p., https://doi.org/10.3133/ofr20261015.
ISSN: 2331-1258 (online)
Study Area
| Publication type | Report |
|---|---|
| Publication Subtype | USGS Numbered Series |
| Title | Black abalone surveys at Naval Base Ventura County, San Nicolas Island, California—2023 annual report |
| Series title | Open-File Report |
| Series number | 2026-1015 |
| DOI | 10.3133/ofr20261015 |
| Publication Date | June 03, 2026 |
| Year Published | 2026 |
| Language | English |
| Publisher | U.S. Geological Survey |
| Publisher location | Reston, VA |
| Contributing office(s) | Western Ecological Research Center |
| Description | viii, 39 p |
| Country | United States |
| State | California |
| Other Geospatial | Naval Base Ventura County, San Nicolas Island |
| Online Only (Y/N) | Y |
| Additional Online Files (Y/N) | N |