

Production of Mineral Commodities and Geospatial Map of the Mineral Industries and Related Infrastructure of China
Links
- Document: Pamphlet (1.38 MB pdf) , HTML , XML
- Sheet: Sheet (13.6 MB pdf)
- Data Release: USGS data release - Compilation of geospatial data (GIS) for the mineral industries and related infrastructure of the People's Republic of China
- Download citation as: RIS | Dublin Core
Abstract
As part of the U.S. Geological Survey’s (USGS) mission to distribute global mineral information and analyze supply chains, this study provides a comprehensive review of the global significance of China’s mineral production and capacity in 2023. Of 77 mineral commodities in the USGS dataset, China produced 74 and was the world’s first-ranked producer for 39 of the 74. Compared to the high share of global mineral production, including up to 98 percent of global gallium production, the country’s share of global mineral reserves was relatively small, ranging from 20 percent (zinc ore) to 52 percent (tungsten ore). China’s imports of metal ores, slag, and ash accounted for 64 percent of global imports of such commodities by value. The country’s exports of base metals and articles of base metal accounted for 17 percent of the global exports. To help nongeographic information system users assess the spatial distribution of mineral mines, processing facilities, and ports for trades in China, this study created a geospatial (also called “georeferenced”) portable document format (GeoPDF) map. In addition, the GeoPDF contains mineral resource tracts (such as antimony, copper, potash, coal, and oil and gas), exploration sites, and energy infrastructure based on the preexisting USGS data.
Introduction
The National Minerals Information Center (NMIC) of the United States Geological Survey (USGS) reports annual statistics for mineral commodities in about 180 countries and compiles information on the world’s mineral facilities. To understand the spatial characteristics of the worldwide mineral commodity supply chains, the NMIC has compiled geographic information system (GIS) geodatabases for the mineral industries and related infrastructure of Latin America and the Caribbean (Baker and other, 2017), Africa (Padilla and others, 2021), countries in Southwest Asia (Padilla and others, 2022) and in the Indo-Pacific (Trimmer and others, 2024), and China (Neustaedter and others, 2023).
The USGS Mineral Commodity Summaries (MCS) by the NMIC have provided the latest annual production and (or) reserves of 77 individual minerals by country. In 2023, China continued to be the dominant global mineral producer. Of 77 mineral commodities, China produced 74, and it was the world’s leading producer for 39 (including 25 metals and 14 industrial minerals) (table 1; U.S. Geological Survey, 2025b). The geodatabase for China, with updated information on major mines and mineral processing plants using Moon (2026), provides a dataset for a total of 932 mines and quarries (including oil and gas fields) and 1,506 mineral processing plants. These numbers reflected counting a facility more than once for producing multiple commodities; for example, if a mine produces copper and gold, the mine was listed under both copper and gold (table 2; Neustaedter and others, 2023).
Table 1.
Number of mineral commodities listed in the USGS Mineral Commodity Summaries and those commodities that China was the leading global producer in 2023.[Data from U.S. Geological Survey (2025b) and Moon (2026). MCS, mineral commodity summaries; USGS, U.S. Geological Survey]
Table 2.
Number of commodities produced at mineral facilities as listed in Neustaedter and others (2023) and updated with Moon (2026), and indication of critical minerals of China and the United States.[The number of critical minerals in common with both China and the United States [for example, "CN, U.S." in last column] is 16; the three aluminum commodities shown are considered one commodity. CN, China; U.S., United States; -, not applicable for critical minerals of China in 2016 or critical minerals of the United States in 2025]
Purpose and Scope
Considering the importance of China’s mineral industry to the global economy, this study reviewed the significance of China’s mineral production and summarized the country’s major mineral facilities as of 2023. To provide non-GIS users with insights into the spatial distribution of mineral facilities (including oil and gas) and ports for trade, this study also created a geospatial (also called “georeferenced”) portable document format (GeoPDF) map using the GIS-based geodatabase by Neustaedter and others (2023). The GeoPDF also contains mineral resource tracts (such as antimony, copper, potash, coal, and oil and gas), mineral exploration sites, and energy infrastructure. This effort reflects USGS’s ongoing mission of analyzing the contribution of an individual country to the mineral industry and global commodity supply chains and providing the spatial distribution of global mineral resources and mineral facilities.
China’s Economy
China’s economic growth in the past two decades, driven largely by investment in manufacturing and exports of goods, resulted in large increases in China’s production of, and demand for, mineral commodities (Xun, 2022; Ministry of Commerce of the People’s Republic of China, 2024). As a result, China had become the world’s leading producer and consumer of numerous mineral commodities. Beginning with the economic slowdown that started late 2012, the country’s economic development had been, and was continuing to be, increasingly consumption driven (International Monetary Fund, 2025). China’s manufacturing sector, however, still accounted for about 25 percent of the gross domestic product (GDP) in 2024 (National Bureau of Statistics of China, 2025b), which is notably higher than the percentage for the world’s major economies by GDP, such as Germany and Japan (19 percent each), India (13 percent), and the United States (11 percent) in 2023 (Our World in Data, 2025).
Mineral Industry
After the implementation of the National Mineral Resources Plan (2008 to 2015) of China, the domestic reserves of major metal minerals, such as copper-gold, lead-zinc, molybdenum, and tungsten, have continued to increase. The outputs of minerals have substantially increased as well (National Development and Reform Commission of the People’s Republic of China, 2017). The large and growing industrial base was helping keep downstream demand strong and supporting the mineral industry’s move to expand capacity. The mineral industry (except for oil and gas extraction) has nonetheless been faced with some challenges, such as underutilization of production capacity, slow growth in demand, depletion of high-quality resources, and stricter environmental regulations (Xun, 2022; Moon, 2026).
In 2024, China’s capacity utilization rate of the smelting and pressing of nonferrous metals was 79 percent; the smelting and pressing of ferrous metals, 78 percent; the mining industry, 75 percent; and the manufacturing of nonmetallic mineral products, 62 percent (National Bureau of Statistics of China, 2025a). These low utilization rates indicate the existence of overcapacity relative to domestic and global demands. It also implies that these facilities operating at low utilization rates could ramp up production to full capacity in the short term and export excess output to oversupply the global market, driving down global prices and undermining sustainability of foreign competitors (Alonso and others, 2025). For example, more than 800 million metric tons per year (Mt/yr) of raw steel capacity came online in China between 2000 and 2015. The production by China has been about equal to or greater than the total of the rest of the world since 2013. The overstock by China resulted in record low steel prices and consequently led to the decreased utilization rates of foreign steelmakers (Shambaugh, 2024).
Export Measures and Mineral Production
Table 3 highlights mineral production, reserves, and annual production capacity for 39 mineral commodities, for which China was the world’s leading producer in 2023 (U.S. Geological Survey, 2025b; Moon, 2026). These 39 mineral commodities include all mineral commodities and related products and (or) technologies that China has implemented export controls on since 2023. These minerals are antimony, bismuth, gallium, germanium, graphite, indium, magnesium, molybdenum, rare earths, tellurium, and tungsten (table 3; Ministry of Commerce of the People’s Republic of China, 2025a, b). Because China holds a majority share of global production, any instances of export or production restriction of these commodities by China could cause a considerable supply chain disruption.
For 15 of the 39 mineral commodities, China accounted for more than 65 percent of global production. These included, in order of China’s share, gallium (primary refined, 98 percent), magnesium (metal, 89 percent), mercury (mined, 88 percent), silicon (metal, 85 percent), tungsten (mined, 83 percent), bismuth (refined, 82 percent), graphite (natural, 79 percent), germanium (refined, 77 percent), tellurium (refined, 77 percent), wollastonite (76 percent), lime (73 percent), titanium (sponge metal, 69 percent), indium (refined, 68 percent), rare earths (mined, 68 percent), and vanadium (mined, 67 percent).
Production Capacity and Reserves
China’s shares of global annual production capacity were estimated to range from 45 percent (abrasives, silicon carbide) to 91 percent (primary, refined gallium) (table 3). Some production capacity data on alumina, raw steel, and refined copper that were not available for 2023 are estimated based on prior-year data (Flanagan, 2024; Organisation for Economic Co-operation and Development, 2024; Merrill, 2025). China has implemented new capacity management policies in raw materials industry in recent years, including restrictions on new capacity for certain minerals, capacity replacement (allowing new, efficient capacity to replace old, outdated capacity), reinforcement of a capacity ceiling for certain minerals, and abolition of inefficient capacity (Ministry of Industry and Information Technology of China, 2021). An example is the capacity ceiling for primary aluminum, which was established in 2017 to be 45 Mt/yr and has been kept at this level as of 2024 (China Nonferrous Metals News, 2025).
Compared with production and production capacity, China’s share of global mineral reserves was relatively small, ranging from 20 percent (zinc, mined) to 52 percent (tungsten, mined) (table 3). The smaller shares were in line with the fact that China has lower reserves-to-production (R/P) ratios (in years) for some minerals compared with those of other mineral-rich countries. For example, the R/P ratio of gold in China was 8 years as of 2023, whereas those in Russia and South Africa were 38 and 48 years, respectively. Russia and South Africa held more gold reserves but produced less mined gold compared with China in 2023 (U.S. Geological Survey, 2024, 2025b). The low R/P ratio indicates that the mining activities have outpaced the discovery of new mineral resources in the country.
Table 3.
Mineral production, reserves, and annual production capacity for which China was the world’s first-ranked producer in 2023.[Data from Flanagan (2024), Organisation for Economic Co-operation and Development (2024), U.S. Geological Survey (2024, 2025b), Merrill (2025), and Moon (2026). NA, not applicable for commodity refined at a mineral facility; n.r., not reported; <, less than; %, percent]
This study assumed global germanium production in 2023 was 200 metric tons based on global production in 2020 (the latest year for which data were available) (U.S. Geological Survey, 2021).
Mineral Trade
In 2023, China maintained its position as the world’s leading producer and importer of numerous mineral commodities as well as the world’s leading manufacturer and exporter. The country’s imports of metal ores, slag, and ash were valued at $239 billion, which accounted for 64 percent of global imports of such commodities by value. The country’s exports of base metals and articles of base metal were valued at $268 billion, accounting 17 percent of the global exports (U.S. Geological Survey, 2025b; Zen Innovations AG, 2025).
Of the 39 mineral commodities, for which China was the world’s leading producer in 2023, China’s mineral exports of 11 of these accounted for more than 30 percent (about one-third) of total global exports by value (table 4; Zen Innovations AG, 2025). These included, in order of China’s share of total global exports, gallium (metal, 68 percent), magnesium (metal, 68 percent), abrasives (fused aluminum oxide, 63 percent), graphite (natural, 58 percent), bismuth (metal, alloys, and scrap, 44 percent), abrasives (silicon carbide, 43 percent), germanium (metal, 41 percent), indium (metal, 41 percent), magnesium (compounds, 37 percent), antimony (metal and oxide, 35 percent), and molybdenum (metal, 32 percent).
China’s shares of global exports (table 4) are lower than China’s shares of global production (table 3), which indicates that the production was mostly (and unproportionally) consumed by domestic downstream markets. It is likely a considerable amount of the consumption of the mineral materials (from domestic supply and imports) were also exported as embedded components in downstream manufactured products, although the magnitude is not straightforward to quantify (McCaffrey and others, 2023; Renaud and others, 2023). For example, China’s exports of high-tech products, which is the main consumption sector for critical minerals, amounted to about $875 billion (6,279.2 billion Chinese Yuan) in 2024, accounting for 25 percent of the country’s total export of goods (National Bureau of Statistics of China, 2025c).
Table 4.
China's share of global exports and of U.S. apparent consumption averaged in 2020–2023.[Trade codes of commodities are detailed in U.S. Geological Survey (2025b). FeV, ferrovanadium; NA, not applicable; U.S., United States; V2O5, vanadium pentoxide; >, greater than; <, less than; %, percent]
U.S. Mineral Reliance
Of 39 mineral commodities, for which China was the world’s leading producer in 2023, imports of 6 commodities from China accounted for more than 30 percent (about one-third) of U.S. apparent consumption. These included, in order of China’s share, rare earths (compounds and metals, 67 percent), bismuth (metal, alloys, and scrap, 63 percent), abrasives (silicon carbide, 63 percent), abrasives (fused aluminum oxide, 60 percent), antimony (metal and oxide, 53 percent), and graphite (43 percent). Higher shares indicate that U.S. consumption is more dependent on China’s supplies (table 4; U.S. Geological Survey, 2025b; Zen Innovations AG, 2025; Moon, 2026).
Critical Minerals of China and the United States
In 2016, the Government of China released a list of 24 critical (called “strategic”) minerals for the country. Critical minerals refer to minerals (elements and deposits) that have no substitutes and are key materials in high-tech industries, such as new materials, new energy, next generation information technology, artificial intelligence, biotechnology, advanced equipment manufacturing, and national defense and military industries (table 2; Ministry of Land and Resources, 2016).
For the United States, according to the Energy Act of 2020 (Public Law 116–260), critical minerals are defined as a nonfuel mineral or mineral material essential to the economic or national security of the United States and which has a supply chain vulnerable to disruption. Critical minerals are also characterized as serving an essential function in the manufacturing of a product, the absence of which would have significant consequences for the economy or national security. The most recent list of the U.S. critical minerals published in 2025 contains 60 minerals (including individual rare earth elements and platinum-group metals) (U.S. Geological Survey, 2025a). Of these 60 critical minerals, 16 are also found in China’s list, including rare earths, tungsten, potash, aluminum, and antimony, which are the top 5 minerals in order of risk ranking (U.S. Geological Survey, 2025a); these 16 overlapping minerals are shown in table 2.
Mineral Facilities
Table 5 shows China’s largest (up to the top 4) mineral facility operators by annual production capacity and location (latitude and longitude) for which China was the world’s leading producer for mineral commodities in the mining and processing stages as of 2023. Namely, China was the world’s leading alumina and aluminum producer and the world’s third bauxite producer. Table 5 shows the locations of major bauxite mines, alumina refineries, and aluminum smelters, providing data for future analyses of spatial proximity of these facilities and mapping domestic logistics and supply chains. Commonly, a mine and a smelter (or a refinery) may produce multiple metals during the mining and processing of ore concentrates. For example, gold is produced as a coproduct with copper mine production; gallium, as a byproduct from bauxite and zinc; and indium, as a byproduct from zinc concentrate (Nassar and Fortier, 2021). The data of these mineral facilities were collected and reproduced from USGS publications (Neustaedter and others, 2023; Moon, 2026).
Table 5.
Major mines and mineral processing plants for mineral commodities listed in table 3.[Data from U.S. Geological Survey (Neustaedter and others, 2023; Moon, 2026). Annual capacity is in thousand metric tons unless otherwise specified. Latitude and longitude are in decimal degrees. Au, gold; Corp., Corporation; Cu, copper; Hg, mercury; Mo, molybdenum; NA, not available; Pb, lead; Sb, antimony; Sn, tin; WGS 84, World Geodetic System of 1984; Zn, zinc]
Listed by province or autonomous region, followed by locality. Only headquarter locations are provided for some companies that have numerous facilities throughout the country.
Some locations have different official translations; for example, “Nei Mongol” is also known as “Inner Mongolia,” and “Xizang” is also known as “Tibet.”
Facility added in this study based on Moon (2026).
As shown in table 5, Yunnan is one of the country’s major mineral industry provinces by the number of major mineral facilities. The province held the country’s major mines of bauxite, lead-zinc, phosphate rock, and tin, and processing plants of lead and tin. Other provinces with major mineral facilities include Henan, Hunan, Jiangxi, Shandong, and Sichuan. For rare earths, Nei Mongol is the province with the country’s largest mine and smelter.
Geospatial PDF Map and Feature Datasets
One of the goals of this study is to create a GeoPDF of the geodatabase from Neustaedter and others (2023) with updated major mineral facilities using Moon (2026). Updated feature attributes in the mineral facilities feature class from the original geodatabase included annual production capacity, capacity notes, commodity, facility name, major operating company, and (or) operating status as well as the addition of 21 new entries. The GeoPDF map presents data on mineral facilities, exploration sites, and permissive tracts for mineral resource assessment of antimony, coal, copper, phosphate, and potash. The permissive tracts refer to the geologic environments of formation that were described in the deposit model; that is, the tracts will contain all the undiscovered deposits postulated in the assessment. Base cartographic elements from Natural Earth (2025) were also incorporated on the GeoPDF map to represent political and physical features in the study area and to aid in visual interpretation.
Figure 1 presents a screenshot of the GeoPDF map showing the locations of zinc mines and smelters (mineral processing plants), of which the major facilities were listed in table 5. Zinc is classified as critical by the United States and is a host commodity of other critical minerals, such as gallium, germanium, indium, and tellurium (U.S. Geological Survey, 2025a).
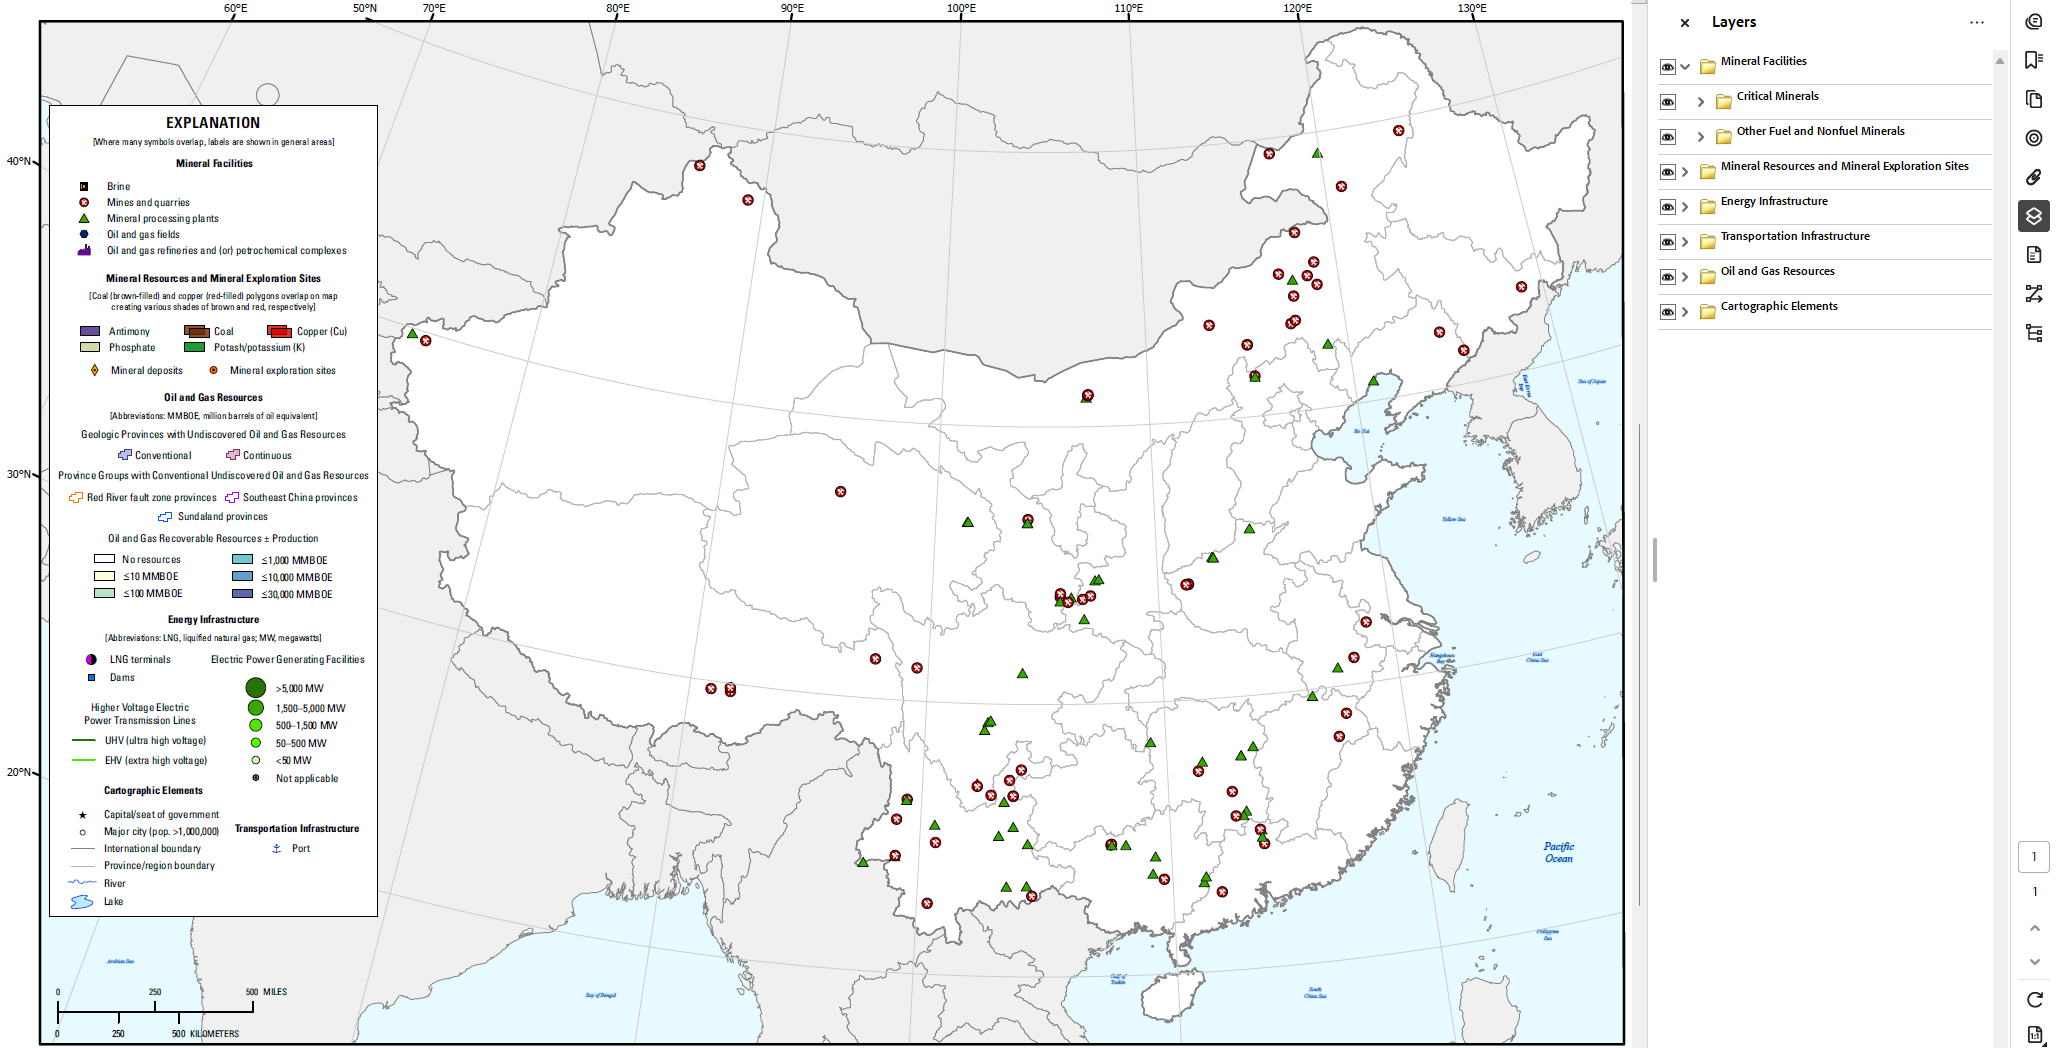
Screenshot of the GeoPDF map showing the locations of zinc mines (red circles) and smelters (mineral processing plants, green triangles) in China. Information on the major mineral facilities is detailed in table 5.
Table 6 summarizes the feature datasets organized as folders in the GeoPDF, which contain individual selectable map layers, and lists the subset of feature attributes that are viewable on the map. The updated mineral facilities feature class contains the location of 932 mines and quarries and 1,506 processing plants across China (table 2). To aid in the visual interpretation of the mineral facilities feature class, it was divided by commodity into separate map layers, which were grouped into subfolders in the mineral facilities feature dataset called “Critical Minerals” of the United States and “Other Fuel and Nonfuel Minerals” (see “Layers” on GeoPDF map). Additionally, the electric power generating facilities feature class was divided by capacity classification into separate map layers to aid in visual interpretation. All other feature classes from the original geodatabase were included on the GeoPDF map as a single layer. The original full dataset as well as comprehensive metadata containing detailed definitions for all user-defined attribute data and documentation of all data sources are available via the accompanying USGS data release (Neustaedter and others, 2023). Instructions on how to view the layers and attribute data are included on the GeoPDF map. Additional information and instructions for navigating the layers of the GeoPDF map as well as accessing the attribute data can be found in Baker and others (2017) and TerraGo Technologies Inc. (2025a, b).
Table 6.
GeoPDF feature datasets, map layers, and feature attributes.[ID, identification; LNG, liquefied natural gas; NA, not applicable; USGS, U.S. Geological Survey]
Critical materials of the United States (U.S. Geological Survey, 2025a).
Map layers from Natural Earth (2025).
Acknowledgments
We express our appreciation to the scientists and economists of the National Minerals Information Center (U.S. Geological Survey) for compiling and analyzing global mineral production and reserves data. Special thanks are extended to Amanda S. Brioche and Dalton M. McCaffrey (U.S. Geological Survey) for their reviews that improved the original manuscript. The authors wish to acknowledge David A. Shields (U.S. Geological Survey) for editing the manuscript.
References Cited
Alonso, E., Brioche, A.S., Schulte, R.F., Trimmer, L.M., Kim, J.-E., Gulley, A.L., and Pineault, D.G., 2025, World minerals outlook—Cobalt, gallium, helium, lithium, magnesium, palladium, platinum, and titanium through 2029 (ver. 1.1, March 14, 2025): U.S. Geological Survey Scientific Investigations Report 2025–5021, 19 p., accessed August 8, 2025, at https://doi.org/10.3133/sir20255021.
Baker, M.S., Buteyn, S.D., Freeman, P.A., Trippi, M.H., and Trimmer, L.M., III, 2017, Compilation of geospatial data for the mineral industries and related infrastructure of Latin America and the Caribbean: U.S. Geological Survey Open-File Report 2017–1079, 87 p., 1 geodatabase and 1 geospatial PDF map, accessed March 18, 2025, at https://doi.org/10.3133/ofr20171079.
China Nonferrous Metals News, 2025, Q&A transcript of the press conference on the economic operation of China's nonferrous metals industry in 2024: China Nonferrous Metals News web page, accessed August 11, 2025, at https://www.cnmn.com.cn/ShowNews1.aspx?id=458073.
Flanagan, D.M., 2024, Copper, in Metals and minerals: U.S. Geological Survey Minerals Yearbook 2020, v. 1, p. 20.1–20.32, accessed August 5, 2025, at https://pubs.usgs.gov/myb/vol1/2020/myb1-2020-copper.pdf.
International Monetary Fund, 2025, China, People's Republic—Datasets: International Monetary Fund web page, accessed September 4, 2025, at https://www.imf.org/external/datamapper/profile/CHN.
McCaffrey, D.M., Nassar, N.T., Jowitt, S.M., Padilla, A.J., and Bird, L.R., 2023, Embedded critical material flow—The case of niobium, the United States, and China: Resources, Conservation and Recycling, v. 188, no. 106698, 14 p., accessed September 5, 2025, at https://doi.org/10.1016/j.resconrec.2022.106698.
Merrill, A.M., 2025, Bauxite and alumina [advance release], in Metals and minerals: U.S. Geological Survey Minerals Yearbook 2021, v. 1, p. 10.1–10.13, accessed August 5, 2025, at https://pubs.usgs.gov/myb/vol1/2021/myb1-2021-bauxite-alumina.pdf.
Ministry of Commerce of the People’s Republic of China, 2024, Development opportunities: Ministry of Commerce, People’s Republic of China web page, accessed September 3, 2025, at https://fdi.mofcom.gov.cn/EN/come-newzonghe.html?parentId=164&name=Development%20Opportunities&comeID=2.
Ministry of Commerce of the People’s Republic of China, 2025a, Announcement No.18 of 2025 of the Ministry of Commerce and the General Administration of Customs of the People’s Republic of China announcing the decision to implement export control on some medium and heavy rare earth related items: Ministry of Commerce, People’s Republic of China web page, accessed August 8, 2025, at https://english.mofcom.gov.cn/Policies/AnnouncementsOrders/art/2025/art_0dd87cbee7b045bf93fabe6ab2faceee.html.
Ministry of Commerce of the People’s Republic of China, 2025b, China export control information network—Policies and regulations: Ministry of Commerce, People’s Republic of China web page, accessed August 8, 2025, at https://exportcontrol.mofcom.gov.cn/zcfgList.shtml.
Ministry of Industry and Information Technology of China, 2021, The 14th 5-year plan for the development of the raw materials industry: Ministry of Industry and Information Technology of China, no. 212, 26 p., accessed August 11, 2025, at https://www.gov.cn/zhengce/zhengceku/2021-12/29/5665166/files/90c1c79a00b44c67b59c29392476c862.pdf.
Ministry of Land and Resources, 2016, National mineral resources planning (2016–2020): National Development and Reform Commission, People’s Republic of China web page, accessed March 10, 2026, at https://www.ndrc.gov.cn/fggz/fzzlgh/gjjzxgh/201705/t20170511_1196755.html.
Moon, J.W., 2026, China [advance release], in Area reports—International—Asia and the Pacific: U.S. Geological Survey Minerals Yearbook 2023, v. III, p. 9.1–9.42, accessed March 6, 2026, at https://pubs.usgs.gov/myb/vol3/2023/myb3-2023-china.pdf.
Nassar, N.T., and Fortier, S.M., 2021, Methodology and technical input for the 2021 review and revision of the U.S. Critical Minerals List: U.S. Geological Survey Open-File Report 2021–1045, 31 p., accessed March 18, 2025, at https://pubs.usgs.gov/publication/ofr20211045.
National Bureau of Statistics of China, 2025a, Industrial capacity utilization rate in the fourth quarter of 2024: National Bureau of Statistics of China web page, accessed August 8, 2025, at https://www.stats.gov.cn/english/PressRelease/202501/t20250124_1958442.html.
National Bureau of Statistics of China, 2025b, Preliminary accounting results of GDP for the fourth quarter and full year of 2024: National Bureau of Statistics of China web page, accessed August 8, 2025, at https://www.stats.gov.cn/english/PressRelease/202502/t20250207_1958578.html.
National Bureau of Statistics of China, 2025c, Statistical communiqué of the People's Republic of China on the 2024 national economic and social development: National Bureau of Statistics of China web page, accessed August 11, 2025, at https://www.stats.gov.cn/english/PressRelease/202502/t20250228_1958822.html.
National Development and Reform Commission of the People’s Republic of China, 2017, National mineral resources planning (2016–2020): National Development and Reform Commission, People’s Republic of China web page, accessed March 18, 2025, at https://www.ndrc.gov.cn/fggz/fzzlgh/gjjzxgh/201705/t20170511_1196755.html.
Natural Earth, 2025, Downloads—Natural Earth raster + vector map data: Natural Earth web page, accessed January 25, 2025, at https://www.naturalearthdata.com/downloads/ and https://naciscdn.org/naturalearth/packages/natural_earth_vector.zip.
Neustaedter, E.R., Buteyn, S.D., Moon, J.W., Trimmer, L.M., Padilla, A.J., Wolfe, E.R., Fierro, E., Freeman, P.A., Trippi, M.H., DeCarlo, K., Kemna, R.F., Renaud, K.M., Agyepong, L., Jafari, Z., Otarod, D., Dicken, C., and Hammarstrom, J., 2023, Compilation of geospatial data (GIS) for the mineral industries and related infrastructure of the People's Republic of China: U.S. Geological Survey data release, accessed March 18, 2025, at https://doi.org/10.5066/P9HK2K8I.
Organisation for Economic Co-operation and Development, 2024, Latest developments in steelmaking capacity and outlook until 2026: Organisation for Economic Co-operation and Development report [DSTI/SC(2024)3/FINAL], 61 p., accessed August 8, 2025, at https://one.oecd.org/document/DSTI/SC(2024)3/FINAL/en/pdf.
Our World in Data, 2025, Share of manufacturing in gross domestic product (GDP): Our World in Data web page, accessed August 8, 2025, at https://ourworldindata.org/grapher/manufacturing-value-added-to-gdp?time=latest.
Padilla, A.J., Otarod, D., Deloach-Overton, S.W., Kemna, R.F., Freeman, P.A., Wolfe, E.R., Bird, L.R., Gulley, A.L., Trippi, M.H., Dicken, C.L., Hammarstrom, J.M., and Brioche, A.S., 2021, Compilation of geospatial data (GIS) for the mineral industries and related infrastructure of Africa: U.S. Geological Survey data release, accessed March 18, 2025, at https://doi.org/10.5066/P97EQWXP.
Padilla, A.J., Buteyn, S.D., Neustaedter, E.R., Otarod, D., Wolfe, E.R., Freeman, P.A., Trippi, M.H., Kemna, R.F., Trimmer, L.M., Renaud, K., Szczesniak, P.A., Moon, J.W., Chung, J., Dicken, C.L., and Hammarstrom, J.M., 2022, Compilation of geospatial data (GIS) for the mineral industries and related infrastructure of select countries in southwest Asia: U.S. Geological Survey data release, accessed March 18, 2025, at https://doi.org/10.5066/P9OCRYYO.
Renaud, K.M., Manley, R., and Nassar, N.T., 2023, A comparison of copper use in China and India as a proxy for their economic development: Resources Policy, v. 80, no. 103195, 13 p., accessed August 8, 2025, at https://www.sciencedirect.com/science/article/pii/S0301420722006389?via%3Dihub.
Shambaugh, J., 2024, Remarks by Under Secretary for International Affairs Jay Shambaugh on Chinese overcapacity and the global economy: U.S. Department of the Treasury press release, July 10, 2024, accessed September 4, 2025, at https://home.treasury.gov/news/press-releases/jy2455.
TerraGo Technologies Inc., 2025a, GeoPDF toolbar—Collaborate with GeoPDF maps & mapbooks: TerraGo Technologies Inc. web page, accessed March 10, 2026, at https://terragotech.com/geopdf/toolbar/.
TerraGo Technologies Inc., 2025b, GeoPDF toolbar—Getting started with GeoPDF toolbar: TerraGo Technologies Inc. web page, accessed March 6, 2025, at https://support.terragotech.com/hc/en-us/categories/360004388494-GeoPDFToolbar.
Trimmer, L.M., Neustaedter, E.R., Chung, J., DeCarlo, K., Moon, J.W., Fierro, E., Jafari, Z., Agyepong, L., Wolfe, E.R., Padilla, A.J., Freeman, P.A., Trippi, M.H., Dicken, C.L., Hammarstrom, J.M., Berina, J.P., and Foeppel, J., 2024, Compilation of geospatial data (GIS) for the mineral industries of select countries in the Indo-Pacific: U.S. Geological Survey data release, accessed March 18, 2025, at https://doi.org/10.5066/P13YRCDU.
U.S. Geological Survey, 2021, Mineral commodity summaries 2021: U.S. Geological Survey, 200 p., accessed March 10, 2026, at https://doi.org/10.3133/mcs2021.
U.S. Geological Survey, 2024, Mineral commodity summaries 2024: U.S. Geological Survey, 212 p., accessed March 10, 2026, at https://doi.org/10.3133/mcs2024.
U.S. Geological Survey, 2025a, Final 2025 list of critical minerals: Federal Register, v. 90, no. 214, p. 50494–50497, accessed November 14, 2025, at https://www.govinfo.gov/content/pkg/FR-2025-11-07/pdf/2025-19813.pdf.
U.S. Geological Survey, 2025b, Mineral commodity summaries 2025 (ver. 1.2, March 2025): U.S. Geological Survey, 212 p., accessed March 10, 2026, at https://doi.org/10.3133/mcs2025.
Xun, S., 2022, The mineral industry of China [advance release], in Area reports—International—Asia and the Pacific: U.S. Geological Survey Minerals Yearbook 2019, v. 3, p. 9.1–9.34, accessed July 29, 2025, at https://pubs.usgs.gov/myb/vol3/2019/myb3-2019-china.pdf.
Zen Innovations AG, 2025, Global trade tracker: Bern-Kehrsatz, Switzerland, Zen Innovations AG database, accessed March 18, 2025, at https://www.globaltradetracker.com.
Conversion Factors
International System of Units to U.S. customary units
U.S. customary units to International System of Units
Abbreviations
$
U.S. dollars
GDP
gross domestic product
GeoPDF
geospatial (or georeferenced) portable document format
GIS
geographic information system
MCS
Mineral Commodity Summaries
Mt/yr
million metric tons per year
NMIC
National Minerals Information Center
R/P
reserves-to-production
U.S.
United States
USGS
U.S. Geological Survey
WGS 84
World Geodetic System of 1984
Disclaimers
Any use of trade, firm, or product names is for descriptive purposes only and does not imply endorsement by the U.S. Government.
Although this information product, for the most part, is in the public domain, it also may contain copyrighted materials as noted in the text. Permission to reproduce copyrighted items must be secured from the copyright owner.
Suggested Citation
Chung, J., Neustaedter, E.R., Moon, J.W., Xun, S., and Textoris, S.D., 2026, Production of mineral commodities and geospatial map of the mineral industries and related infrastructure of China: U.S. Geological Survey Open-File Report 2026–1018, 1 map sheet, scale 1:17,500,000, 19-p. pamphlet, https://doi.org/10.3133/ofr20261018.
ISSN: 2331-1258 (online)
Study Area
| Publication type | Report |
|---|---|
| Publication Subtype | USGS Numbered Series |
| Title | Production of mineral commodities and geospatial map of the mineral industries and related infrastructure of China |
| Series title | Open-File Report |
| Series number | 2026-1018 |
| DOI | 10.3133/ofr20261018 |
| Publication Date | June 12, 2026 |
| Year Published | 2026 |
| Language | English |
| Publisher | U.S. Geological Survey |
| Publisher location | Reston, VA |
| Contributing office(s) | National Minerals Information Center |
| Description | Report: v, 19 p.; 1 Sheet: 18 x 12 inches; Data Release |
| Country | China |
| Online Only (Y/N) | Y |
| Additional Online Files (Y/N) | Y |