

Lessons Learned from Wetlands Research at the Cottonwood Lake Study Area, Stutsman County, North Dakota, 1967–2021
Links
- Document: Report (14.9 MB pdf) , HTML , XML
- Data Releases:
- USGS data release - Cottonwood Lake study area—Wetland vegetation zones
- USGS data release - Cottonwood Lake study area—Water chemistry—Wetlands
- USGS data release - Cottonwood Lake study area—Water chemistry—Wells
- USGS data release - Cottonwood Lake study area—Digital elevation model with topobathy
- USGS data release - Cottonwood Lake study area—Water Chemistry—Wells—In situ measurements
- USGS data release - Hydraulic conductivity data for piezometers near Cottonwood Lake study area, North Dakota (1978–2017)
- USGS data release - Cottonwood Lake study area—Aerial imagery
- USGS data release - Dissolved greenhouse gas concentrations and fluxes from Wetlands P7 and P8 of the Cottonwood Lake study area, Stutsman County, North Dakota, 2015
- USGS data release - Diurnal patterns of methane flux from a depressional, seasonal wetland
- USGS data release - Cottonwood Lake study area—Boundary polygon
- USGS data release - Cottonwood Lake study area—Well locations
- USGS data release - Soil properties and greenhouse gas fluxes of Prairie Pothole Region wetlands— A comprehensive data release
- USGS data release - Cottonwood Lake study area—Water surface elevations (ver. 2.0)
- USGS data release - Cottonwood Lake study area—Groundwater elevations (ver. 2.0)
- USGS data release - Cottonwood Lake study area—Amphibians (ver. 2.0)
- USGS data release - Cottonwood Lake study area—Breeding birds (ver. 2.0)
- USGS data release - Cottonwood Lake study area—Invertebrate counts (ver. 2.0)
- USGS data release - Cottonwood Lake study area—Invertebrate weights (ver. 2.0)
- USGS data release - Cottonwood Lake study area—Specific conductance (ver. 2.0)
- NGMDB Index Page: National Geologic Map Database Index Page (html)
- Download citation as: RIS | Dublin Core
Abstract
Depressional wetlands in the Prairie Pothole Region of North America have a long history of investigation owing to their importance in maintaining migratory-bird populations, especially waterfowl. One area of particularly intensive study is the Cottonwood Lake study area in Stutsman County, North Dakota. Studies at the Cottonwood Lake study area began in 1967 and continue through the present (2022). During this period of scientific discovery, meteorological conditions at the Cottonwood Lake study area varied greatly and included one of the most severe droughts of the 20th century and one of the wettest periods in the past 500 years.
Persistent wet conditions that began in 1993 have contributed to state changes in many of the study area’s larger wetlands to lake-like conditions, whereas the smaller wetlands returned to seasonally ponded conditions during relatively dry years interspersed within the longer-term wet period. Additionally, some nonwetland areas of the study area developed wetland plant, hydrology, and soil characteristics during the 1993-to-present (2022) wet period. The persistently high stages of water in the larger wetlands since 1993 contributed to a buildup of dissolved solids and increases in salinity with time following an initial decrease in salinity caused by the dilution of dissolved solids within a larger volume of water. During 2021, drought conditions similar to the 1988 to 1992 period may develop if conditions persist. However, meteorological changes during the past 30 years have persisted long enough to be considered a change in climate conditions at the study area and, if such wet conditions continue, would represent a change from conditions that occurred in the past two millennia.
During the period of study covered in this report (1967–2021), biotic communities responded in a variety of ways to subtle and marked changes in ponded-water depths, permanence, and salinity among the different wetland types in the study area. This report provides background information on the Cottonwood Lake study area and its context within the Prairie Pothole Region, documents techniques used to quantify environmental conditions and biotic communities, describes major trends that have been observed, presents significant findings as “lessons learned,” discusses recent modeling advances, and highlights key messages to managers. The Wetland Continuum concept was used as a framework to place research findings within an ecological context and to highlight the dynamic nature of prairie-pothole wetland ecosystems.
Introduction
Walter C. Mendenhall, Director of U.S. Geological Survey (USGS) from 1930 to 1943, once said, “There can be no applied science unless there is science to apply” (Smith, 1928). The information gained from science applied at the Cottonwood Lake study area in Stutsman County, North Dakota, is a result of collaboration and cooperation among researchers from several agencies and universities that still contribute to the science needed to effectively conserve and manage wetlands and the communities they support. The underlying goal of research at the Cottonwood Lake study area is to improve understanding of how wetland biological communities respond to short- and long-term drivers of ecological function and change, build a base of knowledge that others can use when carrying out research at this unique and valued study area, and provide “science to apply” for current and future wetland managers and decision makers.
Depressional wetlands in the Prairie Pothole Region (PPR; fig. 1) of North America (hereafter referred to as “prairie-pothole wetlands”) have a long history of investigation owing to their importance in maintaining migratory-bird populations, especially waterfowl (Harris and Marshall, 1963; Swanson and others, 1988). Waterfowl are of considerable economic value and have been targets for conservation since the beginning of the conservation movement in the early 20th century (Euliss and others, 2008). Several of the first hydrological and ecological studies of prairie-pothole wetlands (Shjeflo, 1968; Eisenlohr and others, 1972; Sloan, 1972; Stewart and Kantrud, 1972) were carried out in the vicinity of Cottonwood Lake (fig. 2), which is a small, freshwater lake in Stutsman County, N. Dak. One area of particularly comprehensive study located northwest of Cottonwood Lake has become known as the Cottonwood Lake study area (fig. 2). Prairie-pothole wetland studies at the Cottonwood Lake study area began in 1967 (Swanson and others, 2003) and continue to the present (2022). Initial work at the Cottonwood Lake study area focused on waterfowl ecology and water chemistry (Swanson and Duebbert, 1989). Research at the study area expanded in 1978 to include investigations into the role of surface water and groundwater in prairie-pothole wetland ecology (Winter and Carr, 1980). Detailed chemical investigations of wetland ponds and groundwater were initiated in 1979, and more detailed and integrated studies of the response of biological communities to climate-induced changes in hydrology and chemistry commenced in 1992.
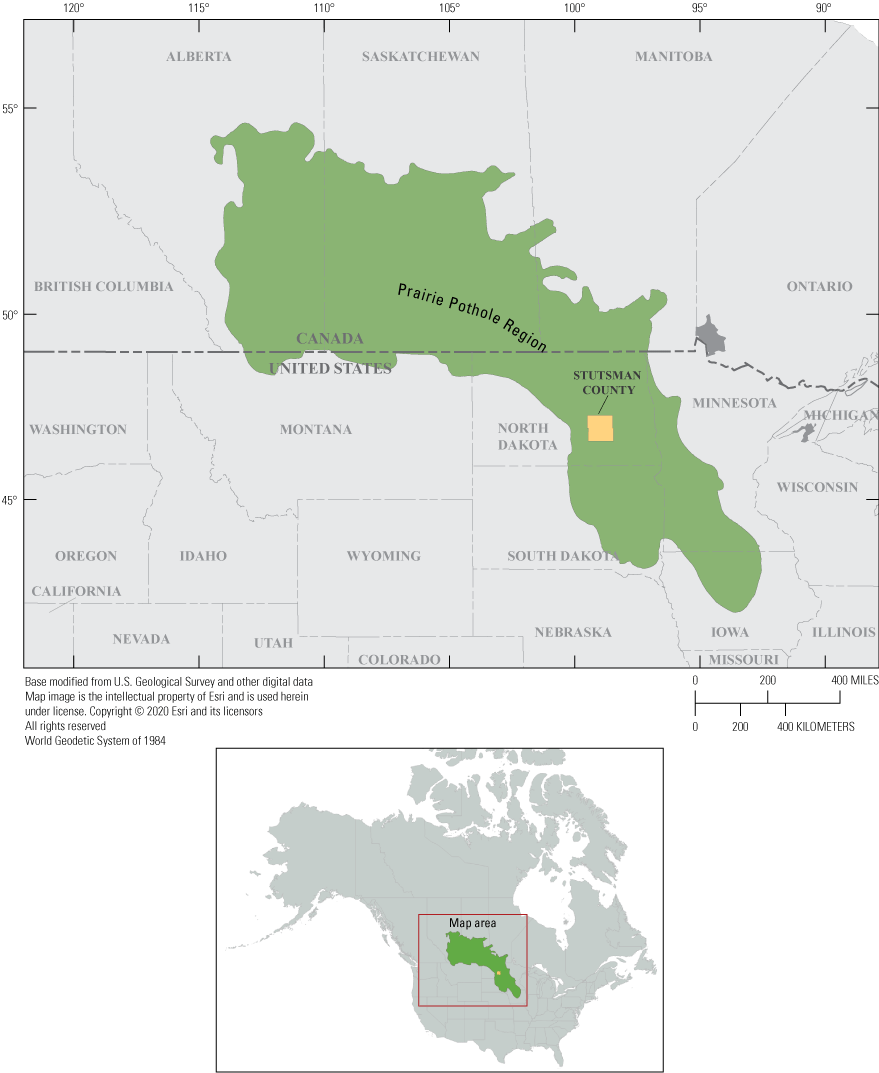
The Prairie Pothole Region of the north-central United States and south-central Canada.
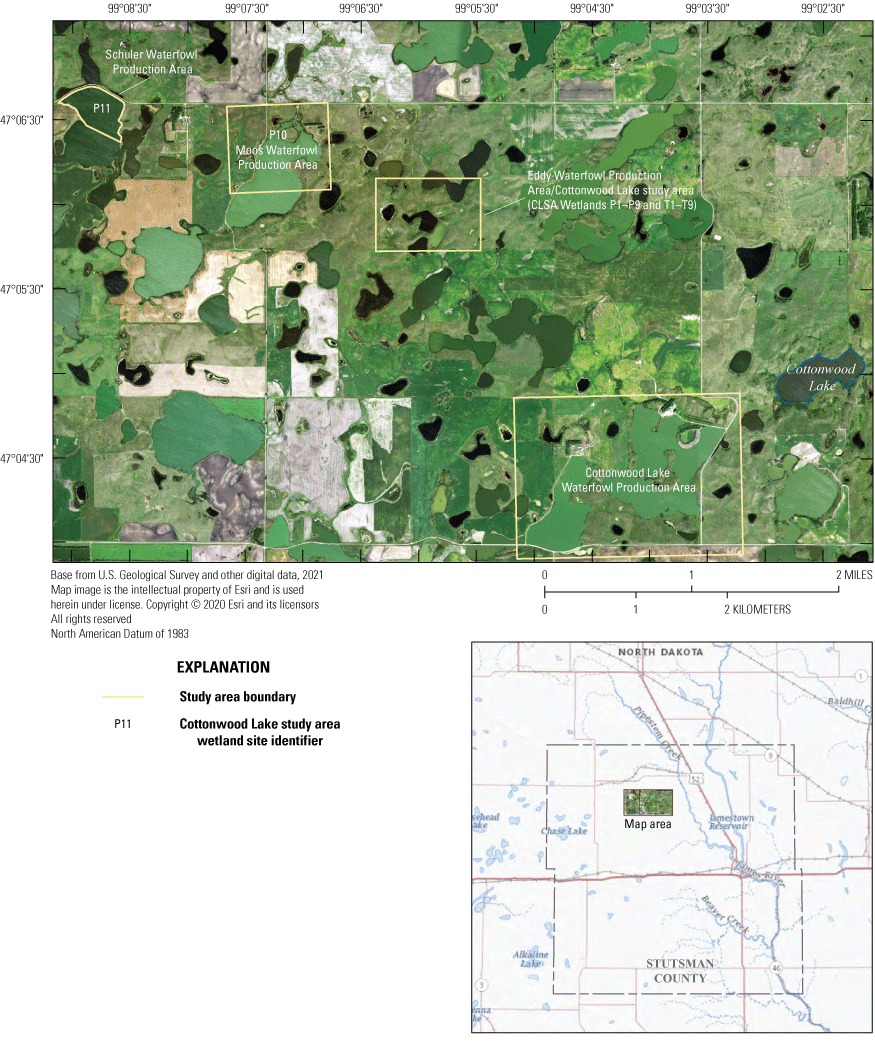
Cottonwood Lake and surrounding area in Stutsman County, North Dakota.
During 1967–2021, meteorological conditions at the Cottonwood Lake study area varied greatly and included one of the most severe droughts in the 20th century and one of the wettest periods in the past 500 years (Winter and Rosenberry, 1998). Although precipitation increases during the latter part of this period were pronounced (16.5 percent more on a yearly basis between 1992 and 2021 compared to 1967 and1991) and seasonal patterns shifted, the characteristic shifts that cycle the region between wet and dry conditions (that is, the wet/dry cycle) persisted and have been a dominant influence on the region since Pleistocene glaciation (van der Valk, 2005a). However, the rate of cycling between drought and deluge has changed since glaciation. Paleoclimate records indicate that past centuries to millennia were characterized by droughts that persisted for hundreds of years (Laird and others, 1996; Cook and others, 1997; Woodhouse and Overpeck, 1998). In contrast, with the exception of the most recent 30-year period, cycles between drought and deluge during the past 100 years have occurred at approximately 10- to 20-year intervals (Duvick and Blasing, 1981; Karl and Koscielny, 1982; Karl and Riebsame, 1984; Diaz, 1983, 1986; Ryberg and others, 2016a,b). July 1993, however, marked the beginning of a shift to an exceptionally wet period that has persisted for 30 years, which is long enough to be considered a shift in climate conditions at the study area and, if such wet conditions continue, would represent a change from conditions that occurred in the past two millennia. The variation in meteorological conditions during more than 50 years of study at the Cottonwood Lake study area, coupled with the collection of long-term ecological data from the research study area, has provided researchers with the opportunity to examine more fully the response of prairie-pothole wetland ecosystems to environmental drivers of ecological change.
This report provides background information on the Cottonwood Lake study area (fig. 3) and its ecological context within the PPR, documents techniques used to quantify environmental conditions and biotic communities of the study area, describes major trends that have been observed during the period of study (focusing on effects of the marked differences in climate pre and post 1993), presents significant findings as “lessons learned,” discusses recent modeling advances, and highlights key messages to managers. The Wetland Continuum concept of Euliss and others (2004), a framework for highlighting the dynamic nature of wetland ecosystems, is used to place the research findings within an ecological context. A bibliography of journal articles, theses, and dissertations that have emanated from research at the Cottonwood Lake study area is provided in appendix 1, information on where data generated from these research efforts can be obtained is provided in appendix 2, and standard procedures used in data collection efforts at the study area are provided in appendixes 3–7.
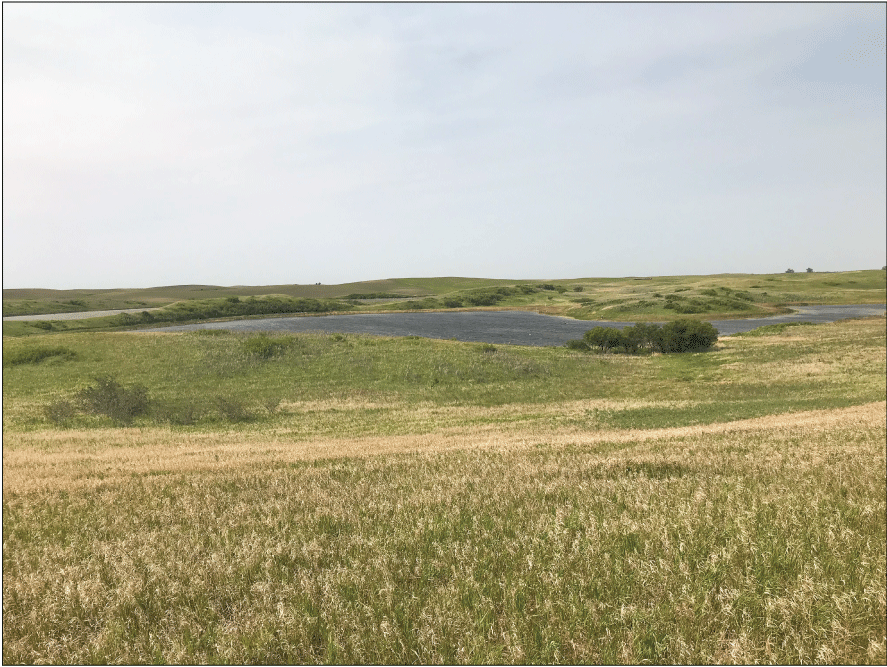
View looking southwest across the glacially formed landscape of the Cottonwood Lake study area in Stutsman County, North Dakota, August 18, 2021. Open-water wetland in the center is wetland P1. Photograph by David Mushet, U.S. Geological Survey.
Study Chronicle
In the late 1950s, the possibility that irrigation from the Garrison Diversion Project in North Dakota would change the hydrological characteristics of the landscape and potentially affect waterfowl habitat led to a series of detailed studies of prairie-pothole wetlands by hydrologists from the U.S. Geological Survey. These studies (fig. 4) initially focused on evapotranspiration from prairie-pothole wetlands in different parts of North Dakota, including wetlands 2 miles southeast of Cottonwood Lake (Eisenlohr and others, 1972; Shjeflo, 1968). This research was later expanded beyond evapotranspiration to include examination of wetland exchanges with groundwater (Sloan, 1972). Beginning in 1962, U.S. Fish and Wildlife Service (FWS) biologists Robert Stewart Sr. and Harold Kantrud, who later became members of the USGS staff, surveyed vegetation of the wetlands studied by Eisenlohr and others (1972) and Shjeflo (1968) (Stewart and Kantrud, 1972). Research on wetland plants led to the identification of the range of salinity and water permanence tolerated by different species (Stewart and Kantrud, 1972) and the first classification system specific to prairie-pothole wetlands (Stewart and Kantrud, 1971).
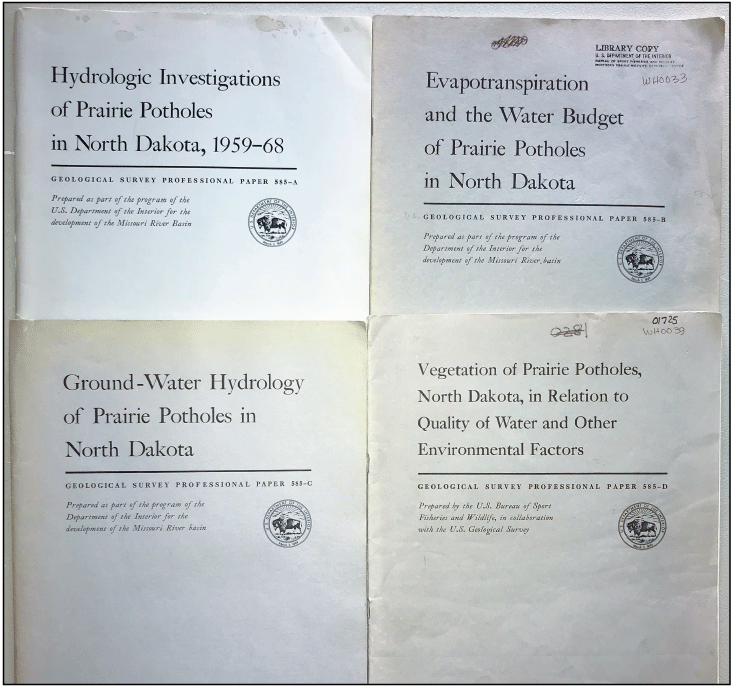
Early and well-used U.S. Geological Survey Professional Papers exploring hydrology, evapotranspiration, and plant communities of prairie-pothole wetlands in North Dakota. Photograph by David Mushet, U.S. Geological Survey.
George A. Swanson began his career at the NPWRC in 1966 (Mushet, 2020a). In his effort to understand the different factors affecting use of prairie-pothole wetlands by waterfowl, Swanson undertook an ambitious study of the chemical characteristics of wetlands in Stutsman and Kidder counties, N. Dak., from 1966 to 1976 (Swanson and others, 1988). Aided by NPWRC chemist Vyto Adomaitis and the chemical laboratory at NPWRC, Swanson (fig. 5) examined the chemical characteristics of 178 prairie-pothole wetlands and small lakes in the two counties. Swanson and others (1988) determined a wide range of salinity and chemical types among the sites sampled.
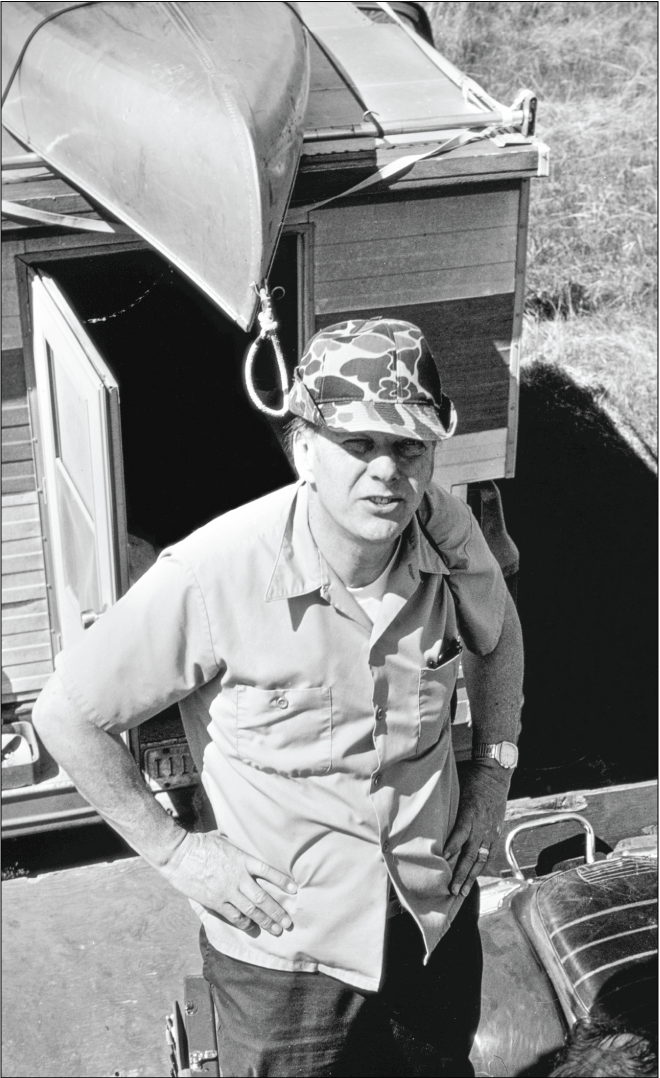
George Swanson at the Cottonwood Lake study area, date unknown. Photograph by U.S. Geological Survey.
In keeping with NPWRC’s early focus on waterfowl, research efforts also concentrated on waterfowl food habits (for example, Swanson and Bartonek, 1970; Swanson and others, 1985) using a set of experimental wetlands at NPWRC and three Waterfowl Production Areas (WPAs) that were owned and managed by the FWS. The WPAs were located near Cottonwood Lake in Stutsman County (fig. 2) and thus collectively became known as the Cottonwood Lake study area. The primary site used by Swanson was a 92-hectare (ha) WPA (the Eddy WPA) that at the time included nine temporarily to seasonally ponded and eight semipermanently ponded prairie-pothole wetlands (Swanson, 1987). The second WPA, the Moos WPA, is located 1.5 kilometers (km) west of the Eddy WPA and is dominated by a large prairie-pothole wetland that often functions as a permanently ponded lake. The last site included in what is known as the Cottonwood Lake study area is the Schuler WPA, which is located 3.2 km west of the Eddy WPA and, like the Moos WPA, is dominated by a large prairie-pothole wetland that often functions as a permanently ponded lake.
As studies of the chemical characteristics, invertebrate communities, and plant communities of the wetlands progressed, Swanson realized that natural changes in water levels and pond permanence strongly affected the characteristics and biological communities of the wetlands and, therefore, their use by waterfowl (Swanson and others, 1988). In 1977, Swanson met Thomas (Tom) Winter (fig. 6), a research hydrologist from the USGS in Lakewood, Colorado (Rosenberry, 2020a). Winter had been looking for sites in the upper Midwest at which to carry out his fledgling research program into hydrological processes controlling the water budgets of lakes and wetlands, which was a program that would grow into one of the most influential series of hydrological studies in the world (Rosenberry, 2020a). The initial conversations between Swanson and Winter led to a grassroots, interagency research effort to define the hydrological characteristics and processes responsible for water-level, pond permanence, and biological-community changes in prairie-pothole wetlands (Swanson, 1987).
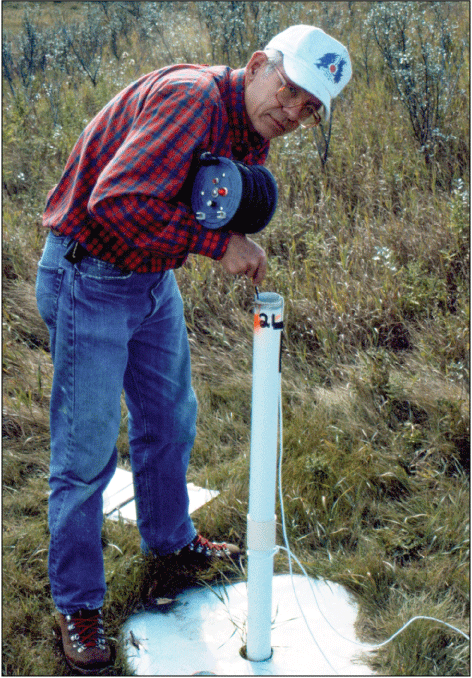
Thomas (Tom) Winter measuring distance to water in a groundwater-monitoring well at the Cottonwood Lake study area, North Dakota, date unknown. Photograph by Don Rosenberry, U.S. Geological Survey.
In 1978, Winter and his colleagues from the USGS office in Bismarck, N. Dak., began to install a network of groundwater wells and piezometers at the study area (fig. 7) using commercial well drillers. To understand how the hydrologic cycle affected the wetlands, Winter also installed instruments to measure rainfall and evaporation, and enlisted Alex Sturrock, a USGS evaporation specialist, to help with analysis and interpretation of evaporation data. Throughout the subsequent study, additional wells were installed and meteorological equipment were refined at the study area, including use of automatic data recorders, making it possible to monitor weather and groundwater elevation changes year-round (Swanson, 1987).
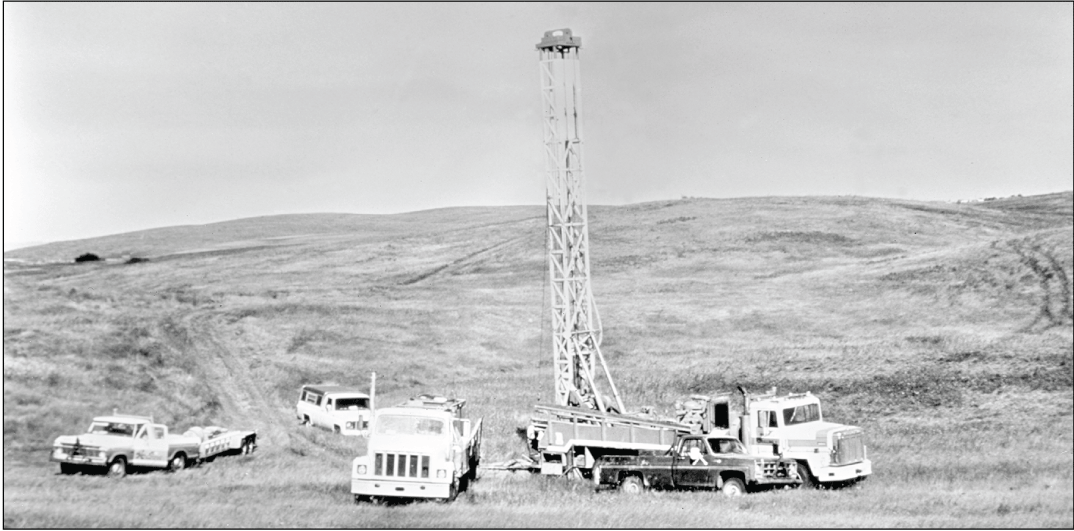
Commercial drill rig installing a groundwater-monitoring well at the Cottonwood Lake study area, North Dakota, 1978. Photograph by U.S. Geological Survey.
The cooperative efforts of Swanson and Winter were a logical extension of an earlier cooperative study between FWS and USGS scientists (Eisenlohr and others, 1972). In their earlier work, Eisenlohr and others (1972) determined that wetlands situated at low elevational positions where they received groundwater discharge had ponds that were more saline than higher elevation wetlands that did not receive this discharge. In addition, wetland ponds that did not lose water by way of flow to groundwater, or by overland flow when the pond-water level reached a spill point in the wetland basin, had no water-borne mechanism for losing dissolved solids. Thus, salinity differences among wetland ponds in the area examined by Swanson and others (1988) were hypothesized to be a result of variations in the degree to which the wetlands were connected to groundwater and the nature of their interaction with groundwater. With this knowledge, Swanson sought to involve someone with expertise in hydrochemistry, and in 1979, James (Jim) LaBaugh, another USGS research scientist from Lakewood, Colo., joined the team working at the Cottonwood Lake study area to assist Swanson with interpretations of relations between wetland chemical characteristics, hydrological characteristics, and wetland biota at the study area. When the chemical laboratory at NPWRC that had been processing water samples closed in 1983, LaBaugh arranged for chemical analysis of water samples collected at the study area to be carried out at the USGS National Water Quality Laboratory in Colorado. Donald (Don) Rosenberry, also a research scientist from the USGS offices in Lakewood, Colo., joined the team in 1985, assisting with additional instrumentation of the study area and initiation of studies of the nearshore changes in flows between groundwater and wetland ponds (Rosenberry, 2020b).
Aside from the efforts of George Swanson, Tom Winter, Jim LaBaugh, and Don Rosenberry, much additional research has been carried out by other scientists attracted to the Cottonwood Lake study area by its ever-growing data assets and interdisciplinary research opportunities. For example, Jimmie Richardson and Mario Biondini from North Dakota State University examined wetland soils and biogeochemical transformations in those soils (Arndt and Richardson, 1992; Biondini and Arndt, 1993); Bruce Hanson, a wildlife biologist from NPWRC, developed a key for Coleoptera at the study area (Hanson and Swanson, 1989); Rick Forester, an ostracod specialist from the USGS in Denver, examined ostracods from the study area (Forester, 1986); and Hal Kantrud, also from NPWRC, examined vegetation at the study area (Stewart and Kantrud, 1972).
Upon Swanson's retirement in 1992, the FWS erected a bronze plaque (fig. 8) at the entrance to the Eddy WPA, dedicating the study area in honor of Swanson’s significant contributions to wetland management based on insights gained at the Cottonwood Lake study area. Much of the research carried out in and around the study area laid the foundation for science-based management of prairie-pothole wetlands.
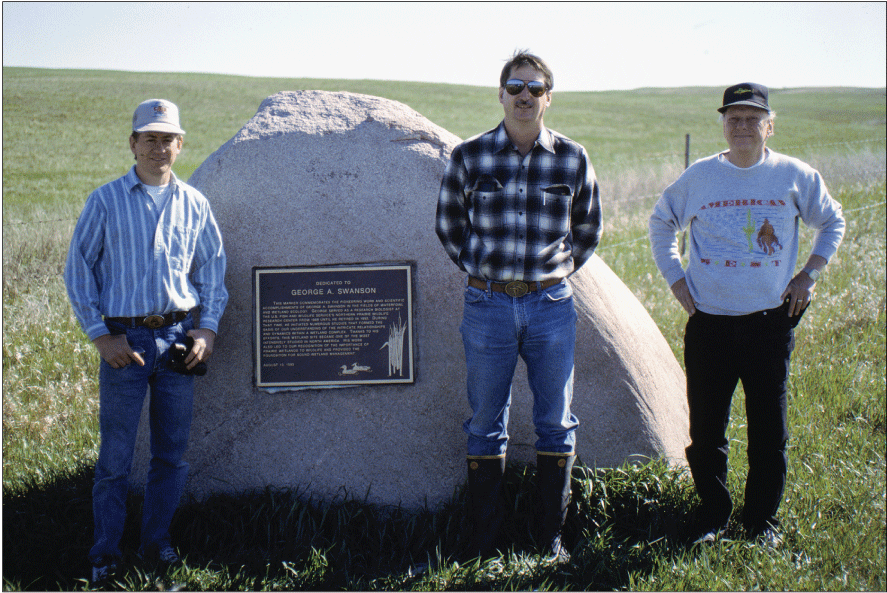
Dedication plaque at the Cottonwood Lake study area and glacial erratic boulder on which it is mounted, May 1998. Photograph by U.S. Geological Survey.
Ned (Chip) Euliss Jr. the NPWRC research biologist who inherited Swanson's role as the Cottonwood Lake study area’s team leader, continued the tradition of cooperative research at the study area (Euliss, 2020). In 1993, when funds were no longer available to consistently continue chemical analyses at the USGS National Water Quality Laboratory, Euliss recruited Richard (Rick) Nelson from the Bismarck, N. Dak., office of the Bureau of Reclamation. Nelson had performed his doctoral research at the Cottonwood Lake study area (Nelson, 1989) and was interested in using the study area’s wetlands as controls for comparison with restored wetlands. With the need to use Cottonwood Lake study area wetlands as reference sites, Nelson stepped in to continue chemical data collection at the study area. From 1993 to 2004, Nelson carried out water-chemistry research at the study area and, as was done by his predecessors, shared his data with all collaborators.
The vagaries of funding in the 1980s had limited the biological research done at the study area by Swanson. However, Euliss was able to obtain funding needed to expand the biological research to include detailed monitoring of invertebrates, amphibians, and birds. These additions greatly complemented the long-term examinations of hydrology, water chemistry, and plant communities. Euliss was able to continue these new data-collection efforts, in addition to the hydrology, chemistry, and plant data-collection efforts, as NPWRC was transitioned in 1994 from the FWS to the National Biological Survey (later renamed the National Biological Service) and 2 years later when the National Biological Service merged with the USGS, uniting several of the study area’s key scientists under a single agency. The additional data-collection efforts initiated by Euliss provided, and continue to provide, new insights into community and population changes related to the hydrochemical dynamics of prairie-pothole wetlands (for example, Euliss and others, 2004).
In 2010, a new group of USGS scientists from Denver—Martin Goldhaber, Christopher Mills, Jean Morrison, and Craig Stricker—joined the team carrying out research at the Cottonwood Lake study area. Their work focused on the geological, geochemical, hydrochemical, and hydrogeochemical processes affecting the chemical makeup of ponded and subsurface waters in wetlands. They explored the role of long-term critical zone processes (Goldhaber and others, 2011, 2014) and the geochemical evolution of PPR wetlands over decadal time scales (Goldhaber and others, 2016). Their work has been essential to furthering the understanding of sulfur dynamics in prairie-pothole wetlands and in placing wetlands of the Cottonwood Lake study area in the larger context of hydrogeochemical processes occurring throughout the PPR.
Another NPWRC scientist, David (Dave) Mushet, inherited scientific management of the study area when Euliss retired in 2014. Mushet had been a part of the work at the Cottonwood Lake study area since expansion of the biotic data-collection efforts by Euliss in 1992. After taking over as the study area’s lead, Mushet organized a meeting of the study area’s primary research scientists at the 2015 Annual Meeting of the Society of Wetland Scientists. A special issue of the scientific journal Wetlands resulted from this meeting of scientists and the subject of the special issue was “Mid-continental Prairie-pothole Wetlands and Climate Change” (Mushet, 2016). Of the 18 papers published in the special issue, 10 relied on data collected from research at the Cottonwood Lake study area.
One of NPWRC’s newest research scientists, Kyle McLean, took over management of the study area with Mushet’s retirement in 2022. McLean’s master’s and doctoral research directly involved use of the Cottonwood Lake study area’s rich data assets. For his master’s thesis (McLean, 2015), McLean resampled 168 of the 178 wetlands and small lakes originally studied by Swanson from 1966 to 1976 (Swanson and others, 1988). As with Swanson’s sampling, McLean sampled several of the wetlands at the Cottonwood Lake study area, the wetlands sampled earlier by Eisenlohr and others (1972), and Cottonwood Lake itself. McLean’s doctoral studies involved a thorough investigation of the Cottonwood Lake study area’s data assets and the development of models identifying key drivers of aquatic-invertebrate community composition and biodiversity of prairie-pothole wetlands (McLean, 2020), following ideas hypothesized within the Wetland Continuum concept of Euliss and others (2014).
The historical data assets and ongoing research at the Cottonwood Lake study area provided a strong draw that has stimulated much additional graduate and post-graduate research at the study area. Karen Poiani, under the direction of Carter Johnson from Virginia Polytechnic and South Dakota State University, carried out her master’s (Poiani, 1987) and doctorate (Poiani, 1990) studies on hydrophytic seed banks and the response of vegetation in semipermanently ponded prairie-pothole wetlands to climate change at the study area. As previously mentioned, Rick Nelson carried out his doctoral research at the study area while attending North Dakota State University under the direction of Malcom Butler (Nelson, 1989). Nelson’s research focused on midges (Chironomidae), an important food resource for the region’s bird communities. master’s student Kevin Swanson studied the mineral content of glacial till at the study area under the direction of Carl Bowser from the University of Wisconsin (Swanson, 1990). Greg Summers, a master’s student of Mario Biondini of North Dakota State University, examined the role of wetlands in nitrogen cycles of the prairie (Summers, 1993). James Arndt, while a student of Jimmie Richardson of North Dakota State University, carried out doctoral research on wetland soils and biogeochemical transformations in relation to hydrologic gradients at the study area (Arndt, 1994). A student of Arnold van der Valk, Paul Wetzel from Iowa State University collected some samples from the Cottonwood Lake study area for his research on mycorrhizal fungi (Wetzel and van der Valk, 1996). David Renton, a master’s student of Edward DeKeyser of North Dakota State University, focused on one of the study area’s seasonally ponded wetlands as a control in his master’s research on the effects of burning and grazing on wetland water levels (Renton, 2016). Zeno Levy, a Syracuse University PhD student of Donald Siegel, studied climate controls on pore-water chemistry at the study area (Levy, 2017) and discovered a large salt store under study area Wetland P1 (fig. 2). Andrew McCabe, a University of Minnesota student of William Arnold, carried out his doctoral research on the photochemical production of reactive intermediates using samples collected at the study area (McCabe, 2017). Two post-doctoral fellows, Xiaoyan Zhu and Yuxiang Yuan, of North Dakota State University professor Marinus Otte, used the Cottonwood Lake study area in their development of multi-element fingerprinting methodologies to assess connectivity among wetlands (Yuan and others, 2019; Zhu and others, 2019).
Most recently, Kyle McLean and Kui Hu, both doctoral students of North Dakota State University Assistant Professor Jon Sweetman, carried out research at the study area. As previously described, McLean’s studies involved the use of the study area’s rich data assets to identify drivers of aquatic-invertebrate community composition and biodiversity (McLean, 2020). Hu is focusing her work on the use of sediment cores collected from two study area wetlands to recreate past climate of the study area from remains of diatoms and other invertebrates contained in the collected cores. Currently, Elyssa McCulloch-Huseby is performing her master’s work with Lisa Webb at the University of Missouri combining hydrochemistry, plant-community species composition, and climate change modeling with a resample of the study area’s wetland vegetation data.
Today the Cottonwood Lake study area is internationally recognized as one of the most intensively studied wetland complexes in North America and has been listed as a “Wetland of Distinction” by the Society of Wetland Scientists (see https://members.wetlandsofdistinction.org/woddirectory/Details/cottonwood-lake-study-area-1969660). To date, the Cottonwood Lake study area is the only wetland complex listed as a “Wetland of Distinction” based on its importance and contributions as an ecological study area. More than 100 scientific publications, theses, and dissertations (appendix 1), and numerous data reports and releases (appendix 2) resulting from research at the study area form a significant component of the scientific information currently available to guide wetland management in the PPR of the United States, Canada, and beyond.
Study Area
The Cottonwood Lake study area is located within the PPR of North America. Its position in this ecologically and economically important region has been key to the longevity of research and data collection efforts at the site. As described in the “Study Chronicle” section, developing an understanding of the complexities of this hydrologically, chemically, meteorologically, and ecologically dynamic region has dominated the careers of several generations of scientists.
Regional and Physiographic Framework of Study
The PPR is a unique landscape (figs. 1, 9) where geologic features from Pleistocene glaciation interact with a highly dynamic, midcontinent climate to create one of the most important wetland regions in the world. The PPR covers approximately 900,000 square kilometers of the North American continent (Phospahala and others, 1974; Mann, 198678) and includes portions of Alberta, Saskatchewan, Manitoba, Montana, North and South Dakota, Minnesota, and Iowa. When the Pleistocene glaciers retreated from the area more than 10,000 years ago, millions of small depressions constituting more than 20 million ha were revealed (Millar, 1989; Tiner, 1984). These depressions were formed from scouring by moving ice, uneven deposition of glacial till, and melting of buried ice blocks. Following glacial retreat, precipitation and snowmelt ponded in the depressions and formed the wetlands known today as “potholes,” “sloughs,” or “prairie-pothole wetlands” (Eisenlohr and others, 1972).
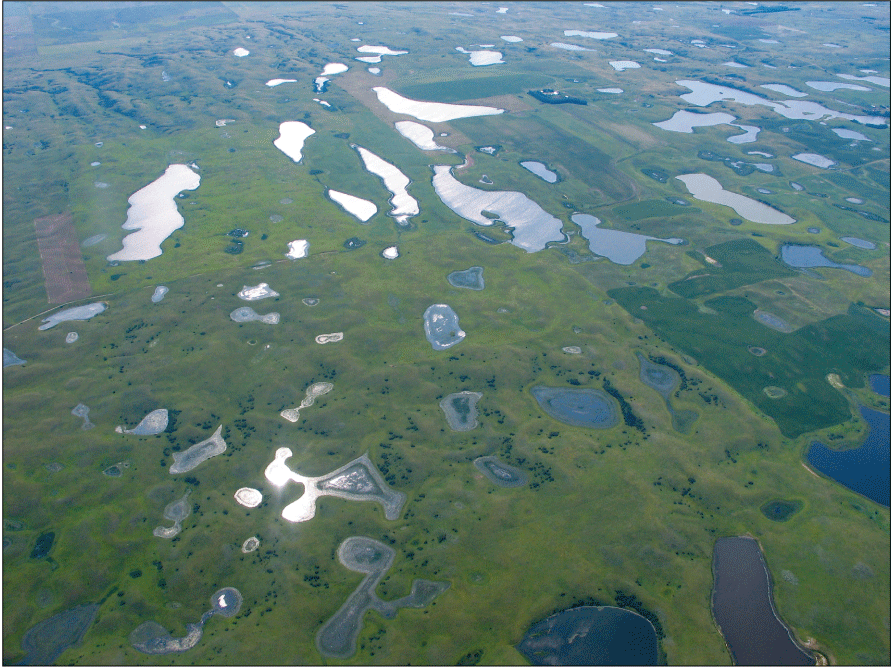
Aerial view of the Prairie Pothole Region in Stutsman County, North Dakota, July 17, 2009. Photograph by David Mushet, U.S. Geological Survey.
Historically, the PPR is a grassland/wetland biome with tall-grass prairie to the east, short-grass prairie to the west, and mixed-grass prairie between (fig. 10) and has been extensively modified to facilitate the production of agricultural crops. Consequently, most of the region’s grassland area (Samson and others, 2004) and more than one-half of its wetland area (Tiner, 1984; Environment Canada, 1986) has been converted to croplands. This massive loss of native grasslands and wetlands in the PPR stimulated considerable interest in restoring previously cropped wetlands (Knutsen and Euliss, 2001; Gleason and others, 2008). However, despite the loss of large portions of the wetland habitats important for provisioning biodiversity, the PPR remains one of the most important areas in North America for many native species, most notably migratory waterfowl (Batt and others, 1989).
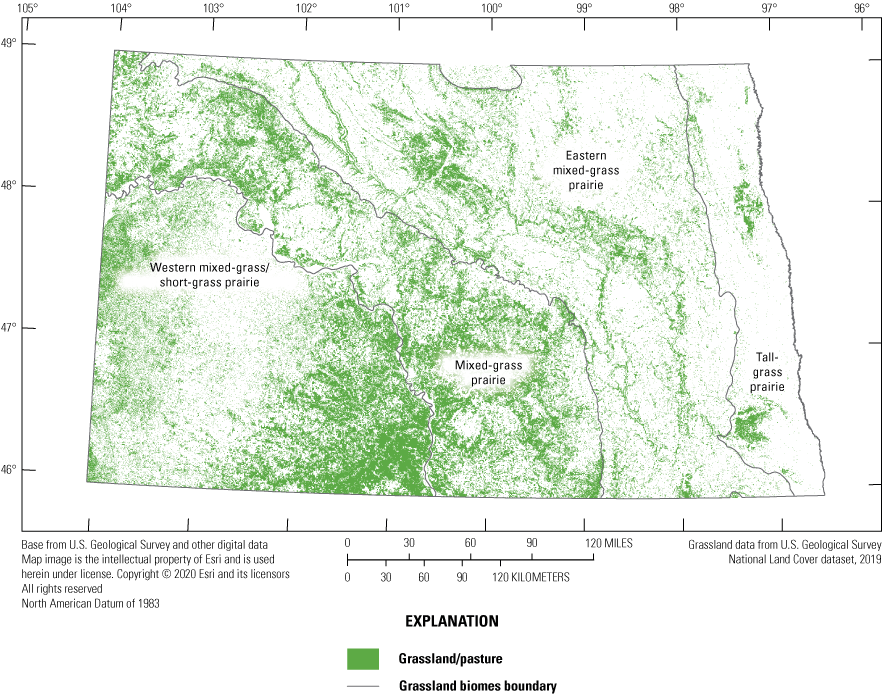
The four major grassland biomes of North Dakota. Remaining grasslands are shown in green. Grassland data are from the U.S. Geological Survey National Land Cover Database (Earth Resources Observation and Science Center, 2018).
Soils in the PPR developed from glacial till, a mineral-rich mixture of geologic materials that range in size from clays to large boulders (Richardson and others, 1994). In general, the high clay content of the glacial till in the PPR, as much as 20 percent by weight (Hayashi and others, 2016), results in very low hydraulic conductivity (Hendry, 1988; Winter, 2003). This low hydraulic conductivity leads to the ponding of surface water in the abundant depressions dotting the landscape. Hydraulic conductivity generally decreases with depth in the PPR, but the upper few meters typically contain fractures and macropores that can increase conductivity up to 1,000 meters per year as compared with less than (<) 1 meter per year at deeper depths (van der Kamp and Hayashi, 2009). Consequently, most shallow groundwater flows laterally in the upper portion of the till with little flow to deeper groundwater (Hayashi and others, 2016). Despite these shallow groundwater flows, lateral movements of snowmelt runoff, blowing snow, and runoff from occasional heavy summer precipitation events provide the bulk of water entering prairie-pothole wetlands (Hayashi and others. 2016). Evaporation (direct and through transpiration) is the largest water loss (Winter, 2003).
Climate of the Prairie Pothole Region
The climate of the PPR has historically been semi-arid with highly dynamic, interannual cycles between periods of drought and deluge (Duvick and Blasing, 1981; Karl and Riebsame, 1984; Diaz, 1986). Annual water losses from evapotranspiration are nearly twice water gains from precipitation (Eisenlohr and others, 1972). The climate cycles can completely dry wetland basins or flood them with ponded water. In settings where pond levels reach a spill point in the wetland basin, some water can be lost from the basin by surface flow to an adjacent wetland basin (Eisenlohr and others, 1972). Although there are exceptions, many prairie-pothole wetlands exist in closed basins where the only water loss is from evapotranspiration and to shallow groundwater around the wetland periphery in response to plant transpiration. Because many wetland basins have no surface-water outlet, there has been minimal nutrient loss to downstream flow since glaciation (van der Kamp and Hayashi, 2009). Consequently, interannual variability in precipitation dilutes or concentrates solutes. Superimposed upon the highly variable meteorological conditions are pronounced temperature extremes that can range from 48 degrees Celsius (°C) to –48 °C (Rosenberry, 2003). The interaction of quite variable weather and mineral-rich glacial soils has a profound and dynamic effect on the hydrology, chemistry, and biota of the diverse wetland types in the PPR (LaBaugh and others, 1998; Euliss and others, 1999, 2004).
Alternating drought and deluge cycles modify the environmental conditions supporting biota within each unique wetland type, resulting in pronounced change and shifts within the biological community over space and time within wetland complexes (Eisenlohr and others, 1972; Stewart and Kantrud, 1972; Kantrud and others, 1989; van der Valk, 1989; Euliss and others, 1999, 2004; Swanson and others, 2003). The primary effect is through temporal dilution or concentration of solutes; however, concurrent changes in other abiotic characteristics (for example, pond permanence, pond depth) also affect temporal change in habitat conditions that alters the suitability for a diverse biological community. Thus, temporal changes in habitats within individual wetlands result in temporal changes in the composition of biological communities. Entire taxonomic groups can be eliminated at times, only to reappear when favorable conditions return later in the natural climate cycle. The temporal dynamics in the composition of the biological-community complements the naturally high spatial diversity provided by unique functional types of wetlands within complexes at any point in time. Consequently, it is not surprising that species using prairie-pothole wetlands tend to have very pronounced boom and bust cycles as the environmental conditions they require are eliminated and reappear in response to natural climate variations. To the casual observer, such shifts may seem negative because certain species are eliminated at times; however, the overall process of repeatedly drying and reflooding can optimize habitat diversity and biodiversity over space and time (Euliss and others, 2004, 2008).
Hydrological Effects on Wetland Characteristics
Wetland hydrologic functions, in synergy with the highly variable interannual climate and edaphic features, are the natural drivers of prairie-pothole wetland ecosystems. Atmosphere-wetland and groundwater-wetland interactions, as well as the presence of spill points in wetland basins that can provide a surface outlet from wetland ponds, determine the quantity and quality of water available in the wetland ponds to support wetland functions. In the PPR, the effects of highly dynamic and complex interactions between atmospheric water, groundwater, and wetlands are well known, especially as related to the hydrologic function of individual wetlands (for example, Lissey, 1971; Sloan 1972; Winter and Carr, 1980; Winter and LaBaugh, 2003; Hayashi and others, 2016). Although the water balance of prairie-pothole wetland ponds is dominated by atmospheric water from snowmelt and surface runoff (Winter, 2003), localized shallow subsurface flows have a profound effect on wetland pond-water quality among nearby wetlands, especially solute composition and concentration (Rozkowska and Rozkowski, 1969; Rozkowski, 1969; Eisenlohr and others, 1972; LaBaugh and others, 1998; Euliss and others, 2004; van der Kamp and Hayashi, 2009; Hayashi and others, 2016; LaBaugh and others, 2018).
Hydrodynamic salt cycling between groundwater and surface water in the PPR is superimposed over long-term (century- to millennia-scale) processes that control mineral weathering and salt formation in regional glacial till deposits (Goldhaber and others, 2014). Groundwater in the PPR typically evolves along subsurface flowpaths in shallow, oxidized till from dilute calcium and bicarbonate type waters in groundwater recharge areas to saline magnesium or sodium sulfate type waters in discharge areas (Berthold and others, 2004; Goldhaber and others, 2014). The dominant solute in brackish to saline groundwater in the PPR is sulfate, which derives from long-term weathering of pyrite dispersed into glacial sediments from underlying shale deposits. Oxidation of pyrite within the upper “brown zone” of oxidized glacial till, characterized by abundant gypsum and oxidized iron compounds, is thought to have occurred over millennia by exposure of till to atmospheric oxygen during extended paleodroughts (that is, droughts that occurred before measuring instruments were developed) when water tables were much lower than they are today (Hendry and others, 1986; Grasby and others 2010; Goldhaber and others, 2014).
Hydrogeochemical processes affecting the evolution of groundwater salinity in surrounding glacial tills have important implications for salt cycling and storage in wetland sediments. Sulfate salts transmitted by groundwater discharge accumulate in low-lying, closed-basin wetlands. During wet times, seasonal precipitation and dissolution of high-magnesium calcite appears to exert important controls on the surface-pond salt balance and pH (Heagle and others, 2007; Goldhaber and others, 2014). During dry times, surface ponds dry and evapoconcentration of shallow porewaters coupled with calcite dissolution promote gypsum formation in the shallow sediments, which can accumulate in the wetland basin over the long term and effectively form a “gypsum trap” for salinity in closed wetland basins (Heagle and others, 2013). The process of long-term salt accumulation in the subsurface of closed wetland basins, coupled with complex hydrodynamics that help occlude salinity deep in wetland sediments during drought, allow surface ponds to maintain moderate salinities under semi-arid climate conditions on geologic timescales (Levy and others, 2018a).
Transpiration by plants at wetland pond margins also can result in the deposition of carbonate and sulfate minerals in the soils at pond margins (Arndt and Richardson,1993; Biondini and Arndt, 199314). These minerals are readily weathered, thereby contributing solutes to the groundwater discharging to wetland ponds (Mills and Zwarich, 1986; Arndt and Richardson, 1989; Arndt and Richardson, 1993). This transpiration along wetland margins can also reverse hydraulic gradients and induce flow from the wetland pond to the shallow, nearshore margins (Rosenberry and Winter, 1997), which can substantially affect the water balance of a wetland pond.
Thus, wetland ponds that receive shallow groundwater inherit chemical characteristics from groundwater discharge. Depending on the type of interaction a wetland has with respect to groundwater, the length of time groundwater is in contact with the soil and till, and the distance traveled in soil or till since falling to earth as precipitation, the effect on water chemistry within individual wetland ponds can be slight to extreme. Also, the absence of a groundwater or surface-water outlet prevents loss of solutes through water-borne transport out of wetlands thereby affecting the salinity of the wetland ponds.
Whether or not a pond receives water and solute input from groundwater influences pond-water solute concentration and composition. As noted by Eisenlohr and others (1972), salinity of pond water in a wetland also is a major function of whether or not the pond has a water-borne mechanism to remove solutes, either by flow to groundwater or by overland flow from the basin at a pond spill point, which rarely, if ever, occurs in most prairie-pothole wetlands. As a result, solute concentrations in individual prairie-pothole wetland ponds can vary from fresh (Petri and Larson, 1973) to nearly 10 times the salinity of the world’s oceans (Hammer, 1978).
As noted by Sloan (1972), wetland ponds that recharge groundwater (hereafter referred to as “recharge wetlands”) contain relatively fresh water because the ponds are small; situated high in the groundwater-flow system; lose water and solutes to groundwater; and receive minimal, if any, groundwater input. After spring thaw, the recharge wetland ponds usually contain water for a few weeks to months before drying. The ponds that have groundwater flowthrough (hereafter referred to as “flowthrough wetlands”) contain water of moderate salinity primarily owing to loss of water and solutes to groundwater, potential loss of water by overland flow out of the basin at a spill point, and addition of solutes from groundwater. After spring thaw, the flowthrough wetland ponds usually contain water for months before becoming dry, or the ponds can persist until they freeze. The ponds that are the most saline (hereafter referred to as “discharge wetlands”) are ponds that have little, if any, loss of water and solutes to groundwater; have no loss of water out of the basin by surface flow; and receive water and solutes as groundwater discharge. After spring thaw, the discharge wetland ponds contain water through the open-water period in most years, drying completely only in dry periods. The wetland ponds and their basins primarily are closed basins and not connected by persistent, integrated surface-water connections. However, wetland ponds can occasionally receive water and solutes from surface outflow/overflow from adjacent upgradient wetland ponds (Eisenlohr and others, 1972), with such outflows being more pronounced during very wet episodes (Shaw and others, 2012).
Wetlands with substantially different hydrologic functions and associated variations in abiotic and biotic characteristics often occur within proximity to one another and are interconnected by way of shallow groundwater flows. This diversity of hydrologic function among prairie-pothole wetland ponds is an important factor affecting the high biodiversity of the PPR because this functional diversity maintains heterogeneity in wetland habitat conditions. Species constituting the communities within each wetland type have specific adaptations (for example, salt tolerance; drought resistant seeds, propagules, or eggs; freeze resistance) to exist in the unique environmental conditions provided by each functional wetland type (Euliss and others, 2004). The unique combinations of wetland functional types provide localized, heterogeneous mixtures of wetlands that are often referred to as wetland complexes (Weller, 1988) and are the basic ecological unit supporting spatially and temporally diverse biological communities in the PPR. However, “wetland complex” is an imprecise term and has been used to refer to a small number of wetlands locally connected by shallow groundwater flows (Euliss and others, 2004) and also the entire PPR as a single wetland complex (van der Valk, 2005a).
Coteau du Missouri
The Coteau du Missouri, known locally as the Missouri Coteau (Eisenlohr and others, 1972), is a major physiographic region of the PPR (fig. 11). The Coteau du Missouri is located along the southwestern edge of the PPR and was formed during the waning millennia of the last Pleistocene glacial advance across north-central North America. Southward moving ice was pushed up onto earlier glacial deposits, where it stagnated and slowly melted in place over thousands of years, leaving behind entrained sediments as well as the reworkings of those sediments owing to differential melting of ice and associated transport of sediment. A mosaic of a clay-rich, shaly matrix with pockets of reworked and fluvially deposited sand and silt created a hummocky surface greater than or equal to 100 meters higher than sediments covering the drift prairie to the east (Neff and Rosenberry, 2018). The geologically young surface of the Coteau du Missouri is poorly drained, consisting of short segments of ephemeral streams that flow when pond stages rise beyond a spill point during wet periods. Some ephemeral streams on the eastern edge of the Coteau du Missouri (the Missouri escarpment) reach the Pipestem Creek and James River, providing connectivity of these otherwise noncontributing wetlands to a more established drainage network (Brooks and others, 2018).
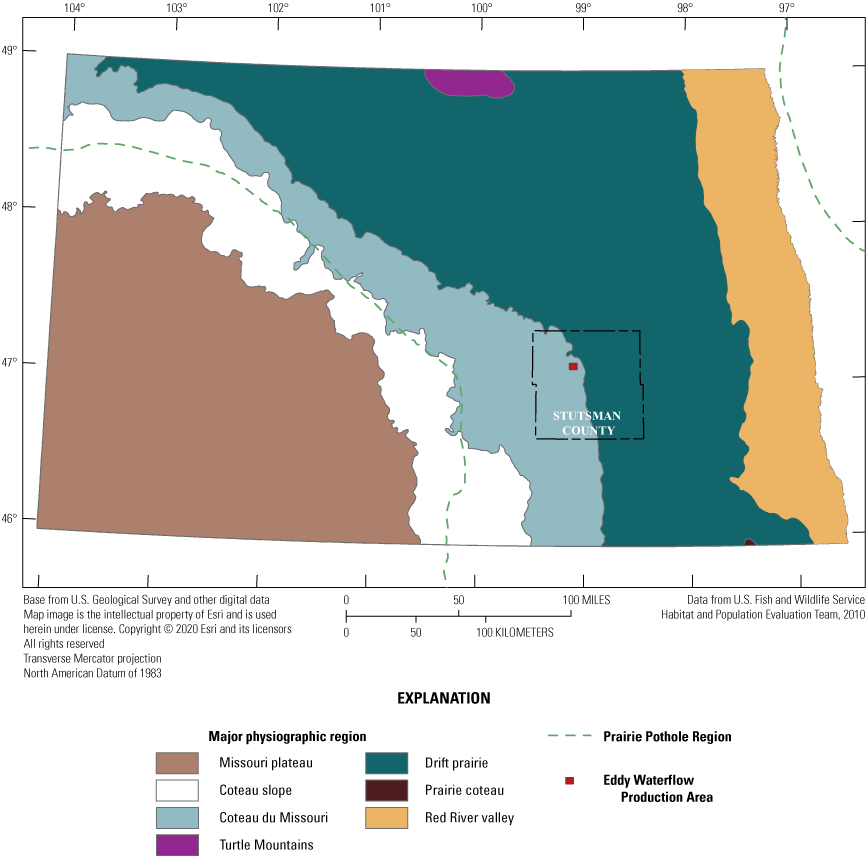
Major physiographic regions of North Dakota.
Description of the Cottonwood Lake Study Area
The Cottonwood Lake study area is located near the eastern edge of the PPR’s Coteau du Missouri in Stutsman County, North Dakota. As typical of the PPR, wetlands in and around the Cottonwood Lake study area occupy depressions in the landscape (fig. 12) that were formed by the aforementioned glacial processes during the Pleistocene epoch (see “Regional and Physiographic Framework of the Study” section).
Wetlands in the Eddy Waterfowl Production Area, Stutsman County, North Dakota, July 14, 1999. Photograph by David Mushet, U.S. Geological Survey.
Uplands
The upland areas of the Cottonwood Lake study area are primarily hummocky hill slopes and hill tops. The elevation within the Eddy WPA ranges between 551 and 577 meters (m) (Winter, 2003). Vegetation cover of the upland areas of the Cottonwood Lake study area (fig. 13) is primarily native grassland that has been invaded by smooth brome (Bromus inermis) and Kentucky bluegrass (Poa pratensis). Two areas of the study area were farmed prior to purchase of the area by the FWS. These two areas are approximately 42 ha in size and were replanted to a smooth brome and alfalfa (Medicago sativa) mix soon after purchase by the FWS to provide dense nesting cover for waterfowl (Swanson and others, 2003). A few stands of quacking aspens (Populus tremuloides) bordered wetlands P2 and P7 during the early years of the study, but these trees were flooded out during later high-water years. The remaining upland areas are dominated by short (<1 m) to tall (greater than [>] 1 m) shrubs.
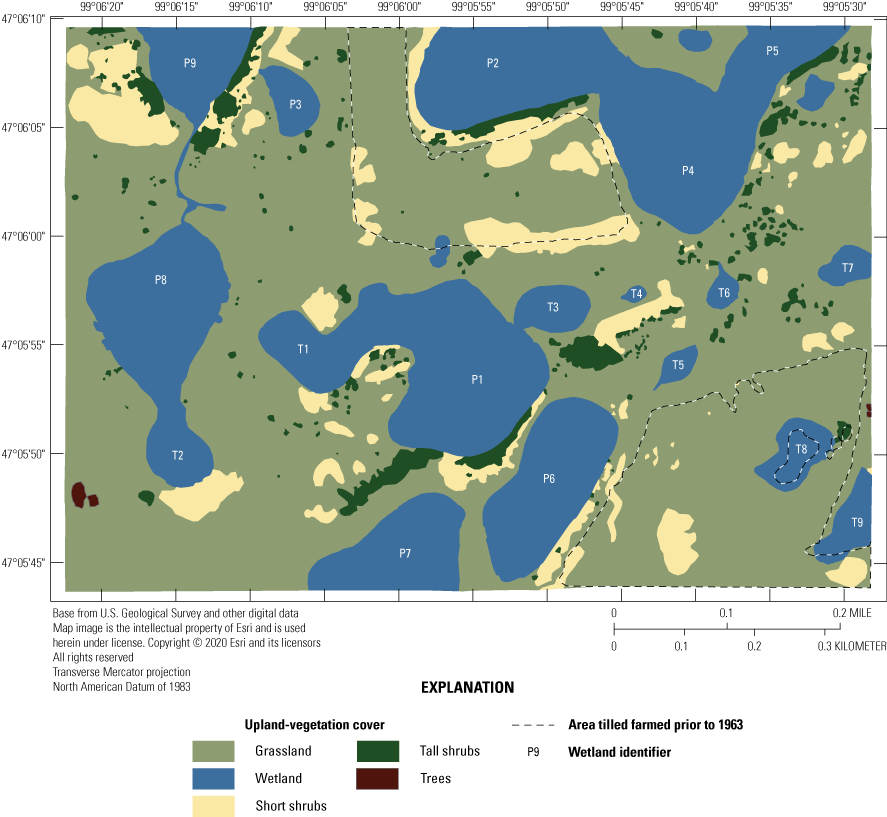
Upland-vegetation cover (2021) of the Cottonwood Lake study area, Stutsman County, North Dakota.
Wetlands
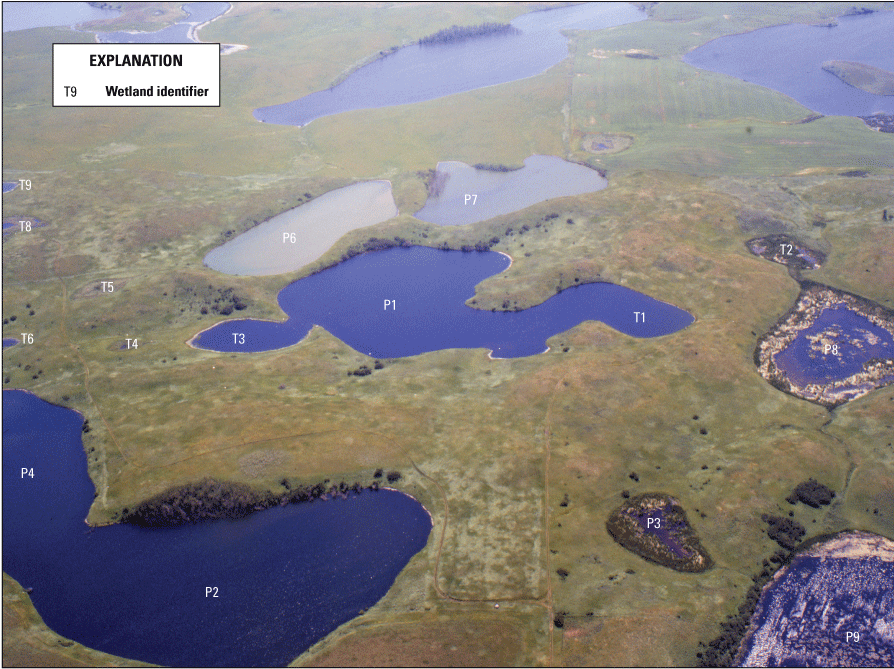
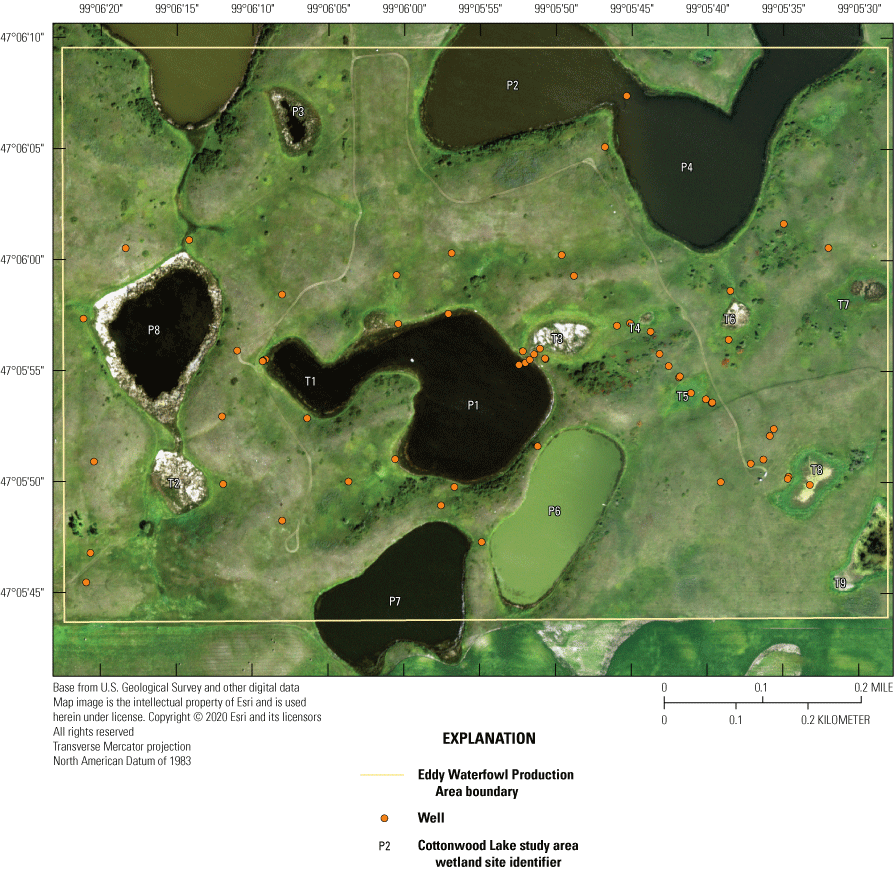
When originally established, 20 prairie-pothole wetlands were included in the Cottonwood Lake study area. These wetland areas were labeled T1 through T9, and P1 through P11 (figs. 2, 12). Wetlands T1–T9, P1–P4, and P6–P8 are located wholly or mostly within the boundaries of the 92-ha core area of the study area on the Eddy WPA (fig. 14). Wetland P5 is located mostly on private land that abuts the northeast corner of the Eddy WPA. Wetland P9 is similarly located mostly outside of the Eddy WPA on private land that abuts the northwest corner of the study area. Wetland P10 is located 1.6 km west of the core study area on the Moos WPA. Wetland P11 is the farthest from the core study area and is located in a topographic low 3.2 km west of the core study area on the Schuler WPA.
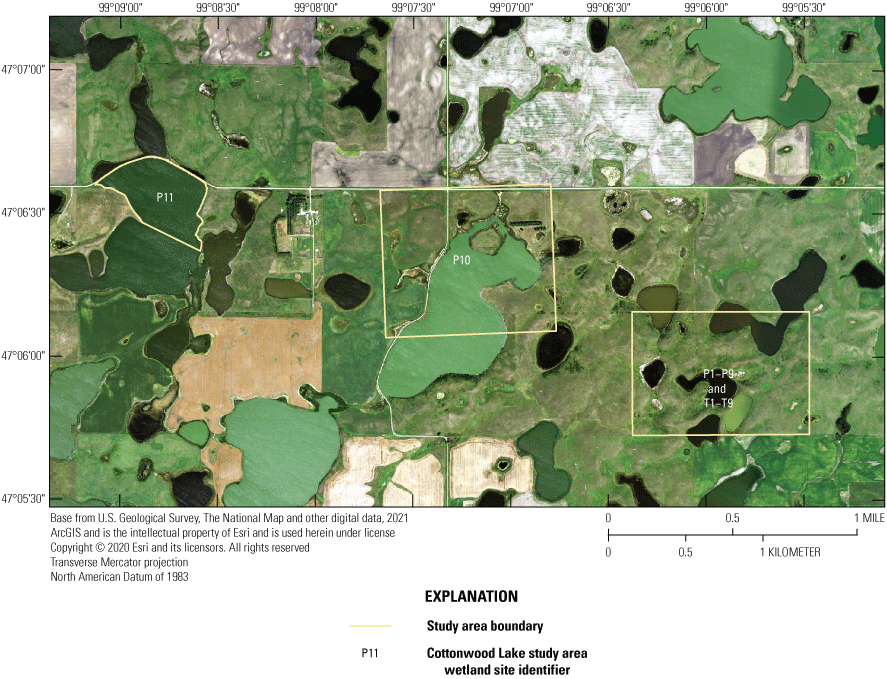
Prairie-pothole wetlands P1 to P11 and T1 to T9 forming the Cottonwood Lake study area, Stutsman County, North Dakota.
Local Climate
Climate is described as average meteorological conditions during a relatively long temporal period, usually 30 years (Arguez and Vose, 2011). We compared the most recent 30-year climate period (1992–2021) of the Cottonwood Lake study area to the previous 30-year period (1962 to 1991) by using temperature (fig. 15), precipitation (fig. 16), and Palmer Hydrological Drought Index (PHDI; fig. 17) data obtained from National Weather Service (NWS) archives (NOAA National Centers for Environmental Information, 2021). We also compared the 30-year climate period to the even longer historical period from 1885 to 1991. During the 1962 to 1991 period, the climate of North Dakota Climate Division 5, the climate division containing the Cottonwood Lake study area, had an average annual temperature of 4.3 °C. During this period, average annual precipitation was 448.6 millimeters (mm), and average monthly PHDI was 0.25. The average annual temperature for the period 1992 to 2021 remained the same at 4.3 °C. However, the average annual precipitation increased 9.5 percent to 491.2 mm and the average monthly PHDI increased 692 percent to 1.98 (NOAA National Centers for Environmental Information, 2021). The increase in precipitation and PHDI indicates a much wetter climate during the most recent 30-year period compared to the previous 30-year period.
The similar average annual temperature between the two periods likely resulted in similar evapotranspiration rates rather than increased rates that would be needed to ameliorate the water-input influence of increased precipitation. Eisenlohr and others (1972) determined the evaporation in the Cottonwood Lake area (about 800 millimeters per year [mm/yr]) was about 1.8 times greater than the average annual precipitation. Assuming a similar evaporation rate (about 800 mm/yr) given the similar average annual temperature between the 1962 to 1991 period and the 1992 to 2021 period, and the increase in precipitation to 491.2 mm/yr during 1992 to 2021, the difference in evaporation decreased to 1.6 times that of precipitation. This difference in the ratio between evaporation and precipitation has had a substantial effect on water levels of wetland ponds as detailed in the “Trends” section.
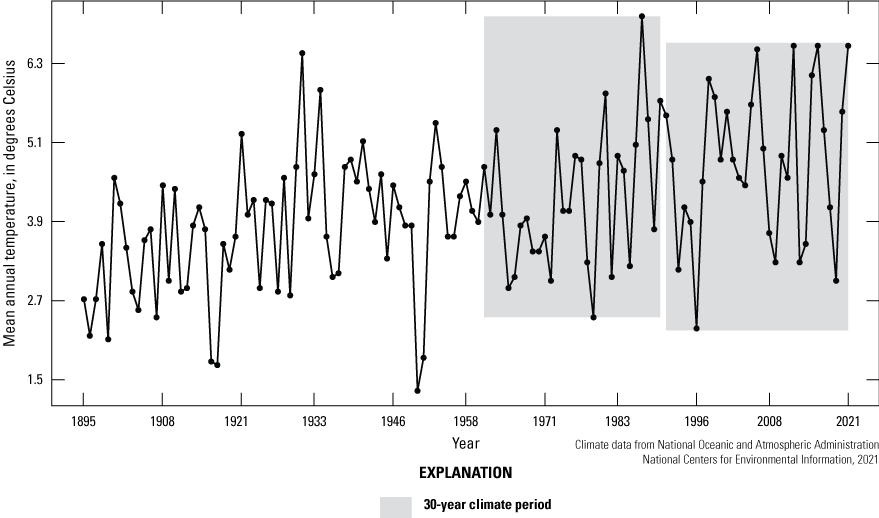
Mean annual temperature from 1895 to 2021 for North Dakota Climate Division 5, which includes the Cottonwood Lake study area.
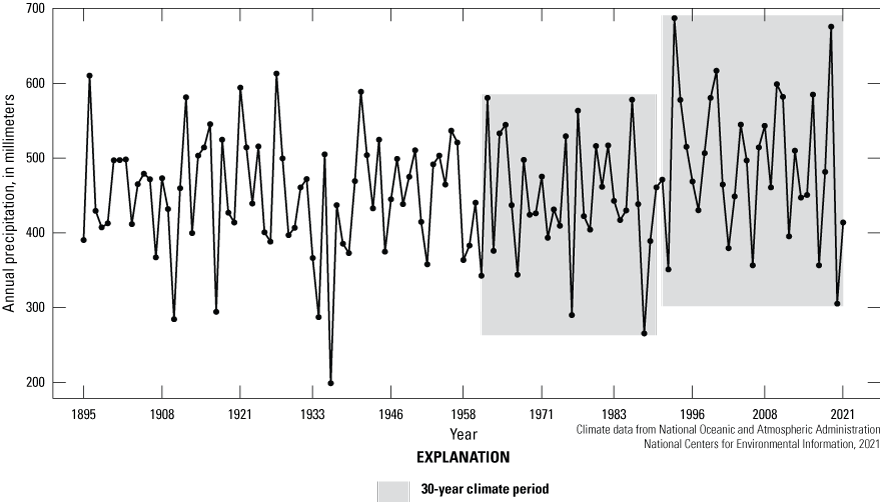
Annual precipitation from 1895 to 2021 for North Dakota Climate Division 5, which includes the Cottonwood Lake study area.
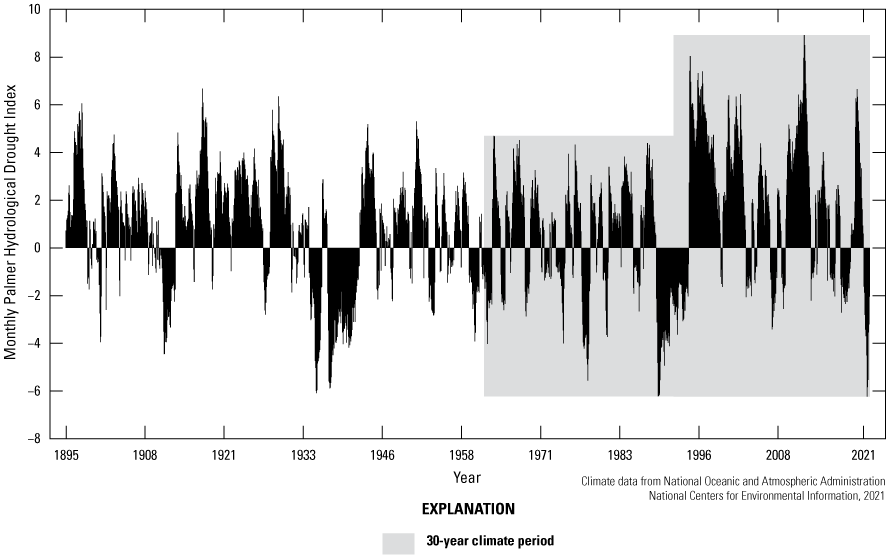
Monthly Palmer Hydrological Drought Index from 1895 to 2021 for North Dakota Climate Division 5, which includes the Cottonwood Lake study area.
At a finer spatial scale, Rosenberry (2003) described monthly and annual normal-climate conditions for the Cottonwood Lake study area based on averages from three nearby NWS stations during the 30-year period 1961 to 1990. The three weather stations were the Carrington, Jamestown Regional Airport, and Pettibone NWS stations located 39 km north, 39 km southeast, and 32 km west of the study area, respectively. Meteorological data (temperature and precipitation) from the three NWS stations were weighted by each station’s distance from the Cottonwood Lake study area. Monthly and annual climate conditions for the study area were recalculated using similarly weighted data for the two 30-year periods used above, 1962 to 1991 and 1992 to 2021. Data from the Pettibone NWS station used by Rosenberry (2003) were not available for the entire 1992 to 2021 period, so we replaced that station in our calculations for both periods with data from two additional NWS stations—one in Steele and one in Sykeston, N. Dak. (fig. 18; NOAA National Centers for Environmental Information, 2021). We calculated the local climate conditions (fig. 19) for the area based on weighted 30-year averages of meteorological data from the four NWS stations (NOAA National Centers for Environmental Information, 2021). As per Rosenberry (2003), weighting was based on the distance of each station from the Cottonwood Lake study area. During the 1962 to 1991 period, the temperature of the region averaged 4.34 °C with average annual precipitation of 377.3 mm. The average temperature increased to 5.01 °C and average annual precipitation increased to 439.7 mm in the 1992 to 2021 period. These changes in 30-year averages represent a 15.4-percent increase in temperature and a 16.5-percent increase in annual precipitation for the area’s climate.
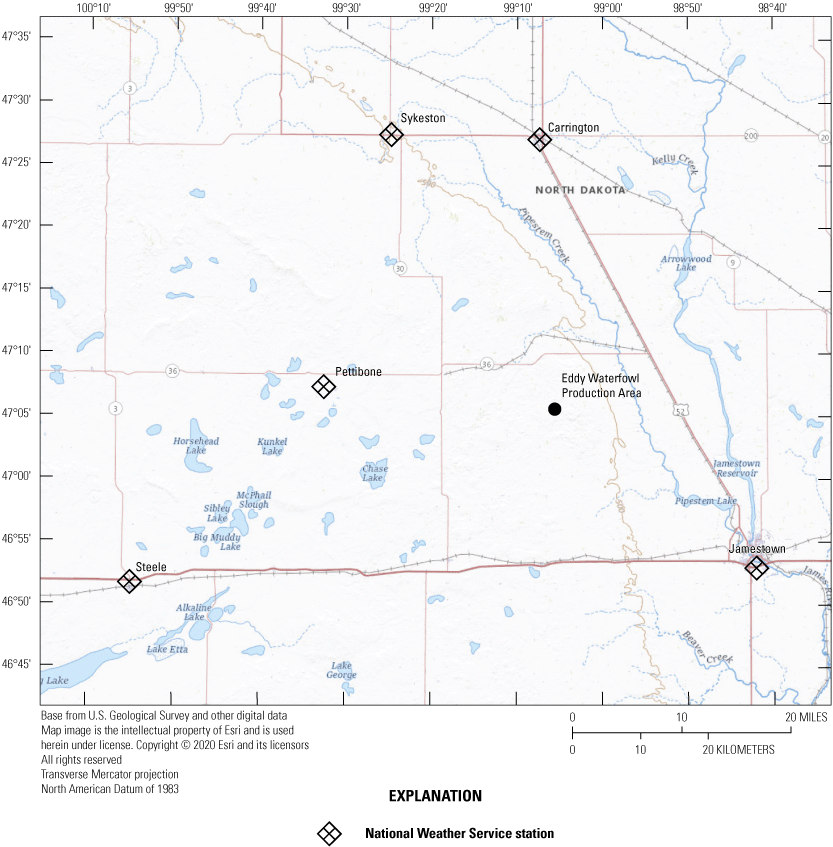
Locations of National Weather Service stations in Carrington, Jamestown, Pettibone, Steele, and Sykeston relative to the Cottonwood Lake study area. The Eddy Waterfowl Production Area is the site of the Cottonwood Lake study area.
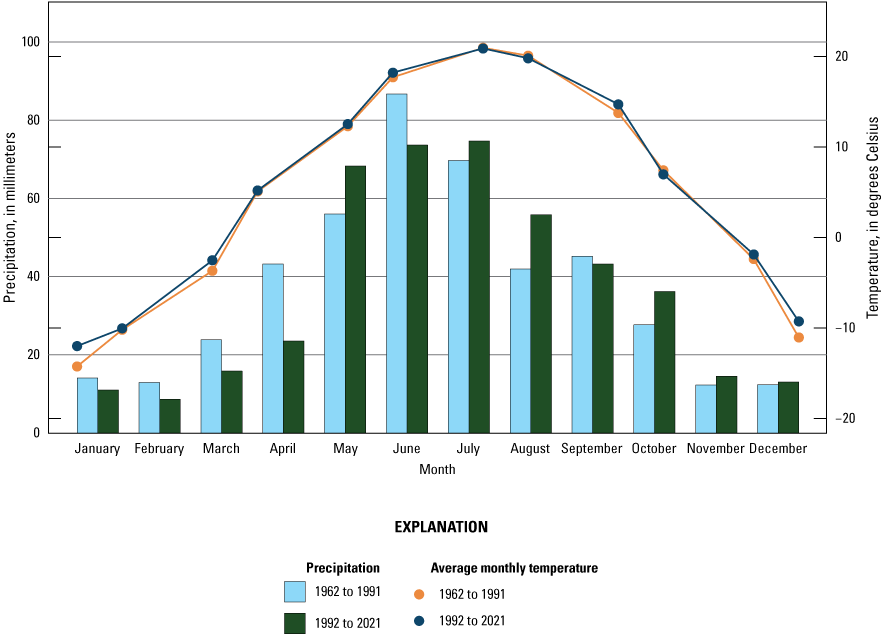
Average monthly temperature and precipitation for the Cottonwood Lake study area based on weighted data from four nearby National Weather Service stations (NOAA National Centers for Environmental Information, 2021).
Methods
Whereas individual, temporally limited research efforts at the Cottonwood Lake study area often employ data collection methodologies unique to the scientific question(s) of interest, longer-term data collection of environmental conditions and biotic communities at the study area have followed relatively consistent procedures to facilitate data comparisons across multiple years. In this report, we focus primarily on presenting results and findings from the long-term efforts. Methods used to collect these data are summarized in this section. Additionally, more detailed standardized operating procedures for pond-water chemistry sampling, monthly bird surveys, breeding-bird surveys, aquatic-macroinvertebrate sampling, and amphibian sampling are provided in appendixes 3–7, respectively. Data that support the results and conclusions presented in this report are available in 20 USGS data releases (Mushet and others, 2017a, b, c, d; Mushet and LaBaugh, 2017; Neff, 2017; U.S. Geological Survey, 2017; Bansal and Tangen, 2019a, b; Mushet, 2019a, b; Tangen and Bansal, 2019b; Mushet and others, 2022a, b; Mushet and Solensky, 2022a, b, c, d, e).
Groundwater
There are 66 groundwater-monitoring wells at the Cottonwood Lake study area (fig. 20) that were installed between 1978 and 1992 (Mushet and others, 2019b). These wells are used to determine groundwater levels and groundwater chemistry throughout the study area.
Levels
To determine groundwater levels at the Cottonwood Lake study area, the distance from the top of the well casing to water in each well was measured weekly from April through September, and monthly from October through March. All wells are surveyed to a common datum, and distance to water is converted to elevation (meters) to determine the configuration of the water table beneath the study area and the horizontal hydraulic gradient within the local groundwater system. In several locations, multiple piezometers, wells with a short (about 0.25 to 0.5 m) well screen designed to indicate hydraulic head at a specific depth in the groundwater system, were also installed. With two or more of these piezometers installed at two or more depths below the land surface at the same location, vertical hydraulic gradients can be determined. Distance to water was converted to elevation (meters) by subtracting the distance to water from the known elevation of the top of each well casing. Because many wells are relatively shallow and subject to movement during winter by frost in the soil, the elevation of the top of each well was resurveyed periodically to determine if the well casing had moved. If a well was determined to have moved or if a well casing needed to be repaired, the new elevation for the well measurement point was used in determining water-level elevations from that time forward.
Locations of groundwater-monitoring wells at the Cottonwood Lake study area, Stutsman County, North Dakota.
Chemistry
From 1980 to 1999, detailed chemical analyses of water collected from Cottonwood Lake study area groundwater wells were carried out to identify seasonal and interannual changes in water chemistry and to facilitate a better understanding of the effect of natural and human-modified climate variability on prairie-pothole wetland ecosystems. Groundwater samples collected before 1983 were analyzed using methods described in Swanson and others (1988). Data for 1983 to 1991 were analyzed by the USGS National Laboratory in Denver, Colo. Methods of analysis are described in Fishman and Friedman (1989). After 1991, samples were analyzed in a laboratory in Boulder, Colo., using procedures similar to those used at the USGS National Laboratory. In addition, temperature, specific conductance, and pH of water in selected wells were measured in the wells with a multiparameter probe between 1987 and 1995 (Mushet and others, 2017).
Surface Water
Stage
The stage of surface-water ponds in each Cottonwood Lake study area wetland was read and recorded once each week from permanently installed staff gages (fig. 21). Data were collected during each annual open-water period, which extends from the disappearance of ice covering the entire pond surface (known as “ice-out”; usually late March to early April) through the return of ice covering the entire pond surface (known as “freeze-up”; usually mid- to late October). Pond stages were not recorded during winter months when ponded water is frozen. Each staff gage was annually surveyed to a benchmark with a known elevation (typically a nearby groundwater-well casing) and readings were corrected for any movement of gages owing to ice or frost heave, or other disturbances that could change the gage position. During the course of the study, wetlands P1, T1, and T3, and wetlands P2, P4, and P5 merged into single bodies of water and had nearly identical stage elevations for those years.
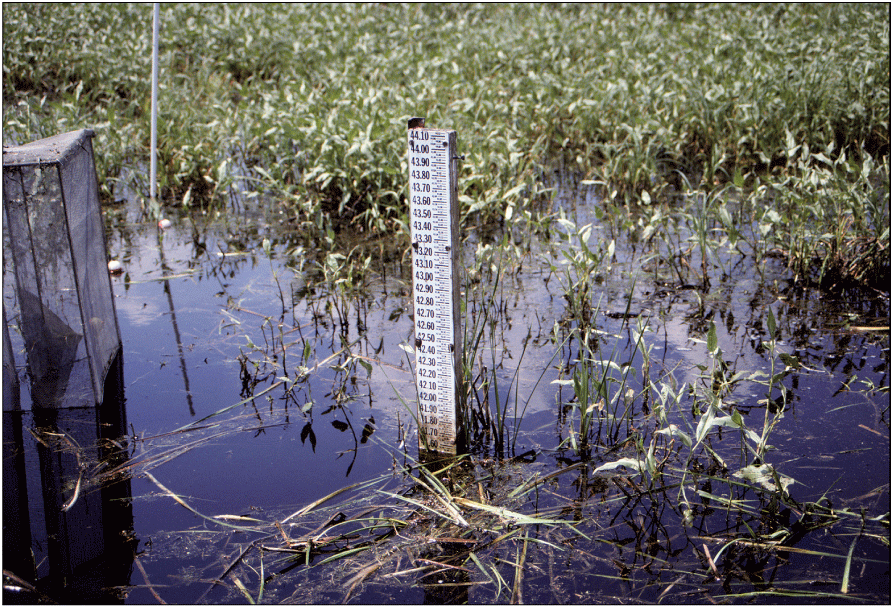
Staff gage in wetland T5 at the Cottonwood Lake study area, July 1997. Photograph by David Mushet, U.S. Geological Survey.
Chemistry
Water samples were collected sporadically (one or more times in a year but not in every year) from selected wetlands of the Cottonwood Lake study area starting in 1967 (Swanson and others. 1988). Beginning in 1979, a more formal water collection schedule was initiated that included sampling from all study area wetlands every 2 weeks. This schedule was maintained until 1983 when the sampling only occurred a few times during the year. From 1984 to 2002, water samples were collected monthly. Water samples were not collected from 2003 to 2015, but sample collection resumed in 2015 and continued to 2019. Throughout the study period, water samples were typically only collected during periods of the year when wetlands were ice-free (April through October) and when ponded water was present.
At the Cottonwood Lake study area, all wetlands have six transects labeled A through F radiating from the wetland center and extending to the upper edge of the wet meadow zone. Transect A was set at a randomly chosen 158 degrees. Transects B through F were set at 60-degree intervals clockwise from transect A (that is 218, 278, 338, 38, and 98 degrees, respectively) (fig. 22). Between 1979 and 2001, water samples were collected along transects A, C, and E or at the wetland center (Z) if the maximum water level was <25 centimeters (cm) (LaBaugh and others, 1987). After 2001, sampling was reduced to only a single transect (transect E), or the wetland center if the maximum pond-depth of a wetland was <25 cm. Prior to 1979, collection from one or two transects was common. In all years, water was collected at approximately the same location along each transect.
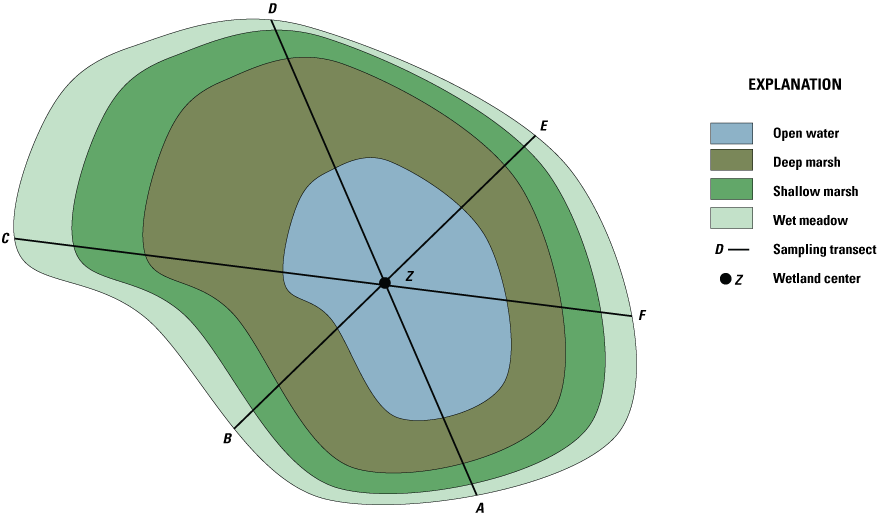
Generalized arrangement of sampling transects A through F established in wetlands of the Cottonwood Lake study area.
Water samples were collected using a water-column sampler (Swanson, 1978). Methods of analyses used until 1982 are described in Swanson and others (1988). After 1982, samples were analyzed at either the USGS National Water Quality Laboratory in Denver, Colo. (methods of analysis are described in Fishman and Friedman, 1989 or the Bureau of Reclamation Water Laboratory in Bismarck, N. Dak. (methods of analyses are described in Greenberg and others, 1992) for final analyses. Additional collection and analyses methods for surface-water chemistry are provided in appendix 3.
In addition to the detailed water-chemistry analyses, specific conductance was measured as an indicator of total dissolved ion concentrations in each wetland at the location of each staff gage every 2 weeks when stage gages were read. An Orion Model 126 conductivity meter with an Orion Model 012210 conductivity measuring cell was used from 1992 to 2007. A WTW Model 315i meter with a TetraCon® Model 325 conductivity measuring cell was used from 2008 to 2021. Meters were calibrated using single point calibrations and 1,000 microsiemens per centimeter (μS/cm) certified calibration standard solutions before use, and all measurements were corrected to 25 °C.
Plants
Uplands
Plant communities of the upland areas of the study area have not been well studied; however, a map of the study area’s upland vegetation was prepared in 1988 (Swanson and others, 2003). To identify major changes in upland plant communities, we used National Agriculture Imagery Program imagery collected in 2021 (USDA National Agriculture Imagery Program, 2022) and site visits to revise the 1988 map. In addition to these two maps, a complete inventory of plant species present in the Cottonwood Lake study area, wetland and upland, was prepared using data from random-walk surveys throughout the study area carried out multiple times between May and September each year from 1992 to 2001 (Mushet and others, 2004). Plant types were grouped into grasslands, forb dominated grasslands; short shrubs (woody shrubs less than 1.5 meters tall); tall shrubs (woody shrubs greater than 1.5 meters tall), and trees.
Wetlands
To estimate the percent cover of vegetative zones (open water, deep-marsh emergent, shallow-marsh emergent, wet meadow; Stewart and Kantrud, 1971) in Cottonwood Lake study area wetlands, vertical aerial photographs of each wetland were acquired during mid-July of each year. From 1975 to 2000, wetlands were photographed using a 35-mm camera, 50-mm lens, and 25-ASA film through the photography belly-hole of a Cessna 172 aircraft. From 2001 to 2015, a Kodak Professional model DCS 620-C digital camera with a 28-mm lens was used. From 2016 to 2021, aerial photography from the National Agriculture Imagery Program was obtained (USDA National Agriculture Imagery Program, 2022). For the digital photographs, we used a 200 ISO setting and the auto exposure setting of the digital camera to determine shutter speed and f-stop. Altitude of photography ranged from 300 m to 1,800 m above ground level; altitudes were varied as needed during a flight to ensure that the entire wetland was photographed. Aerial photographs were scanned (35-mm photographs) or imported (digital photographs) into georeferenced computer databases and major vegetative zones (Stewart and Kantrud, 1971) delineated using geographical information systems software. Vegetative zones delineated from photographs were confirmed by ground-truthing and recording plant species within zones of each wetland each summer. From 1992 to 2005, plant species and percent cover by species were recorded from three 1-square-meter (m2) plots located within each vegetative zone of each wetland along transects A, C, and E (fig. 22). Transects A, C, and E were used for the plant sampling unless a transect entered private property; in that case, sampling was carried out along the next closest transect. In addition to the aerial photograph delineations and plot sampling, in 1995 and each year from 2007 to 2010, we developed complete species lists for each Cottonwood Lake study area wetland by visually surveying and identifying plant species in each vegetative zone until no new species were detected (Mushet and others, 2002; Euliss and Mushet, 2011).
Invertebrates
Starting in 1992, aquatic macroinvertebrates have been sampled monthly (April through September) within each vegetative zone of each Cottonwood Lake study area wetland using vertically oriented activity traps (Swanson, 1978; fig. 23) and benthic core samplers (Swanson, 1983). Traps were placed and benthic cores were collected at random locations along each of the three permanent transects used in the collection of plant data (that is, transects A, C, and E) (LaBaugh and others, 1987). Random sample points for the placement of traps and collection of cores were selected using computer-generated random points along the length of each vegetation zone of each transect. Invertebrates were removed from activity traps after 24 hours and concentrated by pouring activity trap contents through a 0.5-mm screened plankton cup, which is then preserved in 80-percent ethanol. Preserved samples were transported to the NPWRC laboratory in Jamestown, N. Dak. Benthic core samples were washed in the field using a self-cleaning screen before being preserved with 80-percent ethanol and transported to the NPWRC Jamestown laboratory. Processing of all samples consisted of removing debris, sorting and identifying invertebrates to the lowest feasible taxa, counting invertebrates by taxa, drying counted invertebrates to a constant mass at 60 oC, and weighing to the nearest 0.0001 gram on an analytical balance to total weight (hereafter referred to as “biomass”). Taxonomic keys provided in Merritt and Cummins (1984) and Smith (2001) were used to aid in invertebrate identifications.
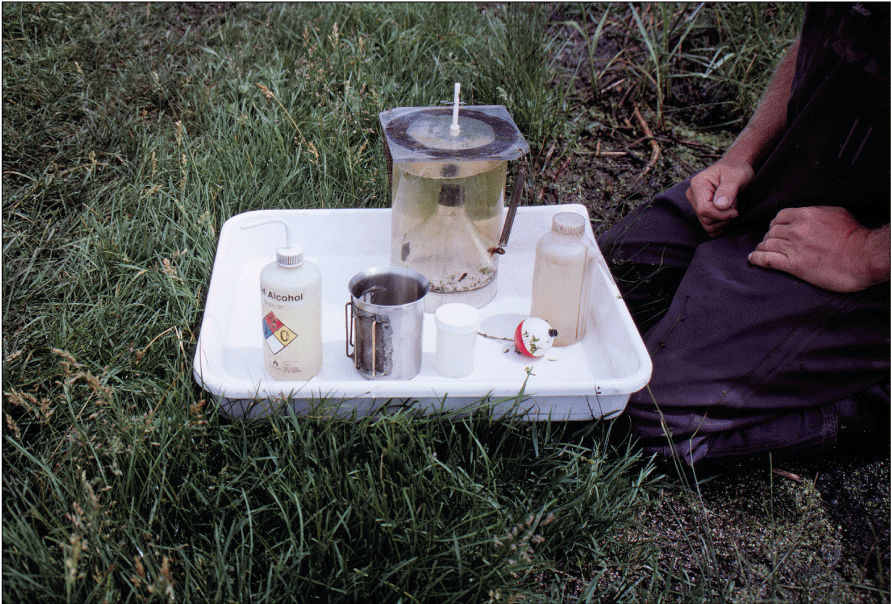
Activity trap after removal from a wetland and associated field-processing equipment used to sample aquatic macroinvertebrates at the Cottonwood Lake study area, Stutsman County, North Dakota, July 1997. Photograph by David Mushet, U.S. Geological Survey.
Amphibians and Reptiles
Amphibian funnel traps (fig. 24; Mushet and others, 1997) were used to sample amphibians in each wetland over a continuous 5-day period each month from May through September starting in 1992. Traps were placed along three (A, C, and E) of the permanently established transects in each wetland. A random sample point was identified for the placement of traps using computer-generated random points along the length of each transect between a water depth of 10 and 90 cm. Each trap had a 2-m drift fence that was oriented parallel to the shoreline when traps were set. During each sample week, funnel traps were set on day one and checked for captures each successive morning (that is, days two through five) for the 5-day period. All captured animals were handled as little as possible. Data collected consisted of species, numbers of individuals, sex, and developmental stage (larval, adult) of captures. Although reptiles were not a specific target of sampling at the study area, any reptiles captured during amphibian sampling were recorded.
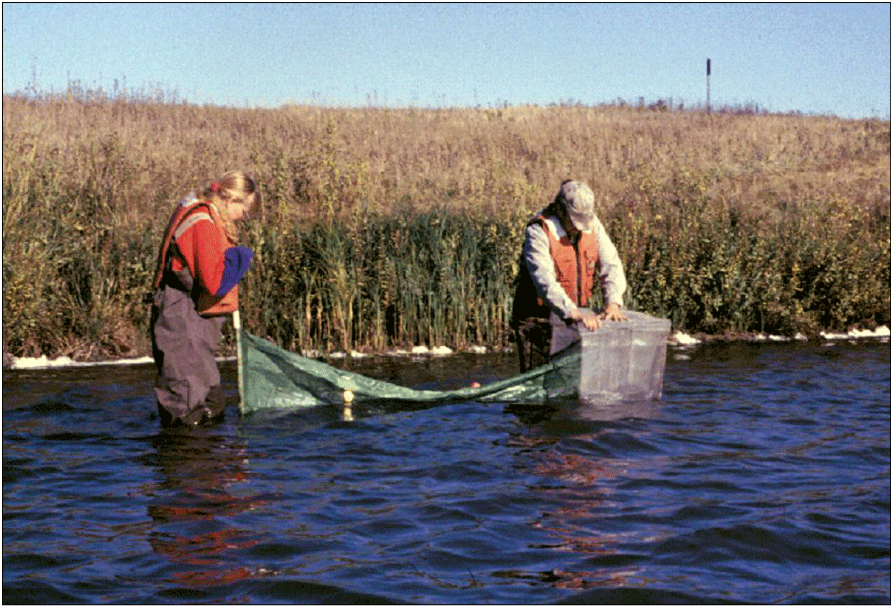
U.S. Geological Survey scientists setting an amphibian trap in wetland T1 of the Cottonwood Lake study area, Stutsman County, North Dakota, during a high-water year, September 2003. Photograph by U.S. Geological Survey.
Fish
Fish are not routinely sampled in study area wetlands because they were historically absent from most wetlands in the PPR, including all Cottonwood Lake study area wetlands. However, from the invertebrate and amphibian sampling carried out in the study area’s wetlands, we were able to determine fish presence and absence (fig. 25). Thus, when fish started to appear in wetlands, their presence was readily apparent as captures in invertebrate and salamander traps. Similar to reptiles, fish captured while sampling other taxa since 1992 were noted and recorded. Additionally, in the resampling of wetlands carried out by McLean and others (2016), four study area wetlands were sampled for fishes.
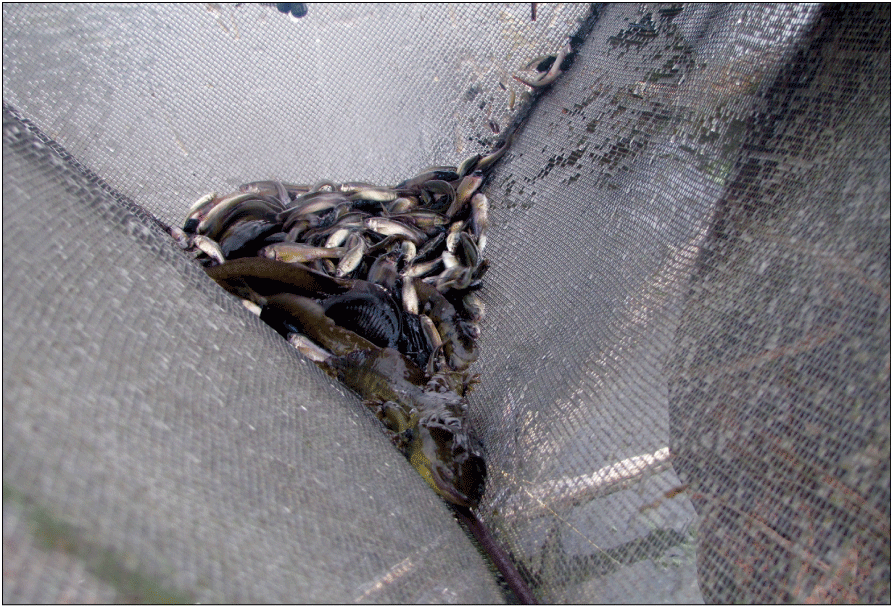
Fathead minnow (Pimephales promelas) and barred tiger salamander (Ambystoma mavortium) captures in an amphibian trap, June 22, 2012. Photograph by Kyle McLean, U.S. Geological Survey.
Birds
Monthly Bird Counts
Starting in 1992, all birds were counted in each Cottonwood Lake study area wetland at monthly intervals from April 1 to September 30. Birds observed in the open-water zone of each wetland were counted first by scanning a wetland from high vantage points. The perimeter of each wetland was then walked to flush birds from vegetated areas. Care was taken to note flushed birds that land in wetlands that have not yet been surveyed. Flushed birds that land in these nonsurveyed wetlands were subtracted from the counts of those wetlands when they were later surveyed so that these individuals were not double counted. For each species, the number and sex of individuals in each wetland were recorded. It should be noted that complete counts of some small passerines (for example, marsh wrens), secretive marsh birds (for example, rails), and female birds on nests might not be obtained using these methods. To avoid bias resulting from differences in the temporal use of wetlands by birds, bird surveys were carried out during the same time frames (between sunrise and 10:00 a.m. Central Daylight Savings Time) on sample days.
Breeding-Bird Surveys
To describe breeding-bird use of wetlands at the Cottonwood Lake study area, observers walked the periphery of each wetland and mapped the locations of singing male songbirds and all waterfowl on an aerial photograph of each wetland. Surveys were initiated near daybreak and completed before 10:00 a.m. Central Daylight Savings Time to coincide with optimal singing times of territorial male songbirds. Each wetland was surveyed 12 times each year between late May and early June. The 12 surveys were completed within a 12- to 15-day period to avoid bias from temporal shifts in territorial boundaries of male songbirds (Bibby and others, 1992). Surveys were not carried out on mornings with high winds (that is, >24 kilometers per hour), during heavy precipitation events, or when temperatures were >27 oC. The number of indicated pairs for each species in each wetland was calculated as a yearly measurement of breeding-bird use of each study area wetland. The criteria used to indicate pairs were (1) singing males for songbirds except blackbirds, (2) territorial males for blackbirds, (3) observed pairs or lone drakes for waterfowl, and (4) observed pairs of all other birds. Additionally, indicated pairs were included in yearly measurements only if they were counted at least three times at a wetland during the survey period. Note that bird surveys, both monthly bird counts and breeding-bird surveys were initiated in 1992 and not carried out in 2020 owing to fieldwork restrictions associated with the COVID–19 pandemic.
Mammals
Of all the taxa present at the Cottonwood Lake study area, mammals are perhaps the least studied. Mammals are not routinely sampled at the study area and information on their occurrence was derived exclusively from observational information obtained while performing other research work at the study area.
Greenhouse Gases
In order to measure and understand greenhouse gas (GHG) fluxes and their key abiotic, hydrologic, and biotic drivers, gas samples were collected from wetlands and wetland catchments of the Cottonwood Lake study area from 2009 to 2016. Samples and data generally were collected once every 2 weeks during the approximate growing season, although some samples were collected during the dormant season and ancillary samples were collected during specific periods to support targeted research questions. Field and laboratory methods described in this section follow those of Gleason and others (2009), Finocchiaro and others (2014), Tangen and others (2015), and Bansal and others (2018). Data from the GHG research are included in a comprehensive USGS data release by Tangen and Bansal (2019b).
Catchment sample locations were positioned along a transect (figs. 26A) that spanned the hydrobiogeomorphic gradient from the central wetland zone (for example, open water, shallow marsh) to the catchment boundary (for example, upland shoulder slope; fig. 26). Five sample locations (locations 1–5) were equally distributed between the central wetland zone and the approximate wetland edge at the upland transition zone (fig. 26B; wet-meadow/low-prairie transition point). Three sample locations (locations 6–8) were located in the approximate toe-, mid-, and shoulder-slope positions of the uplands (fig. 26B. The static-chamber approach (Livingston and Hutchinson, 1995) was used to collect midday (that is, 11:00 a.m.–2:00 p.m.) gas samples, which represented daily average flux rates (Bansal and others, 2018). Gas-collection chambers (20-cm diameter, 20-cm height) and chamber bases (20-cm diameter, 15-cm height) were constructed using opaque polyvinyl chloride (PVC). At each sample location, the PVC chamber bases were annually installed to a depth of 10 cm at the beginning of each field season where water levels were shallow (<5 cm). To collect gases when water depths were less than or equal to 5 cm, the chambers were securely placed onto the bases. To collect gases when water depths exceeded 5 cm, the chambers were attached to floats and deployed using a pully system or from permanent docks to avoid disturbing sediments and inducing artificial ebullition. Ambient air samples were collected at the onset of sampling to estimate baseline (time zero) gas concentrations. The collection chambers were deployed for approximately 30 minutes, after which headspace gas samples were collected with a syringe and transferred to pre-evacuated 10-milliliter glass bottles.
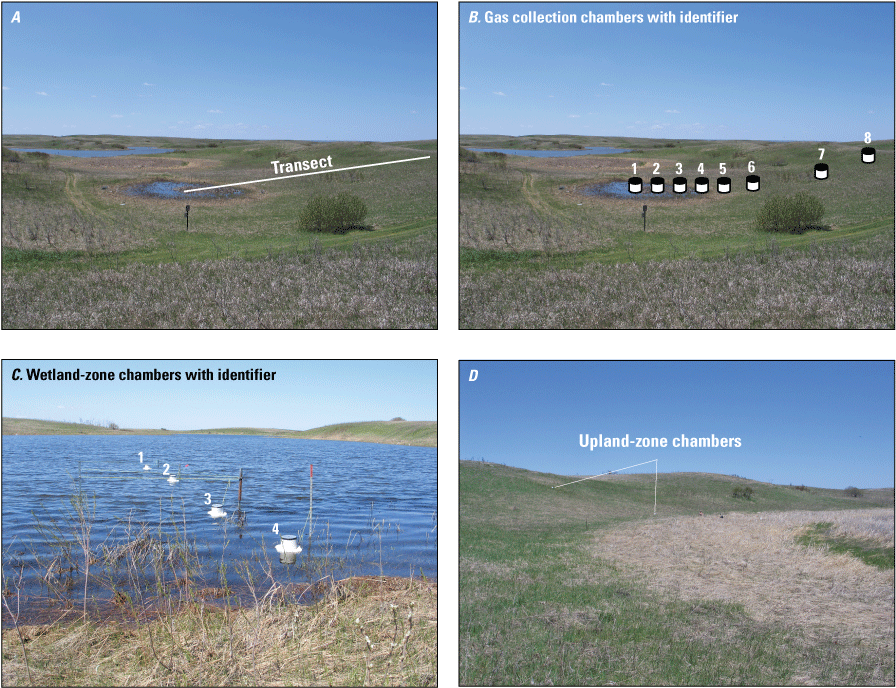
Locations of gas-sampling chambers at the Cottonwood Lake study area. A, Generalized location of a sampling transect spanning the hydrobiogeomorphic gradient from the central wetland zone to the catchment boundary. B, Generalized locations of eight sample locations (that is, cylindrical gas collection chambers) for collection of gas samples. C, Example of floating chambers in a wetland zone. D, Example of upland sample locations. Photographs by U.S. Geological Survey.
Gas samples and known standards were analyzed for determination of carbon dioxide (CO2), methane (CH4), and nitrous oxide (N2O) concentrations within 3 weeks of collection using a gas chromatograph equipped with electron capture and flame ionization detectors (SRI 8610C, SRI Instruments, Torrance, California). Carbon dioxide, CH4, and N2O fluxes (grams per square meter per hour) were calculated using the change in concentration of each gas (difference between ambient and chamber end time concentrations), length of time that the chamber was set, molecular mass of each gas, collection chamber area and volume, air temperature and pressure during sampling, and the Ideal Gas Law constant (Badiou and others, 2011; Finocchiaro and others, 2014; Bansal and others, 2016). During each sampling event, covariates air temperature, soil or water temperature, soil moisture content, and water depth were measured and recorded. Soil samples also were collected once during the study for determination of bulk density and for analysis of chemical constituents such as soil organic carbon (SOC). In addition to the standard GHG sampling, specific wetlands and time periods were targeted for collection of samples to determine the concentration of GHGs dissolved in the water column. Samples were collected using pumping-induced ebullition (Browne, 2004) or the headspace equilibrium method (McAuliffe, 1971) and analyzed on the gas chromatograph.
Trends
Climate
One of the most obvious changes at the Cottonwood Lake study area during the period of study was an increase in precipitation that began in 1993 (fig. 27). This precipitation increase was similar to the increases (fig. 16) seen over a larger region (for example, Ryberg and others, 2016a). The cumulative departure from normal (based on weighted averages from four nearby NWS stations during the 30-year period 1962 to 1991) rose each year between 1993 and 2011. Only in the last 10 years has the departure started a downward trend; however, the cumulative departure is still much higher than when the precipitation increases began in 1993. One result of the precipitation increases is reflected in the water levels of the wetlands at the study area.
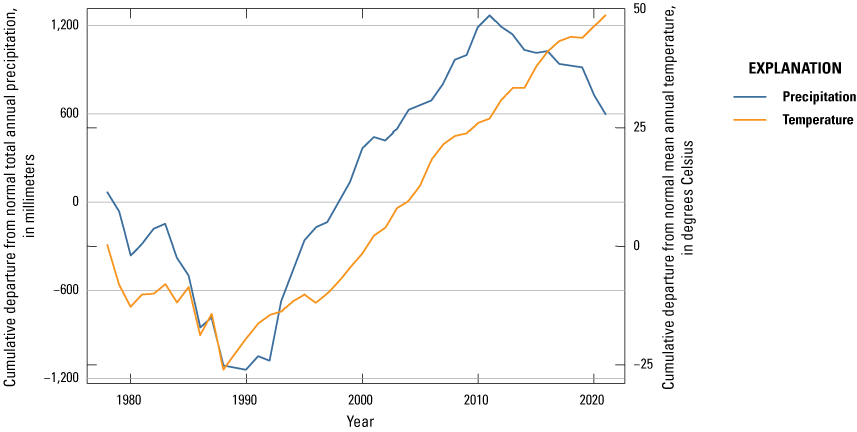
Cumulative departure from normal annual air temperature and precipitation for the Cottonwood Lake study area based on weighted data averaged from four nearby National Weather Service stations, 1979 to 2021 (NOAA National Centers for Environmental Information, 2021).
Whereas the normal annual temperature was similar between the 1962 to 1991 period and the 1992 to 2021 period (fig. 15), the cumulative departure from normal increased across the entire 30-year period from 1992 to 2021 (fig. 27). Given the recent downward trend in precipitation and continued climb in temperatures, water levels have recently (2021) started to decline in the semipermanently and permanently ponded wetlands at the study area.
Although prairie-pothole wetlands depend on snow drift and snowmelt runoff as primary water inputs, another key influence on water levels in prairie-pothole wetland is the intensity of summer rainfall events. Except during the spring month when soils are typically saturated, runoff from surrounding uplands is low except during heavy or very heavy precipitation events; however, in the spring months, runoff can be high if pore water in soils is still frozen. The runoff in spring is even higher in years when the previous October was wet and contributed to the formation of the impervious ice seal in the soils (McKenna and others, 2017). Comparing the 1962 to 1991 climate period to the 1992 to 2021 climate period, we determined an increase in the number of heavy and very heavy precipitation events (fig. 28), which would contribute to increased runoff to the wetlands even if annual precipitation remained unchanged. Additionally, the timing of precipitation is important. As mentioned previously in the section, a wet October is key to the formation of an ice seal in the upland soils surrounding wetland basins. In the analyses, we identified an increase in the amount of precipitation in October (fig. 29).
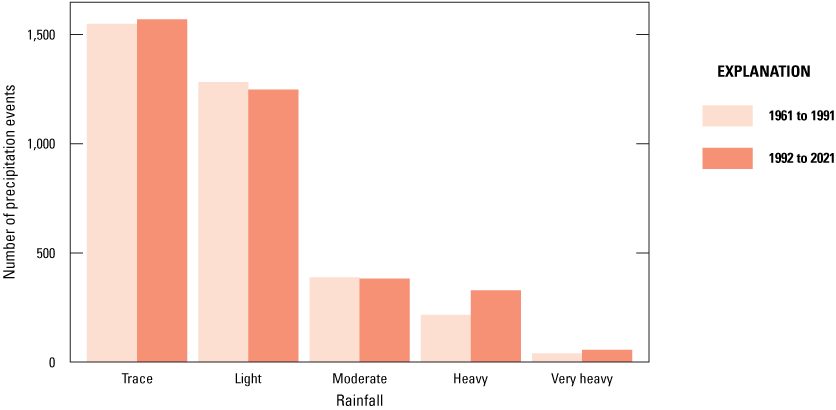
Number of precipitation events by intensity categories based on weighted data from four nearby National Weather Service stations, 1962 to 2021 (NOAA National Centers for Environmental Information, 2021).
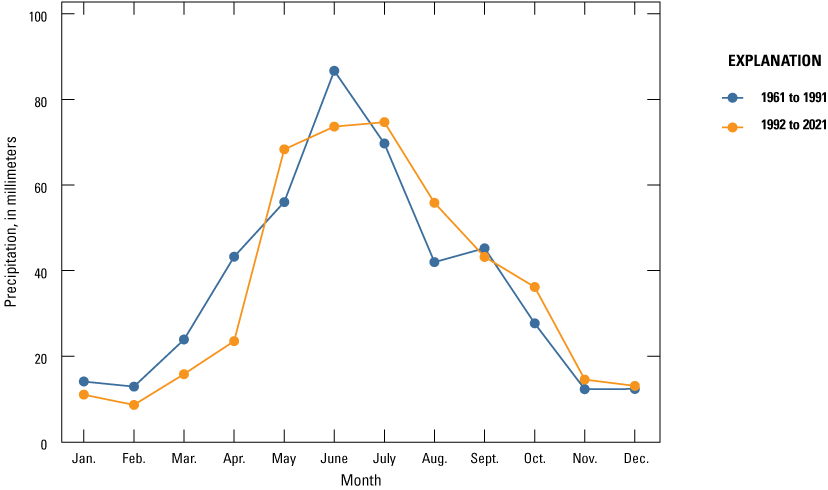
Normal monthly precipitation based on averages of weighted data from four nearby National Weather Service stations, 1962–91 and 1992–2021 (NOAA National Centers for Environmental Information, 2021).
Precipitation increased in May and October. In addition to the frost seal in early spring, soils are often saturated in the spring as a result of snowmelt, thus rainfall in May runs off at a greater rate than runoff in later months when the soils are less saturated. Similar to October, we identified an increase in precipitation during the month of May (fig. 29). The increase in May precipitation, along with the increased precipitation in October, likely contributed to a change in the amount of precipitation that contributed to wetland basins as surface runoff (McKenna and others, 2017).
Groundwater
As previously discussed in the “Study Area” section, glacial till has very low hydrologic conductivity except in the very fractured upper most 4–5 m (Hayashi and others, 2016). Change in groundwater elevations at the Cottonwood Lake study area was examined using the 30 wells that had continuous data records extending from 1980 to 2021. We standardized the 1980 level of these wells to zero and determined that the level of groundwater increased by approximately 2 m after 1993 compared to the 1980 levels (fig. 30). Compared to the 1992 levels, which were approximately 2 m lower than 1980 levels, the increase after 1993 was approximately 4 m. The increased groundwater elevations during the recent wet period likely contributed to increased groundwater inputs into wetlands as portions of the study area with groundwater flowing within the highly fractured upper 4–5 m increased, especially near and between adjacent wetland basins.
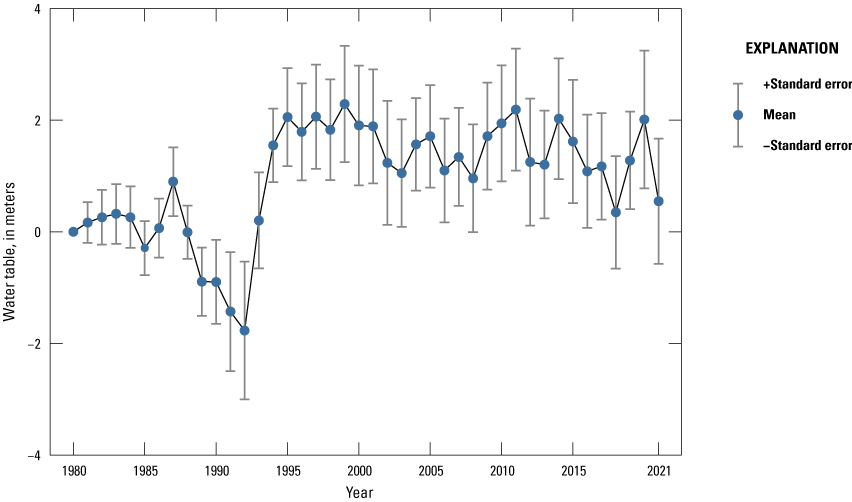
Change in groundwater levels of 30 wells installed between 1978 and 1980 at the Cottonwood Lake study area, Stutsman County, North Dakota, relative to 1980 levels.
Surface Water
Stage
The combination of increased annual precipitation, changes in seasonality of the precipitation, increased heavy precipitation events, and higher groundwater levels all contributed to increases in ponded-water levels in wetlands of the Cottonwood Lake study area after 1993 (fig. 31; appendix 8). Although the effect of annual climate on pond stage for wetlands without a surface outlet was intuitive, resulting in shallow or dry pools during periods of drought and deeper pools during periods of deluge, the relationship between annual climate and ponded-water level was more complex in wetlands that lost water as overland spill.
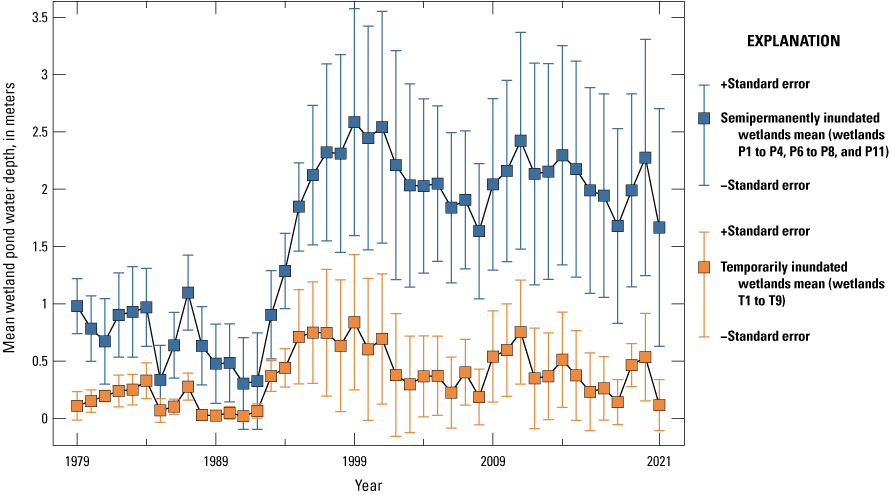
Maximum yearly water depth of wetland ponds at the Cottonwood Lake study area, Stutsman County, North Dakota.
A positive relation existed between pond stage and a wetland’s unique position in the hydrological landscape (Euliss and others, 2004). Recharge wetlands high in the hydrologic landscape commonly dried each summer and were refilled the following spring by snow drift and snowmelt runoff (that is, they were temporarily or seasonally ponded). Drier periods reduced spring refilling and shortened the pond permanence further. Likewise, wetter periods caused some recharge wetlands to contain water year-round, with some for multiple years. Closed-basin wetlands simply became deeper or shallower as climate cycled between wet and dry periods. The same relation held true for open-basin wetlands low in hydrologic position until pool levels reached the elevation where water flowed out of the wetland basin. At that spill point, water depth stabilized because further increases were not possible. Consequently, stage fluctuations in open-basin wetlands (P3, P8, T2, T4, T5, T6, T7, and T8) were less dynamic than in their closed-basin analogues (appendix 8). Apart from wetland T9, all recharge wetlands were open-basin wetlands for which variation in stage was minimal relative to their closed-basin analogues.
Wetland P8 received a large volume of groundwater, in part because the glacial material is coarser adjacent to the wetland and can transmit more water, but primarily because P8 has a large catchment and an open basin that is topographically lower than all other wetlands included in the study area, except for wetlands P9, P10, and P11. The presence of a surface-water outlet in wetland P8 allows loss of water by way of the outlet to wetland P9 that prevents wetland stage from rising in response to larger amounts of groundwater discharge and reduces interannual fluctuation in pool depth. Additional complexity to the hydrologically driven dynamics was created when wet periods caused rising pond levels in several closed-basin wetlands to flood into adjacent wetland basins that otherwise would have been higher in elevation (for example, wetlands P1 and T3, and P2 and P4). The merging of wetlands (fig. 32) zeroed existing hydraulic gradients between the merged wetlands, eliminating the seasonally variable, nearshore, hydrogeological dynamics that normally occurred between the adjacent wetlands (Rosenberry and Winter, 1997).
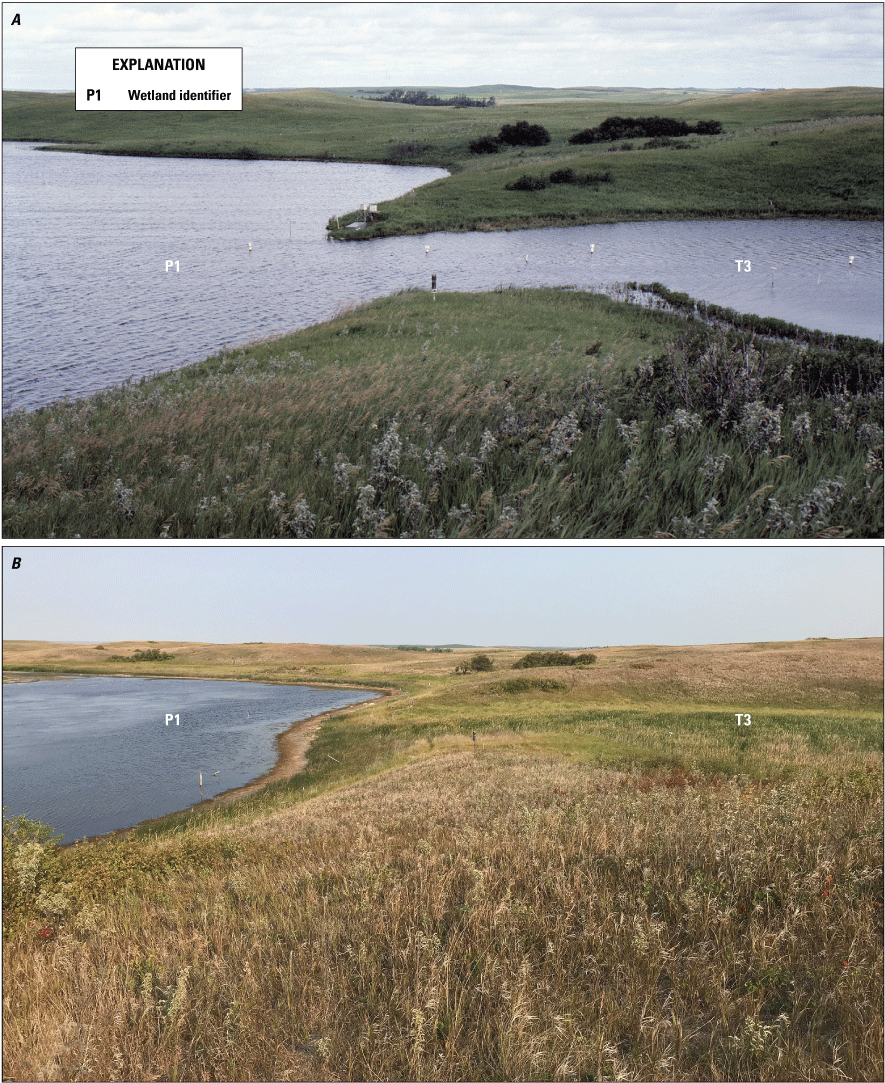
Some wetlands at the Cottonwood Lake study area merge during periods of high pond levels. A, Merged wetlands P1 and T3 in July 1999. B, Wetlands P1 and T3 in June 2021 as separate ponds. Photographs by David Mushet, U.S. Geological Survey.
Variable inputs of atmospheric water and water loss to evapotranspiration and seepage to groundwater affected the length of time that Cottonwood Lake study area wetlands were ponded (that is, their pond permanence) during the period of investigation (1967–2021). Like pond stage, pond permanence lengthened with type of interactions of individual wetlands with groundwater; pond permanence of recharge wetlands varied annually in response to yearly variation in precipitation, whereas other wetlands tended to respond on a longer inter-annual scale (appendix 8). Pond permanence of all wetlands was lengthened owing to the generally wet conditions during the latter 29 years of our study, with most semipermanently and permanently ponded wetlands (hereafter referred to as “P wetlands”) being ponded year-round since 1993; wetland P3 is the only P wetland with a pond that completely dried during this period. The open-basin recharge wetlands displayed considerable variation in pond permanence, whereas larger wetlands, including flow through wetland P8, had longer pond permanence during the period of study.
Pond permanence for all wetlands was reduced in the dry period of 1988 to 1992 before the deluge of 1993 that cycled the region from a drought of comparable severity to the dust bowl days to possibly a 500-year wet period (fig. 17; Winter and Rosenberry, 1998). The smaller temporarily and seasonally ponded wetlands (hereafter referred to as “T wetlands”) displayed more variation in pond permanence during the study period, likely a result of their smaller size and water volume, and water loss by way of evapotranspiration and flow to groundwater. The variable rise and fall of water level and varying pond permanence of each wetland was a major factor affecting the ecology of individual wetlands within the Cottonwood Lake study area.
For wetlands situated in lower-gradient basins, interactions between groundwater and evapotranspiration in the nearshore margins enhanced wetland stage changes and increased the sensitivity of hydroperiod to climatic cycles. During dry periods, evapotranspiration lowered groundwater levels, which allowed ponded water to flow to adjacent groundwater, increasing the rate of wetland stage decline and shortening hydroperiods. During wet periods, groundwater elevations increased substantially more than wetland stage and increased rates of groundwater discharge to wetland ponds, increasing wetland stage rise and further enhancing hydroperiods. Evapotranspiration still occurred but resulting drawdown of groundwater adjacent to wetlands was either greatly reduced or was overwhelmed by greater volumes of groundwater that flowed laterally to replace water lost to evapotranspiration (Rosenberry and Winter, 1997).
Chemistry
Seasonal trends in the salinity (measured as specific conductance) of water in the wetland ponds (appendix 9) followed the same general pattern throughout the period of study. Salinity is lowest in the spring at the time when snow and ice melts. As pond sediments thaw along with soils in the uplands, salinity increases in the pond because of solute input made possible by diffusion from the pond sediments; movement of solutes through soils and till around the pond; and, in ponds located in discharge areas of the adjacent groundwater-flow system, movement of solutes from groundwater flow into the pond. Salinity generally increases from spring to autumn as ponds declined in volume owing to loss of water by evaporation. In a similar fashion, increases in volume associated with intense rainfall generally result in decreases in salinity of the ponded water; however, trends in salinity of pond water are not simply a function of the relation between pond water lost by evaporation or gained by rainfall and surface runoff into the pond from the upland. Other processes such as groundwater input of solutes, loss of solutes by a surface outlet, or pond-water flow into groundwater also affect salinity in the ponds from spring to autumn.
During autumn, in those wetland basins containing ponds, as the ponds freeze the water below the ice increases in concentration as solutes are frozen out of the ice. Solutes originally in pond water are incorporated into water in pond sediments as the ice above the sediments and then the sediments freeze. Shallower ponds usually freeze solid so only the deeper ponds contain water throughout a winter. In either case, the salinity of pond water below the ice is generally greater than salinity of pond water typically observed from spring to autumn. Although the general seasonal pattern of changes in specific conductance in wetland ponds persisted during the period of observation, there were differences in salinity changes in the ponds as a response to drier or wetter year-to-year conditions. Such differences reflected the relation of ponds to groundwater, potential to lose water through a surface outlet, or loss of salts by wind erosion when a pond was completely dry.
Salinity of the pond of recharge wetlands, which only loses water to groundwater and evaporation, was relatively consistent across the years of observation. These wetland ponds are situated high in the groundwater-flow system and do not accumulate solutes because pond water drains to underlying sediments and groundwater as the ponds diminish and dry.
Seasonal, flowthrough wetlands T3, T4, and T6 had ponds containing generally larger solute concentrations than the recharge wetlands. Salinity of these wetlands was related to input from their surrounding catchment; shallow groundwater flows; and, in a few settings, from infrequent or intermittent input from upstream open-basin wetlands, thereby providing solute inputs. In addition, at higher pond levels water can leave these wetlands by surface flow to an adjacent basin. Variation in salinity in the ponds of wetlands T4 and T6 reflected variations in pond levels through the wetter years. Once the pond of wetland T3 merged with the pond of wetland P1, the salinity of the merged pond followed the trend noted in the discussion of wetland P1 in the following paragraph.
In the pond of wetland P8, with the onset of declining pond levels in the drier years of 1988 to 1992, for the months when the pond was free of ice, salinity at the end of autumn was higher each year than in the preceding year with the largest values occurring in 1992. Thus, there was a general increase in salinity as the pond of wetland P8 decreased in volume during the drier years. In contrast, the largest specific conductance in the pond of wetland P1 when the pond was ice free occurred in 1989. As the pond of P1 declined in subsequent years, the direction of groundwater flow to the pond periphery changed such that some pond water flowed into groundwater, thereby removing salts. The salinity of the pond of wetland P11 peaked during the drier years in 1990, with the pond completely dry before autumn, which was a situation that also occurred in 1991. The dry pond sediments and salts were removed by wind erosion such that salinity of the pond declined in 1991 and 1992 from the peak of 1990.
With the wetter conditions beginning in 1993, salinity of the pond of wetland P8 was generally greater at the end of the open-water period in the next several years, and this trend was more noticeable than in the ponds of wetlands P1 and P11. The basin of wetland P8 receives input more readily from groundwater than the other two wetlands because of a sand lens, groundwater input from solutes from the till. During 1993 to 2001, when the pond was ice free, salinity of the pond of P8 fluctuated within a range generally larger than before 1988, increasing seasonally from spring to autumn as pond levels declined. The presence of a low spill point in the basin of wetland P8 allowed for loss of solutes in the wetter years because water and solutes could leave the basin by flow across the land surface to an adjacent basin, wetland P9.
With the onset of wetter conditions, salinity of the pond of wetland P11 was generally similar from year-to-year beginning in 1994. A very gradual increase in peak values during the open-water season started in 2001 as pond levels began to decline. The peak values, however, remained at values similar to the smaller values observed in the pond after spring thaw in the years preceding 1988. The removal of some of the salts from the pond sediments owing to wind erosion in the dry years likely diminished the amount of solute input from diffusion for the pond in the wetter years. As pond levels increased, thereby inundating adjacent upland, the area of upland submerged provided a source of solutes from the till and increased area of groundwater input, but not enough to result in a marked increase in salinity in the pond during the wetter years.
Following the pronounced increase in pond levels in wetland P1 associated with the onset of wetter conditions beginning in 1993, salinity in terms of total dissolved solids during the open-water period (fig. 33) reached similar maxima for several years. Peak total dissolved solids in pond water then continued to increase from year-to-year as inundation of the uplands provided for increased solute input. Salts in the soils and fractured till dissolved as the uplands were inundated, and the greater perimeter of the pond enabled greater contribution of solutes from groundwater flowing through the oxidized till and soils. Additionally, salt concentrations sequestered underneath the wetland and around the wetland perimeter likely reentered the active salt pools in the wetland. Once the pond level and areal extent reached a maximum for the period of study, further increases in total dissolved solids peaks were associated with declines in pond levels because of evaporative concentration. With another rapid rise in the pond, changes in salinity were at first noticeably smaller than in the previous year, but values increased again during subsequent years as the effect of inundation of the uplands again provided additional solutes that dissolved into the overlying surface water. Thus, changes in salinity in prairie-pothole wetlands can be much more complicated than simple dilution/concentration effects would indicate, which is an observation consistent with Eisenlohr and others (1972), who also noted cases where concentration increases could be associated with increased pond volumes and decreases in concentration associated with decreases in pond volume.
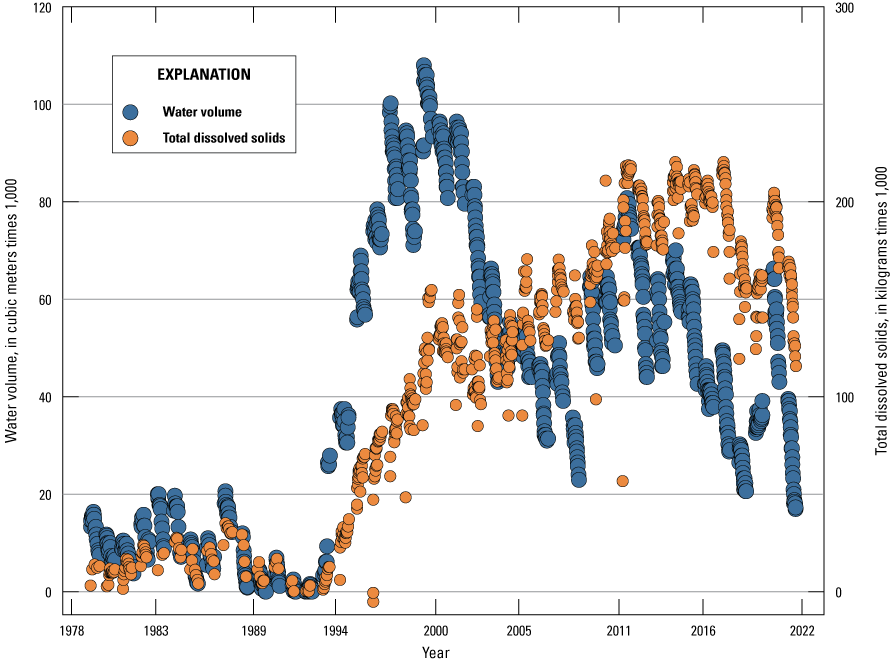
Wetland P1 water volume and total dissolved solids at the Cottonwood Lake study area, Stutsman County, North Dakota, 1978 to 2021.
Plants
Mushet and others (2004) survey of the vascular flora of the Cottonwood Lake study area between 1992 and 2001 identified 220 unique plant species representing 52 families. Of the 220 species, 187 were native, whereas 33 were non-native to the region. The majority (117) of the species were perennial forbs. The next two largest physiognomic groupings were perennial grasses (26 species) and annual forbs (22 species). The remaining species consisted of biannual forbs (13 species), annual grasses (4 species), perennial sedges (11 species), herbaceous vines (5 species), woody vines (2 species), shrubs (15 species), trees (3 species), and vascular cryptograms (2 species). The mean coefficient of conservatism value for the flora of the study area was 4.6 with a Floristic Quality Index of 62 (Swink and Wilhelm, 1979; Northern Great Plains Floristic Quality Assessment Panel, 2001), indicating that the native-plant community of the study area is largely intact (Swink and Wilhelm, 1994).
Uplands
The upland vegetation of the Cottonwood Lake study area changed considerably during the study period. Swanson and others (2003) presented a map of the vegetation of the 1989 study area (fig. 34). When compared to the map constructed in 2020 (fig. 13), the most striking differences are related to the expansion of wetlands (increased in area by 62 percent) reducing the area of upland vegetation (table 1). For example, in several locations where trees once bordered wetlands, the stands of trees have been flooded out and replaced by wetland vegetation, resulting in a 95-percent decrease in area of trees at the study area. This decrease is best seen along the southern edge of wetland P2 and the eastern edge of P7 where stands of quacking aspen (Populus tremuloides) were eliminated (fig. 35). Wet conditions from the mid-1990s through the 2020s, combined with restricted burning and no grazing, contributed to an expansion of tall shrubs (table 1) throughout much of the study area (fig. 13). The two areas in the study area that had been tilled and were planted to a brome/alfalfa cover mix by the FWS now have vegetation very similar to the never-farmed portions of the study area as the alfalfa has died out and brome has expanded to become the dominant grass across the study area. The decrease in area of short shrubs (primarily western snowberry [Symphoricarpos occidentalis] and silverberry [Elaeagnus commutata]) may be related to a management burn of the study area’s upland areas in 2010.
Table 1.
Area of major plant communities at the Cottonwood Lake in 1989 and 2020.[m2, square meter]
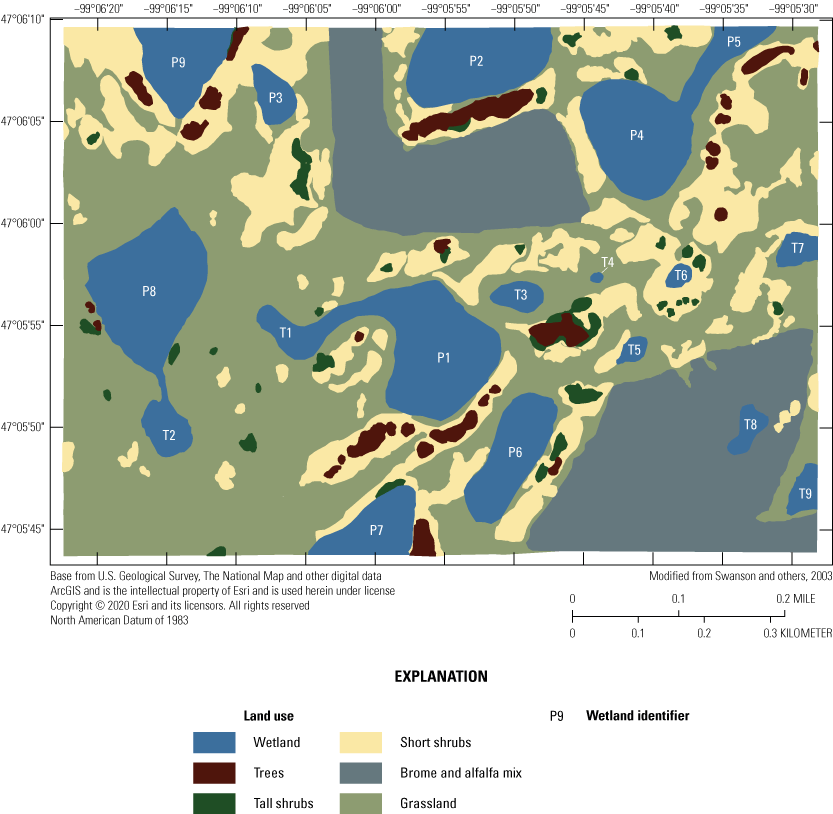
Upland-vegetation cover of the Cottonwood Lake study area, Stutsman County, North Dakota, 1989 (modified from Swanson and others, 2003).
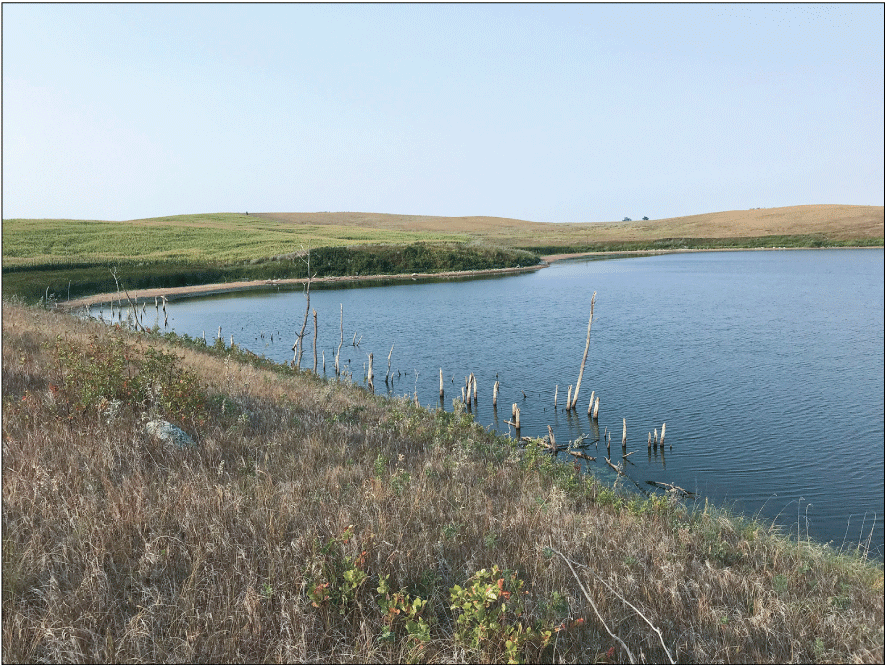
Dead stumps (center) are all that remain of a stand of quacking aspen (Populus tremuloides) trees in the flooded pond of wetland P7, June 16, 2021. Photograph by David Mushet, U.S. Geological Survey.
Wetlands
Aquatic vegetation in wetlands of the Cottonwood Lake study area has changed markedly during the course of this study. In this section, we explore the changes in four major plant zones as the wetlands transitioned in terms of water depth, salinity, and permanence. These wetland vegetative zones form in prairie-pothole wetlands primarily in response to the normal cycle of wetlands filling in the spring and declining in depth throughout the summer as a result of evapotranspiration rates exceeding water inputs from direct precipitation and runoff (Stewart and Kantrud, 1972). From the wetland/upland boundary to the deepest portions of a wetland, these zones are the (1) wet-meadow zone, (2) shallow-marsh zone, (3) deep-marsh zone, and (4) open-water zone (Stewart and Kantrud, 1971). In addition to defining these vegetative zones, Stewart and Kantrud (1971) also list the primary plant species associated with each zone during normal, drawdown, and cropped conditions. In addition to the four vegetative zones, we also include an “exposed soil” zone for areas that were unvegetated, typically occurring during a drawdown period before seedlings germinate (fig. 36).
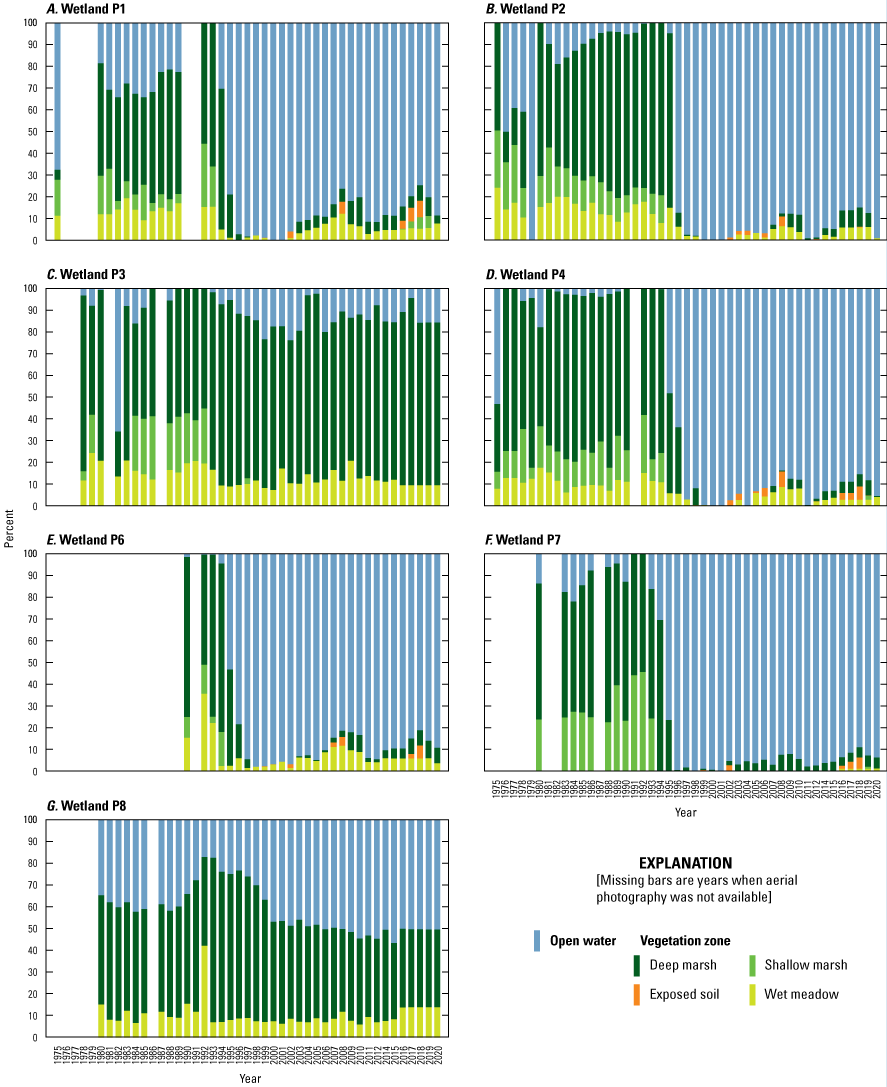
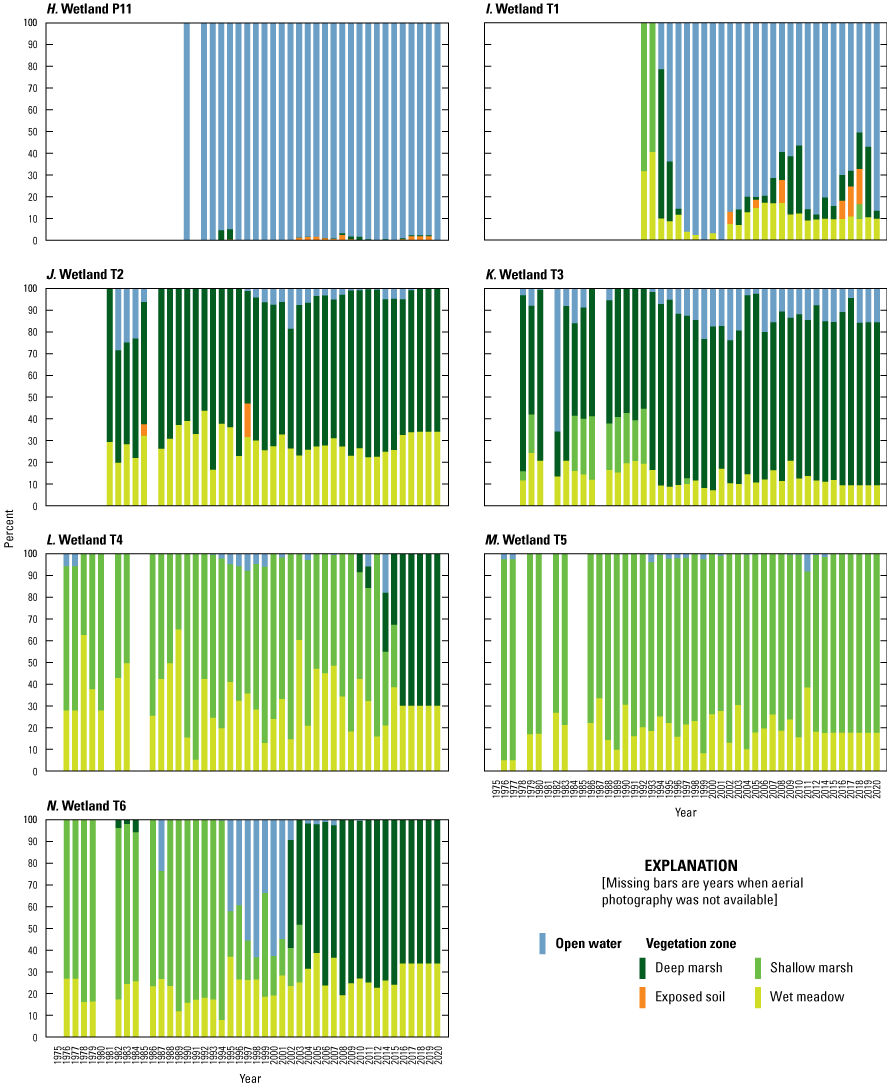
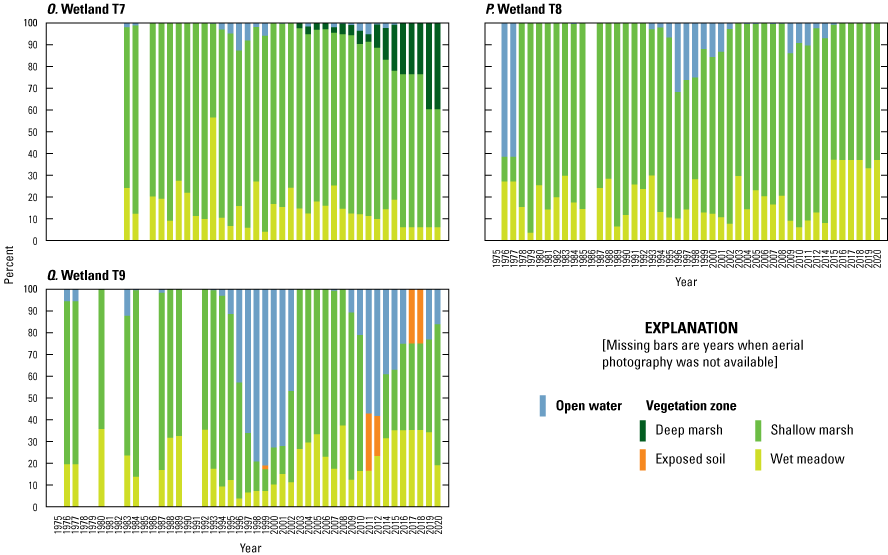
Composition of vegetative zones in wetlands of the Cottonwood Lake study area, Stutsman County, North Dakota. A, Wetland P1. B, Wetland P2. C, Wetland P3. D, Wetland P4. E, Wetland P6. F, Wetland P7. G, Wetland P8. H, Wetland P11. I, Wetland T1. J, Wetland T2. K, Wetland T3. L, Wetland T4. M, Wetland T5. N, Wetland T6. O, Wetland T7. P, Wetland T8. Q, Wetland T9.
The greatest changes during the study period were in response to rising water levels during approximately the last one-half of the study period (that is, since 1993). In the P wetlands lacking a depth-limiting outlet (wetlands P1, P2, P4, P6, P7, and P11), rising water levels exceeded the depth limitations (about 1.0 m) of deep-marsh species and many submergent species. These wetlands began functioning essentially as small lakes and even developed the wave-washed shorelines characteristic of lake versus wetland conditions (fig. 37). In these wetlands, water levels rose quickly enough that vegetation characteristics of shallow depths were flooded out. With this loss of emergent vegetation, open-water areas often transitioned directly to upland vegetation. which is in marked contrast to the diverse plant communities in these wetlands prior to 1993 when most of their area was covered by some form of emergent vegetation with submergent vegetation fully occupying any open-water areas (fig. 36). This change in state from palustrine wetland dominated by emergent and submergent macrophytes to lacustrine systems dominated by planktonic species had repercussions on the macroinvertebrate and vertebrate communities using these wetlands as habitat, as will be discussed in subsequent sections.
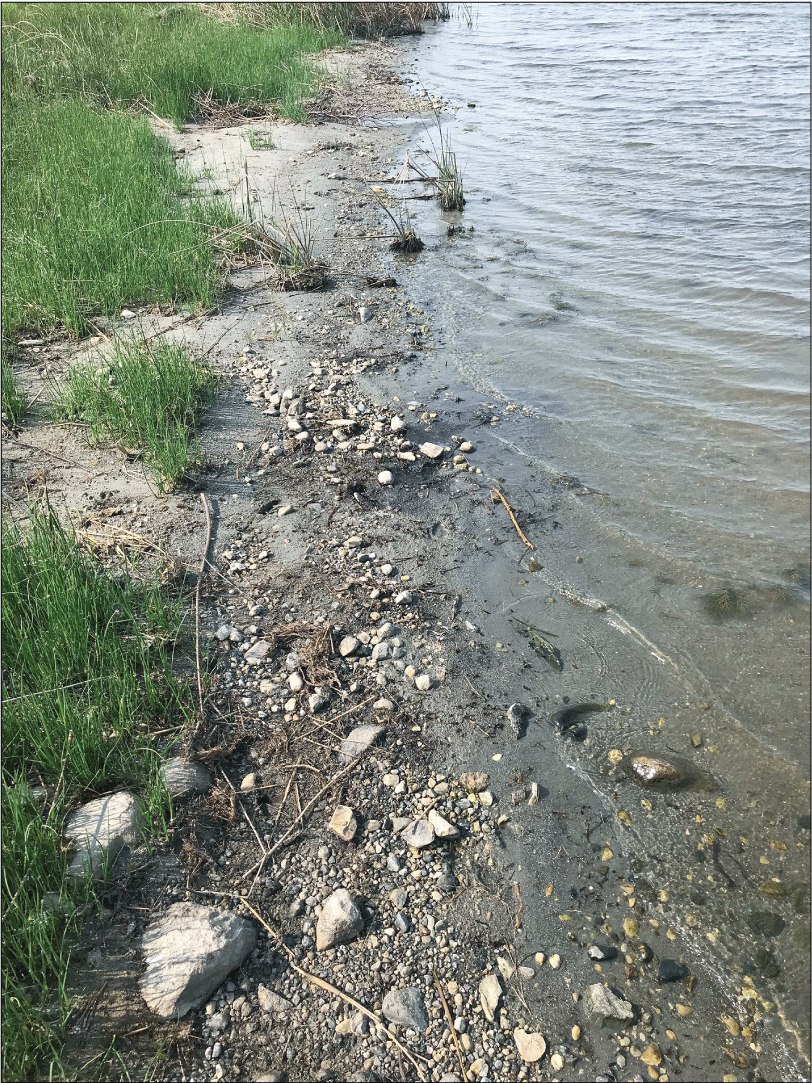
Wave-washed shoreline of wetland P4, June 16, 2021. Photograph by David Mushet, U.S. Geological Survey.
By contrast, the two P wetlands with depth limiting outlets, P3 and P8 (fig. 36C, G), retained robust deep-marsh communities dominated by cattails (Typha spp.). The deep-marsh zone surrounding these two wetlands provided habitat for bird and other species (for example, spiders) that rely on this overwater vegetative structure as habitat. One unique aspect of wetland P8 is that the overland outlet limiting water depth to a maximum on 1.2 m (slightly greater than the depth limit of most cattails), combined with a large sand lens that intersects the wetland and facilitates groundwater inputs, gives this wetland remarkably stable water levels compared to most wetlands of the PPR. This stability allows the cattails bordering this wetland to form floating mats that extend towards the wetland center beyond depths where cattails would normally occur. The inflow of groundwater into this wetland and losses to overland flows also maintain a relatively more stable chemical regime than in the wetlands with no overland outlets. Thus, although salt-intolerant species may be replaced by salt-tolerant species as salinity levels increase in closed-basin wetlands, the chemical composition of ponded water in wetlands P3 and P8 changes relatively little, as do the plant species responding to the stable depth and chemical conditions.
In contrast to the semipermanently ponded P wetlands, the conditions of the T wetlands typically were much more dynamic because they characteristically transition from ponded to fully dry each summer; however, following 1993, even this general assumption can no longer be made. Many of the T wetlands retained water for multiple consecutive years following the changes in precipitation levels. Much like the closed-basin semipermanently ponded wetlands transitioning to lake-like conditions, many of the T wetlands began retaining water year-round and functioned as semipermanently ponded wetlands. Two of these wetlands, T6 and T9, even reached water depths that flooded and killed emergent vegetation in their central zones and maintained open-water conditions for multiple consecutive years. A key change in response to increased water depths and permanence has been the development of deep-marsh cattail stands in some of these wetlands where none had previously existed owing to the annual drying events. Wetlands T3 and T4 clearly show the development and persistence of a deep-marsh zone dominated by cattails during the most recent years of the study (fig. 38). This was an especially large change for T4, which is a temporarily ponded wetland that, in 1992, dried to the extent that upland vegetation dominated most of the basin. Wetlands T6 and T7 also developed deep-marsh cattail stands. Although wetland T8 has yet to develop a deep-marsh zone in response to the precipitation changes, its vegetation in the shallow-marsh zone has nonetheless changed markedly. Although the shallow marsh zone of T8 was previously dominated by Carex spp. and water smartweed (Persicaria amphibia), it has become invaded and dominated by dense stands of reed canary grass (Phalaris arundinacea), which is an invasive species that is becoming an increasing problem in many wetland ecosystems. The invasion of reed canary grass into wetland P8 likely is due to a combination of the wetter conditions in concert with the fact that wetland T8 lies within an area of the study area that was tilled prior to purchase of the study area by the FWS (fig. 34).
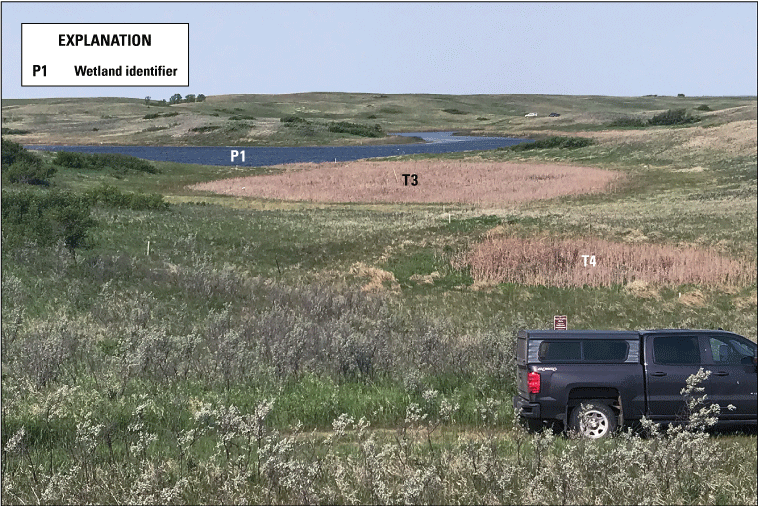
Wetlands T4 and T3 at the Cottonwood Lake study area with most of their basins dominated by cattails (Typha spp.), June 16, 2021. Photograph by David Mushet, U.S. Geological Survey.
One unexpected result of the altered precipitation regimes was the appearance of wetland conditions in areas where they previously did not occur. Wetland plant species including smartweed, prairie cordgrass (Spartina pectinata) and species of Carex were present in five locations throughout the study area (fig. 39). An examination of soils in these areas also revealed indicators of anoxic conditions showing that wetland soils had also developed in these areas. Although these discoveries of new wetlands were unexpected in an area with such a long history of research, they should not be surprising. Much like the semipermanently ponded wetlands transitioning to permanent ponds, and the temporarily and seasonally wetlands transitioning to semipermanent ponds, it should be no surprise that depressions previously considered to be nonwetland could transition to temporarily ponded wetlands following a change in precipitation regime. The appearance of these new wetlands at the Cottonwood Lake study area is deserving of additional research that may provide information on the formation of wetland soil indicators and colonization by invertebrates.
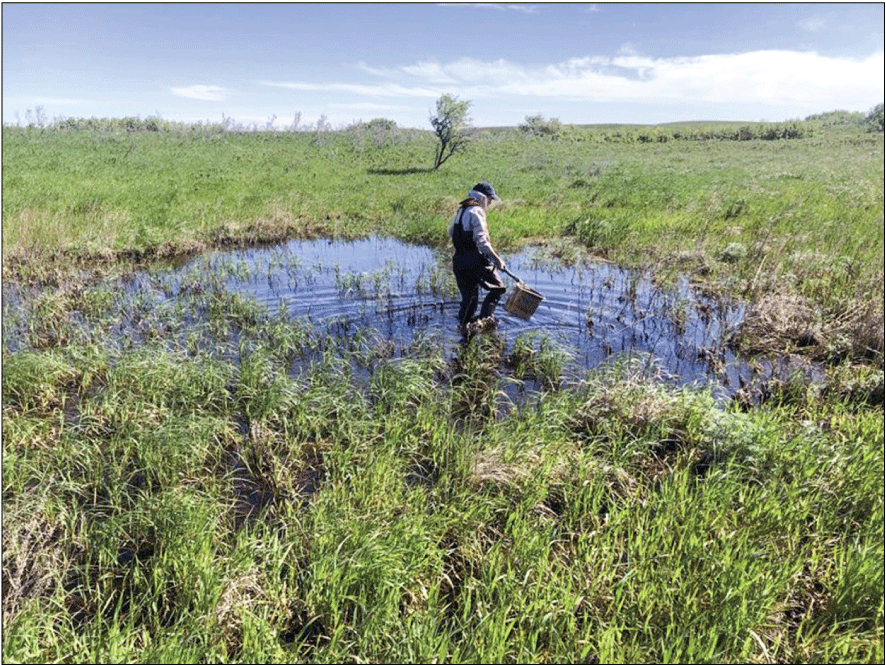
A newly formed wetland area at the Cottonwood Lake study area, Stutsman County, North Dakota, June 16, 2021. Photograph by Kyle McLean, U.S. Geological Survey.
Another change in vegetation of prairie wetlands occurs when a wetland increases in depth to the point that it floods into another nearby basin. This change was readily apparent at the Cottonwood Lake study area when wetland P1 increased in depth and first flooded wetland T1, which quickly became an open-water bay area of P1. After several more years of continued water-level rises, P1 also flooded adjacent wetland T3 (fig. 34) converting central portions of T3 to open water, flooding out the shallow-marsh zone, and subsequently supporting a dense stand of cattails across the wetland basin (figs. 36, 38). The persistence of cattail in wetland T3 may also have been aided by silts deposited in the wetland from wave actions that eroded the embankment previously separating the two wetlands.
As alluded to earlier in the section, changes in salinity levels of closed-basin semipermanently and permanently ponded wetlands affect the composition of plant species within zones. Cattails and other salt-intolerant species dominated the communities following the drought years of 1988 to 1993. However, as water levels continued to persist at high levels and additional salts were transported into the wetland pond (LaBaugh and others, 2016), cattails began to be replaced by salt-tolerant species such as hardstem bulrush (Schoenoplectus acutus) and cosmopolitan bulrush (Bolboschoenus maritimus). This change to more salt-tolerant species also occurred in wetlands P2 and P4 (fig. 40). Salinities have not increased as markedly in wetlands P6 and P7, so cattails still dominate the deep-marsh zones of these two wetlands. Wetland P11 had open water as the main component of its appearance throughout the study period, although the plant species constituting its open-water zone changed owing to accompanying changes in chemistry. In 1992, wetland P11 was highly saline from its gradual drawdown during the 1988 to 1993 drought. However, many of the unique saline-tolerant plants in wetland P11 (for example, red saltwart [Salicornia rubra], inland saltgrass [Distichlis spicata], arrowgrass [Triglochin maritima]) were eliminated when atmospheric water received in 1993 changed the salinity of the ponded water from nearly 43,500 μS/cm to 5,640 μS/cm in a single growing season. Water depths continued to rise in the permanently ponded wetland until submergent vegetation was restricted to only a thin, shallow area around its perimeter. Historically, wetland P11 was known for supporting large stands of sago pondweed (Stuckenia pectinata) across its basin that attracted large numbers of tundra swans (Cygnus columbianus) that fed upon the sago tubers (Swanson and others, 2003).
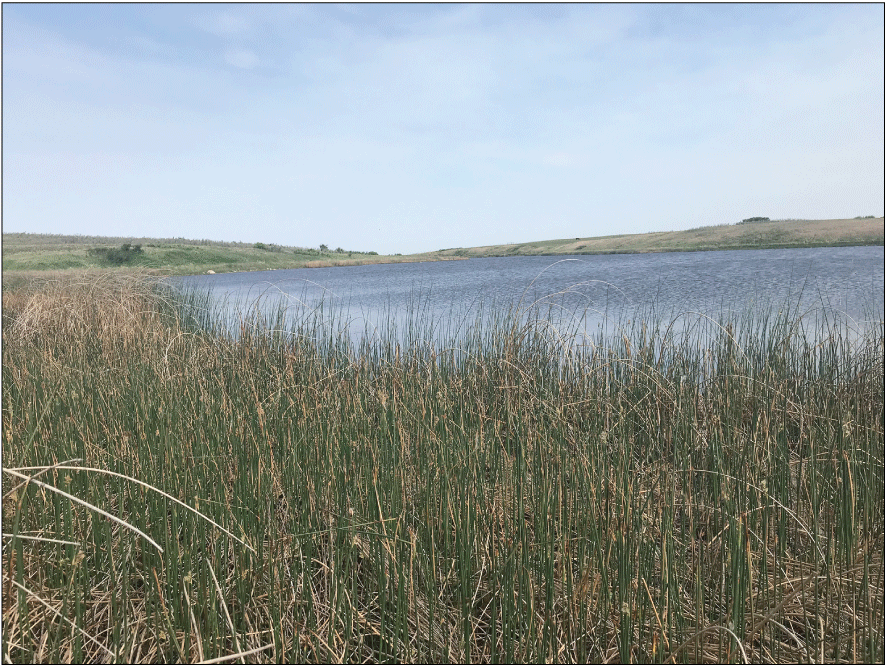
Salt-tolerant hardstem bulrush (Schoenoplectus acutus) dominating the deep-marsh zone of Cottonwood Lake study area wetland P2, June 16, 2021, Stutsman County, North Dakota. Photograph by David Mushet, U.S. Geological Survey.
Aquatic Invertebrates
Yearly monitoring of the aquatic macroinvertebrate communities at the Cottonwood Lake study area began in 1992. From 1992 to 2021, 134 unique taxa (various levels of taxonomic resolution) were identified during our sampling of the study area’s aquatic macro-invertebrate communities (appendix 10). The abundance of individual taxa varied greatly across the 30-year period of sampling (1992–2021). As an example of the great variation among years and wetland types, figure 41 depicts variation in the abundance (captures per unit effort) of 12 taxa across the sampling period. Much of the occurrence of specific taxa in wetlands was related to pond permanence. Whereas some taxa such as Enallagma and Ostracoda (fig. 41K, L) occurred in almost all wetlands despite pond permanence, others (for example, Caenidae, Dasycorixa, and Hydrachnidia) occurred almost exclusively in wetlands that retained ponded water year-round. By contrast, other taxa (for example, Eubranchipus bundyi and Eubranchipus ornatus) occurred almost exclusively in wetlands with ponds that dried on a regular basis (recharge wetlands and some flowthrough wetlands; fig. 41). One of the most striking features of aquatic-invertebrate abundance in the study wetlands was the tendency for most taxa to be present in modest numbers during most years but have significant peaks in abundance during others (fig. 41; appendix 10). The causes of these marked changes in abundance among individual taxa are beyond the scope of this report but definitely are deserving of further investigation using the invertebrate abundance and environmental data available from the Cottonwood Lake study area.
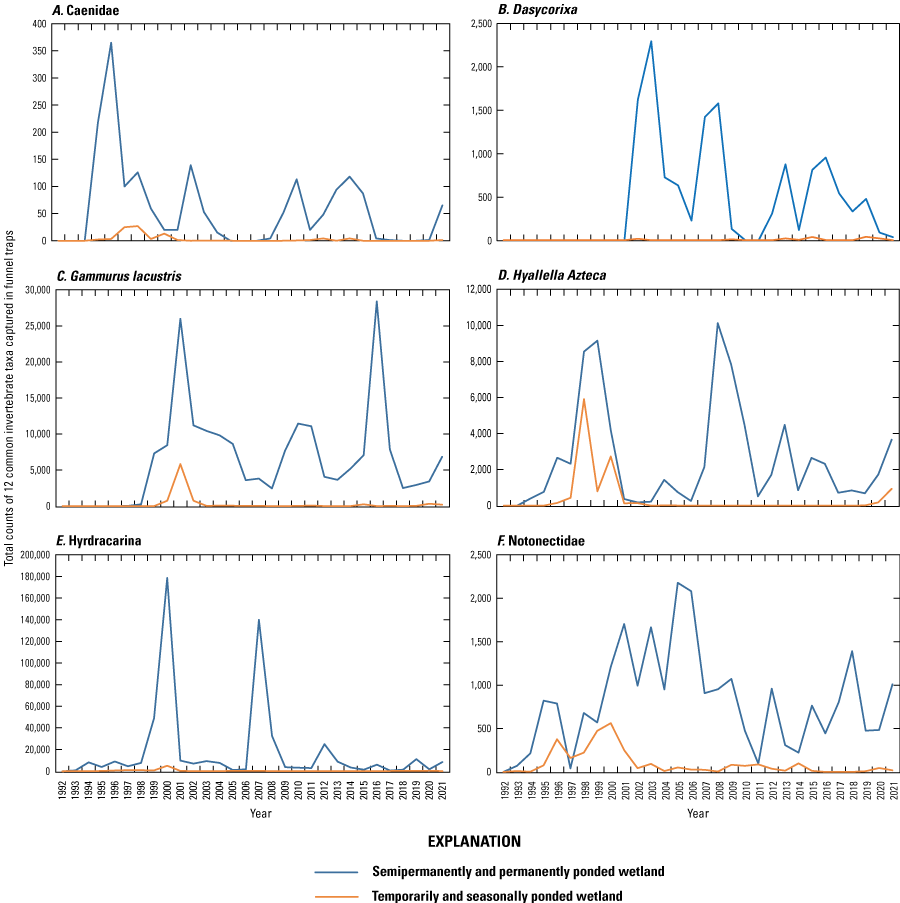
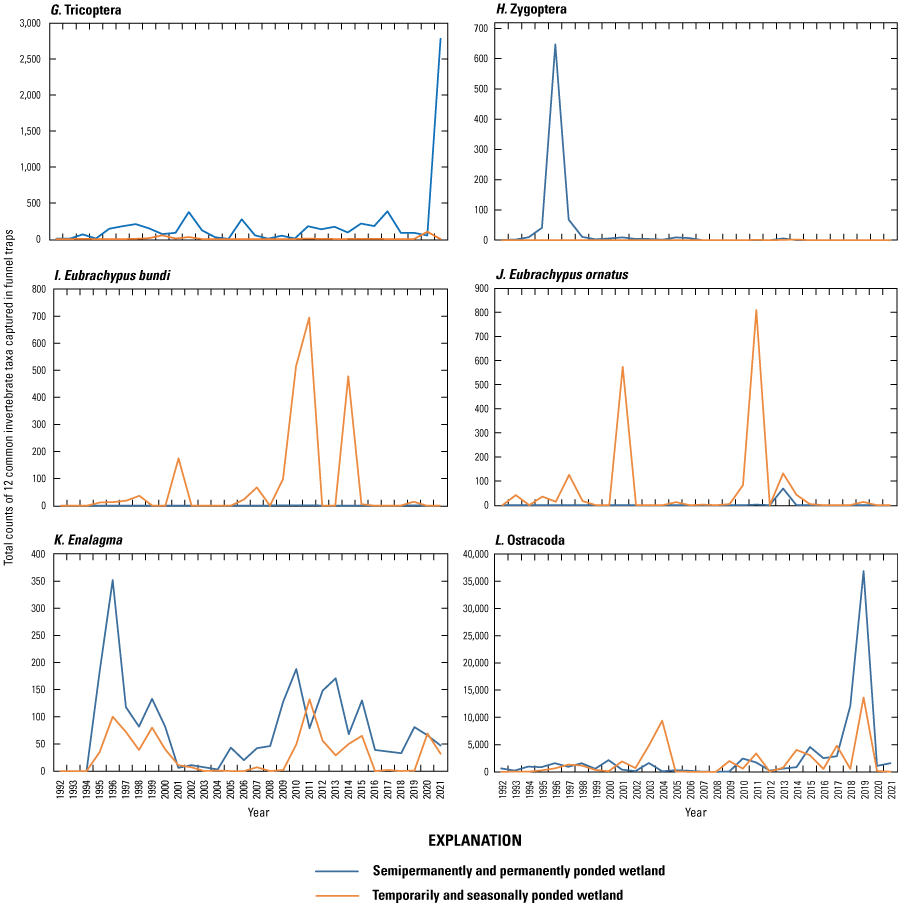
Total counts of 12 common invertebrate taxa captured in funnel traps at the Cottonwood Lake study area, Stutsman County, North Dakota, 1992–2021. A, Caenidae. B, Dasycorixa. C, Gammurus lacustris. D, Hyallella azteca. E, Hyrdracarina. F, Notonectidae. G, Tricoptera. H, Zygoptera. I, Eubrachypus bundi. J, Eubrachypus ornatus. K, Enalagma. L, Ostracoda.
Early in the sampling, a clear pattern of an influence of tiger salamander predation on aquatic-invertebrate biomass in study area wetlands was observed. The wetlands were relatively predator free when surface ponds refilled in 1993 following drought. In response, aquatic-invertebrate biomass increased markedly as they made use of abundant nutrient resources present in the water following reflooding. Invertebrate biomass reached a peak in 1996 (fig. 42). However, after tiger salamanders returned to the study area wetlands and increased in numbers, in 1997 invertebrate biomass sharply declined in the wetlands as salamander numbers likely exceeded the carrying capacity of the invertebrates (fig. 42). The year following the drop in invertebrate biomass (1998), salamander numbers also declined, likely in response to the reduced aquatic-invertebrate food resources. The drop in salamander numbers was reflected by a new increase in invertebrate biomass. These early dynamics in the Cottonwood Lake study area wetlands following reflooding adds a new and quantitative example of the close relations between predator and prey populations, which is similar to the relation between Canada lynx (Lynx canadensis) and snowshoe hare (Lepus americanus) populations (Krebs and others, 2001). However, as the community interactions became more complex in the study area’s wetlands and stochastic factors such as predatory taxa, changing prey abundance, and disease came into play (McLean and others, 2012), the relatively simple patterns observed early in the study became much more complex (fig. 42).
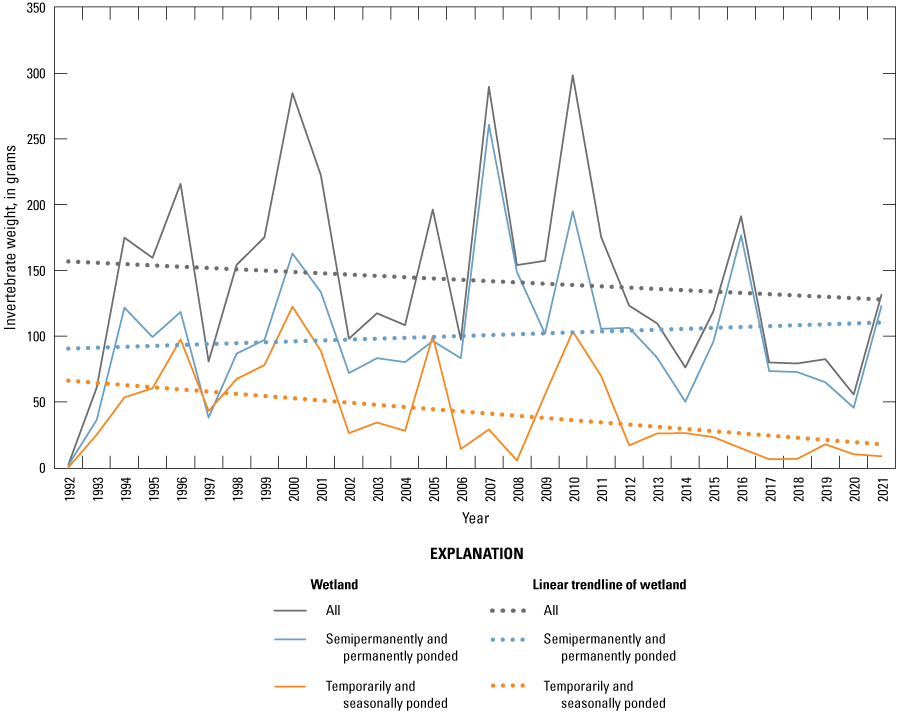
Total weight (biomass) of aquatic-macroinvertebrates collected in funnel traps at the Cottonwood Lake study area, Stutsman County, North Dakota, 1992–2021.
Despite year-to-year variation in total aquatic-invertebrate biomass, overall productivity in P wetlands remained remarkably stable across the almost 30-year period (fig. 43). This maintenance of productivity in continuously flooded wetlands contrasts with past research efforts that indicate declining productivity in wetland ponds that do not periodically dry (for example, Johnson and others, 2005). Also, total aquatic-invertebrate biomass in these wetlands was somewhat in sync with meteorological conditions as indicated by the Palmer Hydrologic Drought Index in the first several years of sampling; however, this relation seemed to disappear as the wet meteorological conditions and extended wetland pond permanence persisted. Thus, a previously held belief that wetland ponds must regularly dry to maintain productivity appears to be more complicated than originally thought.
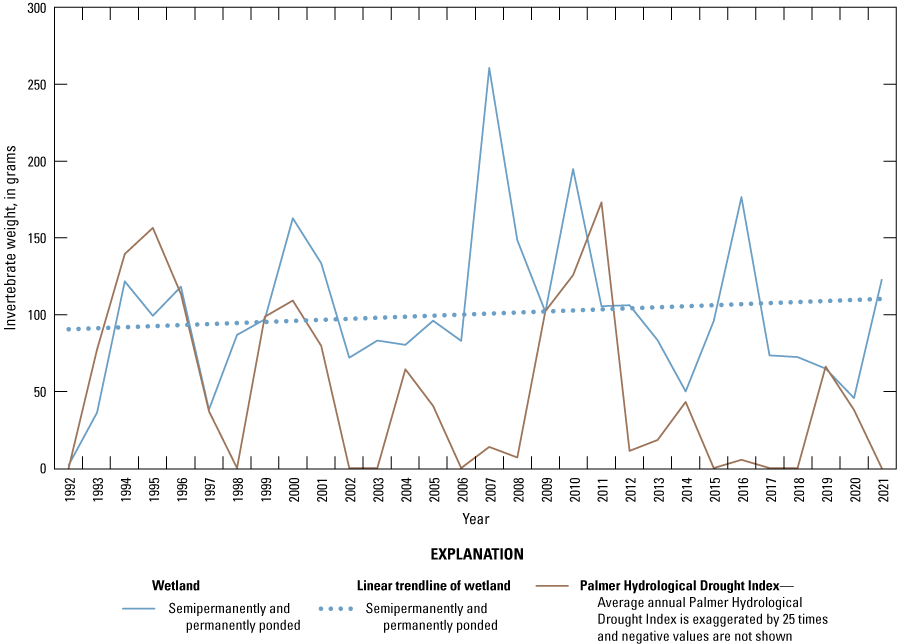
Total weight (biomass) of aquatic-macroinvertebrates collected in funnel traps from semipermanently and permanently ponded wetlands at the Cottonwood Lake study area, Stutsman County, North Dakota, plotted with average annual Palmer Hydrological Drought Index, 1992–2021.
Because 1992 was an exceptionally dry period when all ponds in study area wetlands completely dried, observing invertebrate occurrence in the subsequent years can provide information about various colonization strategies aquatic invertebrates use to repopulate wetland ponds following drought. Many aquatic-invertebrates survive through periods of drought directly in the dry wetland basins, either in an adult or larval stage or by laying drought resistant eggs. These invertebrates quickly repopulate wetlands following ponding because they already are present in a form that can persist through the dry conditions. Other aquatic-invertebrate taxa must repopulate previously dry wetlands from a source wetland that retained a wetland pond during the dry conditions. Invertebrates that can fly are also able to repopulate previously dry wetland ponds rather quickly if the distance between the source and target wetland is within their flight range. However, if invertebrates can neither survive in place nor repopulate through flight from a source population, repopulation typically takes longer (Euliss and others, 1999). Amphipods (order Amphipoda) (fig. 44) are an example of an aquatic invertebrate that does not have a drought-tolerant form and cannot fly. Amphipods rely on clinging to the feathers of a duck or fur of a mammal (Swanson, 1984) to move from source wetlands from which an amphipod population has been lost. At the Cottonwood Lake study area, amphipods, specifically Hyalella azteca, did not return to wetland ponds until 1995 following the drying of wetlands during the 1988 to 1992 drought, and then this species occurred only in a single wetland (wetland P7; fig. 45). During the next few years, H. azteca repopulated the remainder of the wetlands with semipermanent or permanent pond permanence (P wetlands) at the study area (fig. 45). As pond-water levels at the study area remained high, a second and previously unseen amphipod in Cottonwood Lake study area wetlands, Gammarus lacustris, appeared (fig. 45). G. lacustris is typically only found in permanent, lake-like environments; thus, its occurrence at the Cottonwood Lake study area was not noted by Swanson (1984) during the early years of research at the study area when all wetlands dried annually or on a semi-annual basis. However, when most semipermanently ponded wetlands at the study area switched to permanently ponded conditions, G. lacustris became the dominant amphipod in these now lake-like wetlands (fig. 45). As wetland ponds receded, the amphipod communities at the study area became a more complex mixture, with G. lacustris dominating in the wetlands that remained in lake-like conditions and H. azteca dominating the shallower permanently or semi-permanently ponded wetlands. Both amphipods disappeared from recharge and flowthrough wetlands that returned to seasonal drying conditions (T wetlands; fig. 45).
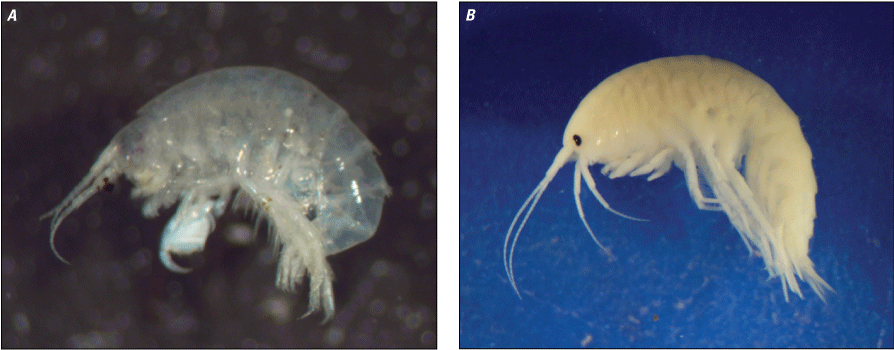
Amphipods of the Cottonwood Lake study area, Stutsman County, North Dakota. A, Hyalella azteca. B, Gammaris lacustris. Photographs by Bruce Hanson, U.S. Geological Survey.
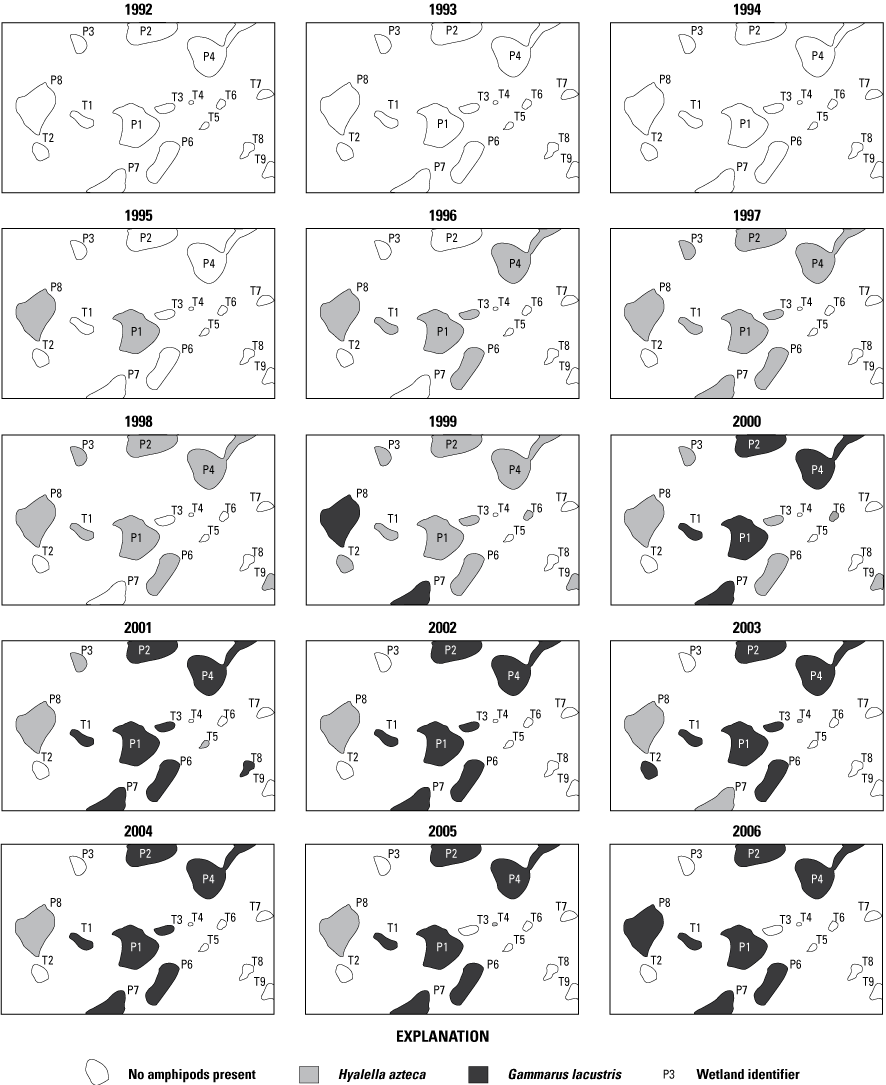
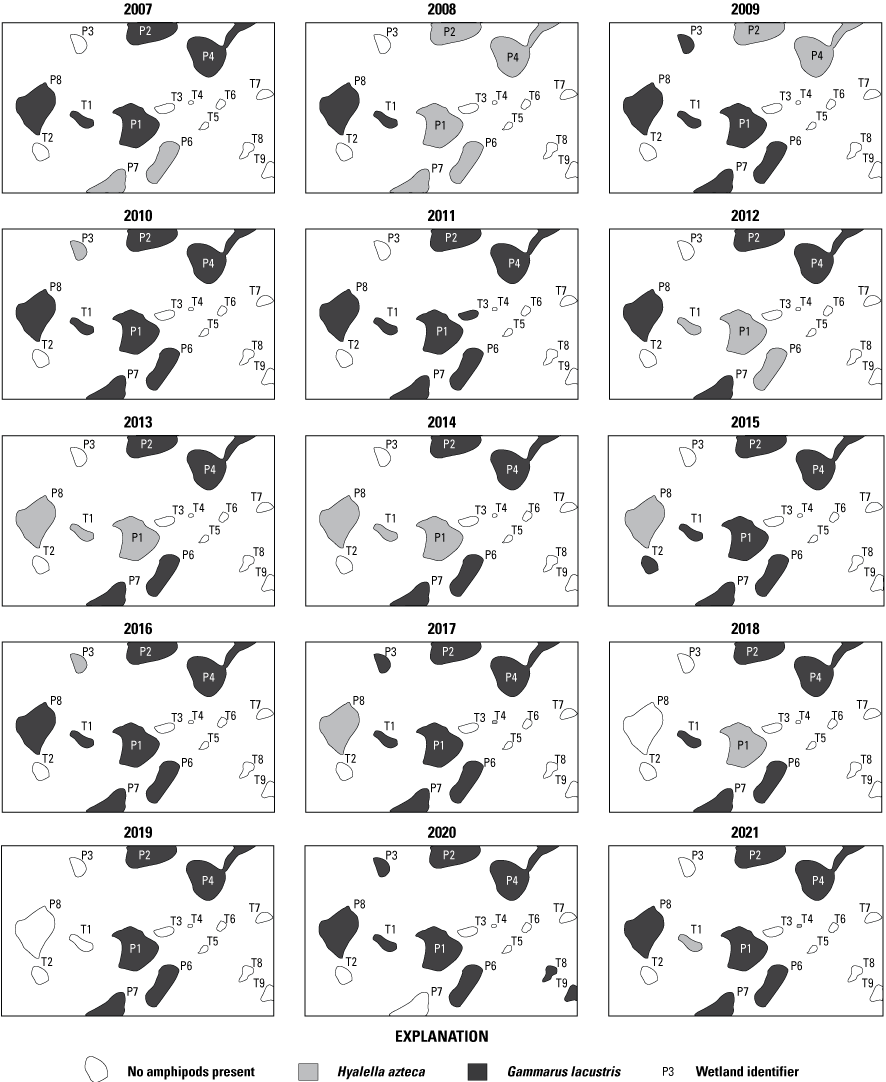
Amphipods present on wetlands at the Cottonwood Lake study area, Stutsman County, North Dakota, 1992–2021.
Amphibians and Reptiles
Barred tiger salamanders (Ambystoma mavortium; hereafter referred to simply as tiger salamanders), northern leopard frogs (Lithobates pipiens), wood frogs (Lithobates sylvaticus), and boreal chorus frogs (Pseudacris maculata) were the only four amphibian species captured or observed at the Cottonwood Lake study area during this study. Although the study area occurs within the range of several toad species, including the Great Plains toad (Anaxyrus cognatus), Canadian toad (Anaxyrus hemiophrys), and Woodhouse’s toad (Anaxyrus woodhousii), no toads were captured or even observed during this study. Additionally, Mushet and others (2012) carried out a series of intensive amphibian call surveys across a study area that extended from the Coteau du Missouri into the Drift Plain and included the Cottonwood Lake study area. These surveys determined toads were present at many survey points in the Drift Plain but not at a single point on the Coteau du Missouri, and it was unclear why toads are not present in this area of the Coteau du Missouri. In addition to amphibians, common garter snakes (Thamnophis sirtalis), plains garter snakes (Thamnophis radix), smooth green snakes (Opheodrys vernalis), red-bellied snakes (Storeria occipitomaculata), and painted turtles (Chrysemys picta) also occurred at the study area. The Cottonwood Lake study area does not fall within the range of any lizard species.
The tiger salamander (fig. 46), followed closely by the northern leopard frog, was the most abundant amphibian species at the Cottonwood Lake study area in most years. Although tiger salamanders were absent from the study area during the drought that ended in 1993, when the wetlands refilled, tiger salamanders increased steadily until reaching a peak of 10,010 total captures in 1997 (fig. 47). Since their relatively smooth recovery from 1992 to 1997, salamander numbers varied widely (fig. 47). From 1997 to 2001 numbers ranged between the 1997 peak of 10,010 captures and a low of 3,557 in 2000. The low in 2000 marked the beginning of an outbreak of Ranavirus (Green and others, 2006) that decimated tiger salamander populations at the study area. In 2000, Ranavirus only appeared in wetland P11 (fig. 48), which typically supported the greatest number of salamanders at the study area; however, by 2002, Ranavirus had spread to the other study area wetlands. Following the spread of Ranavirus in 2002, salamander captures at the study area remained low for several years owing to the chronic occurrence of Ranavirus in the salamander population (Gray and others, 2009), with a temporary rebound to 5,150 captures in 2007 followed by a drop back to only 1,301 captures in 2010. Following the 2010 low, tiger salamander numbers increased to a new record high of 12,958 captures during the summer of 2011. This dramatic increase was followed by an almost equally dramatic drop in 2012 and a second peak and drop in 2013 and 2014, respectively. Captures reached another low of only 906 captures in 2015 and have remained low (<2,000 total captures), except in 2019 when 4,700 individuals were captured, with extremely low capture rates (<700) in 2020 and 2021 (fig. 47).
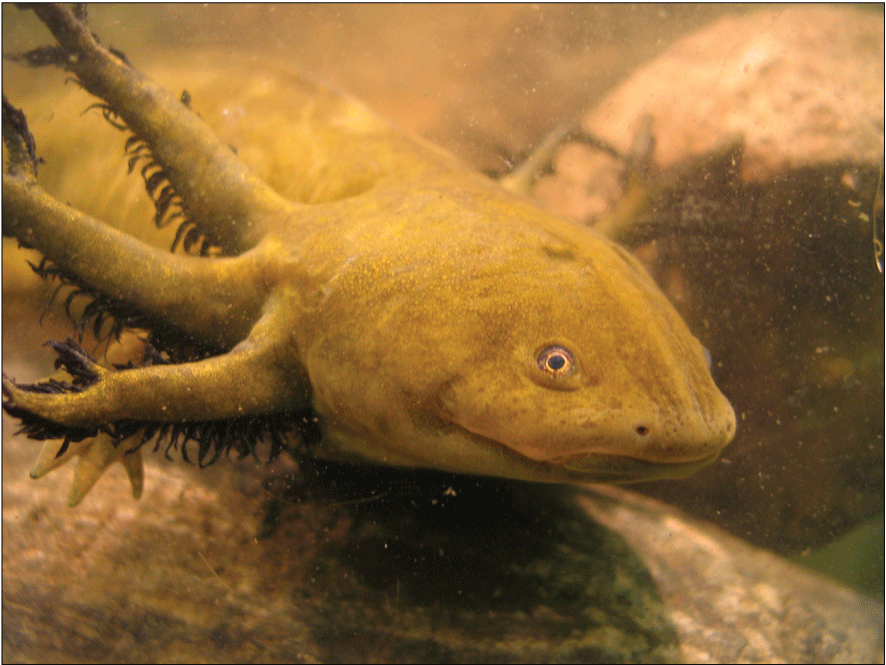
Barred tiger salamander (Ambystoma mavorteum) larvae from the Cottonwood Lake study area, Stutsman County, North Dakota, May 17, 2007. Photograph by David Mushet, U.S. Geological Survey.
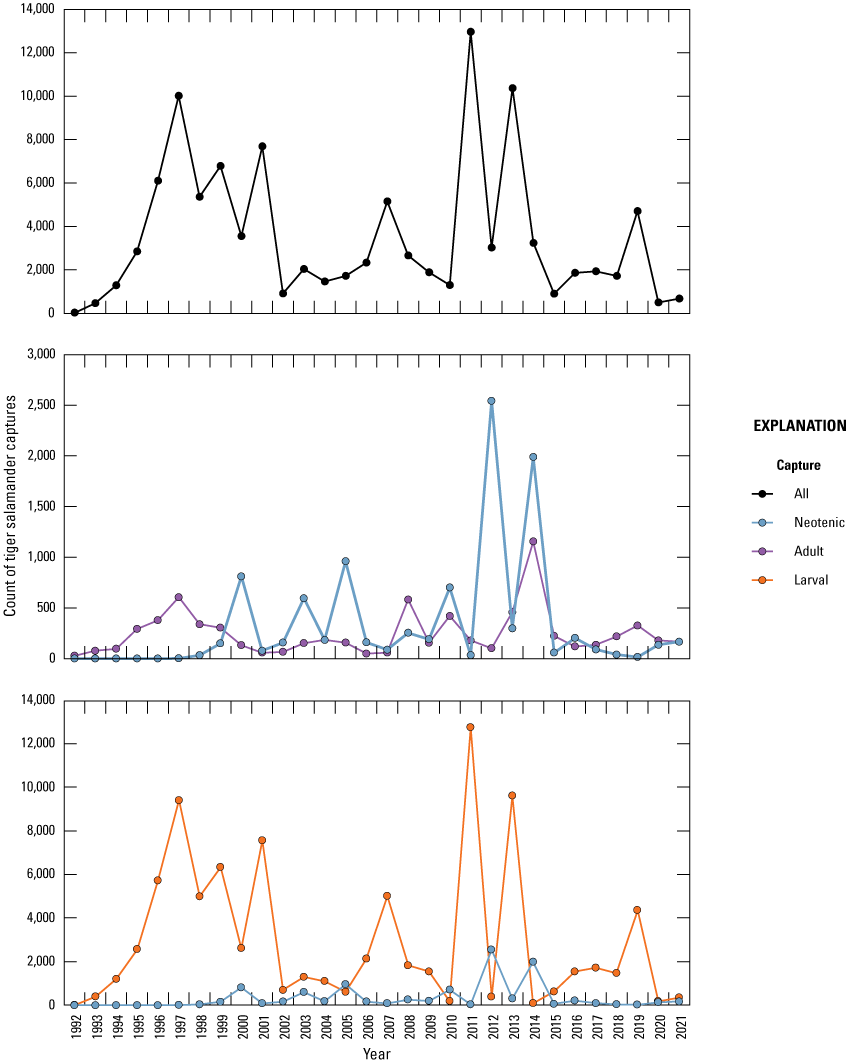
Barred tiger salamander (Ambystoma mavorteum) captures at the Cottonwood Lake study area in Stutsman County, North Dakota, 1992–2021.
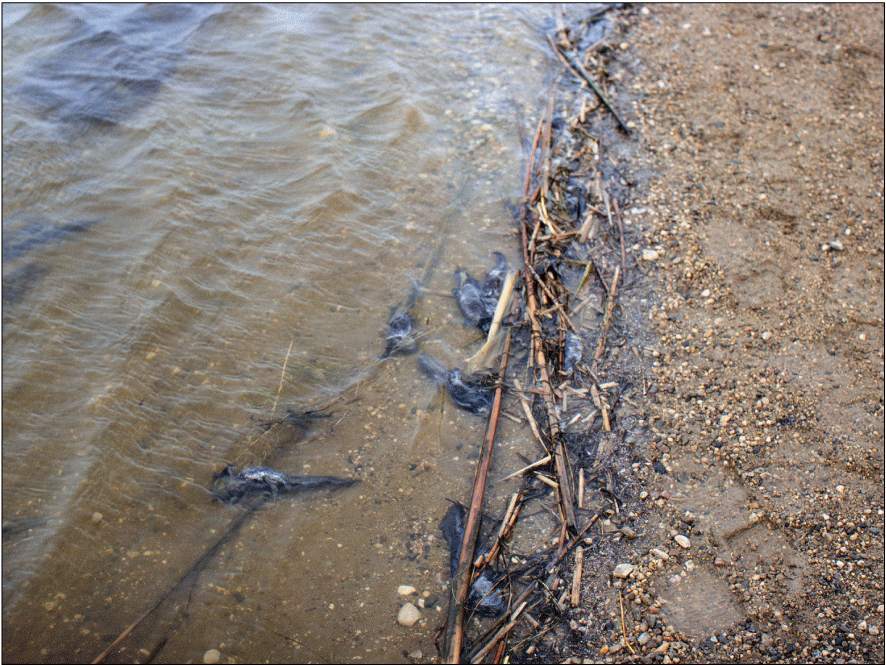
Dead tiger salamanders (Ambystoma mavorteum) at the Cottonwood Lake study area, Stutsman County, North Dakota, April 2000. Photograph by Stephen Lane, U.S. Geological Survey.
Adult and neotenic tiger salamanders contributed little to overall captures during most years (fig. 47). Adults were primarily captured in small numbers in the spring as they left their terrestrial habitats and entered wetland habitats for breeding, and then again in the fall when their larvae metamorphed to adults and left the wetlands in search of underground overwintering sites. By contrast, neotenic salamanders retain their larval, aquatic features (for example, gills, and a wide tail and webbed toes for propulsion) and overwinter within the wetlands; however, even though they occurred in the wetlands year-round, neotenic salamanders were generally a small proportion of the larval population. The exception to this trend was in 2012 and 2014 when neotenic numbers greatly exceeded those of larval salamanders (fig. 47). It is also interesting to note that in 2014, adult salamanders also peaked in the study area wetlands (fig. 47) and larval forms were almost totally absent.
As with tiger salamanders, Lithobates spp. numbers varied greatly during the period of trapping in the wetlands. Although northern leopard frogs (fig. 49) and wood frogs are included in Lithobates spp. counts (fig. 50) because the larvae of these two species were not separately identified during sampling, northern leopard frog adults were far more abundant than wood frog adults at the study area (fig. 51) and thus likely drove the observed trends; this is especially true during the early years of sampling. Northern leopard frogs were eliminated from the study area during the 1988 to 1993 drought because they need deep water areas to overwinter and such overwintering habitat is absent from the study area during years of severe drought; thus, it took several years for leopard frogs to repopulate the study area after the wetland ponds refilled. Throughout our period of trapping (1992 to 2021), Lithobates spp. total yearly captures ranged from 23 in 1992 (all wood frogs) to 13,861 in 2014 (fig. 50), which was an exceptional year for northern leopard frogs at the Cottonwood Lake study area. Although not as dramatic as the 2014 peak, Lithobates spp. also reached peak populations in 1999, 2003, 2009–11, and 2020. As with tiger salamanders, population trends primarily reflect changes in larval numbers as adults represented a much smaller proportion of captures (fig. 50).
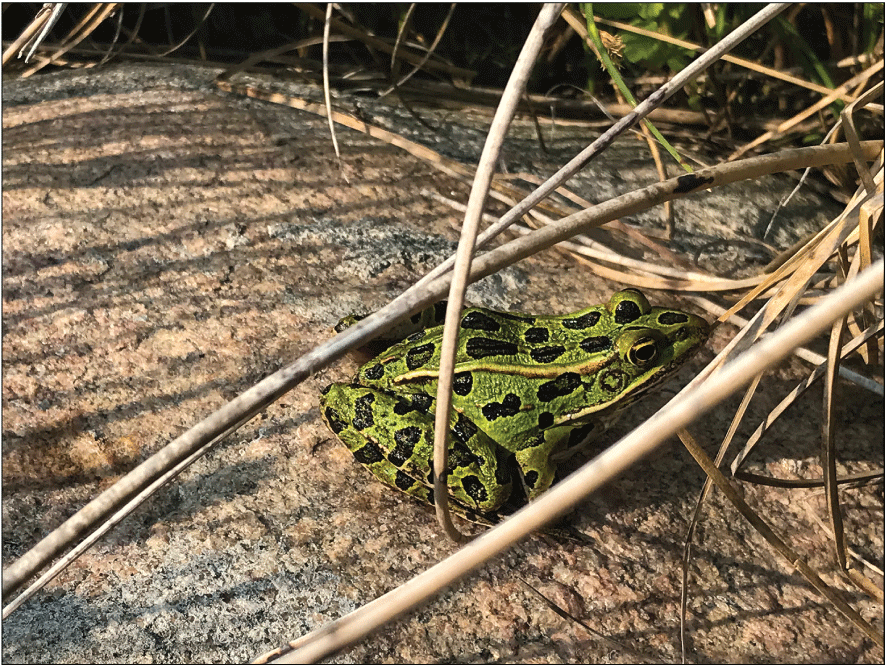
Northern leopard frog (Lithobates pipiens) at the Cottonwood Lake study area in Stutsman County, North Dakota. Photograph by David Mushet, U.S. Geological Survey.
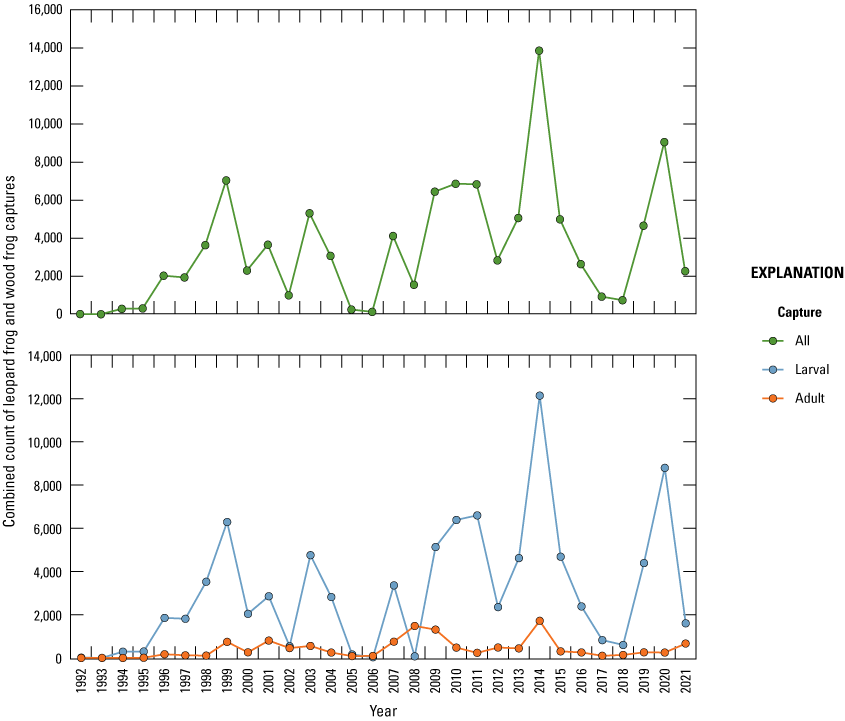
Combined northern leopard frog (Lithobates pipiens) and wood frog (Lithobates sylvaticus) captures at the Cottonwood Lake study area in Stutsman County, North Dakota, 1992–2021.
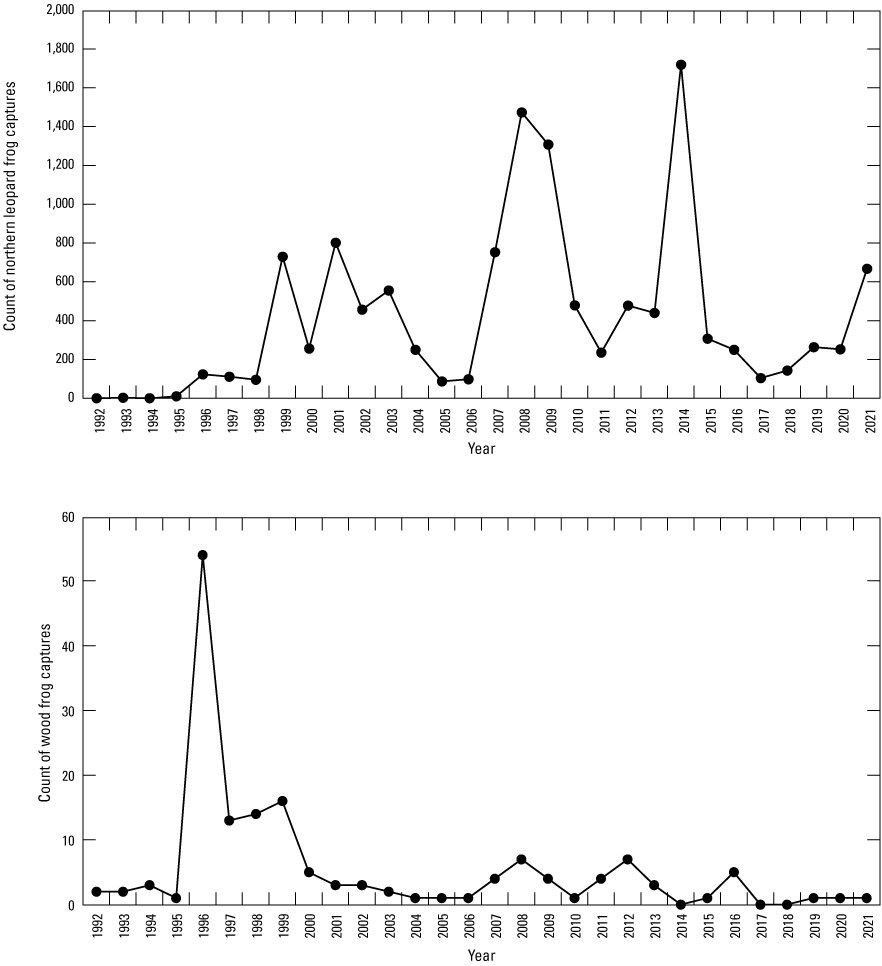
Adult northern leopard frog (Lithobates pipiens) and wood frog (Lithobates sylvaticus) captures at the Cottonwood Lake study area in Stutsman County, North Dakota, 1992–2021.
Several interesting trends are revealed by observing tiger salamander and Lithobates spp. capture rates together (fig. 52). The first trend is the suppression of Lithobates spp. from 1993 to 1997 as tiger salamander numbers steadily increased; tiger salamanders are a major predator of northern leopard frog and wood frog adults and larvae. When salamander numbers dropped in 1998, Lithobates spp. sharply increased to a peak in 1999 (fig. 52). In 2002, tiger salamanders and Lithobates spp. simultaneously reached lows in response to spread of the Ranavirus outbreak; however, the frog species seemed to recover more quickly, peaking in 2003, whereas salamander numbers remained low until 2007. In contrast, Lithobates spp. numbers dropped again following their 2003 peak and were virtually absent from the study area in 2005 and 2006. In 2009, Lithobates spp. numbers recovered again ahead of the salamanders, but both crashed in 2012. This sharp change in numbers continued for the remainder of the study period, with peaks in Lithobates spp. numbers occurring the year after a sharp drop in salamander numbers, whereas in other years, tiger salamander and Lithobates spp. numbers remained low (fig. 52).
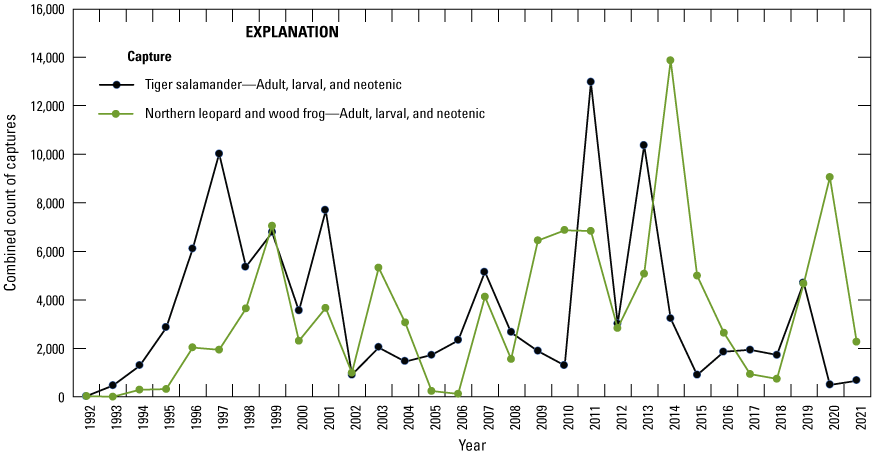
Barred tiger salamander (Ambystoma mavorteum), and northern leopard frog (Lithobates pipiens) and wood frog (Lithobates sylvaticus) combined captures at the Cottonwood Lake study area, Stutsman County, North Dakota, 1992–2021.
The traps we used to sample amphibians in wetlands were not specifically designed to sample reptiles; however, some reptiles entered the wetlands to feed on amphibians (fig. 53) or to utilize other food sources, and some of these were caught in our traps. A total of 119 painted turtles were caught in the amphibian traps. The first painted turtle was captured in wetland P4 in August 1998. Since then, painted turtles have only been captured in the other P wetlands, starting most recently in wetlands P11 (2009) and P3 (2010). There have been no captures of painted turtles in the T wetlands, except in wetland T1 owing to its direct surface-water connection to wetland P1. Prior to 1998, painted turtles had not been observed at the study area, even prior to 1992 when we began our more intensive amphibian trapping efforts. The only other reptile species captured in our amphibian traps was the plains garter snake (fig. 53). A total of 22 garter snakes were captured during 10 of the 30 years (1992–2021) that our amphibian sampling has been carried out, with between 0 and 5 garter snakes captured in any given year.
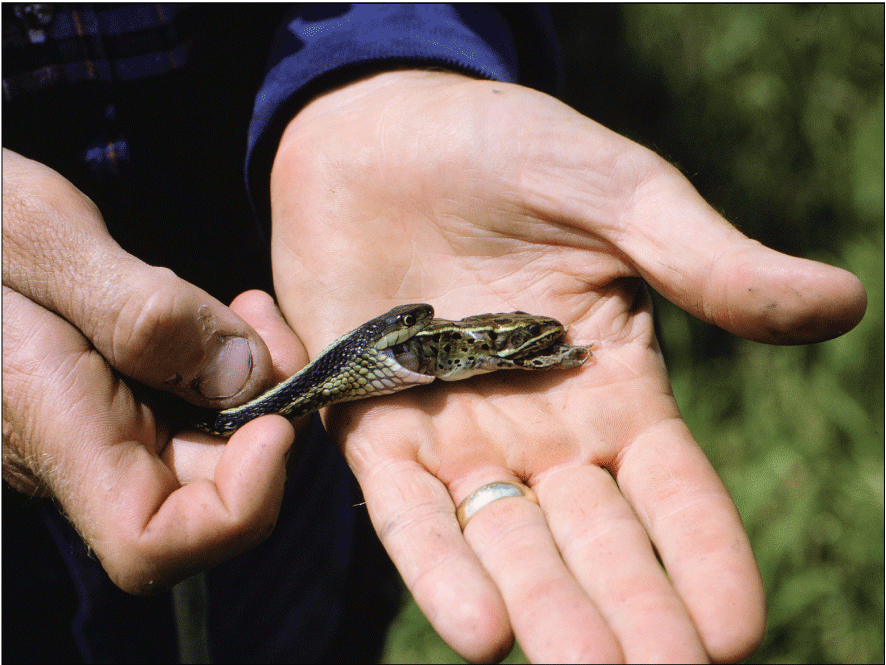
Plains garter snake (Thamnophis radix) engulfing a northern leopard frog (Lithobates pipiens) at the Cottonwood Lake study area, Stutsman County, North Dakota. Photograph by U.S. Geological Survey.
Fish
As described previously in the “Methods” section, fish are not routinely sampled in wetlands of the Cottonwood Lake study area, but their occurrence is noted during the sampling of other taxa. Our first detection of fish in any study area wetlands was on August 10, 2010, when a single fathead minnow (Pimephales promelas) was captured in an aquatic-invertebrate funnel trap in wetland P8. After first appearing, fathead minnows have been routinely captured in wetland P8 in invertebrate and amphibian traps; however, numbers remained relatively low as the wetland’s shallow, depth-limited water levels lead to large or complete die-offs each winter. Since 2010, fathead minnows likely reentered wetland P8 each spring as water flowed from wetland P8 to wetland P9 through the natural channel between these two wetlands. Fathead minnows often populate wetlands by swimming upstream in such water flowages. It is not known when minnows populated wetland P9 as this wetland is not routinely sampled for invertebrates or amphibians. However, wetlands P9 and P10 were determined to support abundant fathead minnow populations when sampled by McLean and others (2016), and the relatively deep depths of these two wetlands would allow fathead minnows to overwinter and for wetland P9 to serve as a reservoir for fathead minnows to migrate to wetland P8 when water flows allowed.
The only other study area wetland to host fish populations during the study period was wetland P11. Fathead minnows first appeared in sampling of wetland P11 on May 5, 2015. In addition, on that same date we also began capturing yellow perch (Perca flavescens) in the amphibian traps. We subsequently discovered that on April 25, 2014, the North Dakota Game and Fish (NDGF) stocked an estimated 2,670 adult yellow perch into wetland P11 (M. Johnson, NDGF, oral commun., 2016). No fathead minnows were thought to have been released with the yellow perch.
From 2015 to 2017, a total of 16 yellow perch were captured in our amphibian traps. Fathead minnows were also caught in our invertebrate funnel, but most were captured in amphibian traps during monthly amphibian surveys. Though not counted, the number of fathead minnows present in the amphibian traps could best be described as abundant. North Dakota Game and Fish sampled wetland P11 for yellow perch on August 18, 2016, and caught a “moderate number” (M. Johnson, NDGF, oral commun., 2016). In the spring of 2018, NDGF personnel reported finding dead yellow perch along the shoreline of P11. In response to this observation, NDGF sampled wetland P11 with nets in the summer of 2018 and did not catch any yellow perch (M. Johnson, NDGF, oral commun., 2018). Similarly, no yellow perch were caught in our amphibian traps in 2018. It is presumed that the entire population of yellow perch in wetland P11 died during the winter of 2017–18. North Dakota Game and Fish personnel restocked approximately 6,000 yellow perch into wetland P11 on April 26, 2019, and reported moderate numbers of adult yellow perch in a follow-up survey carried out in August 2020 (M. Johnson, NDGF, oral communication, 2020). We caught perch in amphibian traps throughout 2019 (120), 2020 (1), and 2021 (45). Note that the low number of captures in 2020 at least partially reflects a greatly reduced sampling effort that year owing to COVID–19 travel restrictions. Unlike yellow perch, following their first occurrence in wetland P11 in May 2015, fathead minnows were captured in each trapping event of this wetland from 2015 to 2021.
Birds
All Birds
Trend graphs for the 41 wetland-dependent breeding-bird species observed using wetland habitats at the Cottonwood Lake study area during the study period (1992 to 2021) are presented in appendix 11. The overall pattern for all birds combined (fig. 54) was a rapid rise in numbers during the drought-to-deluge years followed by a steady decrease to 2021. Pair numbers quickly rose once wetlands refilled in 1993, with peak numbers being reached from 1994 to 1997. After 1997, there was a relatively consistent decline in the total number of breeding pairs utilizing the study area, almost reaching the low of the drought year (1992) by 2021. The primary group driving the overall pattern was the dabbling ducks (Anas spp.). Pair use of the study area by dabbling ducks closely matched the yearly trends observed for all birds combined; however, even within the dabbling ducks, there were different patterns at the species level.
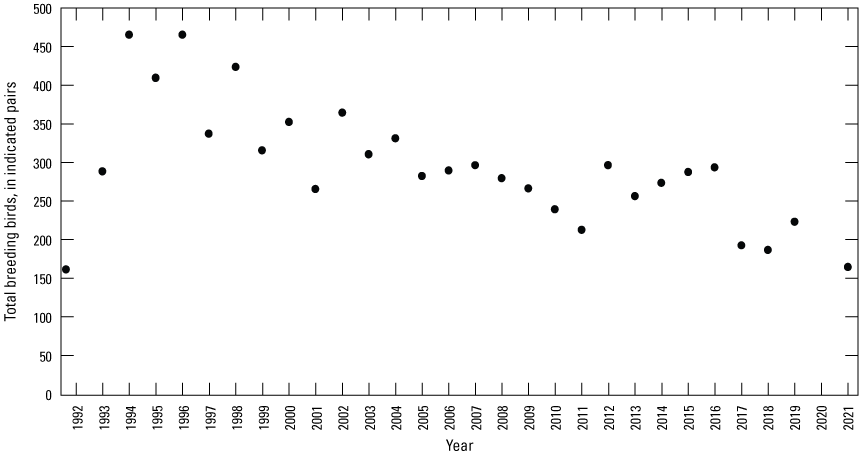
Breeding birds as the number of indicated pairs at the Cottonwood Lake study area, Stutsman County, North Dakota, 1992 to 2021.
There were five basic trend patterns observed during the study period. The first trend pattern was a sharp recovery for all birds combined from numbers during the drought year (1992) to peak numbers from 1994 to 1997, followed by a more drawn-out decline in pairs using the wetlands as wetlands stayed ponded in response to the extended years of high precipitation (fig. 55). Species following this pattern included blue-winged teal (Anas discors) (fig. 55A), American wigeon (Anas americana), gadwall (Anas strepera), and green-winged teal (Anas crecca), all of which are dabbling ducks. The second pattern consisted of a slower increase in pair numbers following reflooding, with peak numbers being reached during the middle years of the study period, followed by an equally slow decline, resulting in an arched pattern. Species following this pattern included the lesser scaup (Aythya affinis) (fig. 55B) and mallard (Anas platyrhynchos). The third pattern was a similar quick rise once wetlands refilled in 1992, followed by a rapid decline from peak numbers in the immediate years following refilling. Species that displayed this pattern included the redhead (Aythya americana) (fig. 55C), northern pintail (Anas acuta), ring-necked duck (Aythya collaris), sora (Porzana carolina), and yellow-headed blackbird (Xanthocephalus xanthocephalus). The fourth pattern was a relatively steady increase in numbers throughout the study period. Examples included the red-winged blackbird (Agelaius phoeniceus) (fig. 55D) and the sedge wren (Cistothorus platensis). Lastly, some species (for example, marsh wren [Cistothorus palustris] [fig. 55E] and common yellowthroat [Geothlypis trichas]) were most abundant during the drought year and quickly declined in numbers once wetlands reflooded and emergent vegetation diminished.
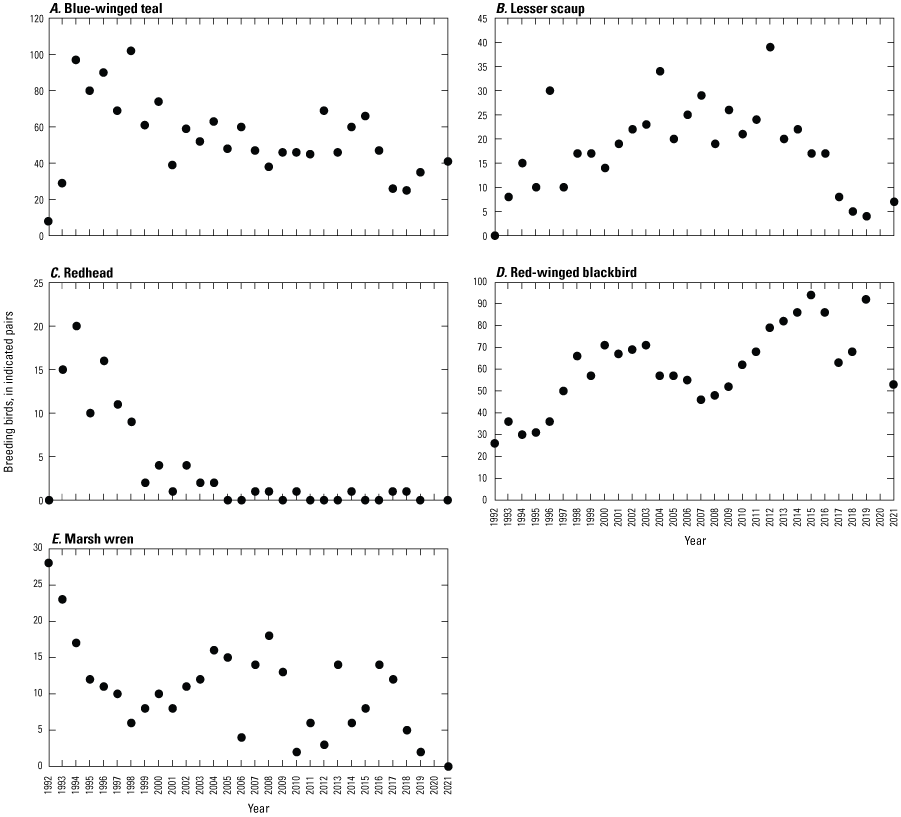
Examples of five general patterns displayed by the number of breeding-bird indicated pairs at the Cottonwood Lake study area, Stutsman County, North Dakota. A, Blue-winged teal (Anas discors). B, Lesser scaup (Aythya affinis). C, Redhead (Aythya americana). D, Red-winged blackbird (Agelaius phoeniceus). E, Marsh wren (Cistothorus palustris). Note that bird surveys were not carried out in 2020 owing to fieldwork restrictions associated with the COVID–19 pandemic.
Waterfowl
Although it has commonly been assumed that the cycling of prairie-pothole wetlands between fully ponded and dry conditions is required to maintain productivity, data from the Cottonwood Lake study area provide the first decisive evidence of this phenomena in a natural, unmanaged wetland system. However, invertebrate biomass data (fig. 42) clearly indicate that the decline in productivity is limited to temporarily and seasonally ponded wetlands. Semipermanently and permanently ponded wetlands actually showed a slight increase in productivity despite being continuously ponded from 1993 to 2021. The breeding-bird communities responded to these differences as they selected and utilized productive wetlands that produced the food resources needed for their reproduction. Following the drought that ended in July 1993, prairie-pothole wetlands became very productive as nutrients in the soils and plant materials were released into the ponded water and taken up by plants and invertebrates. The increase in invertebrate biomass in the study area’s wetlands in the years immediately following ponding is shown in figure 42. This increase in primary and secondary productivity was reflected in taxa higher up in trophic levels, including tiger salamanders (fig. 47) and waterfowl (fig. 56). However, following the ponding of the wetlands and continued maintenance of high-water levels, productivity began to decline in the T wetlands. This decline in productivity is reflected in a remarkably steady decline in the numbers of dabbling and diving ducks using the Cottonwood Lake study area wetlands for breeding (fig. 56). Dabbling duck pairs at the study area peaked the year after reponding (1994) at 210 pairs and then steadily declined until 2018 when just 48 dabbling duck pairs used the study area; numbers were slightly higher in 2019 and 2021 when 72 and 60 dabbling duck pairs were counted, respectively. The only year lower than 2018 in terms of dabbling duck pairs was during the peak of the drought (1992) when only 27 pairs used the Cottonwood Lake study area wetlands; 96 pairs used the wetlands in 1993. Diving ducks responded slightly slower to the increasing water levels, with peak pairs (74) occurring in 1996, and then declined tenfold to only seven pairs using the wetlands in 2019 and eight pairs in 2021. Like dabbling ducks, diving duck pairs were lowest during 1992 when not a single breeding pair occurred at the study area.
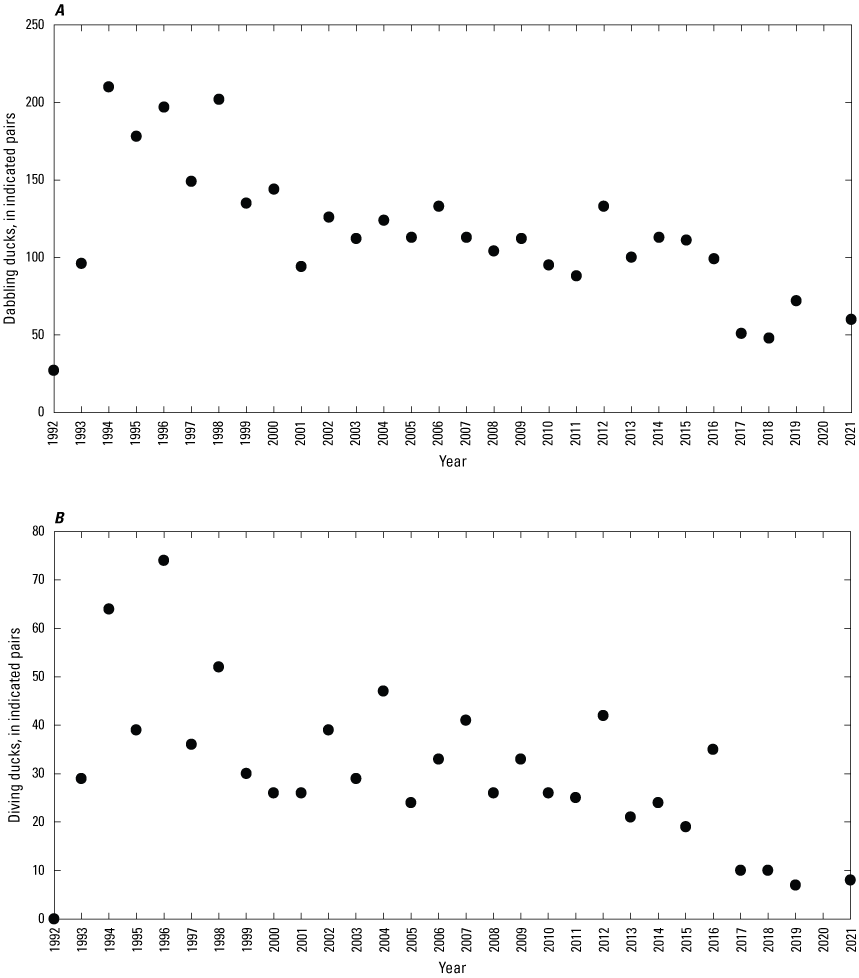
Ducks as the number of indicated pairs at the Cottonwood Lake study area, Stutsman County, North Dakota, 1992 to 2021. A, Dabbling ducks. B, Diving ducks.
The decline in duck numbers following reponding illustrates the importance of temporarily and seasonally ponded wetlands in maintaining prairie-pothole wetland productivity. One metric that has been used as a measure of productivity is years in a hemi-marsh stage, which is a roughly 50/50 mix of emergent vegetation and open water (Johnson and others, 2005). However, this metric is problematic because the hemi-marsh concept was developed for semipermanently ponded wetlands and our data indicate that it is the condition of temporarily and seasonally ponded wetlands that really drives duck population numbers more than the mix of open water and vegetation. For example, wetland P8 remained in a hemi-marsh state from 1993 to 2021; however, it showed a similar response in the number of breeding duck pairs using this wetland as the other wetlands that converted to almost 100-percent open water (that is, a lake state).
Although a decline in dabbling and diving duck numbers was observed from the mid-1990s to 2021, these declines were not reflected in the larger scale population surveys carried out annually by the FWS (U.S. Fish and Wildlife Service, 2019); however, the creation of newly ponded areas that have appeared as the climate has shifted in response to increased precipitation was not considered during these surveys. Even at the well-studied Cottonwood Lake study area, three new wetlands have appeared. We have designated these newly created wetlands as wetlands T10, T11, and T12; however, they have not yet been incorporated into our routine surveys, including the breeding-bird surveys, so ducks using these newly ponded wetlands do not show up in the pair totals. These new wetlands are small and each do not likely support more than a couple pairs of dabbling ducks, so including these wetlands in pair counts would not make up for the marked declines in waterfowl pairs that were observed; however, at a large scale, and especially a scale that includes agricultural lands where runoff into depressions from upland is much greater than in natural grassland settings, the number of newly created ponds might indeed account for different trends observed between the Cottonwood Lake study area data and the FWS pair counts (U.S. Fish and Wildlife Service, 2019).
Blackbirds and Other Marsh Birds
In seasonally ponded wetlands, deep-marsh emergent vegetation suitable for breeding yellow-headed blackbirds did not exist at any time, but red-winged blackbirds used the shorter vegetation of seasonal wetlands and any surrounding woody vegetation as breeding habitat. The result was that seasonal wetlands contributed to an overall increase in red-winged blackbird numbers at the study area as the climate and wetlands transitioned from dry to wet (fig. 57).
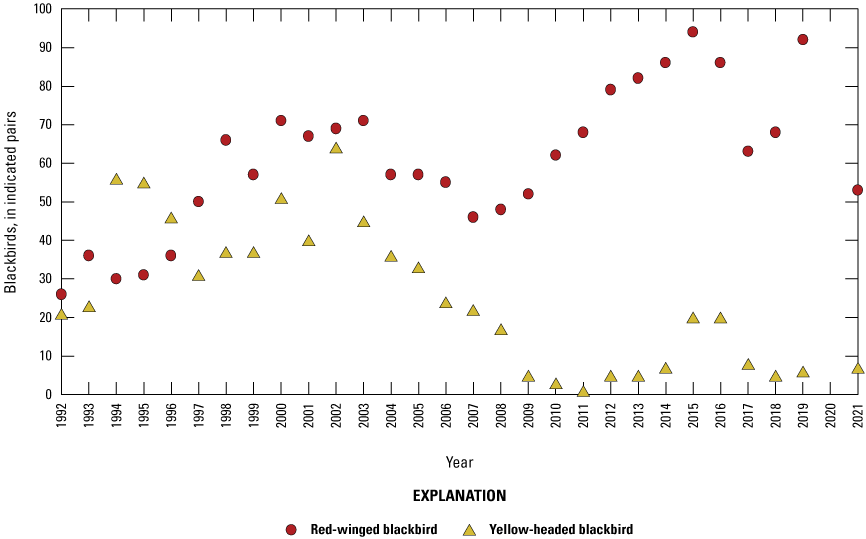
Red-winged blackbird (Agelaius phoeniceus) and yellow-headed blackbird (Xanthocephalus xanthocephalus) territorial males (indicated pairs) at the Cottonwood Lake study area, Stutsman County, North Dakota.
As vegetative structure in semipermanently ponded wetlands of the Cottonwood Lake study area changed in response to hydrologic changes, both species of blackbirds responded in different ways. The response of each species was based primarily on whether or not water depths in wetlands were topographically limited. Yellow-headed blackbirds rely on dense emergent vegetation over water for successful breeding (Twedt and Crawford, 1995) and do not shift to other cover types if the deep-marsh vegetation disappears or is absent from a marsh. Thus, when closed-basin wetlands lost their deep-emergent vegetation owing to prolonged inundation, the yellow-headed blackbird abandoned these sites. For the study area as a whole, total yellow-headed blackbird numbers actually increased between 1992 and 2003 because suitable habitat continued to be available in nearby open-basin semipermanent wetlands; however, as the wet period persisted, yellow-headed blackbird numbers dropped to only a single indicated pair by 2011 and continued to inhabit the study area in low numbers for the remainder of the study period (fig. 57). Thus, temporal changes in yellow-headed blackbird numbers in response to climate cycles can only be predicted if the hydrologic and topographic settings of wetlands and differing responses of plant communities are considered.
In closed-basin semipermanent wetlands, even though red-winged blackbirds were subjected to the same losses of deep-marsh emergent vegetation as yellow-headed blackbirds, their numbers increased during the study (fig. 57). Breeding red-winged blackbirds are more flexible than yellow-headed blackbirds in their habitat selection (Miller, 1968) and nest in a wider range of habitats in and around wetlands; however, where both species are present, red-winged blackbirds are excluded from the deep-marsh stands by the larger, more aggressive male yellow-headed blackbirds (Orians and Willson, 1964). At the Cottonwood Lake study area, when yellow-headed blackbirds abandoned these wetlands after high water had drowned most deep-marsh emergent vegetation (by about 1996–98), the number of territorial male red-winged blackbirds doubled beginning about 1997 (fig. 57). By comparison, in open-basin semipermanent wetlands where yellow-headed blackbird numbers increased (fig. 57), red-winged blackbird numbers remained essentially stable at rather low levels. With the initial flooding in 1993, it is likely red-winged blackbirds were able to occupy only the few locations in open-basin wetlands not suitable to yellow-headed blackbirds. Because these sites remained unsuitable for yellow-headed blackbirds throughout the study, the small number of breeding red-winged blackbirds present initially were able to continue to occupy these sites even after the yellow-headed blackbird numbers increased (fig. 57).
Other marsh birds (for example, marsh wrens) responded similarly to the yellow-headed blackbirds. As areas of deep-marsh vegetation dropped at the study area in closed-basin wetlands that converted to lake-like conditions, the number of marsh wren pairs declined (fig. 58).
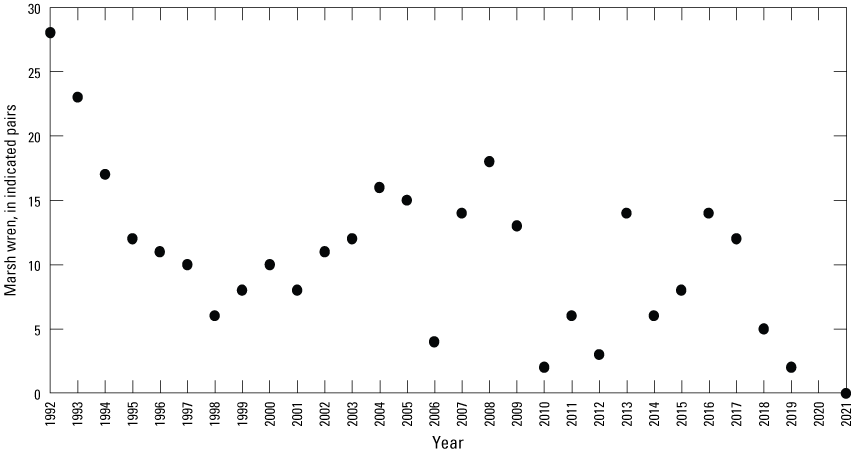
Marsh wren (Cistothorus palustris) pairs at the Cottonwood Lake study area, Stutsman County, North Dakota, 1992–2021.
Other Water Birds
American coots (Fulica americana) (fig. 59) were absent from all study area wetlands in 1992 and only five pairs were counted in 1993; however, the deep-water conditions that followed created ideal conditions for breeding coots in the years immediately following reflooding. In 1994, 59 coot pairs occupied the wetlands of the Cottonwood Lake study area. This number increased to 68 and 71 pairs in 1995 and 1996, respectively. The American coots utilized the recently flooded cattails present across many of the wetlands to build their overwater nests; however, the water depth soon submerged the remaining cattail stems, resulting in lake-like conditions and American coot use of the study area declined. From 2003 to 2021 (with the exception of 2010 when 11 pairs were counted) two or less pairs of coots occupied the study area each year (fig. 59).
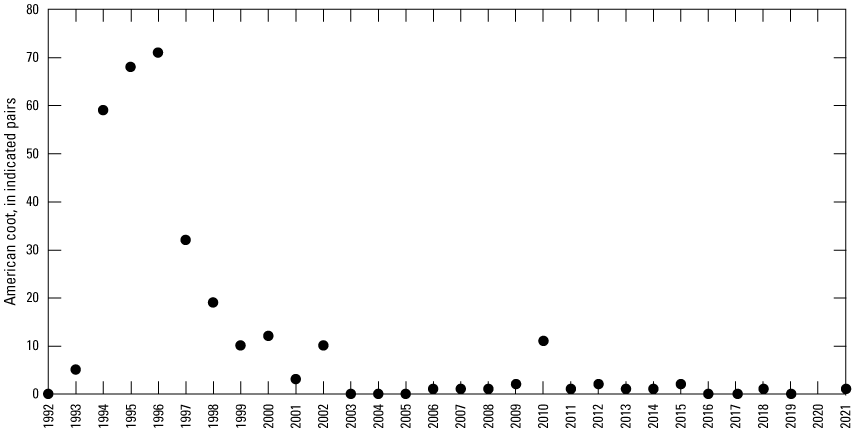
Number of American coot (Fulica americana) breeding pairs in wetlands of the Cottonwood Lake study area, Stutsman County, North Dakota.
Mammals
As noted in the “Methods” section, the only data on mammals at the Cottonwood Lake study area are in the form of observational information obtained while performing other fieldwork at the study area. This observational information is provided in this report as a base upon which future data-collection efforts can be built.
During the study, 22 mammal species were observed in the Cottonwood Lake study area (table 2). It is certain that additional species exist at the study area but were not observed. These additional species likely include bats (work at the study area is not carried out at night), and fossorial species such as eastern moles (Scalopus aquaticus) and pocket gophers (Geomys bursarius, Thomomys talpoides). Of the species observed, some have been present throughout the study period, whereas others have varied in their occurrence. For example, increases in coyote (Canis latrans) populations suppressed red fox (Vulpes vulpes) populations as coyotes repopulated not only the study area, but much of the PPR (Sovada and others, 1995). Additionally, muskrats (Ondatra zibethicus) and mink (Mustela vison) were absent from the study area during the drought years from 1988 to 1993. Once wetlands refilled, muskrats returned to the study area (fig. 60), with the return of mink following a few years later. American beaver (Castor canadensis), absent from the study area during the early years of the study, populated two wetlands (wetlands P2 and P7) when water levels increased to historical depths in the late 1990s. Once present at the study area, beavers quickly decimated most of the remaining aspen trees bordering these two wetlands (that is, trees that had not already been flooded out by high water levels; fig. 35). Additionally, eastern cottontails (Sylvilagus floridanus) and white-tailed jackrabbits (Lepus townsendii), once commonly seen at the study area, are now rare occurrences, likely as a result of changes in predator communities, habitats, and climate (Brown and others, 2020).
Table 2.
Mammals observed at the Cottonwood Lake study area, Stutsman County, North Dakota, 1967 to 2021.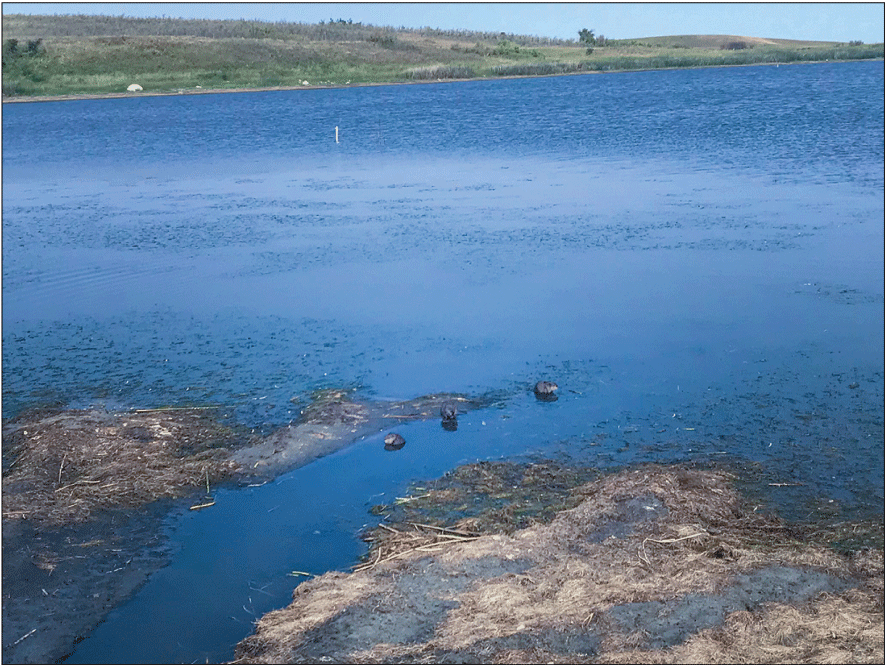
Three young muskrats (Ondatra zibethicus) along the shore of wetland P4 at the Cottonwood Lake study area, Stutsman County, North Dakota, August 18, 2021. Photograph by David Mushet, U.S. Geological Survey.
An interesting observation from the study area is the very limited role that muskrats played in the transition of wetlands to a lake stage. van der Valk and Davis (1978) describe a marsh cycle in which change from a regenerating marsh to a lake stage marsh is driven by stable water levels and muskrat alterations of deep-marsh vegetation, primarily cattails. At the Cottonwood Lake study area, this change was driven in the early 1990s by substantial increases in precipitation and runoff alone, which led to rapidly increasing water levels (fig. 32) and a transition to the lake stage. The transition occurred so rapidly in wetlands without overland outlets that wetland plant communities forming the typical deep-marsh, shallow-marsh, and wet-meadow zones were often completely absent and open-water nonvegetated areas directly abutted upland plant communities. Habitat for muskrats, and later their mink predators, was limited to the few wetlands that had overland outlets and retained deep-marsh vegetation around their peripheries (for example, wetlands P3 and P8). Thus, although muskrat activities can contribute to wetland shifts to a lake stage, this change can also, and likely more rapidly, be affected solely by variations in water levels driven by meteorological changes as described by van der Valk (2005b).
Greenhouse Gases
Studies of PPR wetlands have shown that GHG fluxes and soil properties are spatially and temporally variable at multiple scales (Gleason and others, 2009; Badiou and others, 2011 Finocchiaro and others, 2014; Tangen and others, 2015; Bansal and others, 2018; Tangen and Bansal, 2020). Overall trends from the wetland zone (that is, locations 1–5; fig. 26B) showed that average flux rates of all three GHGs and SOC concentrations from the smaller, temporarily or seasonally ponded wetlands (T3, T5, T6, T7, T8, T9) exceeded those of the larger semipermanently ponded wetlands (P1, P3, P4, P6, P8, P11; fig. 61). Average CO2, CH4, N2O, and SOC (across the wetland zone locations) of the T wetlands were approximately 3, 2, 8, and 2 times greater than those of the P wetlands, respectively (fig. 61).
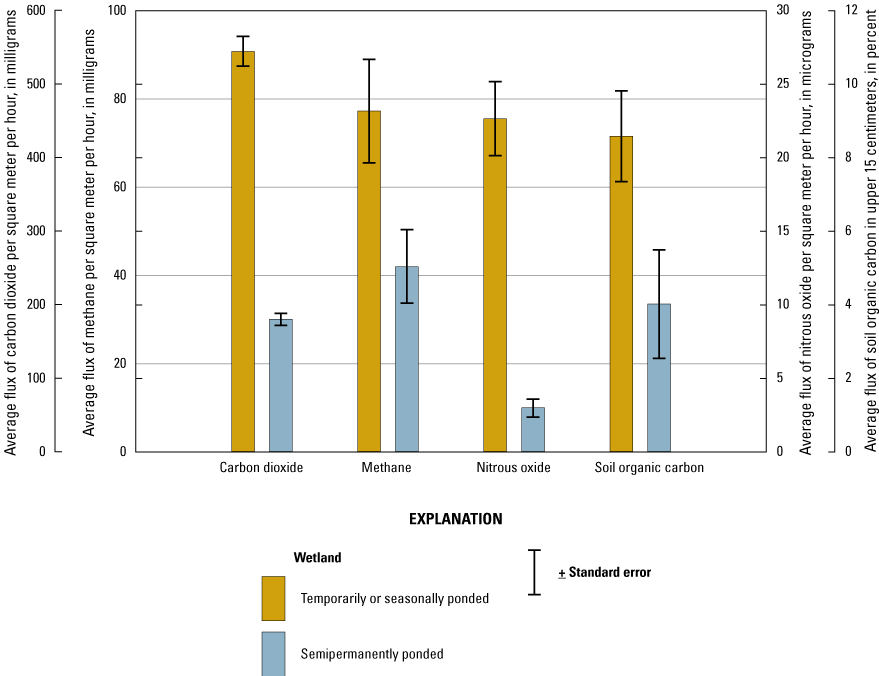
Average (plus or minus standard error) flux of carbon dioxide, methane, nitrous oxide, and soil organic carbon for temporarily or seasonally ponded (T) wetlands and semi-permanently ponded (P) wetlands from the Cottonwood Lake study area. Data represent growing season (April–September) wetland zone samples (locations 1–5) from 2009 to 2016.
Fluxes and SOC concentration from wetlands of the Cottonwood Lake study area (Tangen and Bansal, 2019b) varied by sampling location (fig. 62), with distinct trends differing between the T and P wetlands. Average respiratory CO2 fluxes were substantially lower in locations that were consistently ponded, such as the inner chambers (locations 1–4) of P wetlands, compared to locations that were typically dry (that is, uplands) or experience wet-dry oscillation, such as in T wetlands (fig. 62A). For the P and especially T wetlands, average CH4 fluxes generally decreased from the wetland center to edge, with essentially no CH4 flux in the aerated uplands. (fig. 62B). The T wetlands exhibited decreasing average N2O flux from the center of the wetlands to the wetland edge and uplands, whereas the P wetlands were characterized by lower N2O fluxes that increased slightly from the wetland zone to the uplands (fig. 62C). Average SOC content of the T wetlands was higher in the wetland zone than the upland zone (fig. 62D).
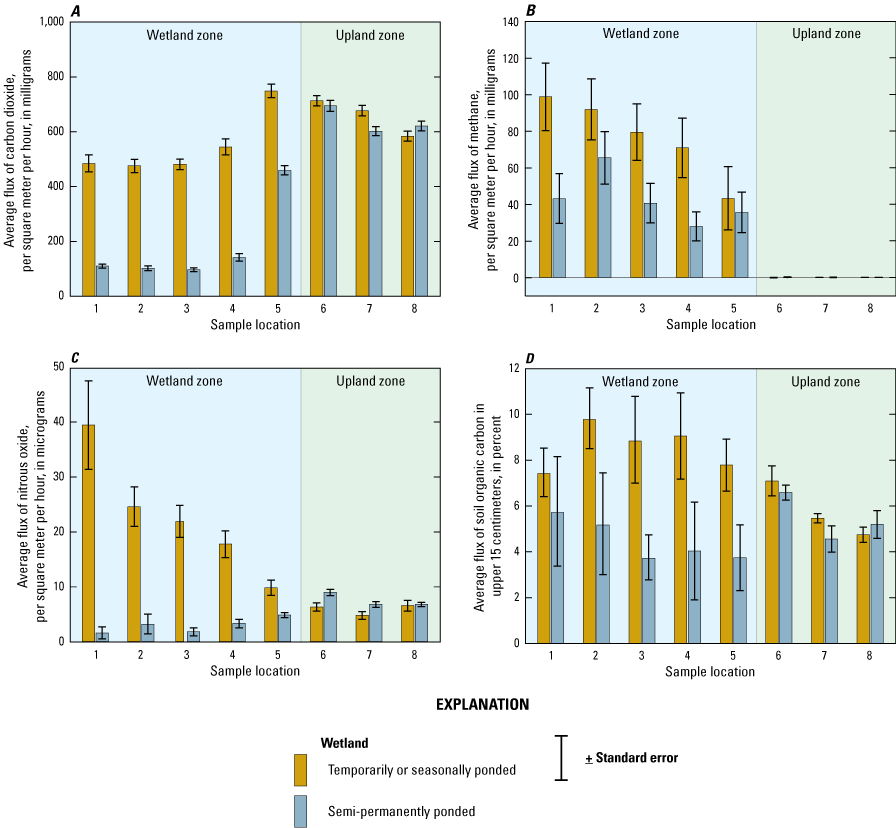
Average (plus or minus standard error) flux or concentration by sample location at the Cottonwood Lake study area, Stutsman County, North Dakota. A, Carbon dioxide. B, Methane. C, Nitrous oxide. D, Soil organic carbon.
Average GHG fluxes from the wetland zone displayed considerable interannual and intra-annual variability (figs. 63, 64). Average annual CO2 flux had a 3- and 4-fold difference between the highest and lowest years for the T and P wetlands, respectively (fig. 63A). Of the three GHGs, average annual CH4 showed the greatest variability, with the highest flux year exceeding the lowest by >3,000 and about 150 times for the T and P wetlands, respectively (fig. 63B). The N2O flux was more variable than CO2, with the highest values for the T and P wetlands exceeding the lowest values by 11 and 22 times, respectively (fig. 63C). Fluxes of all three GHGs also displayed distinct seasonality. Carbon dioxide and CH4 followed a classic hump-shaped trend with peak emission in July (figs. 64A, B); N2O flux did not display a similar decline as CO2 or CH4 in August or September (fig. 64C), but instead increased during those months with peak N2O emission in September.
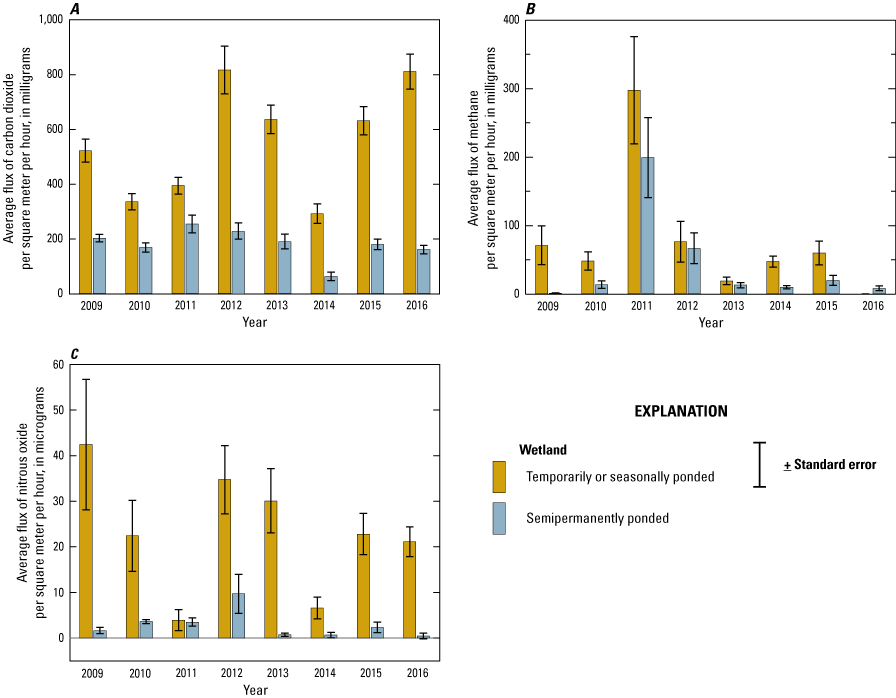
Average (plus or minus standard error) annual flux for temporarily or seasonally ponded (T) wetlands and semi-permanently ponded (P) wetlands from the Cottonwood Lake study area, Stutsman County, North Dakota. A, Carbon dioxide. B, Methane. C, Nitrous oxide. Data represent growing season (April–September) wetland zone samples (locations 1–5).
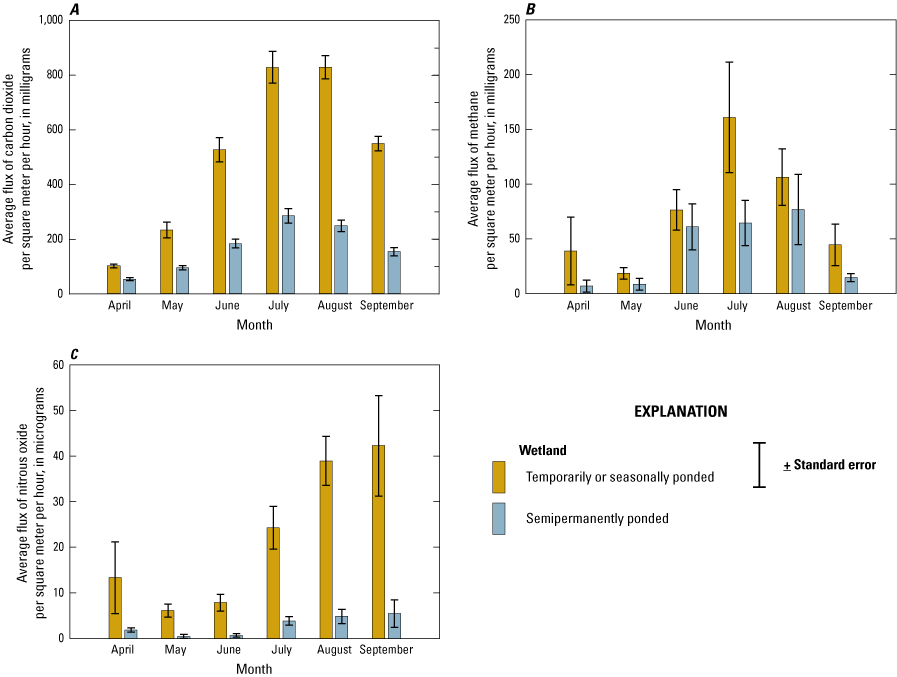
Average (plus or minus standard error) monthly flux for temporarily or seasonally ponded (T) wetlands and semi-permanently ponded (P) wetlands from the Cottonwood Lake study area, Stutsman County, North Dakota. A, Carbon dioxide. B, Methane. C, Nitrous oxide. Data represent growing season (April–September) wetland zone samples (locations 1–5) from 2009 to 2016.
As part of several studies focused on the abiotic factors that drive GHG fluxes, Bansal and others (2016) determined that CH4 flux rates of wetlands of the Cottonwood Lake study area displayed a positive relation with temperature, regardless of wetland classification (T or P wetlands). Additionally, in a study of wetland T5, Bansal and others (2018) revealed distinct diel patterns in CH4 flux that differed by hydrologic status, with strong daytime peaks when wetlands were ponded compared to semisaturated or dry conditions. In a study of wetlands P7 and P8, Dalcin Martins and others (2017) suggested that conversion of large dissolved organic carbon pools resulted in extremely high CH4 emissions. Additionally, assessments of these two wetlands revealed some of the highest sulfate reduction rates reported for wetlands (Dalcin Martins and others, 2017).
Lessons Learned
The Wetland Continuum
One of the chief contributions of the Cottonwood Lake study area to date has been the insights into the functioning of prairie-pothole wetlands that formed the basis from which the Wetland Continuum concept (Euliss and others, 2004) could be developed. Euliss and others (2004) describe how insights into a wetland’s potential ecological communities at a particular point in time could be obtained by understanding the unique position in which a wetland exists along two continuous axes, one defined by positioning along a dry to wet continuum and the other by positioning along a groundwater axis ranging from recharge to discharge (fig. 65). Thus, information gained from short-term studies could be placed into a larger ecological context, filling in gaps in knowledge and contributing to a deeper understanding of these highly dynamic systems. The Wetland Continuum concept combined knowledge gained by early studies from the Cottonwood Lake area of groundwater connections and resultant effects on pond duration and chemical composition of ponded water in wetlands. These factors were then tied to the potential plant, invertebrate, amphibian, fish, and bird community responses through the Wetland Continuum concept (Euliss and others, 2004). Data collected from the Cottonwood Lake study area were key to making these connections.
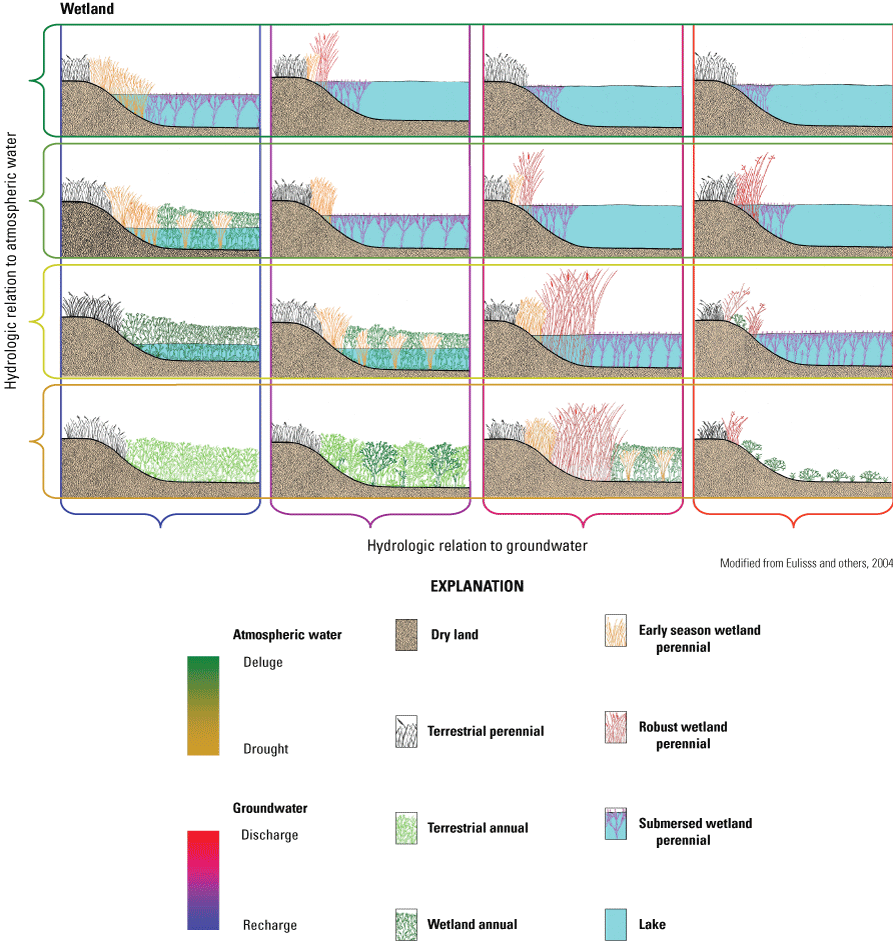
The original Wetland Continuum framework described by Euliss and others (2004).
Information from other research efforts outside of the Cottonwood Lake study area also contributed to development of the Wetland Continuum concept. The River Continuum concept from Vannote and others (1980) provided insights into how invertebrate community composition of rivers changes along flow paths from headwaters to the highest order systems. Harris and Marshall (1963) were the first to show how wetland-plant communities of managed wetlands shifted in response to pond drying and flooding. van der Valk and Davis (1978) showed how the plant communities of semipermanently ponded wetlands shifted among dry marsh, regenerating marsh, degenerating marsh, and lake stages in response to meteorological cycles.
As originally proposed, the Wetland Continuum concept was envisioned as being applicable to all depressional wetlands, not just prairie-pothole wetlands. However, although providing an overarching framework for depressional wetlands, the generalized nature of the concept necessarily limited its specificity as related to prairie-pothole wetlands. Hayashi and others (2016) provided a revision of the Wetland Continuum concept that was specific to prairie-pothole wetlands and the limitations that glacial till places on the ability of wetlands to connect through the groundwater-flow paths described in the original conceptualization (Euliss and others, 2004). In the Hayashi and others (2016, p. S245) revision, the “hydrologic relation to groundwater” is renamed “hydrologic position,” and, whereas the original axis ranged from recharge to discharge in terms of water leaving or entering a wetland through groundwater, the revised axis ranges from high to low. Thus, a wetland situated high in the hydrologic flow system could connect to wetlands at lower hydrologic positions by way of surface flows or flows through the fractured surface till, not necessarily through deeper, much slower, groundwater connections. These more localized near-surface flows thus exerted greater influence on ponded-water chemistry than the deep, slow groundwater flows described in Swanson and others (1988) and cited in Euliss and others (2004) and in earlier studies such as Lissey (1971). The studies of Eisenlohr and others (1972), as well as others (Rozkowska and Rozkowski, 1969; Rozkowski, 1969; Eisenlohr and others, 1972; LaBaugh and others, 1998; van der Kamp and Hayashi, 2009; Heagle and others 2013; Hayashi and others, 2016; LaBaugh and others, 2018), determined that groundwater flow contributing solutes to the ponds in glacial till is primarily from local, shallow groundwater, and, as noted by Eisenlohr and others (1972), that salinity then varies from pond to pond based on if solutes are lost by flow from the pond to groundwater or by overland flow at spill points in the basin. The analysis of the chemical characteristics of numerous ponds over a large transect in Stutsman and Kidder Counties, including ponds in glacial outwash, superimposed on results of large-scale, rather than individual watershed, groundwater-flow modeling, led to the original supposition in the original Wetland Continuum concept regarding groundwater flow-path length and salinity of receiving ponds.
A second revision to the Wetland Continuum concept was proposed by Mushet and others (2018). Although the original Euliss and others (2004) version of the Wetland Continuum concept had wetlands at fixed positions in their hydrologic relation to groundwater, the Mushet and others (2018) revision allowed for wetlands to transition to other positions along the axis under extreme and prolonged meteorological changes. One interesting aspect of allowing wetlands to shift along the hydrologic axis is that it allowed for state changes as recently observed by McKenna and others (2017). Although not articulated by Mushet and others (2018), these state changes could lead to the transitioning of nonwetland depressions (for example, ephemeral wetlands as defined by Stewart and Kantrud, 1971) into wetlands at the highest end of the continuum. This addition of wetland areas to the landscape was based on observations at the Cottonwood Lake study area when the depressions, now known as wetlands T10, T11, and T12, developed persistent wetland features during the wet period that has persisted for almost 30 years, sufficiently long to be considered a shift in climate. The addition could also include the transitioning of wetlands to lakes at the lower positions as observed at the study area. If the climate shifts to drier conditions, the implication is that wetland areas could become nonwetland and lakes could become wetlands. A revised version of the Wetland Continuum concept that incorporates the Hayashi and others (2016) and the Mushet and others (2018) revisions is shown in figure 66.
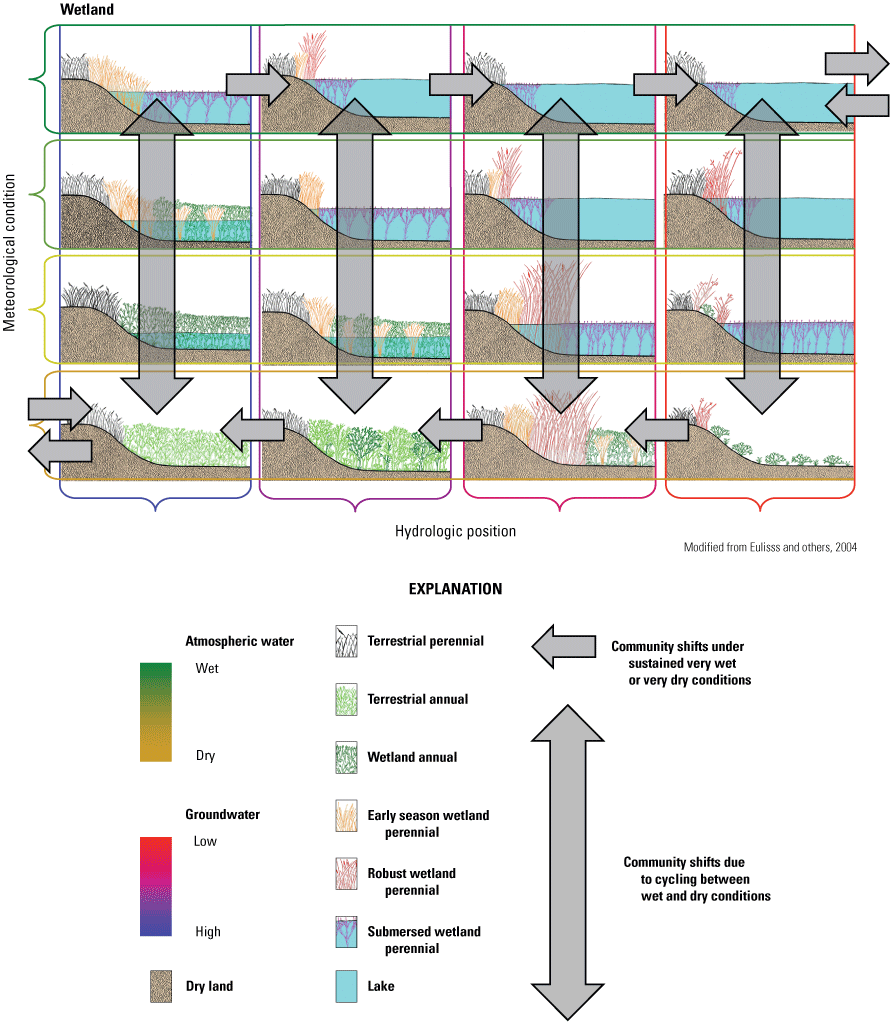
A revision of the Wetland Continuum concept (Euliss and others, 2004) that incorporates changes suggested by Hayashi and others (2016) and Mushet and others (2018).
Groundwater Flows
Lissey (1971) groundwater-flow patterns flow from one wetland to another in a cascading series of wetlands of lower elevation along a regional slope. This flow pattern rarely is the case at the Cottonwood Lake study area. Much of the time, a groundwater trough or a groundwater mound either intercepts or prevents flow from an upgradient wetland to a nearby wetland with a lower elevation (Rosenberry and Winter, 1997; Winter and Rosenberry, 1998; Winter, 2003). The low-permeability geologic material causes large changes in the groundwater table in response to withdrawals by evapotranspiration or recharge from snowmelt or rainfall. This generally low-permeability sediment also is the primary reason for the steep slopes in the water table near the flanks of the Coteau du Missouri and the high-water table within the bulk of the Coteau. If the sediments had been uniformly sandy, groundwater slopes would be less steep and fewer wetlands would contain ponded water, and the period of ponding would be shorter for those wetlands that did pond water.
Geologic materials are not uniform, however, and sediment permeability is not uniformly small. Occurrences of sandy strata embedded within the finer porous matrix are common, facilitating flow and interwetland connectivity by way of groundwater and shortening travel time between wetlands (Neff and Rosenberry, 2018). A good example is the sandy sediment surrounding and between wetlands T2 and P8 at the Cottonwood Lake study area (fig. 5 in Winter, 2003). In such settings, occurrences of substantial water-table mounds or troughs likely are less frequent, smaller, and of shorter duration than where sediments are less permeable.
Because the bulk of sediment in the Coteau du Missouri, the setting of the Cottonwood Lake study area, is of generally low permeability, making the water table high and close to the land surface, relatively steep water-table slopes intersect even steeper land-surface slopes either between wetlands or along the flank of the Coteau du Missouri. At those intersections, seeps or small springs develop, providing the source of water at the heads of ephemeral streams that flow to streams that drain the Coteau (Neff and others, 2020). If sediment in the Coteau du Missouri were generally more permeable, ephemeral streams would be less common and springs at the base of the Coteau would be much more common.
Vertical flow from wetlands situated high on the Coteau du Missouri, either to nearby wetlands of substantially lower elevation or to deeper groundwater beneath the wetland, is difficult to observe directly, although it has been inferred based on geophysical investigations (Levy and others, 2018a) and is certainly feasible (Winter, 2003; Neff and Rosenberry, 2018122). Large, nested flow paths within the groundwater system, leading to complex interwetland connectivity by way of groundwater (Winter and Carr, 1980), are unlikely because such connectivity would require large and unrealistic values of anisotropy (Neff and Rosenberry, 2018). Thus, as observed at the Cottonwood Lake study area and elsewhere (Hayashi and others, 2016), surface and near surface groundwater flows are the means of transporting solutes among wetlands.
Winter precipitation that is stored on the landscape is released to wetlands by way of overland flow in the spring. Because of the commonly contiguous and thick soil frost that prevents recharge to groundwater during the spring snowmelt, convergence of overland flow from drainage areas that are much larger than the ponded wetland surface results in much larger rises in wetland stage than would be predicted based solely on precipitation amount (Eisenlohr and others, 1972). Spring snowmelt, and associated runoff, is usually the single largest hydrologic event for wetlands on the Coteau du Missouri and is largely responsible for the existence of so many ponded depressions and relative freshness of the ponded water.
Groundwater Solutes
Climate-induced reversals of hydraulic gradients and associated wetland recharge-discharge function have important implications for surface-subsurface salt cycling and the ability of closed-basin wetland ponds to maintain moderate salinities under historically semi-arid climate conditions. On a seasonal basis, evapotranspiration around the perimeter of wetlands can induce outseepage and concentration of salts in a “salt ring” zone around discharge wetlands, which can mobilize back into surface water when ponds expand during times of wet climate (Rosenberry and Winter, 1997; LaBaugh and others, 2016). Even longer reversals of wetland hydrologic function from discharge to recharge have been hypothesized to have occurred during paleodroughts (that is, droughts that occurred before measuring instruments were developed). During these droughts, groundwater mounds surrounding closed-basin wetlands would dissipate and the water table would likely drop substantially below the sediment surface (Levy and others, 2018a).
Levy and others (2018a) mapped saline (total dissolved solids >10,000 milligrams per liter) groundwater lenses 2–4 m below the perimeter and bathymetric low of the wetland P1 pond, with fluid conductivities substantially exceeding those observed in the surrounding groundwater-flow system. Levy and others (2018a) proposed a process of “drought-induced recharge,” whereby closed-basin wetlands may effectively function as salt infiltration basins when regional water tables drop several meters below the land surface (fig. 67). Development of secondary porosity in wetland sediments by penetration from terrestrial plant roots and desiccation fractures provides a hydrologic mechanism by which salts can be flushed to depth below the wetland bed and occluded at depth when wet times resume—which was observed directly when wetland P1 dried completely during the 1988–93 drought (Swanson and others, 2003).
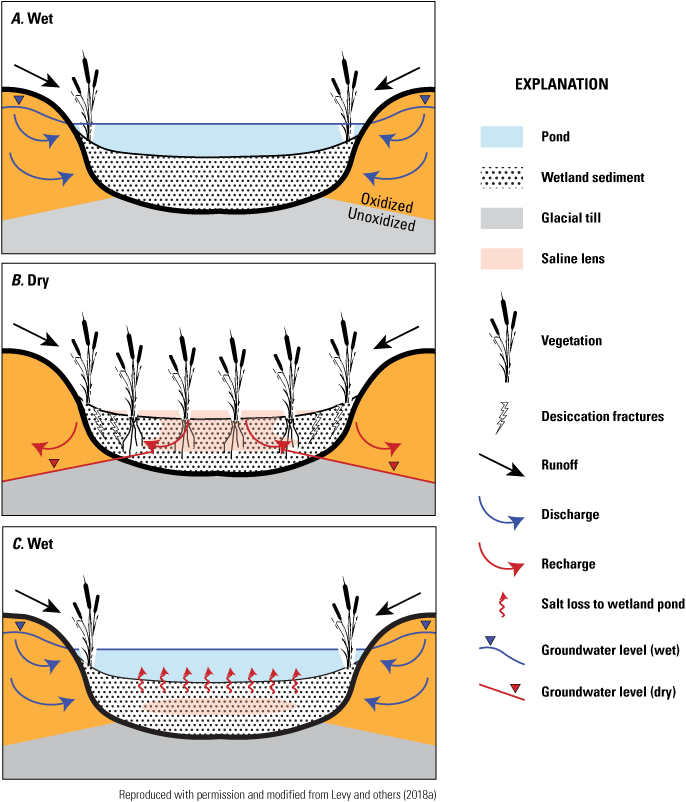
Conceptual model of drought-induced recharge of salts in response to wet/dry meteorological cycles. A, Recharge from wetland pond. B, Recharge into the sediments. C, Recharge back into the wetland pond.
Analysis of the long-term hydrologic record at the Cottonwood Lake study area indicates lenses of saline groundwater that form in deep wetland sediments during extended droughts appear to be extremely stable in the subsurface and can persist during wet periods on at least centennial timescales if not longer (Levy and others, 2018a). Stability of saline porewaters in wetland sediments likely is due to the extremely low hydraulic conductivity of saturated wetland sediments and equilibrium of porewaters with secondary minerals, such as gypsum, that precipitate in response to pond evaporation during droughts (Heagle and others, 2013). However, saline porewaters were determined to be regionally important sources of salts to wetland ponds over fine-grained tills following the transition to the current period of historically wet climate conditions (Goldhaber and others, 2016), and likely slowly seep back into wetland ponds when discharge gradients resume during wet times (Levy and others, 2018a).
The development of unique porewater chemistry beneath prairie wetlands is likely linked to repeated drying and wetting of wetland sediments over geologic timescales. A series of studies at the Cottonwood Lake study area determined elevated concentrations of dissolved organic carbon (Ziegelgruber and others, 2013) and sulfide concentrations (Zeng and others, 2013) in wetland sediments rapidly and abiotically reduced recalcitrant pesticide compounds in laboratory assays (Zeng and others, 2011, 2012). Further observations of remarkably high iodine concentrations (an order of magnitude above that of seawater) in porewaters overlying drought-derived saline groundwater lenses indicate evapoconcentration of organic-matter oxidation byproducts occurs during repeated drying and rewetting of wetland sediments (Levy and others, 2018b). The role of climate-mediated hydrodynamics in the biogeochemical evolution of wetland porewaters on geological timescales has important implications for the contaminant-processing potential of wetland porewaters (Zeng and others, 2011, 2012).
Water Chemistry and Biota
Stewart and Kantrud’s (1972) correlation of wetland plant communities to the specific conductance of wetland pond water provided a key starting point in understanding how such communities could change as pond permanence and salinity change with time. Investigations of the hydrological characteristics of wetland ponds in relation to atmospheric exchange and groundwater flow (Eisenlohr and others, 1972; Sloan, 1972) were foundational regarding controls on pond-water salinity. Furthermore, Sloan (1972) concluded that groundwater flow in till in the vicinity of prairie-pothole wetlands is a local phenomenon, which is consistent with the observations of Meybloom (1966). Sloan (1972) documented that specific conductance generally was lowest in prairie-pothole wetland ponds where the slope of the water table was steeply away from the pond, increasing in value as the slope changed to where the slope was gently away from the pond, then towards the pond and away from the pond, and finally the slope was entirely toward the pond, where specific conductance was the greatest. Eisenlohr and others (1972) noted that generally when pond volumes increased, salinity decreased, and when pond volumes decreased, salinity increased; however, the opposite also could occur. Understanding the relation of a wetland pond to atmospheric water (the y-axis of the continuum) and to groundwater (the x-axis of the continuum) in relation to controls on pond salinity allowed informed interpretation of patterns in wetland plant communities and how they change in relation to changing hydrological conditions.
In the context of the wetland continuum (fig. 65; Euliss and others, 2004), it is useful to highlight key points from the “Study Area” section to place the axes of the wetland continuum in context. The wetlands on the far left of the x-axis of the continuum are those wetland ponds higher in the groundwater-flow system that lose water (and solutes) by flow to groundwater and contain water for days, weeks, or months before becoming completely dry. Throughout the decades of study, the wetland ponds at the study area representing this part of the x-axis were consistently fresh, containing the least amounts of dissolved solids, having the smallest values of specific conductance, and exhibiting relatively small increases in specific conductance as the pond became dry. Thus, the changes in biological communities in these wetlands primarily reflect changes in hydroperiod.
Moving along the x-axis from recharge to discharge, wetlands either have less steeply sloping water tables away from the pond (T3) or have water tables sloping toward and away from the pond (T6). Specific conductance in these ponds is greater and generally fluctuates inversely in concert with pond depth. In general, the saline level of the pond water will set the stage for the suite of communities most likely to occupy the wetland, with some variation depending on hydroperiod to the point where vegetation is completely inundated at the top of the y-axis of the continuum.
The wetlands on the far right of the x-axis of the continuum are those wetland ponds lower in the groundwater flow system, which receive water (and solutes) by flow from groundwater to the wetland pond, contain water for most years, and only become completely dry in prolonged dry periods. Throughout the decades of study, the wetland ponds at the study area representing this part of the x-axis were consistently more saline, containing the greatest amounts of dissolved solids, having the largest values of specific conductance, and exhibiting pronounced increases in specific conductance as the pond became dry. Thus, the changes in biological communities reflect changes in hydroperiod and salinity. The linkage between pond hydroperiod and pond-water salinity, however, is not simply an inverse relation, which was revealed during the decades of observation at the study area and noted in the “Trends” section.
In any setting along the x-axis, those wetland ponds reaching a spill point reach an upper limit on the specific conductance of the pond owing to the ability to lose solutes by overland flow to an adjacent basin. In the case of the wetlands studied at the study area, the pond of wetland P8 is the most obvious case where loss of water at a spill point occurred and was reflected in seasonal and yearly changes in specific conductance over the decades.
Wetlands at the far end of the x-axis are those wetlands whose ponds do not lose water and solutes through flow to groundwater. When such wetland ponds also lack a spill point through which water and solutes are lost from wetland ponds, solutes continually accumulate in the ponds, thereby favoring biological communities that tolerate more saline conditions. Changes in those communities reflect increased solute concentrations with time. Yet, in such wetland basins that are large enough, or whose surrounding topography provides little shelter from wind, when the ponds dry and dried salts are exposed on the top of pond sediments, wind erosion can transport those dried salts out of the wetland basin, as observed in wetland P11 and in Saskatchewan (Luba and others, 1988). When rain and melted snow restores the wetland pond, the salinity of water in the ponds can be much less saline than in the previous pond in the same wetland basin. Therefore, the salinity of the ponds of those wetland basins that had no water-borne mechanism for losing salts can have their pond salinities decline, producing conditions favorable to communities indicative of less saline ponds.
The wetland basins at the far right of the x-axis in the continuum receive water and solutes from groundwater flow to the ponds, as noted previously. In very wet periods, as the status of the pond changes along the y-axis, initially the salinity of pond water declines, which was the case in the initial years following filling of wetland ponds at the study area in 1993. As the wet period continued, pond levels continued to increase in those ponds lacking spill points. Pond levels that had fluctuated by a meter between wet and dry conditions prior to 1993 now continued to rise beyond previously recorded levels by a meter or more, which resulted in inundation of the uplands providing a source of solutes to the ponds. The area of the groundwater-flow system interacting with the ponds also increased. With time, solutes delivered from that larger area of groundwater input led to increased salinity in pond water, such as for wetland P1 (LaBaugh and others, 2016, 2018). In ponds with high water levels, the specific conductance eventually was similar to values previously observed at much lower pond-water levels. As a result, biological communities at very different pond-water levels were similar because the supply of solutes from groundwater produced similar pond-water salinities.
Drivers of Invertebrate Communities
Since the initial research at NPWRC and in the wetlands near Cottonwood Lake that identified the importance of aquatic invertebrates as a waterfowl food source (Swanson and Bartonek, 1970; Swanson and others, 1985), much has been learned about this essential wetland-ecosystem component. McLean (2020) performed an in-depth analysis of long-term (1992–2015) aquatic-invertebrate data collected from the Cottonwood Lake study area and used structural equation modeling techniques to place the data within the context of the Wetland Continuum (McLean and others, 2021). The structural equation model developed by McLean and others (2021) clearly identified the importance of a wetland’s elevational position in the local topographic and water-level dynamics as key drivers of aquatic-invertebrate community structure (fig. 68). In the model of McLean and others (2021), elevational position and water dynamics (described as the proportion of basin ponded) work in tandem to influence the surface-water salinity and structure of plant communities within prairie-pothole wetland as depicted in the model of McLean and others (2021) and the Wetland Continuum concept (figs. 65, 66). The surface-water salinity and plant-community structure then shape an invertebrate community that is also influenced by biotic interactions including predation and competition.
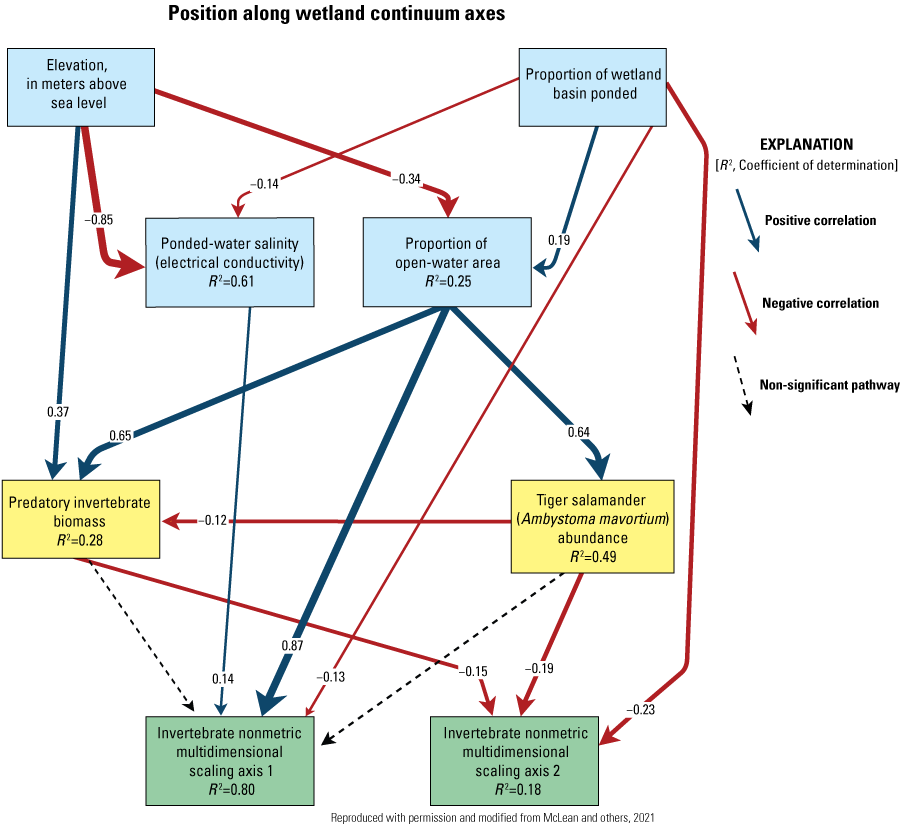
Structural equation model depicting influences of major drivers of aquatic-macroinvertebrate community structure in prairie-pothole wetlands.
The long-term sampling of aquatic macroinvertebrates at the study area added a new perspective to measuring diversity in highly variable aquatic systems. Mushet and others (2019b) demonstrated that in order to obtain an accurate measure of the diversity supported by variable aquatic systems, sampling must be carried out at a temporal scale representative of the natural range of that variation. Thus, for the PPR where climate wet-to-dry-to-wet cycles can take 10 to 20 years or more, aquatic macroinvertebrates need to be sampled at a minimum over one complete wet/dry cycle so that natural changes in species composition will be captured as wetland communities shift among various wetland phases (van der Valk and Davis, 1978) and environmental conditions (Euliss and others, 2004). Most studies are carried out over a single or few years and only capture a snapshot of diversity during that limited portion of time; however, that diversity is likely much greater than captured in that limited amount of time. In an evaluation of Cottonwood Lake study area invertebrate communities, Mushet and others (2019b) determined that when comparing 2 or 3 consecutive years, the Jaccard’s Similarity Index (Jaccard, 1912), a measure of the similarity between two communities, for aquatic-invertebrate communities of all wetlands at the Cottonwood Lake study area combined could be upwards of 84 percent. However, when comparing 1992 and 2015, the Jaccard’s Similarity Index was only 38 percent. This lack of similarity of overall invertebrate community among years as environmental conditions cycled indicates that these wetland systems support diversity that varies greatly with time and in composition in response to variable climate and environmental conditions.
Salamanders—Predators and Prey
The importance of salamanders and influence of fish in prairie-pothole wetlands cannot be overstated. Salamanders can occur in great abundance and constitute a large portion of the biomass in prairie-pothole wetlands. As seen from aquatic-invertebrate sampling, salamanders can depress invertebrate biomass in wetlands (figs. 43, 68). Also, salamanders in prairie-pothole wetlands serve as a food source for other vertebrates. For example, tiger salamander larvae are the single most important food item for American white pelicans (Pelecanus erythrorhynchos; fig. 69) breeding at Chase Lake National Wildlife Refuge (Lingle and Sloan, 1980), which is home to the largest American white pelican breeding colony in North America (Sovada and others, 2005). However, in 2004, concurrent with the tiger salamander population crash in prairie-pothole wetlands (fig. 47) resulting from Ranavirus, the entire colony of American white pelicans abandoned their nests at Chase Lake and no chicks survived to be recruited into the population. Some scientists suspected that coyotes (Canis latrans) may have harassed the pelicans, resulting in the colony abandonment (Cohn, 2006).
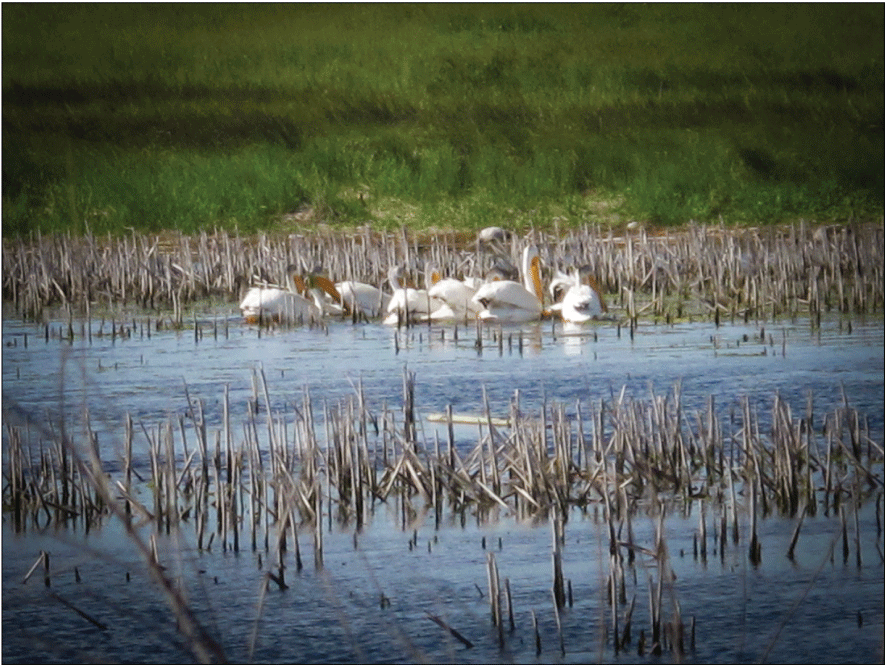
American white pelicans (Pelecanus erythrorhynchos) feeding near the Cottonwood Lake study area in Stutsman County, North Dakota, June 6, 2012. Photograph by Alisa Bartos, U.S. Geological Survey.
An alternative hypothesis to harassment by coyotes is that the lack of the pelicans’ primary food source, salamander larvae (fig. 70), resulted in the abandonment of the nests, similar to nest abandonments observed in 1974 by Johnson and Sloan (1978). Salamander numbers were at very low numbers at the Cottonwood Lake study area from 2002 to 2006 (fig. 52) owing to the occurrence of Ranavirus in the salamander population throughout the area. Also, at this time, water depths in semipermanently and permanently ponded wetlands averaged almost 2 m deeper than historical levels (fig. 30). The American white pelican does not dive below the water surface, and so its feeding depth is limited by neck length; thus, the low numbers of salamanders in wetlands in 2004, combined with large areas of wetlands with depths beyond the reach of the pelicans, made the small number of salamanders remaining in these wetlands largely inaccessible to pelicans. Under these conditions, adult pelicans would need to travel longer distances and spend more time away from their nests to forage (Johnson and Sloan, 1978). Interestingly, in subsequent years when pelicans renested at the study area, their diet had markedly changed to include more fish and crayfish (fig. 71). Fish became much more abundant and widespread in wetlands of the PPR as many wetlands switched to lake-like conditions during the wet period that spanned the 2000s (McLean and others, 2016). Declines in salamander numbers were widespread and not limited to the Cottonwood Lake area. North Dakota Game and Fish fisheries biologists track salamanders captured in wetlands as bycatch from permitted baitfish harvesters. These data (G. Van Eeckhout, North Dakota Game and Fish, retired, unpublished data, 2005; at the time of publication, data were not available from North Dakota Game and Fish) showed that total salamander captures by permitted baitfish harvesters across North Dakota declined by 82 percent between 1999 (744,852 total captures reported) and 2004 (133,608 total captures reported). This is only one of many examples of the importance of salamanders in prairie-pothole wetlands as a food source for other wildlife.
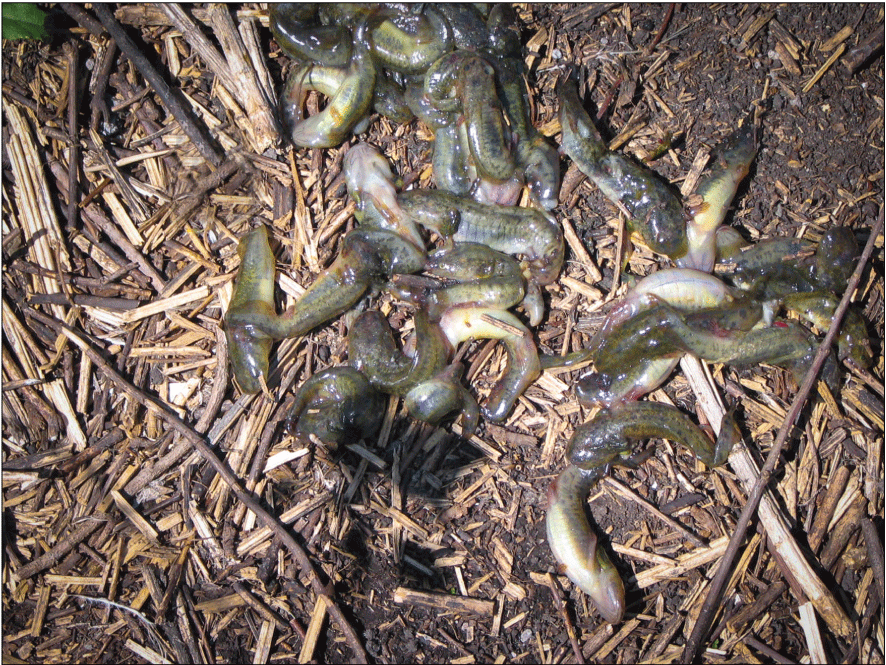
Tiger salamander larvae (Ambystoma mavortium) regurgitated by an American white pelican (Pelecanus erythrorhynchos) at Chase Lake, North Dakota, June 14, 2007. Photograph by Alisa Bartos, U.S. Geological Survey.
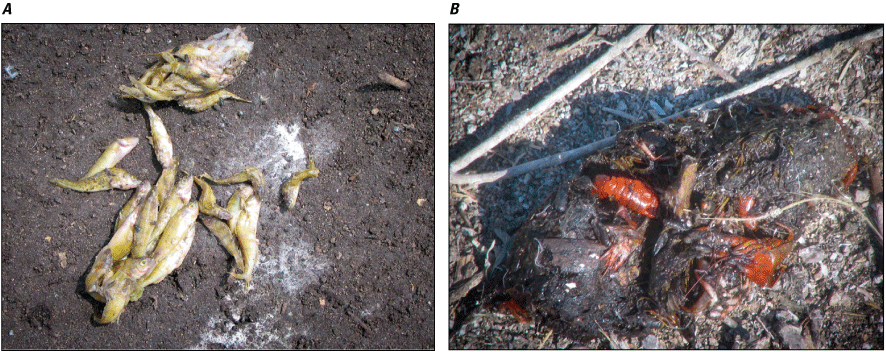
Regurgitant from American white pelicans (Pelecanus erythrorhynchos) at Chase Lake, North Dakota. A, Fish, July 26, 2007. B, Crayfish, July 20, 2006. Photograph by Alisa Bartos, U.S. Geological Survey.
Fish in Prairie-Pothole Wetlands
Although environmental factors are the primary drivers of communities in prairie-pothole wetlands under most conditions, as Hanson and others (2005) observed, these relations can be broken down if conditions allow the establishment of fish populations in these normally fishless wetlands (McLean and others, 2016). Aquatic macroinvertebrates in wetland P11 were influenced by the introductions of yellow perch. There was a sharp decrease in the abundance of Hirudinea, Copepoda, Amphipoda, Notonectidae, Haliplidae, and Dytiscidae following the perch introductions in 2014; in contrast, Corixidae abundance increased. This community change was likely a response to the introduction of fish, large neotenic salamanders, and more avian predators shaping the invertebrate community structure through preferential predation.
The most numerous amphibian species captured during surveys of P11 was the tiger salamander; however, from 2014 to 2021, few if any larval or neotenic salamanders were captured (fig. 72). The only exception being 2019 when 191 larvae and 9 neotenic individuals were captured, likely a response to the perch die-off in 2018. From 2014 to 2021, captured neotenics were much larger in size compared to those typically captured in this and other Cottonwood Lake study area wetlands. It is possible that the larger size of the neotenics in wetland P11 during the period when perch were present was due to the abundant food resource presented by the minnows in combination with a reduction in competition as smaller salamander larvae were preyed upon by perch.
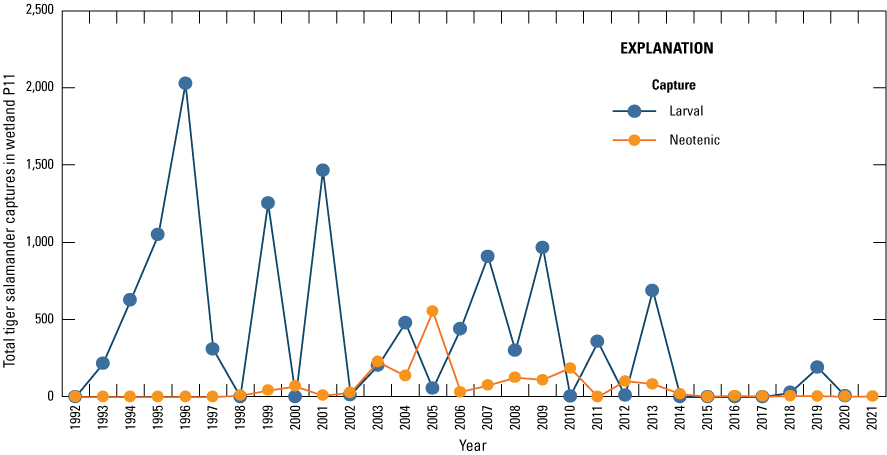
Larval and neotenic tiger salamander (Ambystoma mavorteum) captures in wetland P11 at the Cottonwood Lake study area, Stutsman County, North Dakota, 1992–2021. Note yellow perch (Perca flavescens) were introduced into this wetland in 2014.
Breeding-bird surveys carried out prior to 2014 revealed that a new species, western grebe (Aechmophorus occidentalis), began breeding at wetland P11 following the introduction of perch to the wetland in 2014 (appendix 11). Western grebes were first observed at wetland P11 with young in 2015 (2 pairs), and subsequently in 2016 (3 pairs) and 2017 (2 pairs); however, western grebes were not observed in 2018 or 2019. Western grebe pairs with young were again observed in 2020 (2 pairs) and 2021 (1 pair). Until their occurrence in 2015, no western grebes had been observed rearing young at wetland P11. The logical explanation for the occurrence of breeding western grebes at P11 would be that they found the newly introduced perch to be a viable food source. This would also explain their absence before perch were introduced to P11 and when perch were absent in 2018.
During monthly bird counts at wetland P11, we also observed an increase in the number of Franklin’s gulls (Leucophaeus pipixcan), black-crowned night herons (Nycticorax nycticorax), and American white pelicans from the average number prior to the fish introductions. However, none of these species were observed nesting near wetland P11, indicating they were merely taking advantage of the new food source (that is, minnows and perch). Thus, the cascading effects of the fish introductions into wetland P11 are an excellent example of how their presence influences multiple trophic levels and can dominate abiotic influences as determined by Hanson and others (2005).
Greenhouse Gases
Earlier research on GHG fluxes of PPR wetlands focused primarily on the effects of land use and management (for example, Gleason and others, 2009; Finocchiaro and others, 2014; Tangen and others, 2015). The presently reported (2009–16) intensive research performed at the Cottonwood Lake study area has helped elucidate the importance to wetland GHG fluxes of factors such as water chemistry (for example, sulfate), period of inundation, water depth, and vegetation, all of which are highly variable in the PPR (Euliss and others, 2004). This research also confirmed that PPR wetlands are potential hotspots or cool spots for GHG emissions. The GHG data collected from the Cottonwood Lake study area continue to inform the development of regional GHG flux models, helping to predict future emissions from this biologically important region. The following sections provide brief overviews of the lessons learned for CO2, CH4, and N2O.
Carbon Dioxide (CO2)
Owing to use of opaque gas-collection chambers, CO2 flux includes contributions from microbial and plant respiration; thus, we anticipated spatial and temporal patterns that reflected plant composition and phenology. Average upland CO2 fluxes were similar among the two wetland classes (fig. 62A). Moreover, fluxes of the wetland-upland transition area, which typically contains robust emergent vegetation, were elevated compared to the inner wetland locations (fig. 62A). Wetland-zone fluxes of the T wetlands were much greater than the P wetlands (figs. 61, 62A), likely owing to differences in the proportion of open water to emergent vegetation among the two classes. Moreover, fluxes of the wetland-upland transition area, which typically contains robust emergent vegetation, were elevated compared to the inner wetland locations (fig. 62A). Seasonal trends in CO2 flux followed those of plant development and seasonal temperature, with peak values during midsummer (fig. 64A). Altogether, these patterns indicate that wetland CO2 flux is largely associated with wetland vegetation; thus, much of the interannual variation (fig. 63A) and differences among the wetland classes (fig. 61) were likely due to temporally dynamic vegetation communities and the proportion of open water, emergent vegetation, and dry soils that typify the T and P wetlands.
Methane (CH4)
The larger P wetlands were expected to exhibit greater CH4 flux than the smaller T wetlands since they are characterized by deeper, more permanent water that provides the anoxic environments required to produce CH4. Results from the Cottonwood Lake study area, however, revealed that average flux rates from the P wetlands were approximately one-half those of the T wetlands (fig. 62B). The P wetlands generally are groundwater discharge or flowthrough sites that exhibit much higher average sulfate concentrations than the T wetlands, which typically do not receive groundwater (Goldhaber and others, 2011; Euliss and others, 2014). Consequently, this unexpected result was largely attributed to the inhibitory effect of high sulfate concentrations, which increase microbial competition for carbon substrates with methanogens, on CH4 production in the P wetlands. Water levels of the T wetlands characteristically recede throughout the growing season, and wetland edges that recently transitioned from wet to dry have been shown to be potential hotspots for CH4; thus, these areas also may have contributed to the higher fluxes observed for the T wetlands. Average CH4 flux from both wetland classes, however, did display the anticipated trend of decreasing flux along the water depth and permanence gradient from the central wetland areas to the wetland edge (fig. 62B). Additionally, CH4 flux followed the expected seasonal trend of higher fluxes during the warmer months (fig. 64B) and exhibited high interannual variation (fig. 63B) in response to the region’s variable precipitation cycles (Euliss and others, 2004). The positive relation between CH4 and temperature (Bansal and others, 2016) demonstrated the potential effects of warming climate conditions on CH4 emissions from wetlands.
Nitrous Oxide (N2O)
Average N2O flux of the T wetlands greatly exceeded that of the P wetlands (fig. 61). The relatively low N2O flux of the P wetlands can be attributed to the more permanent water and anoxic conditions that are not conducive to the production of N2O (Davidson and others, 2000). Conversely, soil moisture conditions of the T wetlands often are optimal for production and emission of N2O. Tangen and Bansal (2019a) determined that wetland edges that recently transitioned from wet to dry were potential “hot spots” for N2O. These transition areas, which are a prominent characteristic of the T wetlands, likely contributed to the higher average flux rates observed for the T wetlands compared to the P wetlands. There was an obvious interactive effect of wetland type and sample location on N2O fluxes (fig. 62C). Wetland-zone fluxes of the P wetlands were consistently lower than those of the T wetlands, as well as the upland locations, whereas fluxes of the T wetlands were greatest from the central wetland zone and displayed a consistent decreasing trend from the central zone to the wetland edge and into the uplands (fig. 62C). he lower fluxes in the P wetlands and dryer portions of T wetlands is evidence that the permanence of water affects spatial trends of N2O flux. Further, in the T wetlands, average N2O flux generally was lowest in spring and early summer (generally greater water depths), with an increasing trend through fall (when water levels recede; fig. 64C). As with CH4, the high interannual variation in average N2O likely was driven by differences in yearly precipitation and water levels (fig. 63C).
Interactions
The interannual climate between 1967 and 2021 was characteristically dynamic, with fluctuating wetland pool levels sufficient enough to change important abiotic characteristics, thereby altering the ecology of the entire Cottonwood Lake study area wetland complex. The primary influence was from the loss or gain of atmospheric water that maintains wetland pools as the region cycled out of an extreme drought (1988 to 1992) into one of the wettest periods in perhaps 500 years (Winter and Rosenberry, 1998). The temporal patterns in water depth, specific conductance, and pond permanence for each wetland, along the continuum that describes the relation of individual wetlands to atmospheric water and hydrologic position at Cottonwood Lake study area, were the primary abiotic features affecting the ecology of individual wetlands. Organizing wetlands along the continuum of a wetland’s relation to surface and groundwater improves ecological understanding (Euliss and others, 2004) because ecological outcomes can be evaluated through examination of the influence of the unique hydrologic function and setting of individual wetlands. Annual change in water depth, pond permanence, and specific conductance reflected influence of change in pool levels owing to morphologic features of unique wetlands, including their upland catchment areas, the quantity and composition of solutes within their basins, and antecedent conditions of wetland water.
Although abiotic influences typically play a dominate role in structuring biotic communities of prairie-pothole wetlands, interactions among biota can become the dominate influencing factor under certain circumstances. A primary circumstance would be if fishes become established in a wetland. Prairie-pothole wetlands are typically fishless, but if fishes become established in a wetland, such as occurred in wetlands P8 and P11 at the Cottonwood Lake study area, their influence on the entire ecosystem is dramatic. Upon introduction of fishes, vegetation structure can be altered; amphibian populations can be altered or lost; and invertebrate community structure, abundance, and biomass shifts. The influence of fishes in prairie-pothole wetlands can be so great that others have identified them as the driving influence of ecosystem structure (Hanson and others, 2005). Work at the Cottonwood Lake study area and elsewhere has shown that abiotic factors dominate when the wetlands are in their normal, fishless condition, but much like other invasive species, when fishes are introduced into these systems, they can have a marked influence on the entire ecosystem structure.
Another situation that allows the influence of biotic factors in prairie-pothole wetlands to become greater is if a wetland remains at a single position along the atmospheric water axis of the continuum for an extended period. At the Cottonwood Lake study area, this stagnation in the normal wet/dry cycling occurred during the almost 30-year wet period that began in 1993. In this case, many wetlands remained at the upper end of the continuum framework for the entire period. As a result, biotic influences such as predation, competition, and disease began to have marked influences on the biotic communities that resulted in large, unpredictable changes in populations owing to the stochasticity of these factors.
In prairie-pothole wetlands, the interactions that occur between the wetland and its surrounding uplands are often not considered. Vertebrate and invertebrate species regularly move between these two habitats. Fritz and others (2017) and Twining and others (2018, 2019) determined that quantity and quality of flying insects emerging from aquatic environments positively influenced bird communities in surrounding terrestrial areas; however, pesticides from terrestrial systems can also accumulate in aquatic systems and be transferred to terrestrial biota feeding on flying insects emerging from wetlands (Kraus and others, 2021). Other species often enter the wetlands to access their rich invertebrate and vertebrate (for example, salamander) food resources. Amphibians utilize both aquatic and terrestrial components of the prairie-pothole landscape (Mushet and others, 2011). Many species of waterfowl nest in upland areas surrounding prairie-pothole wetlands and the condition of these upland areas are key to their nesting success, perhaps even more so than the condition of the wetland they surround; however, prairie-pothole wetlands would not exist as they are today without the snow drift, snowmelt, and occasional summer runoff of water from terrestrial areas surrounding the wetland. These water inputs from the wetland’s surrounding upland catchment are essential to the existence of wetlands in this area where the amount of precipitation that falls annually is exceeded by the amount of potential evaporation.
The Freshwater Ecosystem Mosaic (fig. 73) described by Mushet and others (2019a) and Schofield and others (2018) highlight the importance of interactions between wetlands and the surrounding upland matrix on which they are dependent. Thus, although the work described in this report was carried out in a protected area where surrounding upland areas were mostly natural and managed to maintain the area in this condition, most of the Prairie Pothole Region has been greatly altered. Therefore, conservation and management activities in the uplands surrounding wetlands can be equally, if not more, important than management that occurs within the wetland itself. The changes in water levels that occurred in wetlands in the St. Denis National Wildlife Area of Canada when previously cropped uplands were converted to perineal grassland cover are a prime example (van der Kamp and others, 1999).
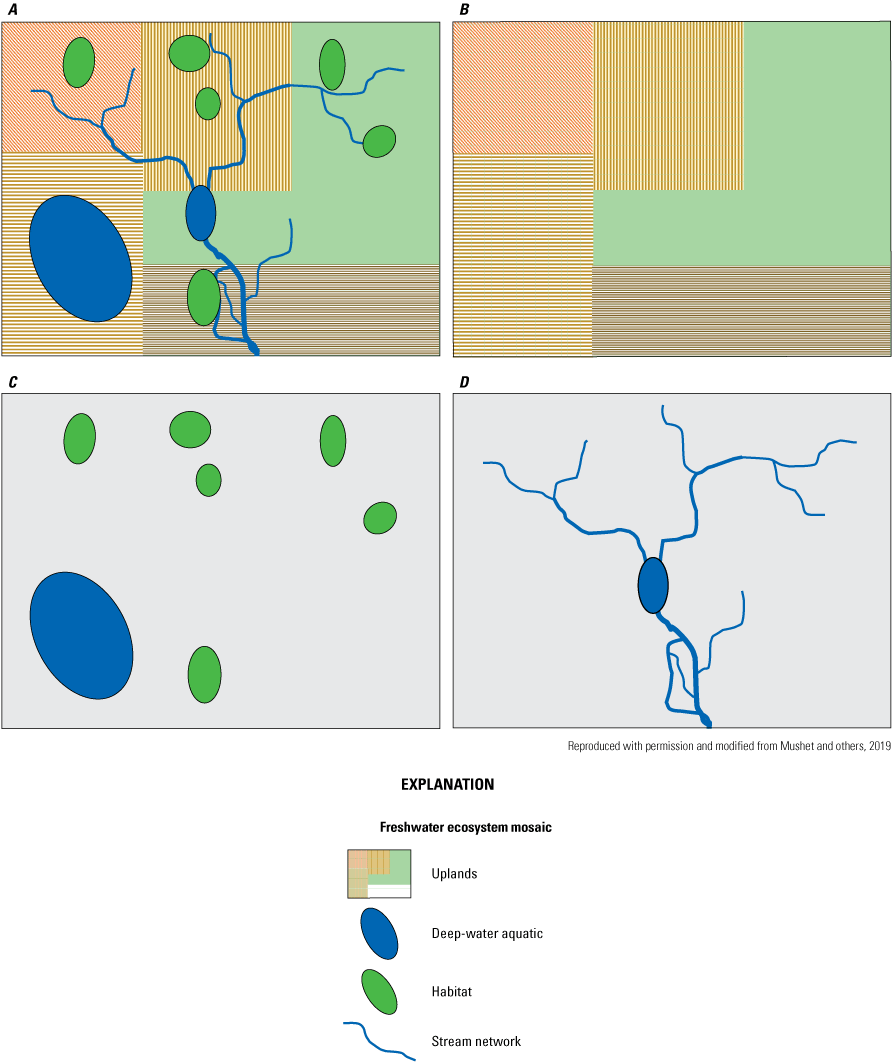
A complete Freshwater Ecosystem Mosaic consists of three principle components. A, Complete mosaic. B, Uplands. C, Deep-water aquatic and wetland habitats. D, Stream networks.
PHyLiSS—Development of a Systems Simulation Model for Prairie-Pothole Wetlands
The sustained multidecade wetland monitoring effort at Cottonwood Lake study area has amassed an ideal dataset for calibrating and validating statistical and mechanistic models of prairie-pothole wetland ecosystem functioning. Process-based mechanistic systems models incorporate physical and biological processes and allow for robust simulations of those ecological conditions under historical and future climate and land-use conditions. The Pothole Hydrology-Linked Systems Simulator (PHyLiSS) model was developed as the first mechanistic prairie-pothole wetland model where the code and user manual are 100 percent publicly available through the USGS ScienceBase digital repository (USGS, 2022) and in a USGS Open-File Report (McKenna and others, 2018). The aim with development and application of the PHyLiSS model is to elucidate a more detailed mechanistic understanding of the relation among climate, land use, hydrology, chemistry, and biota in prairie-pothole wetlands.
Research at the Cottonwood Lake study area and elsewhere has made it abundantly clear that robust and flexible tools are needed for understanding the complex, and often interacting, effects of climate and land use on prairie-pothole wetland systems, and to facilitate climate and land-use change adaptation efforts. Currently (2022), the PHyLiSS model simulates surface-water dynamics in prairie-pothole wetlands and quantifies changes in salinity. The PHyLiSS model is unique among other wetland simulation models because it accommodates differing sizes and morphometries of wetland basins, is not dependent on a priori designations of wetland class, and allows for functional changes associated with dynamic shifts in ecohydrological states. The PHyLiSS model also has the capability to simulate wetland salinity, and potential future iterations will allow for the simulation of changing effects of hydrology and geochemical conditions on biota.
The PHyLiSS model was developed using Stella Professional (ver. 1.4) software. The Stella software provides a graphical user interface for developing models using stocks and flow diagrams. Mathematically, the system that is created in the Stella software numerically solves an interconnected set of differential equations (Costanza and Voinov, 2001). Currently, the model simulates water-surface elevation dynamics in prairie-pothole wetlands and quantifies changes in salinity on a daily time step. Surface-water inputs in the model include precipitation, runoff from upland areas of the wetland catchment, and snowmelt. Outputs from the wetland include evaporation, transpiration, and spill to and from other wetlands. Groundwater inputs and outputs are modeled indirectly relative to the target wetland’s position along a recharge-to-discharge landscape gradient. Geochemical composition of wetland water is driven by hydrologic, meteorological, and topographic variables. Additionally, the PHyLiSS model has been modified to simulate all hydrologically linked wetlands within complexes where land-use changes have occurred, such as surface drainages associated with agricultural development. Highly modified wetland complexes can include a number of small upgradient wetlands drained into one larger terminal wetland (that is, consolidation drainage; McCauley and others, 2015).
The PHyLiSS model was developed and validated using a 30-year hydrology dataset and a 20-year water-chemistry dataset from six Cottonwood Lake study area wetlands (P1, P6, P7, T5, T8, and T9). The smaller wetlands are much more variable and their small pool volumes and short hydroperiods are difficult to re-create accurately; thus, modeled wetland stage for the smallest wetlands had the weakest fit. However, the PHyLiSS model can reliably simulate conditions for years when these smallest wetlands (T5, T8, and T9) were dry and years when their water levels were high. From a waterfowl-use perspective, being able to predict when wetlands are completely dry can be more important than modeling the actual amount of water in the wetland at a given time. The PHyLiSS model can also be used to track large changes in wetland surface-water stage during dry periods and through a recent climate shift in which many wetlands shifted their hydrological function to that of a lake state (McKenna and others, 2017).
Since PHyLiSS version 1.0 was first published by McKenna and others (2018), there have been a number of applications of the PHyLiSS model within and beyond the Cottonwood Lake study area that have resulted in three published journal articles (McKenna and others, 2019, 2021a, 2021b8386). These publications have resulted in a more robust mechanistic understanding of how climate and land-use change drivers affect wildlife habitat (McKenna and others, 2021a, 2021b86) and water quality (McKenna and others, 2019) of prairie-pothole wetlands.
McKenna and others (2019) determined that drainage of small wetlands into a larger terminal wetland has direct consequences within wet periods, or even extreme precipitation events, because lower fill times lead to increased periods of spill within these terminal wetlands. This application of the PHyLiSS model was one of the first modeling studies to quantify the synergistic effects of climate and land-use change on prairie-pothole wetlands. A broader application of this methodology helps land managers understand the implications of future changes in climate in watersheds that contain hydrologically altered wetlands. McKenna and others (2021b) also combined empirical measurements, simulation modeling, and future climate projections to evaluate how grassland management can supplement surface-water inputs to prairie-pothole wetlands lost owing to climate warming. These results identified the potential for using grassland management practices as tools to counteract warming-driven evaporative losses from depressional wetlands.
McKenna and others (2021a) effort is the largest spatial and temporal scale application of the PHyLiSS model to date. This application of the PHyLiSS model addressed the question of how the number and spatial distribution of prairie-pothole wetlands that are ponded during waterfowl breeding season will change, which is an index of waterfowl productivity. McKenna and others (2021a) determined that, depending on the location in the PPR, the future climate could lead to between a 29-percent loss and an 8-percent increase in the number of May ponds by the end of the 21st century (2070–99) with minimal shift in the distribution of May ponds compared with 1989 to 2018 averages. This study was designed intentionally to advance the scientific understanding of the responses of wetland hydrology to climate change and to provide information that can be effectively integrated into strategic landscape-scale planning for the acquisition, restoration, and management of wetlands.
The PHyLiSS model has proven to be a useful tool that has facilitated the fusing of empirical data, models, and mapping techniques into a mechanistic understanding of depressional wetlands of the PPR. This approach has advanced our ability to move from smaller to larger geographic scales that bridge expertise across multiple scientific disciplines. The continued integration of different biotic submodels into the PHyLiSS model will allow for seamless predictability of responses to climate and land-use change for wetland-dependent plant and animal species across multiple trophic levels.
Key Messages to Managers
Prairie-pothole wetlands are distinguished from other depressional wetlands by their occurrence on glacial till, their sheer numbers, and the wide variety of wetland types as determined by the size of the depression, size of the catchment contributing water to the depression, and hydrologic position. The number, types, and dynamics then contribute to the overall productivity of the PPR. The Wetland Continuum of Euliss and others (2004) forms a basis by which one can begin visualizing how these complex systems function in space and time. Hayashi and others (2016) provided a modification of the continuum, making it more specific to the PPR by expressing the x-axis in terms of hydrologic landscape positions rather than relations to groundwater. As hydrology changes in a landscape as a result of sustained changes in water inputs, either through changes in meteorological or surrounding land-use conditions, Mushet and others (2018) provide a mechanism allowing for wetlands to shift horizontally along the hydrological landscape position axis. These horizontal shifts open up an entire new set of conditions that wetland ecosystems can transition through as a result of long-term and sustained changes. To capture the variation in prairie-pothole wetland types and their inseparable tie to surrounding nonwetland areas, Mushet and others (2019a) presented the idea of the “Freshwater Ecosystem Mosaic.” Together, the concepts described in these four publications provide significant insights into how prairie wetland ecosystems function in response to drivers (abiotic and biotic, wetland and upland) that affect their functioning, states, and long-term sustainability. Modeling work with the PHyLiSS model is shaped around these concepts and provides a mechanism for managers to incorporate scenario planning given uncertain climate and land-management futures.
Work at the Cottonwood Lake study area (fig. 74) has indicated that maintenance of healthy wetland ecosystems in the PPR is highly dependent on the occurrence of multiple wetland types at any given time. Thus, as wetlands cycle through various positions along axes of the Wetland Continuum, representation of all wetland types is maintained and habitat types for the widest variety of species are continually present. To maintain the full Wetland Continuum on a landscape, conservation of all wetland types and “nonwetland” depressions is required so that as wetlands transition along an axis of the continuum, other wetlands also are transitioning and filling in any vacated ecological gaps. For example, as a seasonally ponded wetland receives increased water inputs during a deluge period, a temporarily ponded wetland receiving those same increased inputs might begin performing the functions vacated by the seasonally ponded wetland as it shifts to longer pond permanence. However, unless nonwetland depressions are also maintained, there can be no ponding of water in these basins to replace the temporarily ponded wetlands that have shifted to a more seasonally ponded-water permanence regime. Likewise, lakes may shift to perform wetland functions during drought conditions as other wetlands shift along axes of the Wetland Continuum in response to decreased water inputs.
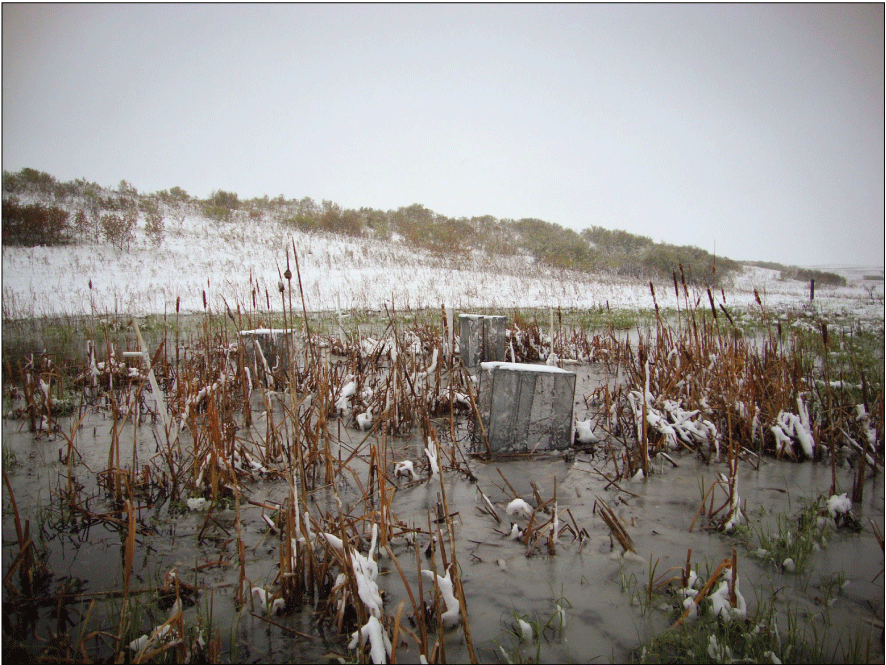
Amphibian traps set in wetland T3 at the Cottonwood Lake study area, Stutsman County, North Dakota, during a rare May snowfall event, May 11, 2010. Photograph by Stephen Lane, U.S. Geological Survey.
Another key consideration, and influence, on wetland ecosystems is the condition of surrounding upland areas within which depressional wetlands are embedded. It is impossible to understand the dynamics of prairie-pothole wetland ecosystems without a clear understanding of activities influencing upland conditions. Changes to vegetation structure through haying, grazing, or idling each have differential effects of snow distribution during the winter and runoff of water, solutes, and nutrients to a wetland when that snow melts or during spring, summer, and fall precipitation events. Additionally, an understanding of the timing and intensity of these events as affected by climate change is needed to accurately predict the effect of management actions on wetland water levels, salinities, and biological communities. Likewise, conversion of grass-dominated uplands to agricultural production has an even more marked influence on snow distribution and runoff.
One lesson from work at the Cottonwood Lake study area is that water management and salt management are inseparable because any change in water levels will necessarily affect salt concentrations through dilution/concentration effect, variation in quality of water entering wetlands, and movements of salts into or out of the ponded surface water from previously sequestered salt deposits. Although water-level change affects salt concentrations rapidly through dilution/concentration effects and variation in inputs, long-term changes in sequestered salt pools can have even more marked influences that can seem counter intuitive (for example, an increase of salt concentrations in wetlands with increased water volumes when dilution would be expected). In fact, the dilution effects are still occurring but are masked by the overwhelming influence of salts moving from the sequestered pool into the surface-water pond. Managers should be aware of these changes so they are prepared for the even higher salt concentrations that will result when water levels in flooded wetlands decrease, and salts are concentrated even more. These conditions are magnified during winter when ice forms and further concentrates salts in the remaining unfrozen water and sediments of a wetland.
In terms of wetland productivity, research at the Cottonwood Lake study area has indicated that productivity is much more complicated than can be captured by simple indices of wetland drying or predator abundance. For example, using the frequency of a pond drying as an indicator of wetland productivity will likely result in misleading conclusions because pond productivity does not appear to be as directly reliant on pond drying as previously thought, which was demonstrated by wetlands at the study area maintaining productivity despite being permanently ponded for almost 30 years.
Perhaps one of the greatest contributions of long-term efforts such as those carried out at the Cottonwood Lake study area is that they provide a mechanism for observing, and bettering our understanding of, wetland processes and functioning over conditions that span more than the few years typical of all short-term research efforts. With wet-dry-wet cycles in the PPR spanning 10 to 20 years or longer, efforts with similarly long timeframes are needed to capture the variation across these cycles. As conditions change in response to changing climate influences, even longer timeframes will likely be needed to capture changes across multiple wet-dry-wet cycles. Another highly valued contribution of these long-term studies is that they identify processes that occur over long time scales and can be incorporated into systems models to better predict responses to future changes. Much can be learned from the past even if future conditions will likely be novel. The long-term data collection effort at the Cottonwood Lake study area has been instrumental in not only developing an early understanding of how prairie-pothole wetlands function, but also in providing the data needed to develop systems models capable of providing an understanding of how future climate and land-use conditions might affect the function of these important wetland systems.
Summary
Depressional wetlands in the Prairie Pothole Region of North America have a long history of investigation owing to their importance in maintaining migratory-bird populations, especially waterfowl. One area of particularly intensive study is the Cottonwood Lake study area in Stutsman County, North Dakota. Studies at the Cottonwood Lake study area began in 1967 and continue through the present (2022). The underlying goal of research at the Cottonwood Lake study area is to improve understanding of how wetland biological communities respond to short- and long-term drivers of ecological function and change, build a base of knowledge that others can use when carrying out research at this unique and valued study area, and provide “science to apply” for current and future wetland managers and decision makers.
Today the Cottonwood Lake study area is internationally recognized as one of the most intensively studied wetland complexes in North America and has been listed as a “Wetland of Distinction” by the Society of Wetland Scientists. The Cottonwood Lake study area is the only wetland complex listed as a “Wetland of Distinction” based on its importance and contributions as an ecological study area. More than 100 scientific publications, theses, and dissertations, and numerous data reports and releases have resulted from research at the study area conducted by U.S. Geological Survey scientists, other Federal and nonfederal researchers, and graduate students.
During the period of scientific discovery covered in this report (1967–2021), meteorological conditions at the Cottonwood Lake study area varied greatly and included one of the most severe droughts of the 20th century and one of the wettest periods in the past 500 years. Persistent wet conditions that began in 1993 have contributed to state changes in many of the study area’s larger wetlands to lake-like conditions, whereas the smaller wetlands returned to seasonally ponded conditions during relatively dry years interspersed within the longer-term wet period. Additionally, some nonwetland areas of the study area developed wetland plant, hydrology, and soil characteristics during the 1993-to-present (2022) wet period. The persistently high stages of water in the larger wetlands since 1993 have contributed to a buildup of dissolved solids and increases in salinity following an initial decrease in salinity caused by the dilution of dissolved solids within a larger volume of water.
Recent meteorological changes have persisted long enough (30 years) to be considered a change in climate at the study area. Biotic communities responded in a variety of ways to subtle and marked changes in ponded-water depths, permanence, and salinity resulting from the changed climate conditions.
The upland vegetation of the Cottonwood Lake study area changed considerably during the study period. The most striking differences were related to the decrease in upland areas as a result of the expansion of wetlands (increased in area by 62 percent). In several locations where trees once bordered wetlands, the stands of trees have been flooded out and replaced by wetland vegetation. Another change has been a decrease in the area of short shrubs (primarily western snowberry [Symphoricarpos occidentalis] and silverberry [Elaeagnus commutata]).
Changes in the wetlands occurred as well. In the semipermanently and permanently ponded wetlands lacking a depth-limiting outlet, rising water levels exceeded the depth limitations of deep-marsh species and submergent species, and these wetlands began functioning essentially as small lakes. Water levels rose quickly enough in the wetlands that vegetation characteristics of shallow depths were flooded out before they could populate higher elevation areas. With this loss of emergent vegetation, open-water areas often transitioned directly to upland vegetation, which is in marked contrast to the diverse plant communities in these wetlands prior to 1993. This change in state from palustrine wetland dominated by emergent and submergent macrophytes to lacustrine systems dominated by planktonic species had multiple repercussions on the macroinvertebrate and vertebrate communities using these wetlands as habitat. Much like the closed-basin semipermanently ponded wetlands transitioning to lake-like conditions, many of the seasonal and temporary wetlands began retaining water year-round and functioned as semipermanently ponded wetlands. One unexpected result of the altered climate regimes was the appearance of wetland conditions in areas where they previously did not occur.
Aquatic-invertebrate biomass increased markedly when wetlands refilled in 1993 as they made use of abundant nutrient resources present in the water following reflooding. Invertebrate biomass reached a peak in 1996. However, in 1997 after barred tiger salamander (Ambystoma mavorteum) returned to the study area wetlands and increased in numbers, invertebrate biomass sharply declined as salamander numbers likely exceeded the carrying capacity of the invertebrates. The year following the drop in invertebrate biomass (1998), salamander numbers also declined, likely in response to the reduced aquatic-invertebrate food resources. The drop in salamander numbers was reflected by a new increase in invertebrate biomass. These early dynamics in the Cottonwood Lake study area wetlands following reflooding adds a new and quantitative example of the close relations between predator and prey populations. Since their relatively smooth recovery from 1992 to 1997, barred tiger salamander numbers varied widely. From 1997 to 2001 numbers ranged between the 1997 peak of 10,010 captures and a low of 3,557 in 2000. The low in 2000 marked the beginning of an outbreak of Ranavirus that decimated salamander populations at the study area. Although the study area occurs within the range of several toad species, no toads were captured or even observed during this study.
Our first detection of fish in any study area wetlands was on August 10, 2010, when a single fathead minnow (Pimephales promelas) was captured in an aquatic-invertebrate funnel trap in wetland P8. After first appearing, fathead minnows have been routinely captured in wetland P8 in invertebrate and amphibian traps; however, numbers remained relatively low as the wetland’s shallow, depth-limited water levels lead to large or complete die-offs each winter. The only other study area wetland to host fish populations during the study period was wetland P11. Fathead minnows first appeared in sampling of wetland P11 on May 5, 2015. In addition, on that same date we also began capturing yellow perch (Perca flavescens) in the amphibian traps.
There were five basic trend patterns observed in the number of breeding-bird pairs using wetlands of the study area from 1992 to 2021. The first pattern was a sharp recovery from numbers during the drought year (1992) to peak numbers from 1994 to 1997, followed by a more drawn-out decline in pairs using the wetlands as wetlands stayed ponded in response to the extended years of high precipitation. The second pattern consisted of a slower increase in pair numbers following reflooding, with peak numbers being reached during the middle years of the study period, followed by an equally slow decline, resulting in an arched pattern. The third pattern was a similar quick rise once wetlands refilled in 1992, followed by a rapid decline from peak numbers in the immediate years following refilling. The fourth pattern was a relatively steady increase in numbers throughout the study period. In the fifth pattern observed, species were most abundant during the drought year and quickly declined in numbers once wetlands reflooded and emergent vegetation diminished.
Invertebrate biomass data clearly indicated that declines in productivity were limited to temporarily and seasonally ponded wetlands. Semipermanently and permanently ponded wetlands actually showed a slight increase in productivity despite being continuously ponded from 1993 to 2021. The breeding-bird communities responded to these differences as they selected and utilized productive wetlands that produced the food resources needed for their reproduction. This decline in productivity of seasonal and temporary wetlands was reflected in a remarkably steady decline in the numbers of dabbling and diving ducks using the Cottonwood Lake study area wetlands for breeding. The decline in duck numbers following reponding illustrates the importance of temporarily and seasonally ponded wetlands in maintaining prairie-pothole wetland productivity.
Fluxes and soil organic carbon concentration from wetlands of the Cottonwood Lake study area varied by sampling location, with distinct trends differing between wetland types. Average respiratory carbon dioxide fluxes were substantially lower in locations that were consistently ponded compared to locations that were typically dry or experience wet-dry oscillation. The temporarily and seasonally ponded wetlands exhibited decreasing average nitrous oxide flux from the center of the wetlands to the wetland edge and uplands, whereas semipermanently and permanently ponded wetlands were characterized by lower nitrous oxide fluxes that increased slightly from the wetland zone to the uplands. Average soil organic carbon content of the temporarily and seasonally ponded wetlands was higher in the wetland zone than the upland zone.
One of the chief contributions of the Cottonwood Lake study area to date has been the insights into the functioning of prairie-pothole wetlands that formed the basis from which the Wetland Continuum concept could be developed. The Wetland Continuum describes how insights into a wetland’s potential ecological communities at a particular point in time can be obtained by understanding the unique position in which a wetland exists along two continuous axes, one defined by positioning along a dry to wet continuum and the other by positioning along a groundwater axis ranging from recharge to discharge. Thus, information gained from short-term studies at the Cottonwood Lake study area and elsewhere could be placed into a larger ecological context. Subsequent revisions to the Wetland Continuum concept incorporated new knowledge of the limitations that glacial till places on the ability of wetlands to connect through the groundwater-flow paths and allowed for state changes if extreme conditions persist over a relatively long period.
Since the initial research in the wetlands near Cottonwood Lake that identified the importance of aquatic invertebrates as a waterfowl food source, much has been learned about this essential wetland-ecosystem component. Structural equation modeling of biotic and abiotic data from the Cottonwood Lake study area clearly identified the importance of a wetland’s elevational position in the local topographic and water-level dynamics as key drivers of aquatic-invertebrate community structure. In the model, elevational position and water dynamics worked in tandem to influence the surface-water salinity and structure of plant communities within prairie-pothole wetlands. The surface-water salinity and plant-community structure then shaped an invertebrate community that was also influenced by biotic interactions including predation and competition. The long-term sampling of aquatic macroinvertebrates at the study area has also added a new perspective to measuring biodiversity in highly variable aquatic systems.
The sustained multidecade wetland monitoring effort at Cottonwood Lake study area has amassed an ideal dataset for calibrating and validating statistical and mechanistic models of prairie-pothole wetland ecosystem functioning. One such model, the Pothole Hydrology-Linked Systems Simulator (PHyLiSS) was developed as the first mechanistic prairie-pothole wetland model where the code and user manual are 100 percent publicly available. Process-based mechanistic systems models incorporate physical and biological processes and allow for robust simulations of those ecological conditions under historical and future climate and land-use conditions. The aim with development and application of the PHyLiSS model was to elucidate a more detailed mechanistic understanding of the relation among climate, land use, hydrology, chemistry, and biota in prairie-pothole wetlands.
Since PHyLiSS version 1.0 was first published, there have been a number of applications of the PHyLiSS model within and beyond the Cottonwood Lake study area that have resulted in several published journal articles. These publications have resulted in a more robust mechanistic understanding of how climate and land-use change drivers affect wildlife habitat and water quality of prairie-pothole wetlands, an understanding that would have not been possible without the rich data resources available as a result of the dedication of U.S. Geological Survey scientists to the continuation of research at the Cottonwood Lake study area in Stutsman Count, North Dakota.
Acknowledgments
We are indebted to the many technicians, volunteers, and student interns who aided with data collection efforts at the Cottonwood Lake study area over the years. We offer a special thank you to Jake Wolfe, Bruce Hanson, Susan Moss, Rick Hegvik, Steve Lane, and Matt Solensky, who each served as crew leaders overseeing data collection in the field and the lab. We offer a great thank you to Caryn Ross and Sadia Sabrina, whose help with preparing maps and figures was essential. We are especially indebted to George Swanson and Tom Winter. Without the pioneering efforts of both George and Tom, the work we describe would not have occurred, but more importantly, the information gained would still be absent from our knowledge base or would have taken much longer to acquire. Lastly, we thank Jay Christensen, Cami Dixon, and Charles Lane for their constructive reviews of an earlier draft of this U.S. Geological Survey Professional Paper.
References Cited
Arguez, A., and Vose, R.S., 2011, The definition of the standard WMO climate normal—The key to deriving alternative climate normal: Bulletin of the American Meteorological Society, v. 92, no. 6, p. 699–704. [Also available at https://doi.org/10.1175/2010BAMS2955.1.]
Arndt, J.L., and Richardson, J.L., 1989, Geochemistry of hydric soil salinity in a recharge-throughflow-discharge prairie wetland system: Soil Science Society of America Journal, v. 53, no. 3, p. 848–855. [Also available at https://doi.org/10.2136/sssaj1989.03615995005300030037x.]
Arndt, J.L., and Richardson, J.L., 1992, Carbonate and gypsum chemistry in saturated, neutral pH soil environments, p. 179–187 in Robarts, R.D., and Bothwell, M.L., eds., Aquatic Ecosystems in semi-arid regions—Implications for resource management, August 27–30, 1990, Saskatoon, Saskatchewan: The National Hydrology Research Institute, Symposium Series 7, 375 p.
Arndt, J.L., and Richardson, J.L., 1993, Temporal variations in the salinity of shallow groundwater from the periphery of some North Dakota wetlands (USA): Journal of Hydrology, v. 141, no. 1-4, p. 75–105. [Also available at https://doi.org/10.1016/0022-1694(93)90045-B.]
Badiou, P., McDougal, R., Pennock, D., and Clark, B., 2011, Greenhouse gas emissions and carbon sequestration potential in restored wetlands of the Canadian Prairie Pothole Region: Wetlands Ecology and Management, v. 19, no. 3, p. 237–256. [Also available at https://doi.org/10.1007/s11273-011-9214-6.]
Bansal, S., and Tangen, B.A., 2019a, Dissolved greenhouse gas concentrations and fluxes from Wetlands P7 and P8 of the Cottonwood Lake study area, Stutsman County, North Dakota, 2015: U.S. Geological Survey data release, accessed May 2022 at https://doi.org/10.5066/F7TX3CJ7.
Bansal, S., and Tangen, B.A., 2019b, Diurnal patterns of methane flux from a depressional, seasonal wetland: U.S. Geological Survey data release, accessed May 2022 at https://doi.org/10.5066/F7348JB2.
Bansal, S., Tangen, B., and Finocchiaro, R., 2016, Temperature and hydrology affect methane emissions from prairie pothole wetlands: Wetlands, v. 36, p. 371–381. [Also available at https://doi.org/10.1007/s13157-016-0826-8.]
Bansal, S., Tangen, B., and Finocchiaro, R., 2018, Diurnal patterns of methane flux from a seasonal wetland—Mechanisms and methodology: Wetlands, v. 38, no. 5, p. 933–943. [Also available at https://doi.org/10.1007/s13157-018-1042-5.]
Berthold, S., Bentley, L.R., and Hayashi, M., 2004, Integrated hydrogeological and geophysical study of depression-focused groundwater recharge in the Canadian prairies: Water Resources Research, v. 40, no. 6, W06505. [Also available at https://doi.org/10.1029/2003WR002982.]
Brooks, J.R., Mushet, D.M., Vanderhoof, M.K., Leibowitz, S.G., Christensen, J.R., Neff, B.P., Rosenberry, D.O., Rugh, W.D., and Alexander, L.C., 2018, Estimating wetland connectivity to streams in the Prairie Pothole Region—An isotopic and remote sensing approach: Water Resources Research, v. 54, no. 2, p. 955–977. [Also available at https://doi.org/10.1002/2017WR021016.]
Brown, D.E., Smith, A.T., Frey, J.K., and Schweiger, B.R., 2020, A review of the ongoing decline of the white-tailed jackrabbit: Journal of Fish and Wildlife Management, v. 11, no. 1, p. 341–352. [Also available at https://doi.org/10.3996/042019-JFWM-026.]
Browne, B.A., 2004, Pumping-induced ebullition—A unified and simplified method for measuring multiple dissolved gases: Environmental Science & Technology, v. 38, no. 21, p. 5729–5736. [Also available at https://doi.org/10.1021/es035464m.]
Cohn, J.P., 2006, Chase Lake pelicans make a comeback: Bioscience, v. 56, 704 p. [Also available at https://academic.oup.com/bioscience/article-pdf/56/8/704/26898329/56-8-704.pdf.]
Cook, E.R., Meko, D.M., and Stockton, C.W., 1997, A new assessment of possible solar and lunar forcing of the bidecadal drought rhythm in the western United States: Journal of Climate, v. 10, no. 6, p. 1343–1356. [Also available at https://doi.org/10.1175/1520-0442(1997)010<1343:ANAOPS>2.0.CO;2.]
Costanza, R., and Voinov, A., 2001, Modeling ecological and economic systems with STELLA—Part III: Ecological Modelling, v. 143, no. 1-2, p. 1–7. [Also available at https://doi.org/10.1016/S0304-3800(01)00358-1.]
Dalcin Martins, P., Hoyt, D.W., Bansal, S., Mills, C.T., Tfaily, M., Tangen, B.A., Finocchiaro, R.G., Johnston, M.D., McAdams, B.C., Solensky, M.J., Smith, G.J., Chin, Y.-P., and Wilkins, M.J., 2017, Abundant carbon substrates drive extremely high sulfate reduction rates and methane fluxes in prairie pothole wetlands: Global Change Biology, v. 23, no. 8, p. 3107–3120. [Also available at https://doi.org/10.1111/gcb.13633.]
Davidson, E.A., Keller, M., Erickson, H.E., Verchot, L.V., and Veldkamp, E., 2000, Testing a conceptual model of soil emissions of nitrous and nitric oxides: Bioscience, v. 50, no. 8, p. 667–680. [Also available at https://doi.org/10.1641/0006-3568(2000)050[0667:TACMOS]2.0.CO;2.]
Diaz, H.F., 1983, Drought in the United States: Journal of Climate and Applied Meteorology, v. 22, p. 3–16. [Also available at https://doi.org/10.1175/1520-0450(1983)022<0003:DITUS>2.0.CO;2.]
Diaz, H.F., 1986, An analysis of twentieth century climate fluctuations in northern North America: Journal of Climate and Applied Meteorology, v. 25, no. 11, p. 1625–1657. [Also available at https://doi.org/10.1175/1520-0450(1986)025<1625:AAOTCC>2.0.CO;2.]
Duvick, D.N., and Blasing, T.J., 1981, A dendroclimatic reconstruction of annual precipitation amounts in Iowa since 1680: Water Resources Research, v. 17, no. 4, p. 1183–1189. [Also available at https://doi.org/10.1029/WR017i004p01183.]
Earth Resources Observation and Science Center, 2018, National Land Cover DataBase, accessed July 2022 at https://www.usgs.gov/centers/eros/science/national-land-cover-database.
Eisenlohr, W.S., Jr., and others, 1972, Hydrologic investigations of prairie potholes in North Dakota, 1959-68: U.S. Geological Survey Professional Paper 585–A, 102 p. [Also available at https://doi.org/10.3133/pp585A.]
Euliss, N.H., Jr., Wrubleski, D.A., and Mushet, D.M., 1999, Wetlands of the Prairie Pothole Region—Invertebrate species composition, ecology, and management, in Batzer, D., Rader, R.B., and Wissinger, S.A., eds., Invertebrates in freshwater wetlands of North America—Ecology and management: New York, John Wiley and Sons, Inc., p. 471–514.
Euliss, N.H., Jr., LaBaugh, J.W., Fredrickson, L.H., Mushet, D.M., Laubhan, M.K., Swanson, G.A., Winter, T.C., Rosenberry, D.O., and Nelson, R.D., 2004, The wetland continuum—A conceptual framework for interpreting biological studies: Wetlands, v. 24, no. 2, p. 448–458. [Also available at https://doi.org/10.1672/0277-5212(2004)024[0448:TWCACF]2.0.CO;2.]
Euliss, N.H., Jr., and Mushet, D.M., 2011, A multi-year comparison of IPCI scores for prairie pothole wetlands—Implications of temporal and spatial variation: Wetlands, v. 31, no. 4, p. 713–723. [Also available at https://doi.org/10.1007/s13157-011-0187-2.]
Euliss, N.H., Jr., Mushet, D.M., Newton, W.E., Otto, C.R.V., Nelson, R.D., LaBaugh, J.W., Scherff, E.J., and Rosenberry, D.O., 2014, Placing prairie-pothole wetlands along spatial and temporal continua to improve integration of wetland function in ecological investigations: Journal of Hydrology, v. 513, p. 490–503. [Also available at https://doi.org/10.1016/j.jhydrol.2014.04.006.]
Euliss, N.H., Jr., Smith, L.M., Wilcox, D.A., and Browne, B.A., 2008, Linking ecosystem processes with wetland management goals—Charting a course for a sustainable future: Wetlands, v. 28, no. 3, p. 553–562. [Also available at https://doi.org/10.1672/07-154.1.]
Finocchiaro, R., Tangen, B., and Gleason, R., 2014, Greenhouse gas fluxes of grazed and hayed wetland catchments in the U.S. Prairie Pothole Ecoregion: Wetlands Ecology and Management, v. 22, no. 3, p. 305–324. [Also available at https://doi.org/10.1007/s11273-013-9331-5.]
Fishman, M.J., and Friedman, L.C., 1989, Methods for determination of inorganic substances in water and fluvial sediments: U.S. Geological Survey Techniques of Water Resources Investigations, book 5, chap. A1, 560 p. [Also available at https://doi.org/10.3133/twri05A1.]
Forester, R.M., 1986, Determination of the dissolved anion composition of ancient lakes from fossil ostracodes: Geology, v. 14, no. 9, p. 796–798. [Also available at https://doi.org/10.1130/0091-7613(1986)14<796:DOTDAC>2.0.CO;2.]
Fritz, K.A., Kirschman, L.J., McCay, S.D., Trushenski, J.T., Warne, R.W., and Whiles, M.R., 2017, Subsidies of essential nutrients from aquatic environments correlate with immune function in terrestrial consumers: Freshwater Science, v. 36, no. 4, p. 893–900. [Also available at https://doi.org/10.1086/694451.]
Gleason, R.A., Laubhan, M.K., and Euliss, N.H., Jr., eds., 2008, Ecosystem services derived from wetland conservation practices in the United States Prairie Pothole Region with an emphasis on the U.S. Department of Agriculture Conservation Reserve and Wetlands Reserve Programs: U.S. Geological Survey Professional Paper 1745, 58 p. [Also available at https://doi.org/10.3133/pp1745.]
Gleason, R.A., Tangen, B.A., Browne, B.A., and Euliss, N.H., Jr., 2009, Greenhouse gas flux from cropland and restored wetlands in the Prairie Pothole Region: Soil Biology & Biochemistry, v. 41, no. 12, p. 2501–2507. [Also available at https://doi.org/10.1016/j.soilbio.2009.09.008.]
Goldhaber, M.B., Mills, C.T., Mushet, D.M., McClesky, B.B., and Rover, J., 2016, Controls on the geochemical evolution of Prairie Pothole Region wetlands over decadal time scales: Wetlands, v. 36, p. 255–272. [Also available at https://doi.org/10.1007/s13157-016-0854-4.]
Goldhaber, M.B., Mills, C., Stricker, C.A., and Morrison, J.M., 2011, The role of critical zone processes in the evolution of the Prairie Pothole Region wetlands: Applied Geochemistry, v. 26, p. S32–S35. [Also available at https://doi.org/10.1016/j.apgeochem.2011.03.022.]
Goldhaber, M.B., Mills, C.T., Morrison, J.M., Stricker, C.A., Mushet, D.M., and LaBaugh, J.W., 2014, Hydrogeochemistry of Prairie Pothole Region wetlands—Role of long-term critical zone processes: Chemical Geology, v. 387, p. 170–183. [Also available at https://doi.org/10.1016/j.chemgeo.2014.08.023.]
Grasby, S.E., Osborn, J., Chen, Z., and Wozniak, P.R.J., 2010, Influence of till provenance on regional groundwater geochemistry: Chemical Geology, v. 273, no. 3-4, p. 225–237. [Also available at https://doi.org/10.1016/j.chemgeo.2010.02.024.]
Gray, M.J., Miller, D.L., and Hoverman, J.T., 2009, Ecology and pathology of amphibian ranaviruses: Diseases of Aquatic Organisms, v. 87, p. 243–266. [Also available at https://doi.org/10.3354/dao02138.]
Green, D.E., Converse, K.A., and Schrader, A.K., 2006, Epizootiology of sixty-four amphibian morbidity and mortality events in the USA, 1996–2001: Annals of the New York Academy of Sciences, v. 969, no. 1, p. 323–339. [Also available at https://doi.org/10.1111/j.1749-6632.2002.tb04400.x.]
Hammer, U.T., 1978, The saline lakes of Saskatchewan, III. chemical characterization: Internationale Revue der Gesamten Hydrobiologie, v. 63, no. 3, p. 311–335. [Also available at https://doi.org/10.1002/iroh.19780630303.]
Hanson, B.A., and Swanson, G.A., 1989, Coleoptera species inhabiting prairie wetlands of the Cottonwood Lake area, Stutsman County, North Dakota: Prairie Naturalist, v. 21, no. 1, p. 49–57. [Also available at https://pubs.er.usgs.gov/publication/1001534.]
Hanson, M.A., Zimmer, K.D., Butler, M.G., Tangen, B.A., Herwig, B.R., and Euliss, N.H., Jr., 2005, Biotic interactions as determinants of ecosystem structure in prairie wetlands—An example using fish: Wetlands, v. 25, no. 3, p. 764–765. [Also available at https://doi.org/10.1672/0277-5212(2005)025[0764:BIADOE]2.0.CO;2.]
Harris, S.W., and Marshall, W.H., 1963, Ecology of water-level manipulations on a northern marsh: Ecology, v. 44, no. 2, p. 331–343. [Also available at https://doi.org/10.2307/1932180.]
Hayashi, M., van der Kamp, G., and Rosenberry, D.O., 2016, Hydrology of prairie wetlands—Understanding the integrated surface-water and groundwater processes: Wetlands, v. 36, S2, p. 237–254. [Also available at https://doi.org/10.1007/s13157-016-0797-9.]
Heagle, D.J., Hayashi, M., and van der Kamp, G., 2007, Use of solute mass balance to quantify geochemical processes in a prairie recharge wetland: Wetlands, v. 27, no. 4, p. 806–818. [Also available at https://doi.org/10.1672/0277-5212(2007)27[806:UOSMBT]2.0.CO;2.]
Heagle, D., Hayashi, M., and van der Kamp, G., 2013, Surface—Subsurface salinity distribution and exchange in a closed-basin prairie wetland: Journal of Hydrology, v. 478, p. 1–14. [Also available at https://doi.org/10.1016/j.jhydrol.2012.05.054.]
Hendry, M.J., 1988, Hydrogeology of clay till in a prairie region of Canada: Ground Water, v. 26, no. 5, p. 607–614. [Also available at https://doi.org/10.1111/j.1745-6584.1988.tb00794.x.]
Hendry, M.J., Cherry, J.A., and Wallick, E.I., 1986, Origin and distribution of sulfate in a fractured till in southern Alberta, Canada: Water Resources Research, v. 22, no. 1, p. 45–61. [Also available at https://doi.org/10.1029/WR022i001p00045.]
Jaccard, P., 1912, The Distribution of the Flora in the Alpine Zone: The New Phytologist, v. 11, p. 37–50. [Also available at https://doi.org/10.1111/j.1469-8137.1912.tb05611.x.]
Johnson, W.C., Millett, B.V., Gilmanov, T., Voldseth, R.A., Guntenspergen, G.R., and Naugle, D.E., 2005, Vulnerability of northern prairie wetlands to climate change: Bioscience, v. 55, no. 10, p. 863–872. [Also available at https://doi.org/10.1641/0006-3568(2005)055[0863:VONPWT]2.0.CO;2.]
Krebs, C.J., Boonstra, R., Boutin, S., and Sinclair, A.R.E., 2001, What drives the 10-year cycle of snowshoe hares? The ten-year cycle of snowshoe hares—one of the most striking features of the boreal forest—is a product of the interaction between predation and food supplies, as large-scale experiments in the Yukon have demonstrated: Bioscience, v. 51, no. 1, p. 25–35. [Also available at https://doi.org/10.1641/0006-3568(2001)051[0025:WDTYCO]2.0.CO;2.]
Karl, T.R., and Koscielny, A.J., 1982, Drought in the United States: 1895-1981: Journal of Climatology, v. 2, no. 4, p. 313–329. [Also available at https://doi.org/10.1002/joc.3370020402.]
Karl, T.R., and Riebsame, W.E., 1984, The identification of 10 to 20 year temperature and precipitation fluctuations in the contiguous United States: Journal of Climate and Applied Meteorology, v. 23, no. 6, p. 950–966. [Also available at https://doi.org/10.1175/1520-0450(1984)023<0950:TIOTYT>2.0.CO;2.]
Kraus, J.M., Kuivila, K.M., Hladik, M.L., Shook, N., Mushet, D.M., Dowdy, K., and Harrington, R., 2021, Cross-ecosystem fluxes of pesticides from prairie wetlands mediated by aquatic insect emergence—Implications for terrestrial insectivores: Environmental Toxicology and Chemistry, v. 40, no. 8, p. 2282–2296. [Also available at https://doi.org/10.1002/etc.5111.]
LaBaugh, J., Mushet, D.M., Rosenberry, D., Euliss, N.H., Jr., Goldhaber, M., Mills, C., and Nelson, R., 2016, Changes in pond water levels and surface extent due to climate variability alter solute sources to closed-basin prairie wetland ponds, 1979–2012: Wetlands, v. 36, S2, p. 343–355. [Also available at https://doi.org/10.1007/s13157-016-0808-x.]
LaBaugh, J.W., Rosenberry, D.O., Mushet, D.M., Neff, B., Nelson, R.D., and Euliss, N.H., Jr., 2018, Long-term changes in pond permanence, size, and salinity in Prairie Pothole Region wetlands—The role of groundwater-pond interaction: Journal of Hydrology. Regional Studies, v. 17, p. 1–23. [Also available at https://doi.org/10.1016/j.ejrh.2018.03.003.]
LaBaugh, J.W., Winter, T.C., Adomaitis, V.A., and Swanson, G.A., 1987, Hydrology and chemistry of selected prairie wetlands in the Cottonwood Lake area, Stutsman County, North Dakota, 1979–82: U.S. Geological Survey Professional Paper 1431, 26 p. [Also available at https://doi.org/10.3133/pp1431.]
Laird, K.R., Fritz, S.C., Maasch, K.A., and Cumming, B.F., 1996, Greater drought intensity and frequency before AD 1200 in the Northern Great Plains, USA: Nature, v. 384, no. 6609, p. 552–554. [Also available at https://doi.org/10.1038/384552a0.]
Levy, Z.F., 2017, Climatic controls on the porewater chemistry of mid-continental wetlands: Syracuse, New York, Syracuse University, Ph.D. Dissertation, 162 p. [Also available at https://surface.syr.edu/etd/731.]
Levy, Z.F., Rosenberry, D.O., Moucha, R., Mushet, D.M., Goldhaber, M.B., LaBaugh, J.W., Fiorentino, A.J., and Siegel, D.I., 2018a, Drought-induced recharge promotes long-term storage of porewater salinity beneath a prairie wetland: Journal of Hydrology, v. 557, p. 391–406. [Also available at https://doi.org/10.1016/j.jhydrol.2017.12.005.]
Levy, Z.F., Mills, C.T., Lu, Z., Goldhaber, M.B., Rosenberry, D.O., Mushet, D.M., Lautz, L.K., Zhou, X., and Siegel, D.I., 2018b, Using halogens (Cl, Br, I) to understand the hydrogeochemical evolution of drought-derived saline porewater beneath a prairie wetland: Chemical Geology, v. 476, p. 191–207. [Also available at https://doi.org/10.1016/j.chemgeo.2017.11.017.]
Mann, L.K., 1986, Changes in soil carbon storage after cultivation: Soil Science, v. 142, no. 5, p. 279–288. [Also available at https://doi.org/10.1097/00010694-198611000-00006.]
McCabe, A., 2017, Photochemical production of reactive intermediates in inland surface waters: Minneapolis, Minnesota, University of Minnesota, Ph.D. Dissertation, 321 p. [Also available at http://hdl.handle.net/11299/198378.]
McCauley, L.A., Anteau, M.J., van der Burg, M.P., and Wiltermuth, M.T., 2015, Land use and wetland drainage affect water levels and dynamics of remaining wetlands: Ecosphere, v. 6, no. 6, p. 1–22. [Also available at https://doi.org/10.1890/ES14-00494.1.]
McKenna, O.P., Kucia, S.R., Mushet, D.M., Anteau, M.J., and Wiltermuth, M.T., 2019, Synergistic interaction of climate and land-use drivers alter the function of North American, prairie-pothole wetlands: Sustainability (Basel), v. 11, no. 23, p. 6581. [Also available at https://doi.org/10.3390/su11236581.]
McKenna, O.P., Mushet, D.M., Kucia, S.R., and McCulloch-Huseby, E.C., 2021a, Limited shifts in the distribution of migratory bird breeding habitat density in response to future changes in climate: Ecological Applications, v. 31, no. 7, p. e02428. [Also available at https://doi.org/10.1002/eap.2428.]
McKenna, O.P., Mushet, D.M., Rosenberry, D.O., and LaBaugh, J.W., 2017, Evidence for a climate-induced ecohydrological state shift in wetland ecosystems of the southern Prairie Pothole Region: Climatic Change, v. 145, no. 3-4, p. 273–287. [Also available at https://doi.org/10.1007/s10584-017-2097-7.]
McKenna, O.P., Mushet, D.M., Scherff, E.J., McLean, K.I., and Mills, C.T., 2018, The pothole hydrology linked systems simulator (PHyLiSS)—Development and application of a systems model for prairie-pothole wetlands: U.S. Geological Survey Open-File Report 2018–1165, 21 p. [Also available at https://doi.org/10.3133/ofr20181165.]
McKenna, O.P., Renton, D.A., Mushet, D.M., and DeKeyser, E.S., 2021b, Upland burning and grazing as strategies to offset climate-change effects on wetlands: Wetlands Ecology and Management, v. 29, no. 2, p. 193–208. [Also available at https://doi.org/10.1007/s11273-020-09778-1.]
McLean, K.I., 2015, The “fathead minnow factory” exploring how a changing climate has influenced fish and salamander communities in the Prairie Pothole Region: Fargo, North Dakota, North Dakota State University, Master’s Thesis, 85 p. [Also available at https://library.ndsu.edu/ir/handle/10365/27826.]
McLean, K.I., 2020, Aquatic macroinvertebrate response to shifts in hydroclimatic variability and ecohydrological conditions in prairie-pothole wetlands: implications for biodiversity conservation: Fargo, North Dakota, North Dakota State University, Ph.D. Dissertation, 198 p. [Also available at https://search.proquest.com/openview/f2fd7123b26e6973c01dc0cf0ba16bd8/1.pdf?pq-origsite=gscholar&cbl=2026366&diss=y.]
McLean, K.I., Mushet, D.M., Newton, W.E., and Sweetman, J., 2021, Long-term multidecadal data from a prairie-pothole wetland complex reveal controls on aquatic-macroinvertebrate communities: Ecological Indicators, v. 126, p. 107678. [Also available at https://doi.org/10.1016/j.ecolind.2021.107678.]
McLean, K.I., Mushet, D.M., and Stockwell, C.A., 2016, From “duck factory” to “fish factory”—Climate induced changes in vertebrate communities of prairie pothole wetlands and small lakes: Wetlands, v. 36, S2, p. 407–421. [Also available at https://doi.org/10.1007/s13157-016-0766-3.]
Meybloom, P., 1966, Current trends in hydrogeology: Earth-Science Reviews, v. 2, p. 345–364. [Also available at https://doi.org/10.1016/0012-8252(66)90034-1.]
Miller, R.S., 1968, Conditions of competition between redwings and yellow-headed blackbirds: Journal of Animal Ecology, v. 37, no. 1, p. 43–61. [Also available at https://doi.org/10.2307/2710.]
Mills, J.G., and Zwarich, M.A., 1986, Transient groundwater flow surrounding a recharge slough in a till plain: Canadian Journal of Soil Science, v. 66, no. 1, p. 121–134. [Also available at https://doi.org/10.4141/cjss86-012.]
Mushet, D.M., 2016, Midcontinent prairie-pothole wetlands and climate change—An introduction to the supplemental issue: Wetlands, v. 36, no. S2, suppl. 2, p. 223–228. [Also available at https://doi.org/10.1007/s13157-016-0852-6.]
Mushet, D.M, 2019a, Cottonwood Lake study area—Boundary polygon: U.S. Geological Survey data release, accessed May 2022 at https://doi.org/10.5066/P9B0GADT.
Mushet, D.M, 2019b, Cottonwood Lake study area—Well locations: U.S. Geological Survey data release, accessed May 2022 at https://doi.org/10.5066/P9Q5BSIQ.
Mushet, D.M., Alexander, L.C., Bennett, M., Schofield, K., Christensen, J.R., Ali, G., Pollard, A., Fritz, K., and Lang, M.W., 2019a, Differing modes of biotic connectivity within freshwater ecosystem mosaics: Journal of the American Water Resources Association, v. 55, no. 2, p. 307–317. [Also available at https://doi.org/10.1111/1752-1688.12683.]
Mushet, D.M., Euliss, N.H., Jr., Hanson, B.A., Neau, J.L., Bryant, R.B., and Erickson, S.F., 2017a, Cottonwood Lake study area—Wetland vegetation zones: U.S. Geological Survey data release, accessed May 2022 at https://doi.org/10.5066/F7J101DQ.
Mushet, D.M., Euliss, N.H., Jr., Lane, S.P., and Goldade, C.M., 2004, The flora of the Cottonwood Lake study area, Stutsman County, North Dakota: Prairie Naturalist, v. 36, p. 43–62. [Also available at https://pubs.er.usgs.gov/publication/1001748.]
Mushet, D.M., Euliss, N.H., Jr., and Shaffer, T.L., 2002, Floristic quality assessment of one natural and three restored wetland complexes in North Dakota, USA: Wetlands, v. 22, no. 1, p. 126–138. [Also available at https://doi.org/10.1672/0277-5212(2002)022[0126:FQAOON]2.0.CO;2.]
Mushet, D.M., Euliss, N.H., Jr., and Stockwell, C.A., 2012, Mapping anuran habitat suitability to estimate effects of grassland and wetland conservation programs: Copeia, v. 2012, no. 2, p. 321–331. [Also available at https://doi.org/10.1643/CH-11-119.]
Mushet, D.M., LaBaugh, J.W., and Winter, T.C., 2017c, Cottonwood Lake study area—Water chemistry—Wells: U.S. Geological Survey data release, accessed June 2021 at https://doi.org/10.5066/F78W3BH2.
Mushet, D.M., LaBaugh, J.W., Nelson, R.D., and Euliss, N.H., Jr., 2017b, Cottonwood Lake study area—Water chemistry—Wetlands: U.S Geological Survey data release, accessed June 2021 at https://doi.org/10.5066/F7DN437S.
Mushet, D.M., McKenna, O.P., LaBaugh, J.W., Euliss, N.H., Jr., and Rosenberry, D.O., 2018, Accommodating state shifts within the conceptual framework of the wetland continuum: Wetlands, v. 38, no. 3, p. 647–651. [Also available at https://doi.org/10.1007/s13157-018-1004-y.]
Mushet, D.M., Rosenberry, D.O., and Solensky, M.J., 2022b, Cottonwood Lake study area—Groundwater elevations (ver. 2.0): U.S. Geological Survey data release, accessed May 2022 at https://doi.org/10.5066/P9YKWWSZ.
Mushet, D.M., and Solensky, M.J., 2022a, Cottonwood Lake study area—Amphibians (ver. 2.0): U.S. Geological Survey data release, accessed May 2022 at https://doi.org/10.5066/P9G8TM2S.
Mushet, D.M., and Solensky, M.J., 2022b, Cottonwood Lake study area—Breeding birds (ver. 2.0): U.S. Geological Survey data release, accessed May 2022 at https://doi.org/10.5066/P94LIJU5.
Mushet, D.M., and Solensky, M.J., 2022c, Cottonwood Lake study area—Invertebrate counts (ver. 2.0): U.S. Geological Survey data release, accessed May 2022 at https://doi.org/10.5066/P99GXVSV.
Mushet, D.M., and Solensky, M.J., 2022d, Cottonwood Lake study area—Invertebrate weights (ver. 2.0): U.S. Geological Survey data release, accessed May 2022 at https://doi.org/10.5066/P92IJREV.
Mushet, D.M., and Solensky, M.J., 2022e, Cottonwood Lake study area—Specific conductance (ver. 2.0): U.S. Geological Survey data release, accessed May 2022 at https://doi.org/10.5066/P9GTOFCW.
Mushet, D.M., Solensky, M.J., and Erickson, S.F., 2019b, Temporal gamma-diversity meets spatial alpha-diversity in dynamically varying ecosystems: Biodiversity and Conservation, v. 28, no. 7, p. 1783–1797. [Also available at https://doi.org/10.1007/s10531-019-01756-1.]
Mushet, D.M., Rosenberry, D.O., Euliss, N.H., Jr., and Solensky, M.J., 2022a, Cottonwood Lake study area—Water surface elevations (ver. 2.0): U.S. Geological Survey data release, accessed May 2022 at https://doi.org/10.5066/P9MULBED.
Mushet, D.M., Roth, C.L., and Scherff, E.J., 2017d, Cottonwood Lake study area—Digital elevation model with topobathy: U.S. Geological Survey data release, accessed May 2022 at https://doi.org/10.5066/F7V69GTD.
NOAA National Centers for Environmental Information, 2021, Climate data online: accessed May 2021 at https://www.ncdc.noaa.gov/cdo-web.
Neff, B.P., 2017, Hydraulic conductivity data for piezometers near Cottonwood Lake study area, North Dakota (1978–2017): U.S. Geological Survey data release, accessed May 2022 at https://doi.org/10.5066/F75X27TW.
Neff, B.P., and Rosenberry, D.O., 2018, Groundwater connectivity of upland-embedded wetlands in the Prairie Pothole Region: Wetlands, v. 38, no. 1, p. 51–63. [Also available at https://doi.org/10.1007/s13157-017-0956-7.]
Neff, B., Rosenberry, D.O., Leibowitz, S.G., Mushet, D.M., Golden, H.E., Rains, M.C., Brooks, J.R., and Lane, C.R., 2020, A hydrologic landscapes perspective on groundwater connectivity of depressional wetlands: Water (Basel), v. 12, no. 1, p. 50. [Also available at https://doi.org/10.3390/w12010050.]
Orians, G.H., and Willson, M.F., 1964, Interspecific territories of birds: Ecology, v. 45, no. 4, p. 736–745. [Also available at https://doi.org/10.2307/1934921.]
Renton, D., 2016, Managing upland vegetation as a mitigation strategy for climate-change effects on prairie-pothole wetlands: Fargo, North Dakota, North Dakota State University, Master’s Thesis, 90 p. [Also available at https://library.ndsu.edu/ir/handle/10365/28071.]
Richardson, J.L., Arndt, J.L., and Freeland, J., 1994, Wetland soils of the prairie potholes: Advances in Agronomy, v. 52, p. 121–171. [Also available at https://doi.org/10.1016/S0065-2113(08)60623-9.]
Rosenberry, D.O., 2003, Climate of the Cottonwood Lake Area, in Winter, T.C., ed., Hydrological, chemical, and biological characteristics of a prairie pothole wetland complex under highly variable climate conditions—The Cottonwood Lake area, East-Central, North Dakota: U.S. Geological Survey Professional Paper 1675, p. 25–34.
Rosenberry, D.O., and Winter, T.C., 1997, Dynamics of water-table fluctuations in an upland between two prairie-pothole wetlands in North Dakota: Journal of Hydrology, v. 191, no. 1-4, p. 266–289. [Also available at https://doi.org/10.1016/S0022-1694(96)03050-8.]
Rozkowski, A., 1969, Chemistry of ground and surface waters in the Moose Mountain area, southern Saskatchewan: Geological Survey of Canada Paper 67–69: Ottawa, The Queen’s Printer. [Also available at https://doi.org/10.4095/104738.]
Ryberg, K.R., Akyüz, F.A., Wiche, G.J., and Lin, W., 2016a, Changes in seasonality and timing of peak streamflow in snow and semi-arid climates of the north-central United States, 1910-2012: Hydrological Processes, v. 30, no. 8, p. 1208–1218. [Also available at https://doi.org/10.1002/hyp.10693.]
Ryberg, K.R., Vecchia, A.V., Akyüz, F.A., and Lin, W., 2016b, Tree-ring-based estimates of long-term seasonal precipitation in the Souris River Region of Saskatchewan, North Dakota, and Manitoba: Canadian Water Resources Journal, v. 41, no. 3, p. 412–428. [Also available at https://doi.org/10.1080/07011784.2016.1164627.]
Samson, F.B., Knopf, F.L., and Ostlie, W.R., 2004, Great Plains ecosystem—Past, present, and future: Wildlife Society Bulletin, v. 32, no. 1, p. 6–15. [Also available at https://doi.org/10.2193/0091-7648(2004)32[6:GPEPPA]2.0.CO;2.]
Schofield, K., Alexander, L.C., Ridley, C.E., Vanderhoof, M.K., Fritz, K.M., Autrey, B.C., DeMeester, J.E., Kepner, W.G., Lane, C.R., Leibowitz, S.G., and Pollard, A.I., 2018, Biota connect aquatic habitats through freshwater ecosystem mosaics: Journal of the American Water Resources Association, v. 54, no. 2, p. 372–399. [Also available at https://doi.org/10.1111/1752-1688.12634.]
Shaw, D.A., van der Kamp, G., Conly, F.M., Pietroniro, G., and Martz, L., 2012, The fill-spill hydrology of prairie wetland complexes during drought and deluge: Hydrological Processes, v. 26, p. 3147–3156. [Also available at https://doi.org/10.1002/hyp.8390.]
Shjeflo, J.M., 1968, Evapotranspiration and the water budget of prairie potholes in North Dakota: U.S. Geological Survey Professional Paper 585–B, 49 p. [Also available at https://doi.org/10.3133/pp585B.]
Sloan, C.E., 1972, Ground-water hydrology of prairie potholes in North Dakota: U.S. Geological Survey Professional Paper 585–C, 28 p. [Also available at https://doi.org/10.3133/pp585C.]
Sovada, M.A., King, D.T., Erickson, M., and Gray, C., 2005, Historic and current status of the American white pelican breeding at Chase Lake National Wildlife Refuge, North Dakota: Waterbirds, v. 28, sp1, p. 27–34. [Also available at https://doi.org/10.1675/1524-4695(2005)28[27:HACSOT]2.0.CO;2.]
Sovada, M.A., Sargeant, A.B., and Grier, J.W., 1995, Differential effects of coyotes and red foxes on duck nest success: The Journal of Wildlife Management, v. 59, no. 1, p. 1–9. [Also available at https://doi.org/10.2307/3809108.]
Stewart, R.E., and Kantrud, H.A., 1972, Vegetation of prairie potholes in North Dakota in relation to quality of water and other environmental factors. U.S. Geological Survey Professional Paper 585–D, 35 p. [Also available at https://doi.org/10.3133/pp585D.]
Swanson, G.A., 1978, Funnel trap for collecting littoral aquatic invertebrates: The Progressive Fish-Culturist, v. 40, no. 2, p. 73. [Also available at https://doi.org/10.1577/1548-8659(1978)40[73:FTFCLA]2.0.CO;2.]
Swanson, G.A., 1983, Benthic sampling for waterfowl foods in emergent vegetation: The Journal of Wildlife Management, v. 47, no. 3, p. 821–823. [Also available at https://doi.org/10.2307/3808618.]
Swanson, G.A., 1984, Dissemination of amphipods by waterfowl: The Journal of Wildlife Management, v. 48, no. 3, p. 988–991. [Also available at https://doi.org/10.2307/3801453.]
Swanson, G.A., and Bartonek, J.C., 1970, Bias associated with food analysis in gizzards of blue-winged teal: The Journal of Wildlife Management, v. 34, no. 4, p. 739–746. [Also available at https://doi.org/10.2307/3799138.]
Swanson, G.A., Meyer, M.I., and Adomaitis, V.A., 1985, Foods consumed by breeding mallards on wetlands of south-central North Dakota: The Journal of Wildlife Management, v. 49, no. 1, p. 197–203. [Also available at https://doi.org/10.2307/3801871.]
Swanson, G.A., Euliss, N.H., Jr., Hanson, B.A., and Mushet, D.M., 2003, Dynamics of a prairie wetland complex—Implications for wetland management, in Winter, T.C., ed., Hydrological, chemical, and biological characteristics of a prairie pothole wetland complex under highly variable climate conditions—The Cottonwood Lake area, East-Central, North Dakota: U.S. Geological Survey Professional Paper 1675, p. 55–94.
Tangen, B.A., and Bansal, S., 2019a, Hydrologic lag effects on wetland greenhouse gas fluxes: Atmosphere, v. 10, no. 5, p. 269. [Also available at https://doi.org/10.3390/atmos10050269.]
Tangen, B.A., and Bansal, S., 2019b, Soil properties and greenhouse gas fluxes of Prairie Pothole Region wetlands—A comprehensive data release: U.S. Geological Survey data release, accessed May 2022 at https://doi.org/10.5066/F7KS6QG2.
Tangen, B.A., and Bansal, S., 2020, Soil organic carbon stocks and sequestration rates of inland, freshwater wetlands—Sources of variability and uncertainty: Science of the Total Environment, v. 749, no. 141444, 11 p. [Also available at https://doi.org/10.1016/j.scitotenv.2020.141444.]
Tangen, B.A., Finocchiaro, R.G., and Gleason, R.A., 2015, Effects of land use on greenhouse gas fluxes and soil properties of wetland catchments in the Prairie Pothole Region of North America: Science of the Total Environment, v. 533, p. 391–409. [Also available at https://doi.org/10.1016/j.scitotenv.2015.06.148.]
Twedt, D.J., and Crawford, R.D., 1995, Yellow-headed Blackbird (Xanthocephalus xanthocephalus), in Poole, A., and Gill, F., eds., Yellow-headed blackbird: The Birds of North America No. 192, The Academy of Natural Sciences, 28 p. [Also available at https://doi.org/10.2173/tbna.192.p.]
Twining, C.W., Brenna, J.T., Lawrence, P., Winkler, D.W., Flecker, A.S., and Hairston, N.G., Jr., 2019, Aquatic and terrestrial resources are not nutritionally reciprocal for consumers: Functional Ecology, v. 33, no. 10, p. 2042–2052. [Also available at https://doi.org/10.1111/1365-2435.13401.]
Twining, C.W., Shipley, J.R., and Winkler, D.W., 2018, Aquatic insects rich in omega-3 fatty acids drive breeding success in a widespread bird: Ecology Letters, v. 21, no. 12, p. 1812–1820. [Also available at https://doi.org/10.1111/ele.13156.]
USDA National Agriculture Imagery Program, 2022, NAIP GioHub, accessed June 2022 at https://naip-usdaonline.hub.arcgis.com.
U.S. Geological Survey, 2017, Cottonwood Lake study area—Aerial imagery: U.S. Geological Survey data release, accessed May 2022 at https://doi.org/10.5066/F7DZ06GR.
U.S. Geological Survey, 2022, Pothole Hydrology Linked System Simulator (PHyLiSS): accessed May 2022 at https://www.sciencebase.gov/catalog/item/5b840f3ee4b05f6e321b4f04.
van der Kamp, G., Stolte, W.J., and Clark, R.G., 1999, Drying out of small prairie wetlands after conversion of their catchments from cultivation to permanent brome grass: Hydrological Sciences Journal, v. 44, no. 3, p. 387–397. [Also available at https://doi.org/10.1080/02626669909492234.]
van der Valk, A.G., 2005b, Water-level fluctuations in North American prairie wetlands: Hydrobiologia, v. 539, no. 1, p. 171–188. [Also available at https://doi.org/10.1007/s10750-004-4866-3.]
van der Valk, A.G., and Davis, C.B., 1978, The role of seed banks in the vegetation dynamics of prairie glacial marshes: Ecology, v. 59, no. 2, p. 322–335. [Also available at https://doi.org/10.2307/1936377.]
Vannote, R.L., Minshall, G.W., Cummins, K.W., Sedell, J.R., and Cushing, C.E., 1980, The river continuum: Canadian Journal of Fisheries and Aquatic Sciences, v. 37, no. 1, p. 130–137. [Also available at https://doi.org/10.1139/f80-017.]
Weller, M.W., 1988, Issues and approaches in assessing cumulative impacts on waterbird habitat in wetlands: Environmental Management, v. 12, no. 5, p. 695–701. [Also available at https://doi.org/10.1007/BF01867546.]
Wetzel, P.R., and van derValk, A.G., 1996, Vesicular-arbuscular mycorrhizae in prairie pothole wetland vegetation in Iowa and North Dakota: Canadian Journal of Botany, v. 74, p. 883–890. [Also available at https://doi.org/10.1139/b96-110.]
Winter, T.C., 2003, Geohydrologic setting of the Cottonwood Lake Area, in Winter, T.C., ed., Hydrological, chemical, and biological characteristics of a prairie pothole wetland complex under highly variable climate conditions—The Cottonwood Lake area, East-Central, North Dakota: U.S. Geological Survey Professional Paper 1675, p. 1–24.
Winter, T.C., and LaBaugh, J.W., 2003, Hydrologic consideration in defining isolated wetlands: Wetlands, v. 23, no. 3, p. 532–540. [Also available at https://doi.org/10.1672/0277-5212(2003)023[0532:HCIDIW]2.0.CO;2.]
Winter, T.C., and Rosenberry, D.O., 1998, Hydrology of prairie pothole wetlands during drought and deluge—A 17-year study of the Cottonwood Lake wetland complex in North Dakota in the perspective of longer term measured and proxy hydrological records: Climatic Change, v. 40, no. 2, p. 189–209. [Also available at https://doi.org/10.1023/A:1005448416571.]
Woodhouse, C.A., and Overpeck, J.T., 1998, 2000 years of drought variability in the central United States: Bulletin of the American Meteorological Society, v. 79, no. 12, p. 2693–2714. [Also available at https://doi.org/10.1175/1520-0477(1998)079<2693:YODVIT>2.0.CO;2.]
Yuan, Y., Zhu, X., Mushet, D.M., and Otte, M.L., 2019, Multi-element fingerprinting of waters to evaluate connectivity among depressional wetlands: Ecological Indicators, v. 97, p. 398–409. [Also available at https://doi.org/10.1016/j.ecolind.2018.10.033.]
Zeng, T., Arnold, W.A., and Toner, B.M., 2013, Microscale characterization of sulfur speciation in lake sediments: Environmental Science & Technology, v. 47, no. 3, p. 1287–1296. [Also available at https://doi.org/10.1021/es303914q.]
Zeng, T., Chin, Y.P., and Arnold, W.A., 2012, Potential for abiotic reduction of pesticides in prairie pothole porewaters: Environmental Science & Technology, v. 46, no. 6, p. 3177–3187. [Also available at https://doi.org/10.1021/es203584d.]
Zeng, T., Ziegelgruber, K.L., Chin, Y.P., and Arnold, W.A., 2011, Pesticide processing potential in prairie pothole porewaters: Environmental Science & Technology, v. 45, no. 16, p. 6814–6822. [Also available at https://doi.org/10.1021/es200812e.]
Zhu, X., Yuan, Y., Mushet, D.M., and Otte, M.L., 2019, Can multi-element fingerprinting of soils inform assessments of chemical connectivity between depressional wetlands?: Wetlands, v. 39, no. 5, p. 1015–1027. [Also available at https://doi.org/10.1007/s13157-019-01154-x.]
Ziegelgruber, K.L., Zeng, T., Arnold, W.A., and Chin, Y.P., 2013, Sources and composition of sediment pore‐water dissolved organic matter in prairie pothole lakes: Limnology and Oceanography, v. 58, no. 3, p. 1136–1146. [Also available at https://doi.org/10.4319/lo.2013.58.3.1136.]
Appendix 1. Cottonwood Lake Study Area Bibliography
Journal Articles
1980
Winter, T.C., and Carr, M.R., 1980, Hydrologic setting of wetlands in the Cottonwood Lake area, Stutsman County, North Dakota: U.S. Geological Survey Water Resources Investigations Report 80–99, 42 p. [Also available at https://doi.org/10.3133/wri8099.]
1984
Swanson, G.A., 1984, Dissemination of amphipods by waterfowl: The Journal of Wildlife Management, v. 48, no. 3, p. 988–991. [Also available at https://doi.org/10.2307/3801453.]
1986
Forester, R.M., 1986, Determination of the dissolved anion composition of ancient lakes from fossil ostracodes: Geology, v. 14, no. 9, p. 796–798. [Also available at https://doi.org/10.1130/0091-7613(1986)14<796:DOTDAC>2.0.CO;2.]
1987
Hanson, B.A., and Swanson, G.A., 1987, The aquatic coleoptera of Cottonwood Lake wetlands: Proceedings of the North Dakota Academy of Sciences, v. 41, p. 30. [Also available at http://ashipunov.info/journals/pndas/pndas_1987.pdf.]
LaBaugh, J.W., 1987, Use of ion rations as indicators of processes affecting chemical characteristics of selected wetlands in the Cottonwood Lake area, North Dakota, 1979–86: Proceedings of the North Dakota Academy of Science, v. 41, p. 28. [Also available at http://ashipunov.info/journals/pndas/pndas_1987.pdf.]
LaBaugh, J.W., Winter, T.C., Adomaitis, V.A., and Swanson, G.A., 1987, Hydrology and chemistry of selected prairie wetlands in the Cottonwood Lake area, Stutsman County, North Dakota, 1979–82: U.S. Geological Survey Professional Paper 1431, 26 p. [Also available at https://doi.org/10.3133/pp1431.]
Nelson, R.D., and Butler, M.G., 1987, Seasonal abundance of larval and adult chironomids (Diptera—Chironomidae) in four prairie wetlands: Proceedings of the North Dakota Academy of Science, v. 41, p. 31. [Also available at http://ashipunov.info/journals/pndas/pndas_1987.pdf.]
Rosenberry, D.O., 1987, Climatic characteristics of the Cottonwood Lake area, North Dakota: Proceedings of the North Dakota Academy of Sciences, v. 41, p. 26. [Also available at http://ashipunov.info/journals/pndas/pndas_1987.pdf.]
Swanson, G.A., 1987, An introduction to the Cottonwood Lake area: Proceedings of the North Dakota Academy of Science, v. 41, p. 25. [Also available at http://ashipunov.info/journals/pndas/pndas_1987.pdf.]
Swanson, G.A., 1987, Vegetation changes in wetlands of the Cottonwood Lake area: Proceedings of the North Dakota Academy of Science, v. 41, p. 29. [Also available at http://ashipunov.info/journals/pndas/pndas_1987.pdf.]
Winter, T.C., 1987, Hydrology of the Cottonwood Lake area, Stutsman County, North Dakota: Proceedings of the North Dakota Academy of Science, v. 41, p. 27. [Also available at http://ashipunov.info/journals/pndas/pndas_1987.pdf.]
1988
LaBaugh, J.W., 1988, Relation of hydrogeologic setting to chemical characteristics of selected lakes and wetlands within a climate gradient in the North-Central United States: Verhandlungen - Internationale Vereinigung für Theoretische und Angewandte Limnologie, v. 23, no. 1, p. 131–137. [Also available at https://doi.org/10.1080/03680770.1987.11897914.]
Poiani, K.A., and Johnson, W.C., 1988, Evaluation of the emergence method in estimating seed bank composition of prairie wetlands: Aquatic Botany, v. 32, no. 1-2, p. 91–97. [Also available at https://doi.org/10.1016/0304-3770(88)90090-3.]
Swanson, G.A., Winter, T.C., Adomaitis, V.A., and LaBaugh, J.W., 1988, Chemical characteristics of prairie lakes in south-central North Dakota—their potential for influencing use by fish and wildlife: U.S. Fish and Wildlife Service Technical Report 18, 44 p. [Also available at https://pubs.er.usgs.gov/publication/70196327.]
Winter, T.C., 1988, A conceptual framework for assessing cumulative impacts on the hydrology of nontidal wetlands: Environmental Management, v. 12, no. 5, p. 605–620. [Also available at https://doi.org/10.1007/BF01867539.]
1989
Hanson, B.A., and Swanson, G.A., 1989, Coleoptera species inhabiting prairie wetlands of the Cottonwood Lake area, Stutsman County, North Dakota: Prairie Naturalist, v. 21, no. 1, p. 49–57. [Also available at https://pubs.er.usgs.gov/publication/1001534.]
Kantrud, H.A., Krapu, G.L., and Swanson, G.A., 1989, Prairie Basin Wetlands of the Dakotas: a community profile: U.S. Fish and Wildlife Service Biological Report 85 (7.28), 111 p. [Also available at https://pubs.er.usgs.gov/publication/2000127.]
Poiani, K.A., and Johnson, W.C., 1989, Effect of hydroperiod on seed bank composition in semi-permanent prairie wetlands: Canadian Journal of Botany, v. 67, no. 3, p. 856–864. [Also available at https://doi.org/10.1139/b89-115.]
1990
Winter, T.C., and Woo, M.K., 1990, Hydrology of lakes and wetlands, in Wolman, M.G., and Riggs, H.C., eds., Surface water hydrology—The geology of North America v. O-1: Boulder, Colorado, Geological Society of America, p. 159–187. [Also available at https://doi.org/10.1130/DNAG-GNA-O1.159.]
1991
LaBaugh, J.W., 1991, Spatial and temporal variation in chemical characteristics of ground water adjacent to selected lakes and wetlands in the North-Central United States: Verhandlungen - Internationale Vereinigung für Theoretische und Angewandte Limnologie, v. 24, no. 3, p. 1588–1594. [Also available at https://doi.org/10.1080/03680770.1989.11899026.]
Poiani, K.A., and Johnson, W.C., 1991, Global warming and prairie wetlands—Potential consequences for waterfowl habitat: Bioscience, v. 41, no. 9, p. 611–618. [Also available at https://doi.org/10.2307/1311698.]
1992
Arndt, J.L., and Richardson, J.L., 1992, Carbonate and gypsum chemistry in saturated, neutral pH soil environments, p. 179–187 in Robarts, R.D., and Bothwell, M.L., eds., Aquatic Ecosystems in semi-arid regions—Implications for resource management, August 27–30, 1990, Saskatoon, Saskatchewan: The National Hydrology Research Institute, Symposium Series 7, 375 p.
LaBaugh, J.W., and Swanson, G.A., 1992, Changes in chemical characteristics of water in selected wetlands in the Cottonwood Lake area, North Dakota, U.S.A., 1967-1989. p. 149–162 in Robarts, R.D., and Bothwell, M.L., eds., Aquatic ecosystems in semi-arid regions—Implications for resource management, August 27–30, 1990, Saskatoon, Saskatchewan: The National Hydrology Research Institute, Symposium Series 7, 375 p.
Winter, T.C., 1992, A physiographic and climatic framework for hydrologic studies of wetlands, in Robarts, R.D., and Bothwell, M.L., eds., Aquatic ecosystems in semi-arid regions—Implications for resource management, August 27–30, 1990, Saskatoon, Saskatchewan: The National Hydrology Research Institute, Symposium Series 7, p. 127–148
1993
Arndt, J.L., and Richardson, J.L., 1993, Temporal variations in the salinity of shallow groundwater from the periphery of some North Dakota wetlands (USA): Journal of Hydrology, v. 141, no. 1-4, p. 75–105. [Also available at https://doi.org/10.1016/0022-1694(93)90045-B.]
Poiani, K.A., and Johnson, W.C., 1993, Potential effects of climate change in a semi-permanent prairie wetland: Climatic Change, v. 24, no. 3, p. 213–232. [Also available at https://doi.org/10.1007/BF01091830.]
Poiani, K.A., and Johnson, W.C., 1993, A spatial simulation model of hydrology and vegetation dynamics in semi-permanent prairie wetlands: Ecological Applications, v. 3, no. 2, p. 279–293. [Also available at https://doi.org/10.2307/1941831.]
Woo, M.-K., and Winter, T.C., 1993, The role of permafrost and seasonal frost in the hydrology of northern wetlands in North America: Journal of Hydrology, v. 141, no. 1-4, p. 5–31. [Also available at https://doi.org/10.1016/0022-1694(93)90043-9.]
1995
LaBaugh, J.W., 1995, Relation of algal biovolume to chlorophyll a in selected lakes and wetlands in the north-central United States: Canadian Journal of Fisheries and Aquatic Sciences, v. 52, no. 2, p. 416–424. [Also available at https://doi.org/10.1139/f95-043.]
Poiani, K.A., Johnson, W.C., and Kittel, T.G.F., 1995, Sensitivity of a prairie wetland to increased temperature and seasonal precipitation changes: Journal of the American Water Resources Association, v. 31, no. 2, p. 283–294. [Also available at https://doi.org/10.1111/j.1752-1688.1995.tb03380.x.]
Winter, T.C., and Rosenberry, D.O., 1995, The interaction of ground water with prairie pothole wetlands in the Cottonwood Lake area, east-central North Dakota, 1979–1990: Wetlands, v. 15, no. 3, p. 193–211. [Also available at https://doi.org/10.1007/BF03160700.]
1996
Euliss, N.H., Jr., and Mushet, D.M., 1996, Water-level fluctuation in wetlands as a function of landscape condition in the Prairie Pothole Region: Wetlands, v. 16, no. 4, p. 587–593. [Also available at https://doi.org/10.1007/BF03161350.]
LaBaugh, J.W., Winter, T.C., Swanson, G.A., Rosenberry, D.O., Nelson, R.D., and Euliss, N.H., Jr., 1996, Changes in atmospheric circulation patterns affect midcontinent wetlands sensitive to climate: Limnology and Oceanography, v. 41, no. 5, p. 864–870. [Also available at https://doi.org/10.4319/lo.1996.41.5.0864.]
Poiani, K.A., Johnson, W.C., Swanson, G.A., and Winter, T.C., 1996, Climate change and northern prairie wetlands—Simulations of long-term dynamics: Limnology and Oceanography, v. 41, no. 5, p. 871–881. [Also available at https://doi.org/10.4319/lo.1996.41.5.0871.]
Wetzel, P.R., and van derValk, A.G., 1996. Vesicular-arbuscular mycorrhizae in prairie pothole wetland vegetation in Iowa and North Dakota: Canadian Journal of Botany, v. 74, p. 883 – 890. [Also available at https://doi.org/10.1139/b96-110.]
1997
Covich, A.P., Fritz, S.C., Lamb, P.J., Marzolf, R.D., Matthews, W.J., Poiani, K.A., Prepas, E.E., Richman, M.B., and Winter, T.C., 1997, Potential effects of climate change on aquatic ecosystems of the Great Plains of North America: Hydrological Processes, v. 11, no. 8, p. 993–1021. [Also available at https://doi.org/10.1002/(SICI)1099-1085(19970630)11:8<993::AID-HYP515>3.0.CO;2-N.]
Mushet, D.M., Euliss, N.H., Jr., Hanson, B.A., and Zodrow, S.G., 1997, A funnel trap for sampling salamanders in wetlands: Herpetological Review, v. 28, p. 132–133. [Also available at https://pubs.er.usgs.gov/publication/1001817.]
Rosenberry, D.O., and Winter, T.C., 1997, Dynamics of water-table fluctuations in an upland between two prairie-pothole wetlands in North Dakota: Journal of Hydrology, v. 191, no. 1-4, p. 266–289. [Also available at https://doi.org/10.1016/S0022-1694(96)03050-8.]
1998
LaBaugh, J.W., Winter, T.C., and Rosenberry, D.O., 1998, Hydrologic functions of prairie wetlands: Great Plains Research, v. 8, p. 17–37. [Also available at https://pubs.er.usgs.gov/publication/70020883.]
Larson, D.L., Euliss, N.H., Jr., Lannoo, M.J., and Mushet, D.M., 1998, Amphibians of northern grasslands, in Mac, M.J., Opler, P.A., Puckett Haecker, C.E., and Doran, P.D., eds., Status and trends of the Nation’s biological resources v. 2: Reston, Virginia, U.S. Department of the Interior, U.S. Geological Survey, p. 450–451. [Also available at https://pubs.er.usgs.gov/publication/85387.]
Parkhurst, R.S., Winter, T.C., Rosenberry, D.O., and Sturrock, A.M., 1998, Evaporation from a small prairie wetland in the Cottonwood Lake Area, North Dakota—An energy-budget study: Wetlands, v. 18, no. 2, p. 272–287. [Also available at https://doi.org/10.1007/BF03161663.]
Winter, T.C., Harvey, J.W., Franke, O.L., and Alley, W.M., 1998, Groundwater and surface water—A single resource: U.S. Geological Survey Circular 1139, 79 p. [Also available at https://doi.org/10.3133/cir1139.]
Winter, T.C., and Rosenberry, D.O., 1998, Hydrology of prairie pothole wetlands during drought and deluge—A 17-year study of the Cottonwood Lake wetland complex in North Dakota in the perspective of longer term measured and proxy hydrologic records: Climatic Change, v. 40, no. 2, p. 189–209. [Also available at https://doi.org/10.1023/A:1005448416571.]
1999
Euliss, N.H., Jr., Wrubleski, D.A., and Mushet, D.M., 1999, Wetlands of the Prairie Pothole Region—Invertebrate species composition, ecology, and management, in Batzer, D.P., Rader, R.B., and Wissinger, S.A., eds., Invertebrates in freshwater wetlands of North America—Ecology and management: New York, John Wiley and Sons, Inc., p. 471–514. [Also available at https://pubs.er.usgs.gov/publication/85406.]
Freeland, J.A., Richardson, J.L., and Foss, L.A., 1999, Soil indicators of agricultural impacts on northern prairie wetlands—Cottonwood Lake Research Area, North Dakota, USA: Wetlands, v. 19, no. 1, p. 56–64. [Also available at https://doi.org/10.1007/BF03161733.]
Winter, T.C., 1999, Relation of streams, lakes, and wetlands to groundwater flow systems: Hydrogeology Journal, v. 7, no. 1, p. 28–45. [Also available at https://doi.org/10.1007/s100400050178.]
2000
LaBaugh, J.W., Winter, T.C., and Rosenberry, D.O., 2000, Comparison of the variability in fluxes of ground water and solutes in lakes and wetlands in central North America: Verhandlungen Internationale Vereinigung Limnologie, v. 27, p. 420–426. [Also available at https://doi.org/10.1080/03680770.1998.11901266.]
Winter, T.C., Mallory, S.E., Allen, T.R., and Rosenberry, D.O., 2000, The use of principal-component analysis for interpreting ground-water hydrographs: Ground Water, v. 38, no. 2, p. 234–246. [Also available at https://doi.org/10.1111/j.1745-6584.2000.tb00335.x.]
2001
Winter, T.C., 2001, The concept of hydrologic landscapes: Journal of the American Water Resources Association, v. 37, no. 2, p. 335–349. [Also available at https://doi.org/10.1111/j.1752-1688.2001.tb00973.x.]
Winter, T.C., Rosenberry, D.O., Buso, D.C., and Merk, D.A., 2001, Water source to four U.S. wetlands—Implications for wetland management: Wetlands, v. 21, no. 4, p. 462–473. https://doi.org/10.1672/0277-5212(2001)021[0462:WSTFUS]2.0.CO;2.
2002
Hanson, B.A., Euliss, N.H., Jr., and Mushet, D.M., 2002, First records for loosely coiled valve snail in North Dakota: Prairie Naturalist, v. 34, p. 61–63. [Also available at https://digitalcommons.unl.edu/usgsnpwrc/152.]
Mushet, D.M., Euliss, N.H., Jr., and Shaffer, T.L., 2002, Floristic quality assessment of one natural and three restored wetland complexes in North Dakota, USA: Wetlands, v. 22, no. 1, p. 126–138. [Also available at https://doi.org/10.1672/0277-5212(2002)022[0126:FQAOON]2.0.CO;2.]
2003
LaBaugh, J.W., and Swanson, G.A., 2003, Spatial and temporal variability in specific conductance and chemical characteristics of wetland water and in water column biota in the wetlands in the Cottonwood Lake Area, in Winter, T.C., ed., Hydrological, chemical, and biological characteristics of a prairie pothole wetland complex under highly variable climate conditions—The Cottonwood Lake area, east-central North Dakota—Denver, Colorado: U.S. Geological Survey Professional Paper 1675, p. 35–54. [Also available at https://doi.org/10.3133/pp1675.]
Poiani, K.A., and Johnson, W.C., 2003, Simulation of hydrology and vegetation dynamics of prairie wetlands in the Cottonwood Lake Area, in Winter, T.C., ed., Hydrological, chemical, and biological characteristics of a prairie pothole wetland complex under highly variable climate conditions – the Cottonwood Lake area, east-central North Dakota—Denver, Colorado: U.S. Geological Survey Professional Paper 1675, p. 95–109. [Also available at https://doi.org/10.3133/pp1675.]
Rosenberry, D.O., 2003, Climate of the Cottonwood Lake Area, in Winter, T.C., ed., Hydrological, chemical, and biological characteristics of a prairie pothole wetland complex under highly variable climate conditions – the Cottonwood Lake area, east-central North Dakota—Denver, Colorado: U.S. Geological Survey Professional Paper 1675, p. 25–34. [Also available at https://doi.org/10.3133/pp1675.]
Swanson, G.A., Euliss, N.H., Jr., Hanson, B.A., and Mushet, D.M., 2003, Dynamics of a prairie pothole wetland complex—Implications for wetland management, in Winter, T.C., ed., Hydrological, chemical, and biological characteristics of a prairie pothole wetland complex under highly variable climate conditions – the Cottonwood Lake area, east-central North Dakota—Denver, Colorado: U.S. Geological Survey Professional Paper 1675, p. 55–94. [Also available at https://doi.org/10.3133/pp1675.]
Winter, T.C., 2003, Geohydrologic setting of the Cottonwood Lake Area, in Winter, T.C., ed., Hydrological, chemical, and biological characteristics of a prairie pothole wetland complex under highly variable climate conditions – the Cottonwood Lake area, east-central North Dakota—Denver, Colorado: U.S. Geological Survey Professional Paper 1675, p. 1–24. [Also available at https://doi.org/10.3133/pp1675.]
Winter, T.C., ed., 2003, v. 1675. Hydrological, chemical, and biological characteristics of a prairie pothole wetland complex under highly variable climate conditions - The Cottonwood Lake area, east-central North Dakota, U.S. Geological Survey Professional Paper, 109 p. [Also available at https://doi.org/10.3133/pp1675.]
Winter, T.C., and LaBaugh, J.W., 2003, Hydrologic considerations in defining isolated wetlands: Wetlands, v. 23, no. 3, p. 532–540. [Also available at https://doi.org/10.1672/0277-5212(2003)023[0532:HCIDIW]2.0.CO;2.]
Winter, T.C., Rosenberry, D.O., and LaBaugh, J.W., 2003, Where does the ground water in small watersheds come from?: Ground Water, v. 41, no. 7, p. 989–1000. [Also available at https://doi.org/10.1111/j.1745-6584.2003.tb02440.x.]
2004
Euliss, N.H., Jr., LaBaugh, J.W., Fredrickson, L.H., Mushet, D.M., Laubhan, M.K., Swanson, G.A., Winter, T.C., Rosenberry, D.O., and Nelson, R.D., 2004, The wetland continuum—A conceptual framework for interpreting biological studies: Wetlands, v. 24, no. 2, p. 448–458. [Also available at https://doi.org/10.1672/0277-5212(2004)024[0448:TWCACF]2.0.CO;2.]
Hanson, B.A., Euliss, N.H., Jr., and Mushet, D.M., 2004, First record of Graphoderus liberus (Coleoptera—Dytiscidae) in North Dakota: Prairie Naturalist, v. 36, p. 67–69. [Also available at https://digitalcommons.unl.edu/usgsnpwrc/162.]
Mushet, D.M., Euliss, N.H., Jr., Lane, S.P., and Goldade, C.M., 2004, The flora of the Cottonwood Lake study area, Stutsman County, North Dakota: Prairie Naturalist, v. 36, p. 43–62. [Also available at https://pubs.er.usgs.gov/publication/1001748.]
Rosenberry, D.O., Stannard, D.I., Winter, T.C., and Martinez, M.L., 2004, Comparison of 13 equations for determining evapotranspiration from a prairie wetland, Cottonwood Lake area, North Dakota, USA: Wetlands, v. 24, no. 3, p. 483–497. [Also available at https://doi.org/10.1672/0277-5212(2004)024[0483:COEFDE]2.0.CO;2.]
Stannard, D.I., Rosenberry, D.O., Winter, T.C., and Parkhurst, R.S., 2004, Estimates of fetch-induced errors in Bowen-Ratio energy-budget measurements of evapotranspiration from a prairie wetland, Cottonwood Lake area, North Dakota, USA: Wetlands, v. 24, no. 3, p. 498–513. [Also available at https://doi.org/10.1672/0277-5212(2004)024[0498:EOFEIB]2.0.CO;2.]
2005
Winter, T.C., Rosenberry, D.O., Kelly, E., and LaBaugh, J.W., 2005, Comparison of wetlands in different hydrogeological settings under conditions of extreme climate variability, in Heathwaite, L., Webb, B., Rosenberry, D., Weaver, D., and Hayashi, M., eds., Dynamics and biogeochemistry of river corridors and wetlands: International Association of Hydrological Sciences IAHS Publication 294, p. 139–147. [Also available at https://pubs.er.usgs.gov/publication/70029478.]
2007
Hanson, B.A., Mushet, D.M., Euliss, N.H., Jr., and Cordes, S.W., III, 2007, First record of Corisella inscripta (Uhler) (Heteroptera—Corixidae) from North Dakota: Prairie Naturalist, v. 39, p. 107–110. [Also available at https://digitalcommons.unl.edu/usgsnpwrc/263.]
2011
Euliss, N.H., Jr., and Mushet, D.M., 2011, A multi-year comparison of IPCI scores for prairie pothole wetlands—Implications of temporal and spatial variation: Wetlands, v. 31, no. 4, p. 713–723. [Also available at https://doi.org/10.1007/s13157-011-0187-2.]
Mills, C.T., Goldhaber, M.B., Stricker, C.A., Holloway, J.M., Morrison, J.M., Ellefsen, K.J., Rosenberry, D.O., and Thurston, R.S., 2011, Using stable isotopes to understand hydrochemical processes in and around a prairie pothole wetland in the Northern Great Plains, USA: Applied Geochemistry, v. 26, p. S97–S100. [Also available at https://doi.org/10.1016/j.apgeochem.2011.03.040.]
Mushet, D.M., Euliss, N.H., Jr., and Stockwell, C.A., 2011, A conceptual model to facilitate amphibian conservation in the northern Great Plains: Great Plains Research, v. 22, p. 45–58. [Also available at https://digitalcommons.unl.edu/greatplainsresearch/1217/.]
Rover, J., Wright, C.K., Euliss, N.H., Jr., Mushet, D.M., and Wylie, B.K., 2011, Classifying the hydrologic function of prairie potholes with remote sensing and GIS: Wetlands, v. 31, no. 2, p. 319–327. [Also available at https://doi.org/10.1007/s13157-011-0146-y.]
Zeng, T., Ziegelgruber, K.L., Chin, Y.P., and Arnold, W.A., 2011, Pesticide processing potential in prairie pothole porewaters: Environmental Science & Technology, v. 45, no. 16, p. 6814–6822. [Also available at https://doi.org/10.1021/es200812e.]
2012
Mushet, D.M., Euliss, N.H., Jr., and Stockwell, C.A., 2012, Mapping anuran habitat suitability to estimate effects of grassland and wetland conservation programs: Copeia, v. 2012, no. 2, p. 321–331. [Also available at https://doi.org/10.1643/CH-11-119.]
Zeng, T., Chin, Y.P., and Arnold, W.A., 2012, Potential for abiotic reduction of pesticides in prairie pothole porewaters: Environmental Science & Technology, v. 46, no. 6, p. 3177–3187. [Also available at https://doi.org/10.1021/es203584d.]
2013
Mushet, D.M., Euliss, N.H., Jr., and Stockwell, C.A., 2013, Complex spatial dynamics maintain northern leopard frog genetic diversity in a temporally varying landscape: Herpetological Conservation and Biology, v. 8, p. 163–175. [Also available at http://herpconbio.org/Volume_8/Issue_1/Mushet_etal_2013.pdf.]
Zeng, T., and Arnold, W.A., 2013, Pesticide photolysis in prairie potholes—Probing photosensitized processes: Environmental Science & Technology, v. 47, no. 13, p. 6735–6745. [Also available at https://doi.org/10.1021/es3030808.]
Zeng, T., Arnold, W.A., and Toner, B.M., 2013, Microscale characterization of sulfur speciation in lake sediments: Environmental Science & Technology, v. 47, no. 3, p. 1287–1296. [Also available at https://doi.org/10.1021/es303914q.]
Ziegelgruber, K.L., Zeng, T., Arnold, W.A., and Chin, Y.P., 2013, Sources and composition of sediment pore‐water dissolved organic matter in prairie pothole lakes: Limnology and Oceanography, v. 58, no. 3, p. 1136–1146. [Also available at https://doi.org/10.4319/lo.2013.58.3.1136.]
2014
Euliss, N.H., Jr., Mushet, D.M., Newton, W.E., Otto, C.R.V., Nelson, R.D., LaBaugh, J.W., Scherff, E.J., and Rosenberry, D.O., 2014, Placing prairie pothole wetlands along spatial and temporal continua to improve integration of wetland function in ecological investigations: Journal of Hydrology, v. 513, p. 490–503. [Also available at https://doi.org/10.1016/j.jhydrol.2014.04.006.]
Fisher, J.D.L., Mushet, D.M., and Stockwell, C.A., 2014, Potential for parasite-induced biases in aquatic invertebrate population studies: Hydrobiologia, v. 722, no. 1, p. 199–204. [Also available at https://doi.org/10.1007/s10750-013-1700-9.]
Goldhaber, M.B., Mills, C.T., Morrison, J.M., Stricker, C.A., Mushet, D.M., and LaBaugh, J.W., 2014, Hydrogeochemistry of Prairie Pothole Region wetlands—Role of long-term critical zone processes: Chemical Geology, v. 387, p. 170–183. [Also available at https://doi.org/10.1016/j.chemgeo.2014.08.023.]
Sleighter, R.L., Chin, Y.P., Arnold, W.A., Hatcher, P.G., McCabe, A.J., McAdams, B.C., and Wallace, G.C., 2014, Evidence of incorporation of abiotic S and N into prairie wetland dissolved organic matter: Environmental Science & Technology Letters, v. 1, no. 9, p. 345–350. [Also available at https://doi.org/10.1021/ez500229b.]
2015
Mushet, D.M., Calhoun, A.J.K., Alexander, L.C., Cohen, M.J., DeKeyser, E.S., Fowler, L., Lane, C.R., Lang, M.W., Rains, M.C., and Walls, S.C., 2015, Geographically isolated wetlands—Rethinking a misnomer: Wetlands, v. 35, no. 3, p. 423–431. [Also available at https://doi.org/10.1007/s13157-015-0631-9.]
Mushet, D.M., Goldhaber, M.B., Mills, C.T., McLean, K.I., Aparicio, V.M., McCleskey, R.B., Holloway, J.A.M., and Stockwell, C.A., 2015, Chemical and biotic characteristics of prairie lakes in south-central North Dakota—Effects of a changing climate: U.S. Geological Survey Scientific Investigations Report 2015–5126, 55 p. [Also available at https://doi.org/10.3133/sir20155126.]
2016
Adams, R.M., McAdams, B.C., Arnold, W.A., and Chin, Y.P., 2016, Transformation of chlorpyrifos and chlorpyrifos-methyl in prairie pothole pore waters: Environmental Science. Processes & Impacts, v. 18, no. 11, p. 1406–1416. [Also available at https://doi.org/10.1039/C6EM00404K.]
Bansal, S., Tangen, B., and Finocchiaro, R., 2016, Temperature and hydrology affect methane emissions from prairie pothole wetlands: Wetlands, v. 36, no. S2, suppl. 2, p. 371–381. [Also available at https://doi.org/10.1007/s13157-016-0826-8.]
Calhoun, A.J.K., Mushet, D.M., Bell, K.P., Boix, D., Fitzsimons, J.A., and Isselin-Nondedeu, F., 2016, Temporary wetlands—Challenges and solutions to conserving a ‘disappearing’ ecosystem: Biological Conservation, v. 211, p. 88–95. [Also available at https://doi.org/10.1016/j.biocon.2016.11.024.]
Cohen, M.J., Creed, I.F., Alexander, L., Basu, N., Calhoun, A., Craft, C., D’Amico, E., DeKeyser, E.S., Fowler, L., Golden, H.E., Jawitz, J.W., Kalla, P., Kirkman, L.K., Lane, C.R., Lang, M., Leibowitz, S.G., Lewis, D.B., Marton, J., McLaughlin, D.L., Mushet, D.M., Raanan-Kiperwas, H., Rains, M.C., Smith, L., and Walls, S., 2016, Do geographically isolated wetlands influence landscape functions?: Proceedings of the National Academy of Sciences of the United States of America, v. 113, no. 8, p. 1978–1986. [Also available at https://doi.org/10.1073/pnas.1512650113.]
Goldhaber, M.B., Mills, C.T., Mushet, D.M., McClesky, B.B., and Rover, J., 2016, Controls on the geochemical evolution of Prairie Pothole Region wetlands over decadal time scales: Wetlands, v. 36, S2, p. S255–S272. [Also available at https://doi.org/10.1007/s13157-016-0854-4.]
Hayashi, M., van der Kamp, G., and Rosenberry, D.O., 2016, Hydrology of prairie wetlands—Understanding the integrated surface-water and groundwater processes: Wetlands, v. 36, S2, p. 237–254. [Also available at https://doi.org/10.1007/s13157-016-0797-9.]
Karpuzcu, M.E., McCabe, A.J., and Arnold, W.A., 2016, Phototransformation of pesticides in prairie potholes—Effect of dissolved organic matter in triplet-induced oxidation: Environmental Science. Processes & Impacts, v. 18, no. 2, p. 237–245. [Also available at https://doi.org/10.1039/C5EM00374A.]
LaBaugh, J., Mushet, D.M., Rosenberry, D., Euliss, N.H., Jr., Goldhaber, M., Mills, C., and Nelson, R., 2016, Changes in pond water levels and surface extent due to climate variability alter solute sources to closed-basin prairie wetland ponds, 1979–2012: Wetlands, v. 36, S2, p. 343–355. [Also available at https://doi.org/10.1007/s13157-016-0808-x.]
Leibowitz, S., Mushet, D.M., and Newton, W.E., 2016, Intermittent surface water connectivity—Fill and spill vs. fill and merge dynamics: Wetlands, v. 36, S2, p. 323–342. [Also available at https://doi.org/10.1007/s13157-016-0830-z.]
McCabe, A.J., and Arnold, W.A., 2016, Seasonal and spatial variabilities in the water chemistry of prairie pothole wetlands influence the photoproduction of reactive intermediates: Chemosphere, v. 155, p. 640–647. [Also available at https://doi.org/10.1016/j.chemosphere.2016.04.078.]
McLean, K.I., Mushet, D.M., and Stockwell, C.A., 2016, From “duck factory” to “fish factory”—Climate induced changes in vertebrate communities of prairie pothole wetlands and small lakes: Wetlands, v. 36, S2, p. 407–421. [Also available at https://doi.org/10.1007/s13157-016-0766-3.]
McLean, K.I., Mushet, D.M., Renton, D., and Stockwell, C.A., 2016, Aquatic macro-invertebrate communities of prairie-pothole wetlands and lakes wetlands under a changed climate: Wetlands, v. 36, S2, p. 423–435. [Also available at https://doi.org/10.1007/s13157-016-0848-2.]
Mushet, D.M., 2016, Midcontinent prairie-pothole wetlands and climate change—An introduction to the supplemental issue: Wetlands, v. 36, p. S223–S228. [Also available at https://doi.org/10.1007/s13157-016-0852-6.]
van der Valk, A., and Mushet, D.M., 2016, Interannual water-level fluctuations and the vegetation of prairie potholes—Potential impacts of climate change: Wetlands, v. 36, S2, p. 397–406. [Also available at https://doi.org/10.1007/s13157-016-0850-8.]
2017
Calhoun, A.J.K., Mushet, D.M., Alexander, M.J., DeKeyser, E.S., Fowler, L., Lane, C.R., Lang, M.W., Rains, M.C., Richter, S.C., and Walls, S.C., 2017, The significant surface-water connectivity of “geographically isolated wetlands”: Wetlands, v. 37, no. 4, p. 801–806. [Also available at https://doi.org/10.1007/s13157-017-0887-3.]
Dalcin Martins, P., Hoyt, D.W., Bansal, S., Mills, C.T., Tfaily, M., Tangen, B.A., Finocchiaro, R.G., Johnston, M.D., McAdams, B.C., Solensky, M.J., Smith, G.J., Chin, Y.-P., and Wilkins, M.J., 2017, Abundant carbon substrates drive extremely high sulfate reduction rates and methane fluxes in prairie pothole wetlands: Global Change Biology, v. 23, no. 8, p. 3107–3120. [Also available at https://doi.org/10.1111/gcb.13633.]
McKenna, O.P., Mushet, D.M., Rosenberry, D.O., and LaBaugh, J.W., 2017, Evidence for a climate-induced ecohydrological state shift in wetland ecosystems of the southern Prairie Pothole Region: Climatic Change, v. 145, no. 3-4, p. 273–287. [Also available at https://doi.org/10.1007/s10584-017-2097-7.]
Wallace, G.C., Sander, M., Chin, Y.P., and Arnold, W.A., 2017, Quantifying the electron donating capacities of sulfide and dissolved organic matter in sediment pore waters of wetlands: Environmental Science. Processes & Impacts, v. 19, no. 5, p. 758–767. [Also available at https://doi.org/10.1039/C7EM00060J.]
Williams, A.S., Kiniry, J.R., Mushet, D.M., Smith, L.M., McMurry, S., Attebury, K., Lang, M., McCarty, G.W., Shaffer, J.A., Effland, W.R., and Johnson, M.-V., 2017, Model parameters for representative wetland plant functional groups: Ecosphere, v. 8, no. 10, p. e01958. [Also available at https://doi.org/10.1002/ecs2.1958.]
2018
Bansal, S., Tangen, B., and Finocchiaro, R., 2018, Diurnal patterns of methane flux from a seasonal wetland—Mechanisms and methodology: Wetlands, v. 38, no. 5, p. 933–943. [Also available at https://doi.org/10.1007/s13157-018-1042-5.]
Brooks, J.R., Mushet, D.M., Vanderhoof, M.K., Leibowitz, S.G., Christensen, J.R., Neff, B.P., Rosenberry, D.O., Rugh, W.D., and Alexander, L.C., 2018, Estimating wetland connectivity to streams in the Prairie Pothole Region—An isotopic and remote sensing approach: Water Resources Research, v. 54, no. 2, p. 955–977. [Also available at https://doi.org/10.1002/2017WR021016.]
LaBaugh, J.W., Rosenberry, D.O., Mushet, D.M., Neff, B., Nelson, R.D., and Euliss, N.H., Jr., 2018, Long-term changes in pond permanence, size, and salinity in Prairie Pothole Region wetlands—The role of groundwater-pond interaction: Journal of Hydrology. Regional Studies, v. 17, p. 1–23. [Also available at https://doi.org/10.1016/j.ejrh.2018.03.003.]
Levy, Z.F., Mills, C.T., Lu, Z., Goldhaber, M.B., Rosenberry, D.O., Mushet, D.M., Lautz, L.K., Zhou, X., and Siegel, D.I., 2018, Using halogens (Cl, Br, I) to understand the hydrogeochemical evolution of drought-derived saline porewater beneath a prairie wetland: Chemical Geology, v. 476, p. 191–207. [Also available at https://doi.org/10.1016/j.chemgeo.2017.11.017.]
Levy, Z.F., Rosenberry, D.O., Moucha, R., Mushet, D.M., Goldhaber, M.B., LaBaugh, J.W., Fiorentino, A.J., and Siegel, D.I., 2018, Drought-induced recharge promotes long-term storage of porewater salinity beneath a prairie wetland: Journal of Hydrology, v. 557, p. 391–406. [Also available at https://doi.org/10.1016/j.jhydrol.2017.12.005.]
McKenna, O.P., Mushet, D.M., Scherff, E.J., McLean, K.I., and Mills, C.T., 2018, The pothole hydrology linked systems simulator (PHyLiSS)—Development and application of a systems model for prairie-pothole wetlands: U.S. Geological Survey Open-File Report 2018–1165, 21 p. [Also available at https://doi.org/10.3133/ofr20181165.]
Mushet, D.M., Alexander, L.C., Bennett, M., Schofield, K., Christensen, J.R., Ali, G., Pollard, A., Fritz, K., and Lang, M.W., 2019 Differing modes of biotic connectivity within freshwater ecosystem mosaics: Journal of the American Water Resources Association, v. 55, no. 2, p. 307–317. [Also available at https://doi.org/10.1111/1752-1688.12683.]
Mushet, D.M., McKenna, O.P., LaBaugh, J.W., Euliss, N.H., Jr., and Rosenberry, D.O., 2018, Accommodating state shifts within the conceptual framework of the wetland continuum: Wetlands, v. 38, no. 3, p. 647–651. [Also available at https://doi.org/10.1007/s13157-018-1004-y.]
Neff, B.P., and Rosenberry, D.O., 2018, Groundwater connectivity of upland-embedded wetlands in the Prairie Pothole Region: Wetlands, v. 38, no. 1, p. 51–63. [Also available at https://doi.org/10.1007/s13157-017-0956-7.]
2019
McKenna, O.W., Kucia, S.R., Mushet, D.M., Anteau, M.J., and Wiltermuth, M.T., 2019, Synergistic interaction of climate and land-use drivers alter the function of North American, prairie-pothole wetlands: Sustainability (Basel), v. 11, no. 23, p. 6581. [Also available at https://doi.org/10.3390/su11236581.]
Mushet, D.M., McKenna, O.P., and McLean, K.I., 2020, Alternative stable states in inherently unstable systems: Ecology and Evolution, v. 10, no. 2, p. 843–850. [Also available at https://doi.org/10.1002/ece3.5944.
Mushet, D.M., Solensky, M.J., and Erickson, S.F., 2019, Temporal gamma-diversity meets spatial alpha-diversity in dynamically varying ecosystems: Biodiversity and Conservation, v. 28, no. 7, p. 1783–1797. [Also available at https://doi.org/10.1007/s10531-019-01756-1.]
Neff, B., Rosenberry, D.O., Leibowitz, S.G., Mushet, D.M., Golden, H.E., Rains, M.C., Brooks, J.R., and Lane, C.R., 2019, A hydrologic landscapes perspective on groundwater connectivity of depressional wetlands: Water (Basel), v. 12, no. 1, p. 50. [Also available at https://doi.org/10.3390/w12010050.]
Smith, L.L., Subalusky, A.L., Atkinson, C.L., Earl, J.E., Mushet, D.M., Scott, D.E., Lance, S., and Johnson, S.A., 2019 Biological connectivity of seasonally ponded wetlands across spatial and temporal scales: Journal of the American Water Resources Association, v. 55, no. 2, p. 334–353. [Also available at https://doi.org/10.1111/1752-1688.12682.]
Tangen, B.A., and Bansal, S., 2019, Hydrologic lag effects on wetland greenhouse gas fluxes: Atmosphere, v. 10, no. 5, p. 269. [Also available at https://doi.org/10.3390/atmos10050269.]
Yuan, Y., Zhu, X., Mushet, D.M., and Otte, M.L., 2019, Multi-element fingerprinting of waters to evaluate connectivity among depressional wetlands: Ecological Indicators, v. 97, p. 398–409. [Also available at https://doi.org/10.1016/j.ecolind.2018.10.033.]
Zhu, X., Yuan, Y., Mushet, D.M., and Otte, M.L., 2019, Can multi-element fingerprinting of soils inform assessments of chemical connectivity between depressional wetlands?: Wetlands, v. 39, no. 5, p. 1015–1027. [Also available at https://doi.org/10.1007/s13157-019-01154-x.]
2020
McLean, K.I., Mushet, D.M., Sweetman, J., Anteau, M.J., and Wiltermuth, M.T., 2020, Invertebrate communities of prairie-pothole wetlands in the age of the aquatic homogenocene: Hydrobiologia, v. 847, no. 18, p. 3773–3793. [Also available at https://doi.org/10.1007/s10750-019-04154-4.]
Stenert, C., Pires, M., Epele, L., Grech, M., Maltchik, L., McLean, K., Mushet, D., and Batzer, D., 2020, Climate- versus geographic-dependent patterns in the spatial distribution of macroinvertebrate assemblages in New World depressional wetlands: Global Change Biology, v. 26, no. 12, p. 6895–6903. [Also available at https://doi.org/10.1111/gcb.15367.]
Tangen, B.A., and Bansal, S., 2020, Soil organic carbon stocks and sequestration rates of inland, freshwater wetlands—Sources of variability and uncertainty: Science of the Total Environment, v. 749, p. 141444. [Also available at https://doi.org/10.1016/j.scitotenv.2020.141444.]
Williams, A.S., Mushet, D.M., Lang, M., McCarty, G.W., Shaffer, J.A., Kahara, N., Johnson, M.-V., and Kiniry, J.R., 2020, Improving the ability to include freshwater wetland plants in process-based models: Journal of Soil and Water Conservation, v. 75, no. 6, p. 704–712. [Also available at https://doi.org/10.2489/jswc.2020.00089.]
2021
Kraus, J.M., Kuivila, K.M., Hladik, M.L., Shook, N., Mushet, D.M., Dowdy, K., and Harrington, R., 2021, Cross-ecosystem fluxes of pesticides from prairie-pothole wetlands mediated by aquatic insect emergence—Implications for terrestrial insectivores: Environmental Toxicology and Chemistry, v. 40, no. 8, p. 2282–2296. [Also available at https://doi.org/10.1002/etc.5111.]
McKenna, O.P., Mushet, D.M., Kucia, S.R., and McCulloch-Huseby, E.C., 2021, Limited shifts in the distribution of migratory bird breeding habitat density in response to future changes in climate: Ecological Applications, v. 31, no. 7, p. e02428. [Also available at https://doi.org/10.1002/eap.2428.]
McKenna, O.P., Renton, D.A., Mushet, D.M., and DeKeyser, E.S., 2021, Upland burning and grazing as strategies to offset climate-change effects on wetlands: Wetlands Ecology and Management, v. 29, no. 2, p. 193–208. [Also available at https://doi.org/10.1007/s11273-020-09778-1.]
McLean, K.I., Mushet, D.M., Newton, W.E., and Sweetman, J., 2021, Long-term multidecadal data from a prairie-pothole wetland complex reveal controls on aquatic-macroinvertebrate communities: Ecological Indicators, v. 126, p. 107678. [Also available at https://doi.org/10.1016/j.ecolind.2021.107678.]
Yuan, Y., Zhu, X., Mushet, D.M., Solensky, M., and Otte, M.L., 2021, Chemical connectivity and multi-element composition of groundwater in depressional wetlands: Wetlands, v. 41, no. 6, 16 p. [Also available at https://doi.org/10.1007/s13157-021-01469-8.]
2022
Epele, L.B., Grech, M.G., Williams-Subiza, E.A., Stenert, C., McLean, K., Greig, H.S., Maltchik, L., Pires, M.M., Bird, M.S., Boissezon, A., Boix, D., Demierre, E., García, P.E., Gascón, S., Jeffries, M., Kneitel, J.M., Loskutova, O., Manzo, L.M., Mataloni, G., Mlambo, M.C., Oertli, B., Sala, J., Scheibler, E.E., Wu, H., Wissinger, S.A., and Batzer, D.P., 2022, Perils of life on the edge—Climatic threats to global diversity patterns of wetland macroinvertebrates: Science of the Total Environment, v. 820, 10 p. [Also available at https://doi.org/10.1016/j.scitotenv.2022.153052.]
McLean, K., Mushet, D., and Sweetman, J., 2022, Climate and land use driven ecosystem homogenization in the Prairie Pothole Region: Water, v. 14, no. 19, 20 p. [Also available at https://doi.org/10.3390/w14193106.]
McLean, K.I., Mushet, D.M., and Sweetman, J., 2022, Temporal coherence patterns of prairie-pothole wetlands indicate the importance of landscape linkages and wetland heterogeneity in maintaining biodiversity: Frontiers in Ecology and Evolution. [Also available at https://www.frontiersin.org/articles/10.3389/fevo.2022.897872/full.]
Hu, K., Mushet, D.M., and Sweetland, J.N., 2022, Multi-proxy paleolimnological records provide evidence for a shift to a new ecosystem state in the Northern Great Plains, USA: Limnology and Oceanography, 17 p. [Also available at https://aslopubs.onlinelibrary.wiley.com/doi/epdf/10.1002/lno.12218.]
Waraniak, J.M., Mushet, D.M., and Stockwell, C.A., 2022, Over the hills and through the farms—Land use and topography influences genetic connectivity of northern leopard frog (Rana pipiens) in the Prairie Pothole Region: Landscape Ecology, 17 p. [Also available at https://link.springer.com/article/10.1007/s10980-022-01515-8.]
Theses and Dissertations
2010
Mushet, D.M., 2010, From Earth observing space satellites to nuclear microsatellites—amphibian conservation in the northern Great Plains: Fargo, North Dakota, North Dakota State University, Ph.D. Dissertation, 134 p. [Also available at https://search.proquest.com/openview/7664caf41907204eac78a5fdcd1e00f2/1?pq-origsite=gscholar&cbl=18750&diss=y.]
2012
Zeng, T., 2012, Abiotic transformations of pesticides in prairie potholes: Minneapolis, Minnesota, University of Minnesota, Ph.D. Dissertation, 373 p. [Also available at https://conservancy.umn.edu/handle/11299/159506.]
2015
McLean, K.I., 2015, The “fathead minnow factory” exploring how a changing climate has influenced fish and salamander communities in the Prairie Pothole Region: Fargo, North Dakota, North Dakota State University, Master’s Thesis, 85 p. [Also available at https://library.ndsu.edu/ir/handle/10365/27826.]
2016
Renton, D., 2016, Managing upland vegetation as a mitigation strategy for climate-change effects on prairie-pothole wetlands: Fargo, North Dakota, North Dakota State University, Master’s Thesis, 90 p. [Also available at https://library.ndsu.edu/ir/handle/10365/28071.]
2017
Levy, Z.F., 2017, Climatic controls on the porewater chemistry of mid-continental wetlands: Syracuse, New York, Syracuse University, Ph.D. Dissertation, 162 p. [Also available at https://surface.syr.edu/etd/731.]
McCabe, A., 2017, Photochemical production of reactive intermediates in inland surface waters: Minneapolis, Minnesota, University of Minnesota, Ph.D. Dissertation, 321 p. [Also available at http://hdl.handle.net/11299/198378.]
2020
McLean, K.I., 2020, Aquatic macroinvertebrate response to shifts in hydroclimatic variability and ecohydrological conditions in prairie-pothole wetlands—Implications for biodiversity conservation: Fargo, North Dakota, North Dakota State University, Ph.D. Dissertation, 198 p. [Also available at https://search.proquest.com/openview/f2fd7123b26e6973c01dc0cf0ba16bd8/1.pdf?pq-origsite=gscholar&cbl=2026366&diss=y.]
Appendix 2. Data Reports and Data Releases
Published Data Reports
Sturrock, A.M., Hanson, B.A., Scarborough, J.L., and Winter, T.C., 1986, Climatic data for the Cottonwood Lake area, Stutsman County, North Dakota, 1982: U.S. Geological Survey Open-File Report 86–477, 24 p. [Also available at https://doi.org/10.3133/ofr86477.]
Sturrock, A.M., Hanson, B.A., Scarborough, J.L., and Winter, T.C., 1987, Climatic data for the Cottonwood Lake area, Stutsman County, North Dakota, 1983: U.S. Geological Survey Open-File Report 87–216, 28 p. [Also available at https://doi.org/10.3133/ofr87216.]
LaBaugh, J.W., and Swanson, G.A., 1988, Algae and invertebrates in the water column of selected prairie wetlands in the Cottonwood Lake area, Stutsman County, North Dakota, 1984: U.S. Geological Survey Open-File Report 88–451, 96 p. [Also available at https://doi.org/10.3133/ofr88451.]
Published Data Releases
Mushet, D.M., and Erickson, S.F., 2017, Cottonwood Lake study area—Wetland identifier points: U.S. Geological Survey data release, https://doi.org/10.5066/F7D798N0.
Mushet, D.M., Euliss, N.H., Jr., Hanson, B.A., Neau, J.L., Bryant, R.B., and Erickson, S.F., 2017, Cottonwood Lake study area—Wetland vegetation zones: U.S. Geological Survey data release, https://doi.org/10.5066/F7J101DQ.
Mushet, D.M., and LaBaugh, J.W., 2017, Cottonwood Lake study area—Water Chemistry—Wells—In situ measurements: U.S. Geological Survey data release, https://doi.org/10.5066/F7N58JJ2.
Mushet, D.M., LaBaugh, J.W., Nelson, R.D., and Euliss, N.H., Jr., 2017, Cottonwood Lake study area—Water Chemistry—Wetlands, U.S Geological Survey data release, https://doi.org/10.5066/F7DN437S.
Mushet, D.M., LaBaugh, J.W., and Winter, T.C., 2017, Cottonwood Lake study area—Water chemistry—Wells: U.S. Geological Survey data release, https://doi.org/10.5066/F78W3BH2.
Mushet, D.M., Roth, C.L., and Scherff, E.J., 2017, Cottonwood Lake study area—Digital elevation model with topobathy: U.S. Geological Survey data release, https://doi.org/10.5066/F7V69GTD.
Neff, B.P., 2017, Hydraulic conductivity data for piezometers near Cottonwood Lake study area, North Dakota (1978–2017): U.S. Geological Survey data release, https://doi.org/10.5066/F75X27TW.
U.S. Geological Survey, 2017, Cottonwood Lake study area—Aerial imagery: U.S. Geological Survey data release, https://doi.org/10.5066/F7DZ06GR.
Bansal, S., and Tangen, B.A., 2019, Dissolved greenhouse gas concentrations and fluxes from Wetlands P7 and P8 of the Cottonwood Lake study area, Stutsman County, North Dakota, 2015: U.S. Geological Survey data release, https://doi.org/10.5066/F7TX3CJ7.
Bansal, S., and Tangen, B.A., 2019, Diurnal patterns of methane flux from a depressional, seasonal wetland: U.S. Geological Survey data release, https://doi.org/10.5066/F7348JB2.
Mushet, D.M, 2019, Cottonwood Lake study area—Boundary polygon: U.S. Geological Survey data release, https://doi.org/10.5066/P9B0GADT.
Mushet, D.M, 2019, Cottonwood Lake study area—Well locations: U.S. Geological Survey data release, https://doi.org/10.5066/P9Q5BSIQ.
Tangen, B.A., and Bansal, S., 2019, Soil properties and greenhouse gas fluxes of Prairie Pothole Region wetlands—A comprehensive data release: U.S. Geological Survey data release, https://doi.org/10.5066/F7KS6QG2.
Mushet, D.M., Rosenberry, D.O., Euliss, N.H., Jr., and Solensky, M.J., 2022, Cottonwood Lake study area—Water surface elevations (ver. 2.0): U.S. Geological Survey data release, https://doi.org/10.5066/P9MULBED.
Mushet, D.M., Rosenberry, D.O., and Solensky, M.J., 2022, Cottonwood Lake study area—Groundwater elevations (ver. 2.0): U.S. Geological Survey data release, https://doi.org/10.5066/P9YKWWSZ.
Mushet, D.M., and Solensky, M.J., 2022, Cottonwood Lake study area—Amphibians (ver. 2.0): U.S. Geological Survey data release, https://doi.org/10.5066/P9G8TM2S.
Mushet, D.M., and Solensky, M.J., 2022, Cottonwood Lake study area—Breeding birds (ver. 2.0): U.S. Geological Survey data release, https://doi.org/10.5066/P94LIJU5.
Mushet, D.M., and Solensky, M.J., 2022, Cottonwood Lake study area—Invertebrate counts (ver. 2.0): U.S. Geological Survey data release, https://doi.org/10.5066/P99GXVSV.
Mushet, D.M., and Solensky, M.J., 2022, Cottonwood Lake study area—Invertebrate weights (ver. 2.0): U.S. Geological Survey data release, https://doi.org/10.5066/P92IJREV.
Mushet, D.M., and Solensky, M.J., 2022, Cottonwood Lake study area—Specific conductance (ver. 2.0): U.S. Geological Survey data release, https://doi.org/10.5066/P9GTOFCW.
Appendix 3. Standard Operating Procedures—Water Chemistry Sampling (Wetlands)
Field Sampling
Collect one water isotope sample in a glass vial. Do not filter the sample. Rinse a high density poly ethylene carboy and a tube sampler three times with wetland water on the way to the collection site. Collect a sample of the water column with a tube sampler and put into carboy—do not disturb the sediment. If the sediment is disturbed, find a new sampling location. It may take more than one tube of water to fill the carboy.
Measure pH, specific conductance, and temperature of water near sampling location. Move probes up and down in water column and check for changes. If variability with depth is observed, note approximate variability. Record the readings with probes at approximately 0.5-meter depth or at half depth if water depth is less than 1 meter.
Each month, choose two wetlands from which to take duplicate samples. Duplicate samples should be collected at the same time (perform pH/specific conductance/temperature measurements, take sample, and then take another set of measurements and another sample). Process samples separately in the laboratory. If possible, choose different wetlands to take duplicates from each month.
Laboratory Procedures
Wear nitrile gloves during filtration.
Push plastic barbed/threaded fitting into silicon tubing. The fitting can be reused.
Place hard tubing into carboy and pump about 500 milliliters (mL) of sample water through tubing and fitting only.
Screw new filter snugly onto fitting, paying attention to the arrow on the filter that indicates direction of water flow.
Keep the discharge end of the filter from touching surfaces, hands, and so forth.
It may be useful to find a way to hang the filter by the tubing, or otherwise secure it, so you can use both hands to manipulate bottle.
Pump about 500 mL of water through the filter before collecting sample.
Collect samples in the following order:
-
• Plastic 125 mL bottle labeled “anions”
-
• Plastic 250 mL bottle labeled “anions”
-
• Plastic 60 mL bottle labeled “cations”
-
• Plastic 125 mL bottle labeled “cations”
When all samples have been filtered for the day, add acid preservatives:
-
• 125 mL plastic bottle labeled “acid washed cations”: add 400 microliters (μL) (0.400 mL) of concentrated nitric acid using pipette. Pipette from 30 mL plastic bottle for safety and to avoid contamination of 500 mL reagent bottle.
-
• 60 mL plastic bottle labeled “acid washed cations”: add 200 μL of concentrated nitric acid.
Do an extra “end of day” rinse of tubing and filtration assembly with about 1 liter (L) deionized water and let dry overnight.
Rinse carboys with 50–100 mL deionized water five times and let dry overnight.
Keep anion sample refrigerated. If you have sufficient refrigerated storage, it is best to collect samples there and only do one or two shipments for the season.
Acid Safety
-
• Wear gloves, lab coat, goggles, and face shield.
-
• Work in ventilation hood.
-
• If small acid spill occurs, add baking soda (keep a box on hand) until fizzing stops and then wipe up with wet towel.
-
• Put used pipette tips in 1-L Nalgene half full of bicarbonate solution. Acid residue will be neutralized.
Beckman Coulter pHi410 Meter
This pH meter is waterproof but best to keep it dry if possible.
The manual is in the meter case. Set the meter for a 2-point calibration (pH 7.00 and 10.01). Some of the temporary recharge wetlands will have pH values below 7, but the 2-point calibration is best for the range of pH values being measured.
The pH calibration instructions are as follows:
-
• Attach probe to the pH meter—both BNC connector and phono plug (this is for the temperature prove). Even if you are using another instrument for temperature, you will need to ensure the pH is reading temperature, as well, because pH measurements are temperature dependent.
-
• Turn on meter.
-
• Make sure the probe is in pH mode by pressing pH button.
-
• Rinse probe with deionized water and then dry with kimwipe or shake off excess water really well. Be careful to not wipe glass tip that is encased by the plastic sleave.
-
• Dip probe in pH 7 buffer (yellow).
-
• Press “cal” and then delete to erase previous calibrations.
-
• Then press “cal.” Meter will beep when ready and should indicate it is ready for pH 10.01 buffer.
-
• Rinse probe, dry, dip in pH 10 buffer, and then press enter. Meter should beep when ready and display slope percent, which should be between 85 and 102 percent or meter will display error code “E04.”
-
• Press pH to return to measurement mode.
-
• Check both pH 7.00 and 10.01 buffers to ensure they measure within 0.02 of actual value; if not, recalibrate.
The meter is set to read to two decimal places. Record pH to two decimals. The meter is in a mode so it will beep and indicate “ready” when it senses a stable measurement is reached. The displayed value will be locked after that if only minor fluctuations are detected. If larger fluctuations are detected, “ready” will disappear and the displayed value will vary with detected value. When measuring wetland pH, once the meter says “ready,” wiggle the probe in the water a bit and see if it unlocks. If it does unlock, but “ready” appears again quickly at near the same pH value (within 0.02 or so), record the pH.
The meter comes with 30-mL bottles for calibration solutions; use these bottles instead of the centrifuge tubes if you find them more convenient. Obligate one of the included wash bottles for rinsing the pH probe. Take some backup calibration standards to the field in centrifuge tubes in case the others spill or get contaminated. Replace the working calibration solutions with fresh solution each day. Dispose of all pH buffer solution in one container, such as a 1-L Nalgene bottle or empty deionized water jug. These buffer solutions are technically not hazardous except for low (pH 4) and high (pH 10) pH.
Standardize the meter at the beginning of each day and then check it every couple of hours in the field. If the pH 7.00 and pH 10.01 buffers are reading with around 0.02, recalibration is recommended. If the temperature changes often during the day, check the meter more often.
Make sure to rinse the probe and store in storage solution in the bottle when not in use. The solid cap is useful to avoid spilling the storage solution bottle while storing on the shore.
Appendix 4. Standard Operation Procedures—Monthly Bird Counts
Procedures
With a pencil, record the date, wetland number, observer’s initials, air temperature (degrees Celsius), wind speed (miles per hour) and direction (north, northeast, north-northeast, and so forth), cloud cover (percent), and start time (military time) at the top of a field sheet. From a high vantage point, record the number of individuals of each species visible in the wetland. When recording the number of birds, record males, females, and young separately. The observer should try to determine sex, but this will not be possible for young birds; for many species, especially sexually monomorphic species (for example, coots [Fulica americana]); and in situations in which visibility is poor. If the sex is not known for some individuals, record the number of individuals as “unknown” sex.
After completing the counts from a high vantage point, approach the wetland and record the species and number of individual birds that were not recorded earlier. This will require the observer to walk all the way around the perimeter of the wetland and within the emergent vegetation, looking and listening for secretive species, such as wrens (Cistothorus spp.) and rails (Rallidae). In dense vegetation, it may be necessary to form a line of observers and walk directly through the wetland to adequately sample the basin. The goal of this survey is to record, as accurately as possible, the number of individual birds by species present in the wetland basin at the time of the survey. This record does not include songbirds that may be present in the shrubs and trees along the edges of certain wetlands. In large wetlands with dense vegetation, some birds will be missed, but do as thorough a survey as is realistically possible.
On the field sheet, group all bird observations from the open water (OW) zone first, followed in order by those in the deep marsh (DM), shallow marsh (SM), and wet meadow (WM) zones. If a bird perches on a steel post, drift fence, and so forth, indicate artificial structure (AS) in the “Zone” column and place it at the end of the groupings. Leave a blank line between groups from different zones. This separation of groups by zone greatly simplifies the data entry process later.
Appendix 5. Standard Operation Procedures—Breeding-Bird Surveys
Procedures
Prior to beginning the survey, record the date, wetland identification number, observer’s initials, current temperature, wind speed and direction, estimated cloud cover, and survey start time.
The field notes section of the data sheet should contain a record of all species observed, and the total number of individuals for each species. This section should also be used for recording any pertinent or unusual observations (for example, vehicle tracks in wetland, dead mallard hen in wet meadow zone, or nests).
Approach each wetland from a direction that allows the observer to view birds from a relatively concealed position. At this time, record observable blackbirds and waterfowl. As the wetland is approached, many of the waterfowl will fly. Make note of flushed waterfowl from the focal wetland that land on wetlands that are not yet surveyed. If they do land in a nearby wetland, record these waterfowl on a separate sheet of paper. These waterfowl should not be counted a second time as part of the bird community on those nearby wetlands. Yellow-headed blackbirds (Xanthocephalus xanthocephalus) sometimes will fly to the side of the wetland that the observer is surveying, which emphasizes the importance of recording observations of that species before approaching the wetland closely. After the initial survey of waterfowl and blackbirds, walk around the pond in or near the wet meadow zone. When ponds are connected by shallow waterways, it may be necessary to traverse water, which, combined with heavy dew, would make short rubber or waterproof boots advisable.
The breeding-bird survey records all waterfowl and singing males of other species. A standardized list of four-letter alpha codes for birds recorded on the Cottonwood Lake study area will be provided to each observer; this list will be updated annually to accommodate taxonomic changes and new species. Waterfowl records are expressed as a ratio: males over females. Three male mallards and one female would be recorded as “MALL 3/1,” a lone mallard hen would be recorded as “MALL 0/1,” and a pair would be recorded as “MALL 1/1.” All species records should be on the data sheet and the aerial photograph map.
Many recorded observations may be aural (song or calls) only, and the bird may never be visually observed. Some species, such as marsh wrens and soras, are secretive and may not be visible or detectable during bird surveys. When seeing or hearing a singing male or calling bird, mark their position as close as possible on the aerial photograph with a felt tip marker. Use surrounding landforms and vegetation to position observed birds on the field map (aerial photograph). Use a new field map for each survey.
Record survey end time on field data sheet.
Do not perform surveys when wind speeds exceed 24 kilometers per hour, when temperatures exceed 27 degrees Celsius, or during heavy precipitation events. Also, surveys should be carried out between sunrise and 10:00 a.m. Central Daylight Time.
Appendix 6. Standard Operation Procedures—Aquatic Macroinvertebrate Sampling
Equipment and Supplies
Funnel Traps
-
• Funnel trap
-
• Polyvinyl chloride (PVC) support post (1.9-centimeter [cm] inside diameter, 2-meter [m] length)
-
• PVC support arm (1.9-cm inside diameter, 30-cm length)
-
• Stainless steel screened (0.5-millimeter [mm]) beaker
-
• Funnel stopper (number 4 rubber)
-
• 46-centimeter (cm) x 60-cm white plastic tray
-
• 0.5-mm soil sieve
Procedures
General
At the Cottonwood Lake study area, all wetlands have six permanent transects. Transect A is set at a randomly chosen 158 degrees with no correction for declination, and transects B through F are set at 60-degree intervals clockwise from transect A. Transects run from the wetland center to the wet meadow zone. All invertebrate sampling in Cottonwood Lake study area wetlands will be from transects A, C, and E (one exception are the T9 samples B, C, and D).
Data collection sites will be preselected in the laboratory by computer-generated random numbers ranging from 1 through 9. These numbers, converted to percentages (that is, 2=20 percent, 4=40 percent, and so forth), will indicate the distance to travel from the center of the wetland towards shore in any vegetative zone to establish a collection point. For example, a computer-generated “4” would indicate that 40 percent of the way from the edge of the deep marsh emergent zone to the edge of the wet meadow zone will properly locate a collection site in the shallow marsh emergent zone of a semipermanent wetland. When collecting, use a visual estimation to locate the collection point rather than actually walking the transect and disturbing sediments or alerting invertebrates to your presence. With a pencil, record the wetland number, sampling method (“FT” for funnel trap or “B” for benthic), date, vegetation zone, and the observer’s initials on the field form.
Funnel Traps
Three funnel trap samples will be collected (one from each of the three transects) from the shallow marsh, deep marsh, and open-water zones of each Cottonwood Lake study area wetland if water conditions permit. Funnel traps require a minimum water depth of 30 cm, and the area of a wetland that will be considered as a valid collection area will be along a transect line from the wetland center to a point on the transect where water depth is less than 30 cm. These criteria will be applied in conjunction with the randomly selected number for site selection (for example, if the shallow marsh zone is 30 meters wide but only the interior 20 meters contains water 30 cm or deeper, and the randomly selected number is 7, then your sample site will be 70 percent of the way across the 20 meters deeper than 30 cm). At the sample site, push a 2.5-cm diameter x 2-m long PVC pipe firmly into the sediment. Attach the funnel trap to the support arm with a clip spring. Place a 0.5-mm mesh soil sieve over the opening of the funnel trap and push the support arm down on the vertical PVC pipe until the vertically oriented funnel trap rests approximately 5 cm below the water surface. The sieve is to prevent invertebrates and debris from entering the trap as it is placed into the wetland. Tighten the thumb screw on the support arm to hold its vertical orientation firmly on the support post. Remove the soil sieve so that invertebrates can enter the trap. Record the transect number, water depth, and water temperature on the field form. Funnel traps are to be left at the collection site for 24 hours.
Immediately upon reaching the collection site 24 hours after a trap has been set, place a number four rubber stopper in the funnel opening, which will prevent contamination of the sample if it is carried any distance. Many nonaquatic invertebrates inhabit the vegetation over water and care must be taken to avoid these accidentally contaminating the water sample.
After the stopper is in place, remove the lid at the rear of the trap and pour the contents into a 0.5-mm screened beaker. This transfer should be done over a clean tray so that any spillage will be caught and can be added back to the sample. Flush any clinging invertebrates from the funnel trap into the screened beaker with screened water. Use 80-percent ethyl alcohol to flush the sample from the screened beaker into the prenumbered sample jar. Add enough additional alcohol to the jar to completely cover the sample with about 2–3 cm of alcohol. Record the jar number on the field form and check that the water depth and temperature were recorded when the trap was set.
Benthic Cores
Three benthic samples will be collected (one from each of the three transects) from the wet meadow, shallow marsh, deep marsh, and open-water zones of each CWL wetland if water conditions permit. Benthic samples will not be collected in a zone if it is shallow or no longer flooded. Benthic samples are collected by holding the corer vertically and then, with the rubber stopper removed, placing the corer against the substrate and rotating clockwise. The teeth on the modified corer, when rotated clockwise, will cut through debris and vegetation. Cut into the substrate approximately 8 cm, place the rubber stopper in the top of the corer, and pull the corer free of the substrate. If the substrate is loose, it may require cutting deeper to keep the sample in the corer as it is withdrawn from the bottom sediments. After the sample has been drawn from the substrate, hold the sample over the self-cleaning screen, withdraw the corer's rubber stopper, and insert the extractors rubber stopper. With the extractor attached, rapidly squeeze the rubber bulb, pumping the sample free of the corer. When the sample is in the self-cleaning screen, agitate the screen in a rocking motion, which should wash most of the fine sediments free of the sample, leaving invertebrates and possibly vegetative debris. After washing the sample in the self-cleaning screen, the sample may be flushed with 80-percent ethyl alcohol directly into the prenumbered sample container. Add enough additional alcohol to the jar to completely cover the sample with about 1 inch of alcohol. Record the transect number, jar number, water depth, and water temperature on the field form.
Appendix 7. Standard Operation Procedures—Amphibian Funnel-Trap Sampling
Procedures
From the previous year's maps, locate the 2.5-cm diameter PVC pole still in a wetland, or refer to the previous year's data sheet with listed random numbers. Random numbers will range from 1 to 10 and correspond to the percentage of distance from the wetland center to a 10-cm water depth (for example, a random number of three indicates a position 30 percent of the way from the wetland center to a 4-inch water depth). Direction of travel when locating sites is from the wetland center to the shore (for example, if the distance from the wetland center to an area of 10-cm deep water is 60 m, a random number of three would dictate that the trap be set 18 m from the wetland center).
In small wetlands, the area of the wetland that fits the trapping criteria could be very small. In this situation, use the following guidelines to avoid one trap affecting another: if a transect is less than 5 m in length, abandon it; and if all transects are less than 5 m in length, set a single trap on one of the randomly selected transects at a randomly selected position on that transect.
Traps are set only when water depth exceeds 10 cm, which will ensure a minimum 2.5-cm water depth over the funnel trap opening. When standing in water looking towards shore, the lead should run to the right of the trap.
Funnel traps are placed in the wetland each spring and left open to collect amphibians for 5 days. After 5 days, remove the trap from the wetland and store until the next monthly trapping session. The trap lead, or a screen cut to size, should be used to close the trap opening while in storage. Wetlands are sampled once each month from May through September.
Obtain a new set of field data sheets for each day. One data sheet for each wetland should be sufficient, unless unusually high species diversity is encountered. Fill in all data requested on the field data form. Even if nothing is present in traps there should be a record, and the observer should respond negatively in the appropriate column.
To set the trap, begin by clearing debris from an 0.5-m x 0.5-m area. Position the trap in the cleared area and with downward pressure push the legs into the substrate until the bottom of the trap rests against the substrate. Next remove the lead securing rod from the trap throat. This rod screws into a 1/4-inch threaded receiver welded directly to the trap bottom. Push the rod through the lead end loop and reposition it in the trap throat. Stretch the lead full length away from the trap and secure in position with a 2.5-cm diameter PVC pipe through the opposing lead loop and pushed into the substrate. To prevent the lead from dipping below the water surface, position 5-cm diameter fishing bobbers along its length at the water surface. If the substrate is soft and will not support the trap when the lead is stretched taut, use the second PVC pipe to secure the trap. Position the second PVC pipe against the back of the trap and stretch a rubber strap from the PVC pipe to the front of the trap and secure it to the trap lead rod.
Appendix 8. Water-Surface Elevations of Wetland Ponds—1979 to 2021
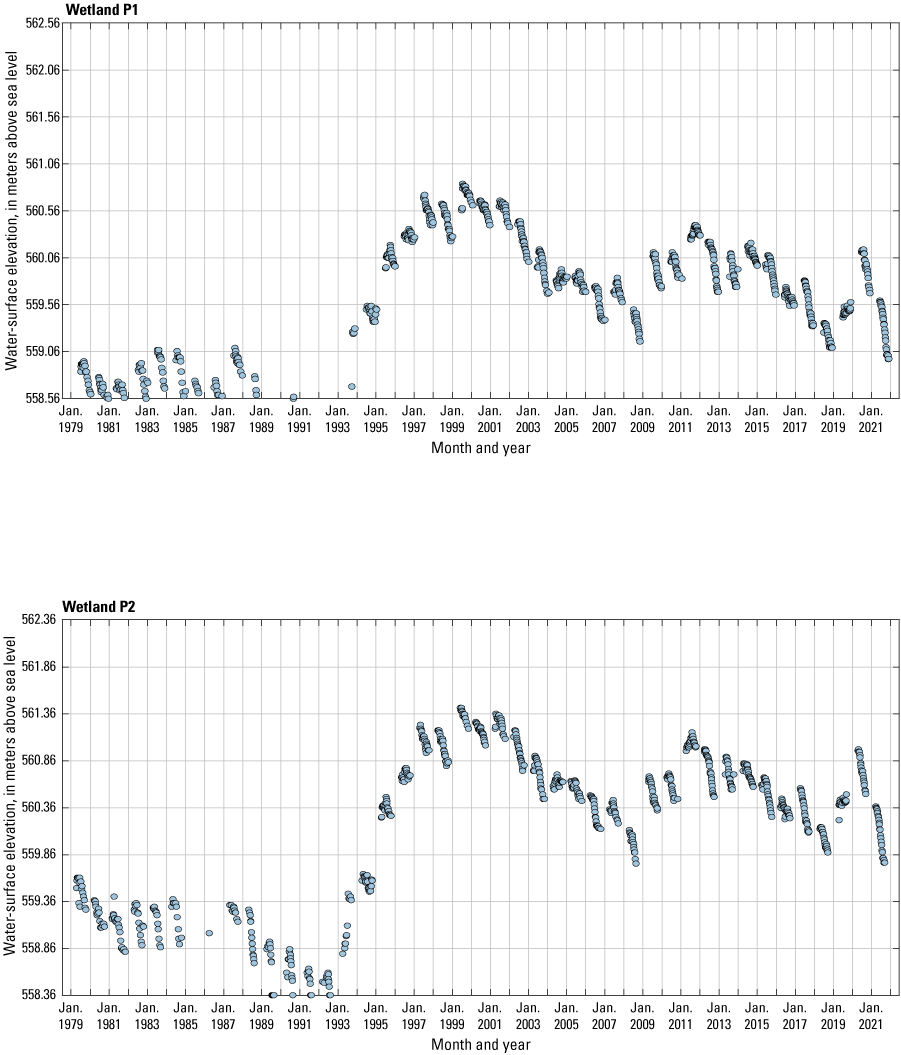
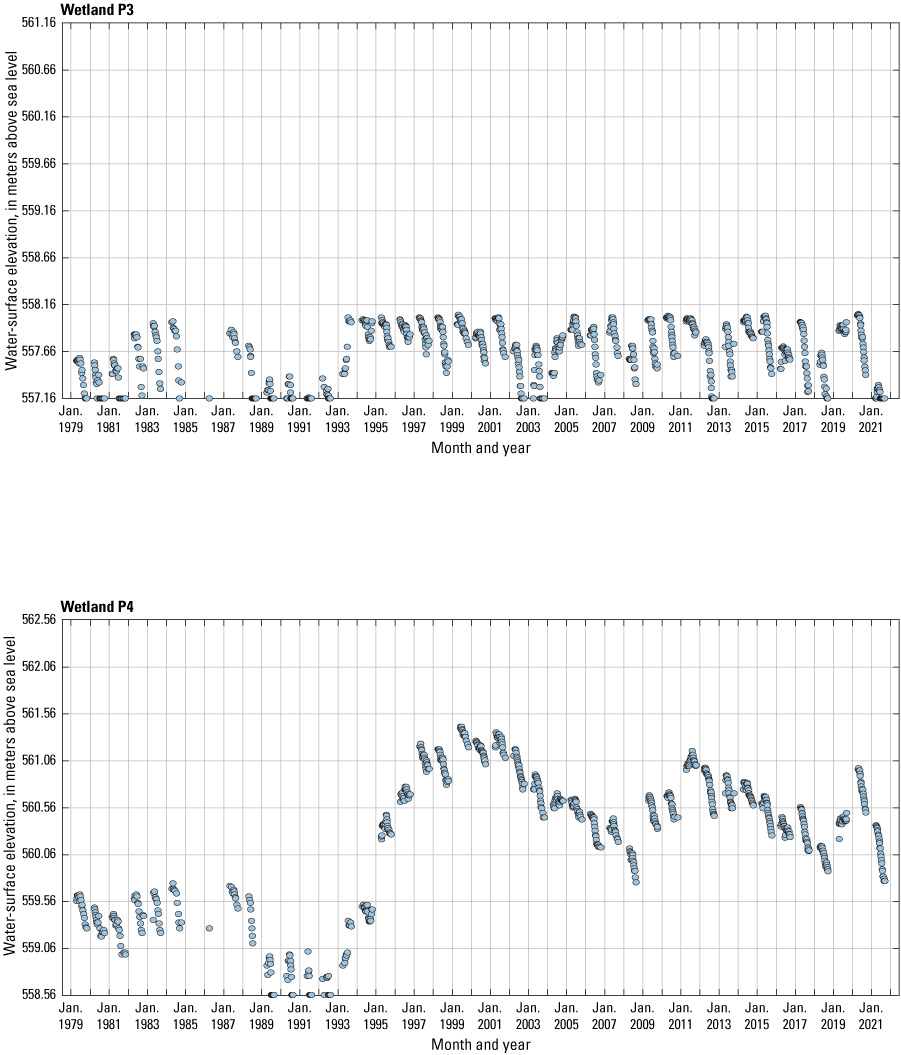
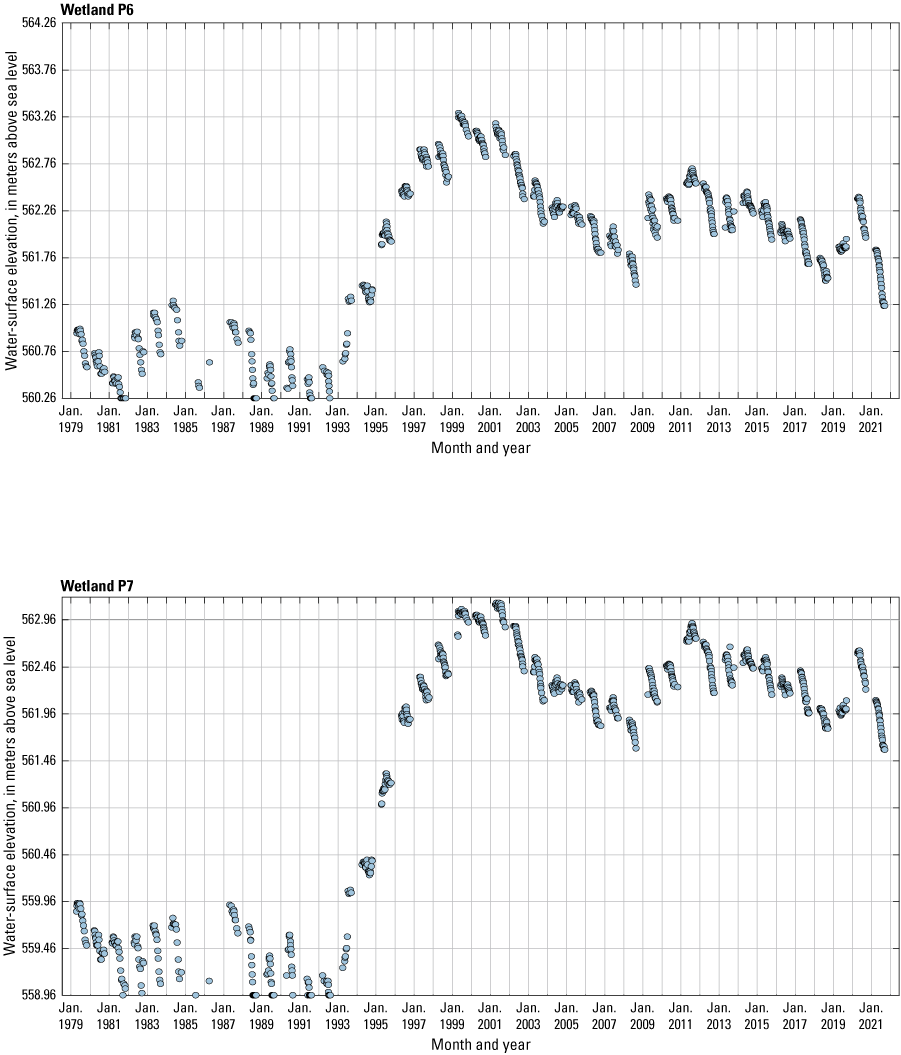
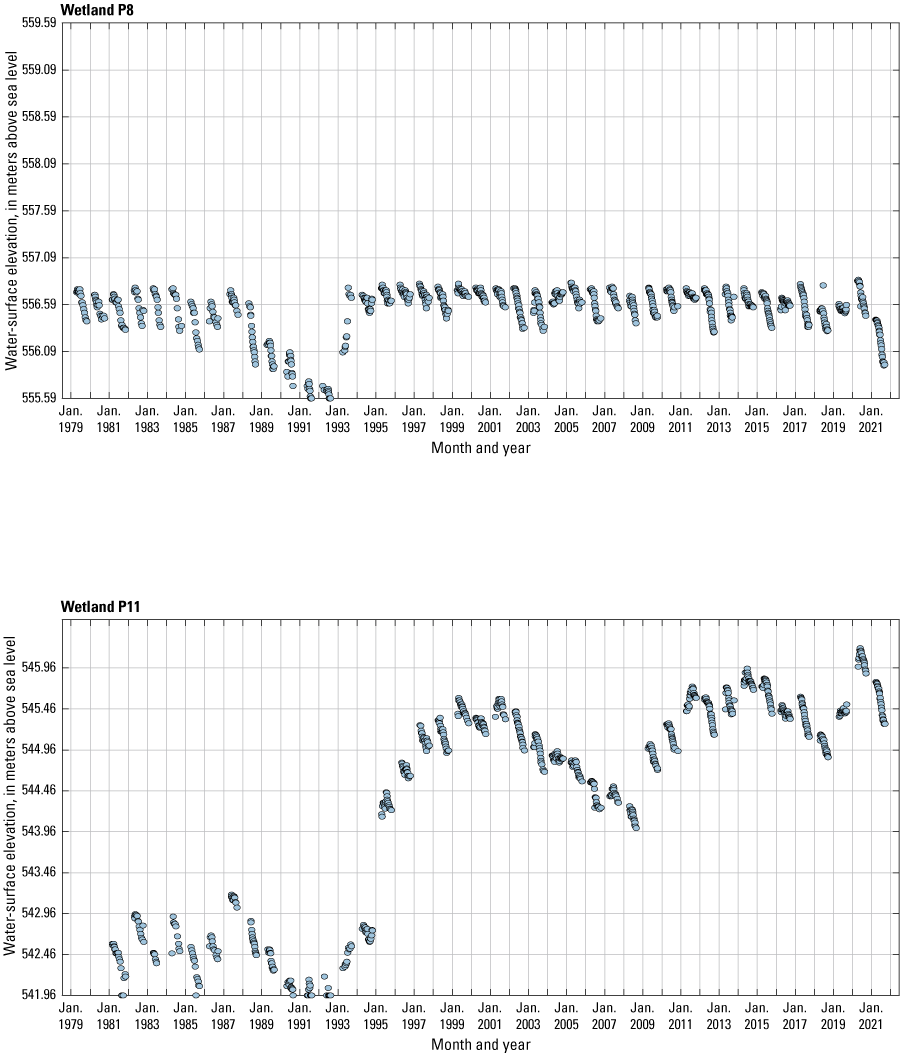
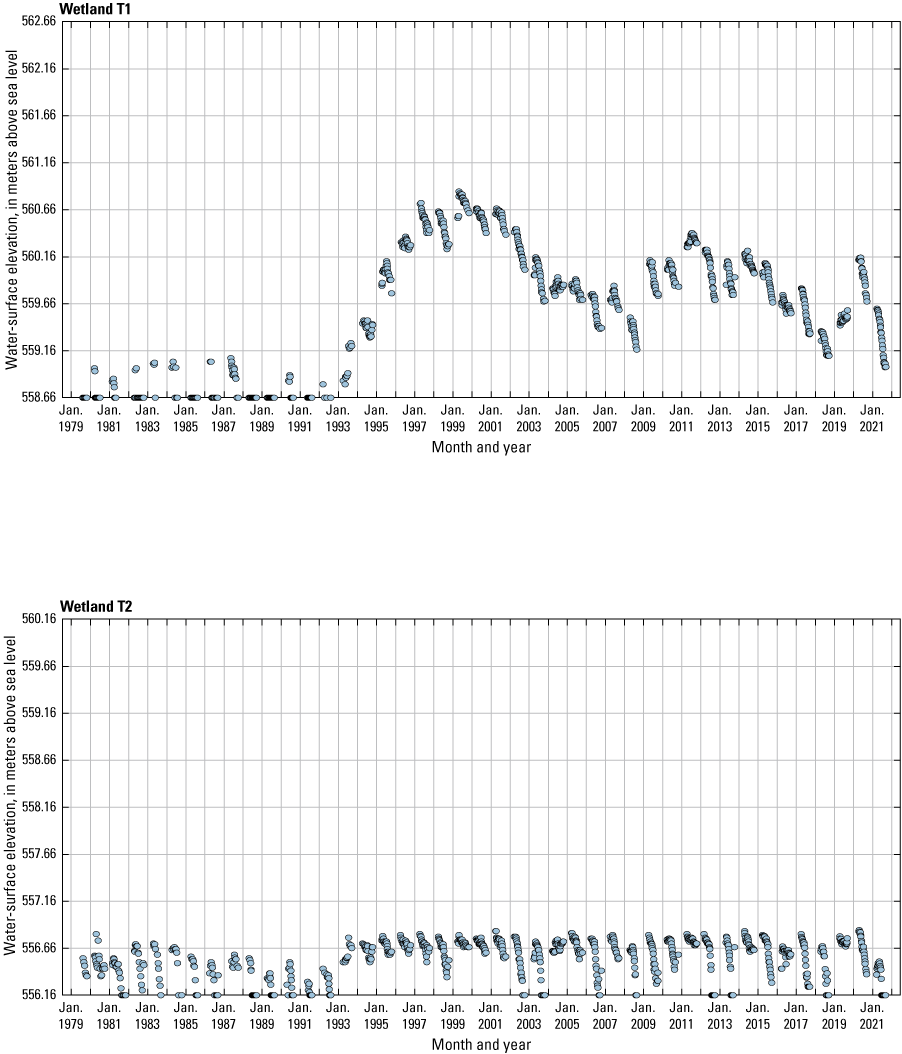
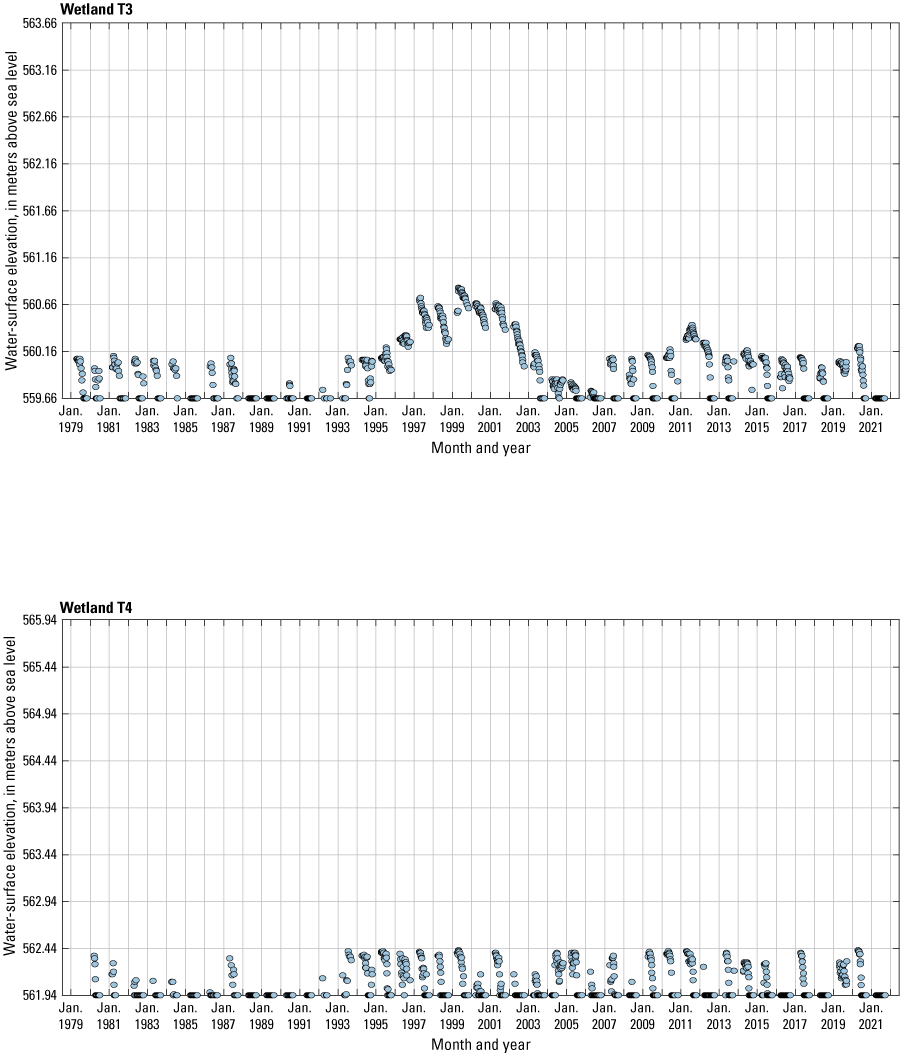
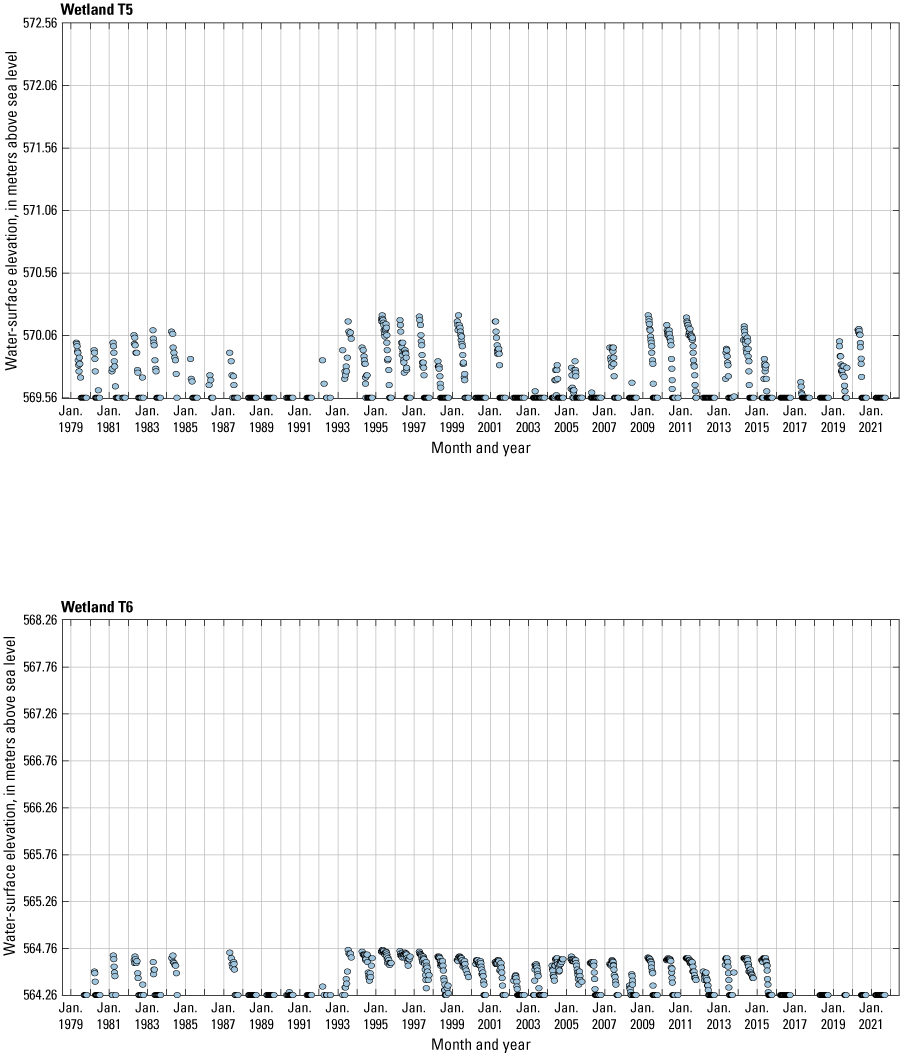
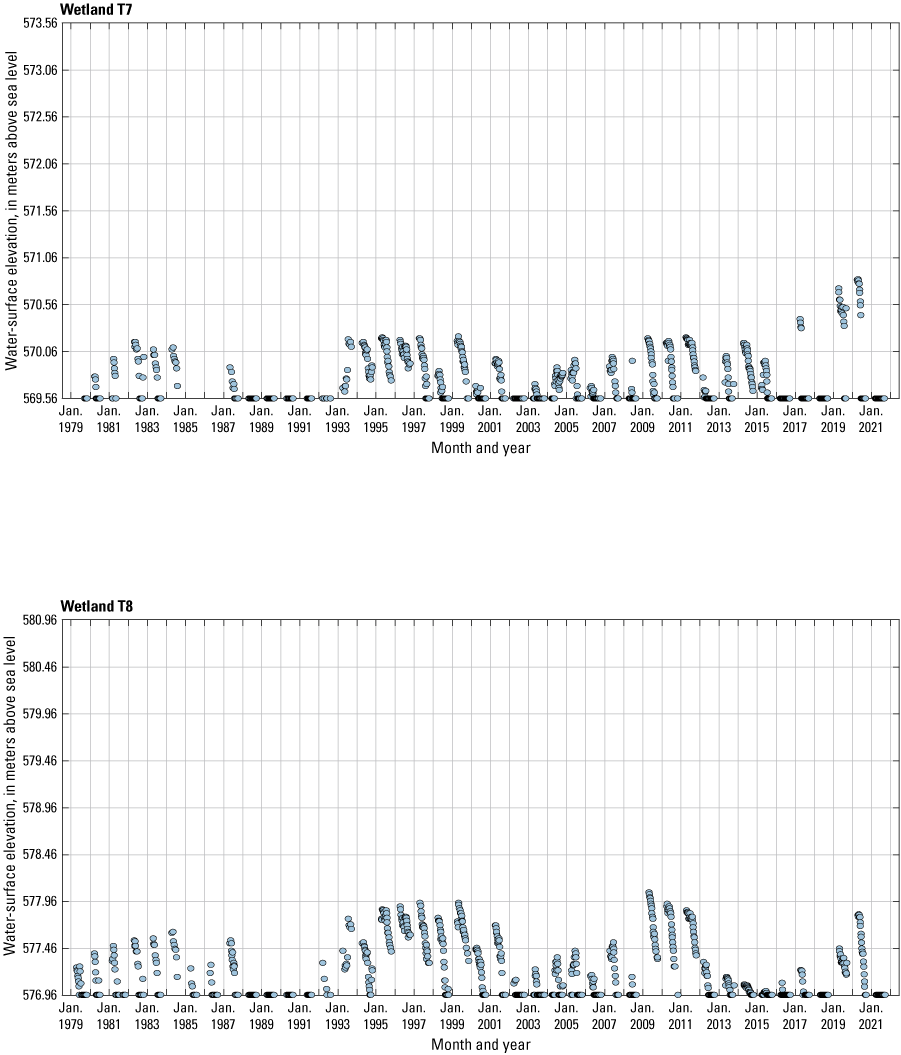
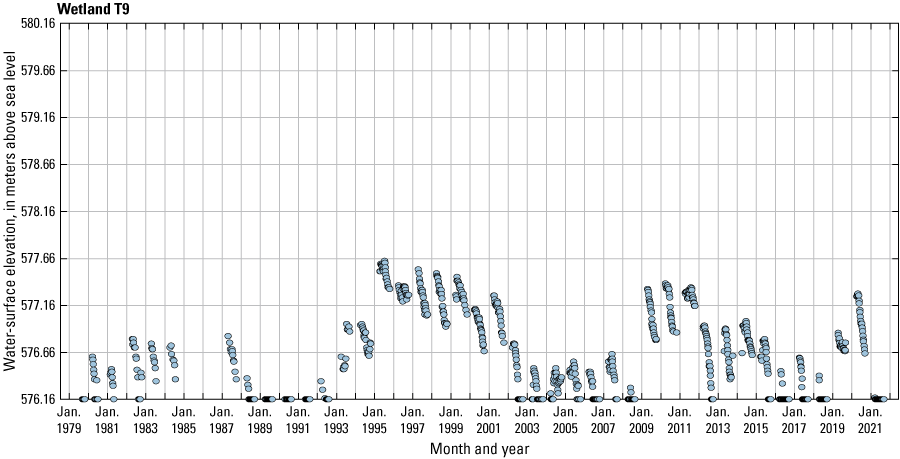
Water surface elevations of wetlands at the Cottonwood Lake study area, 1979–2021.
Appendix 9. Specific Conductance of Wetland Pond Water—1979 to 2021
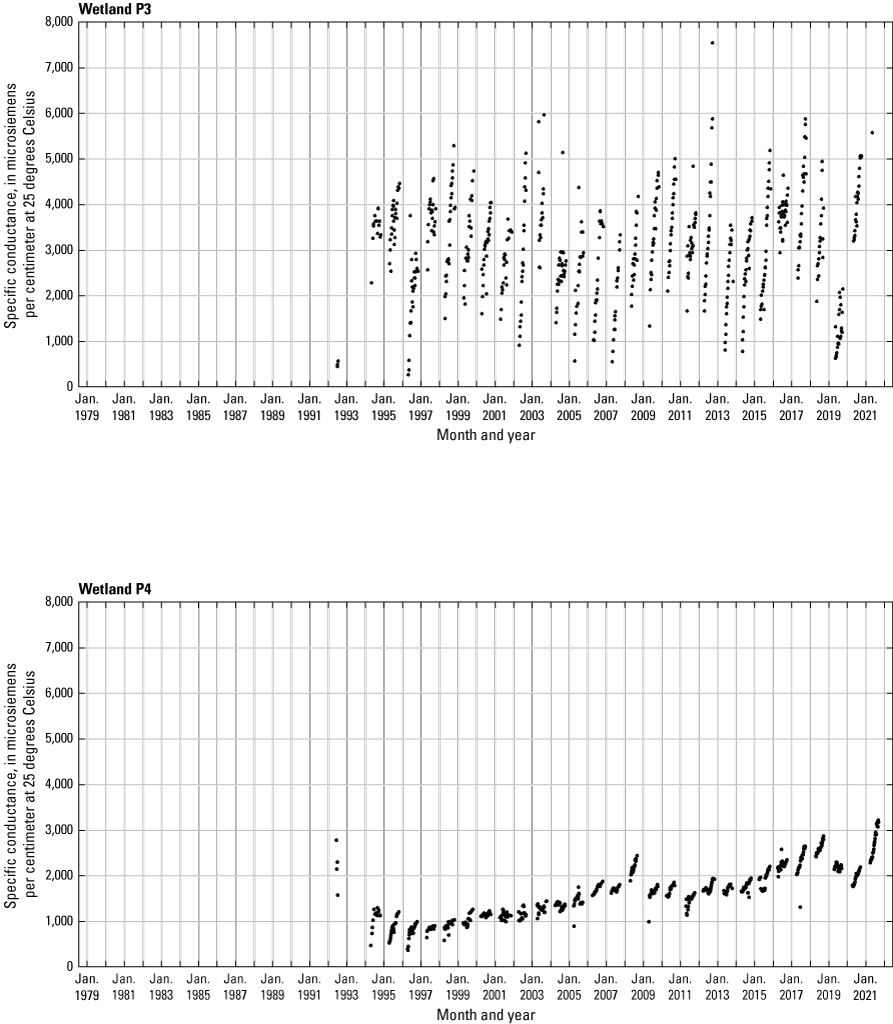
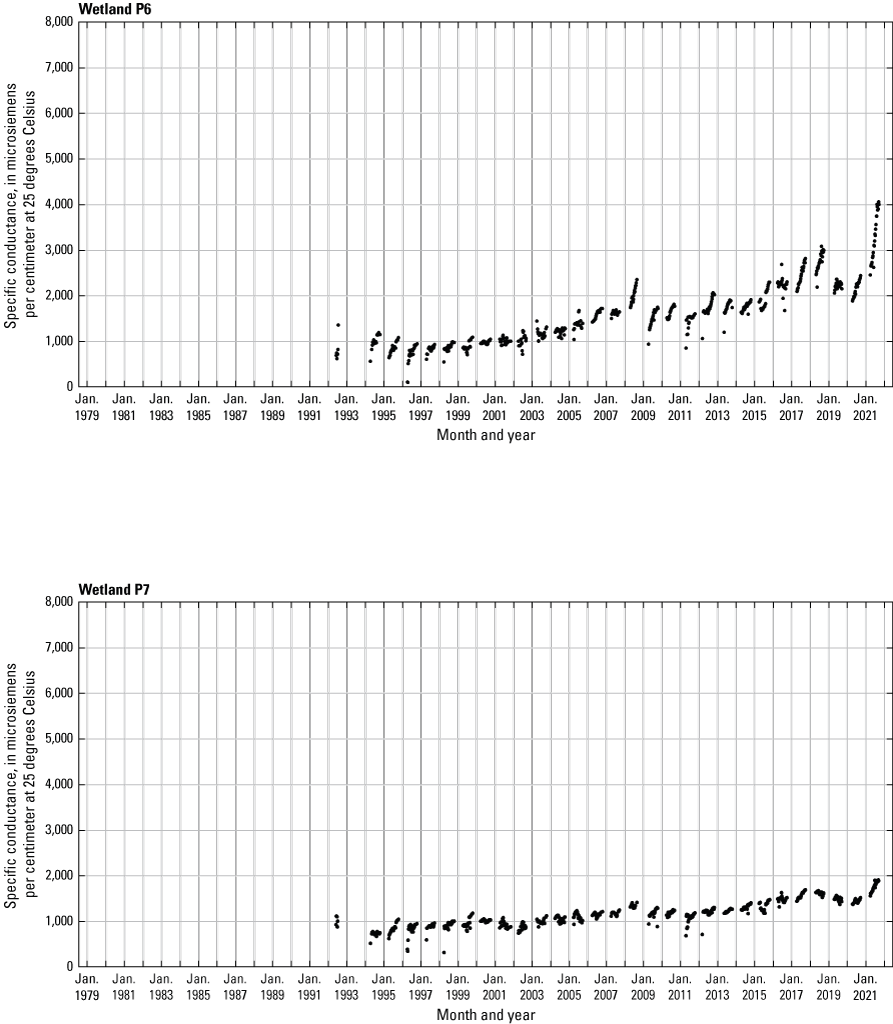
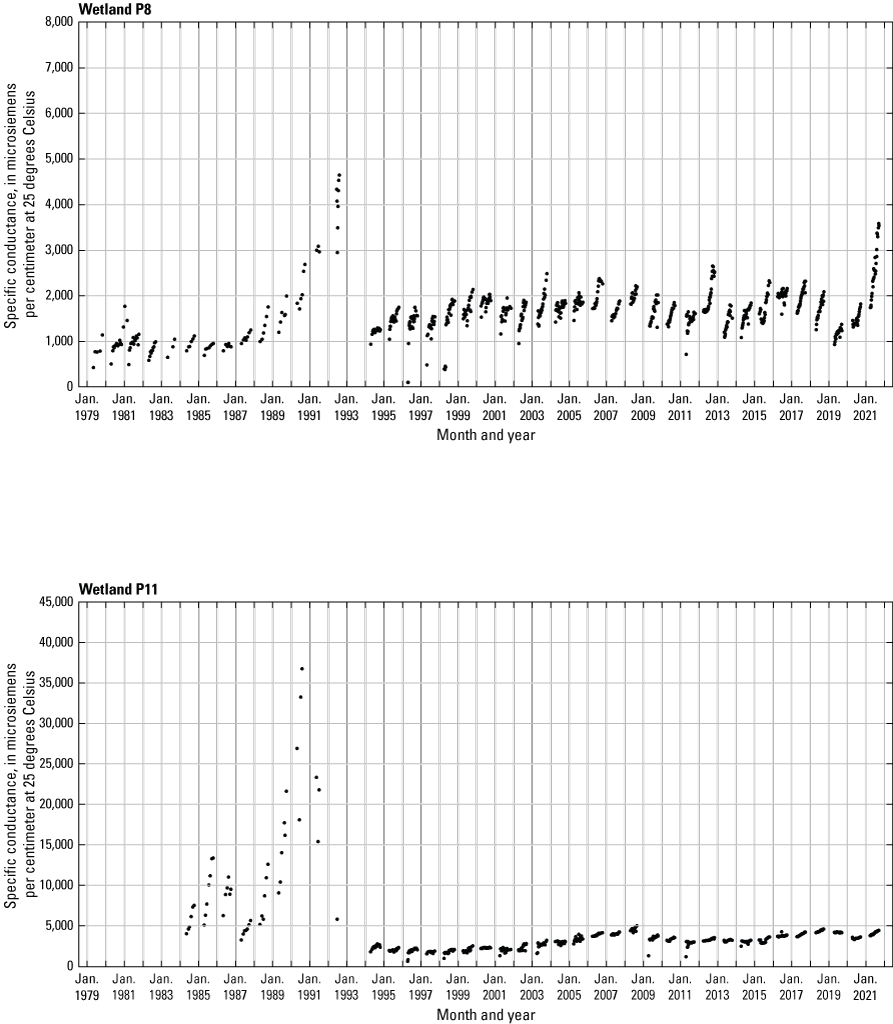
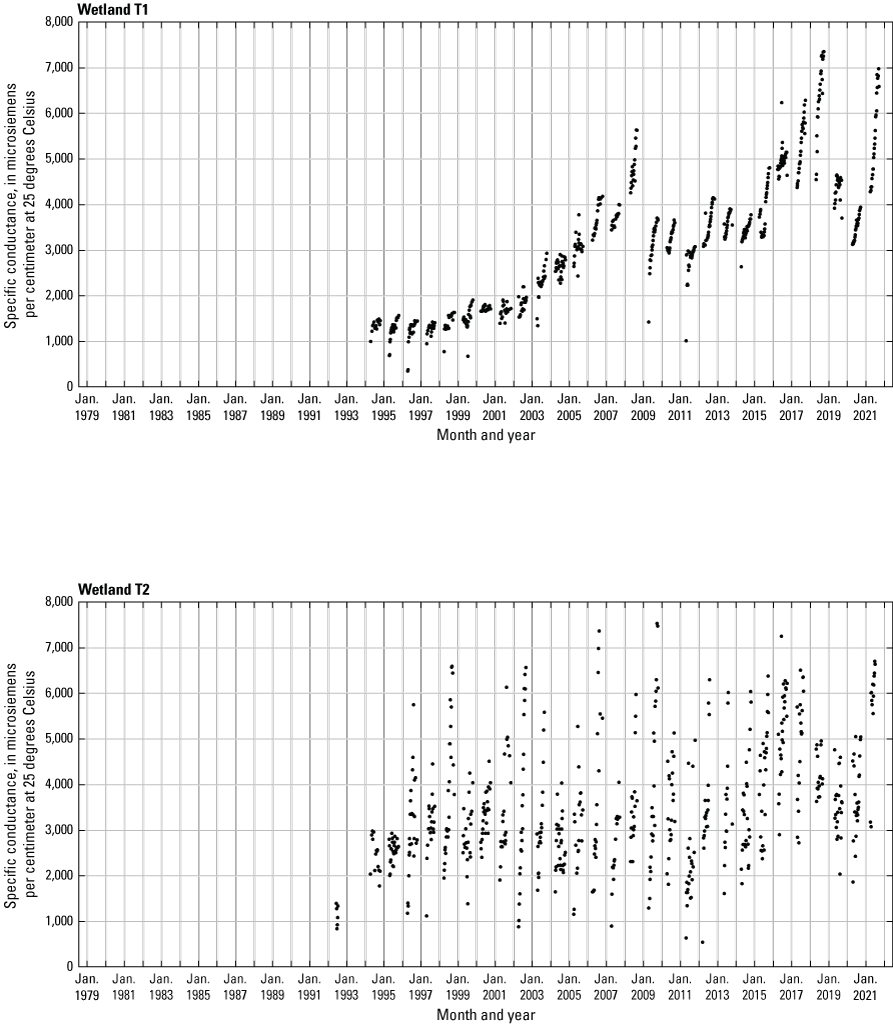
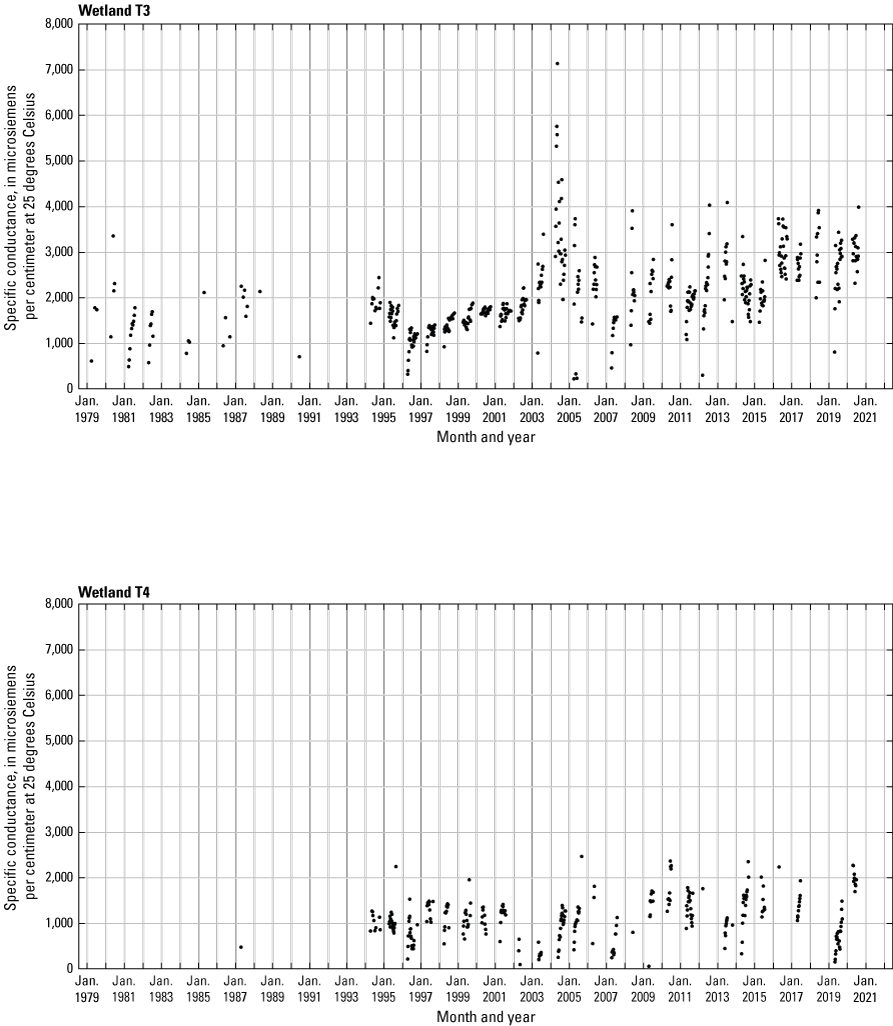
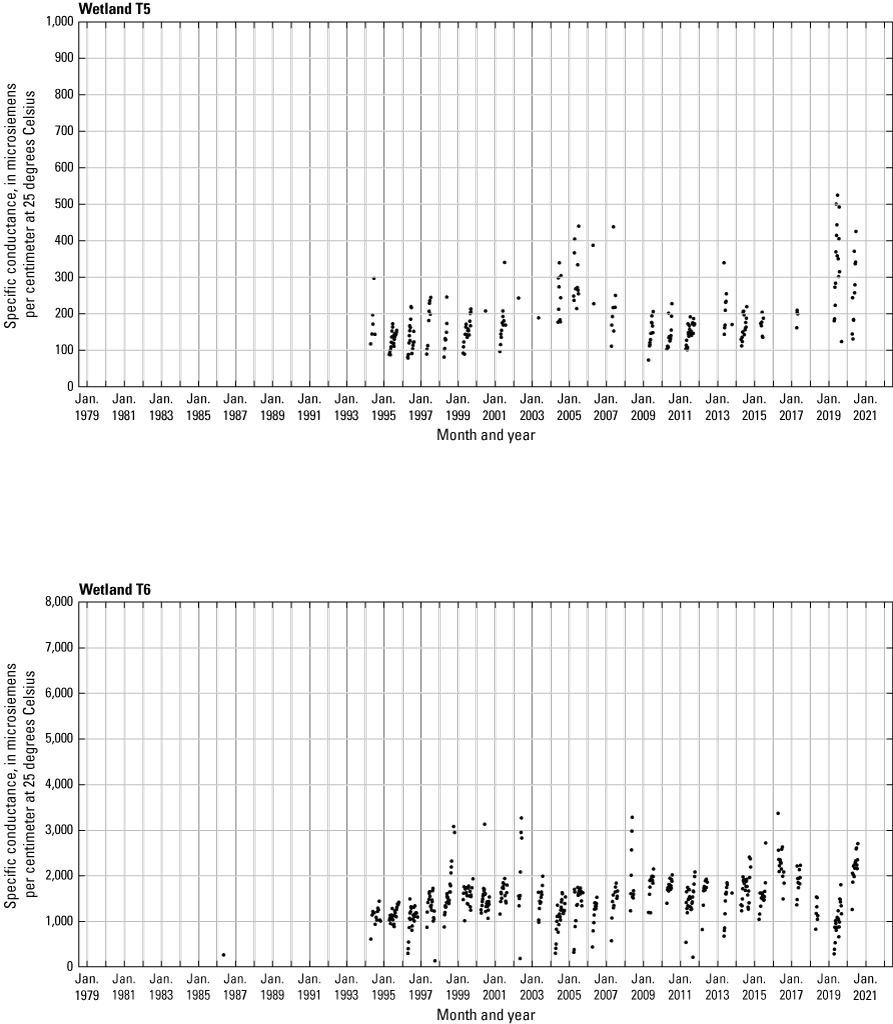
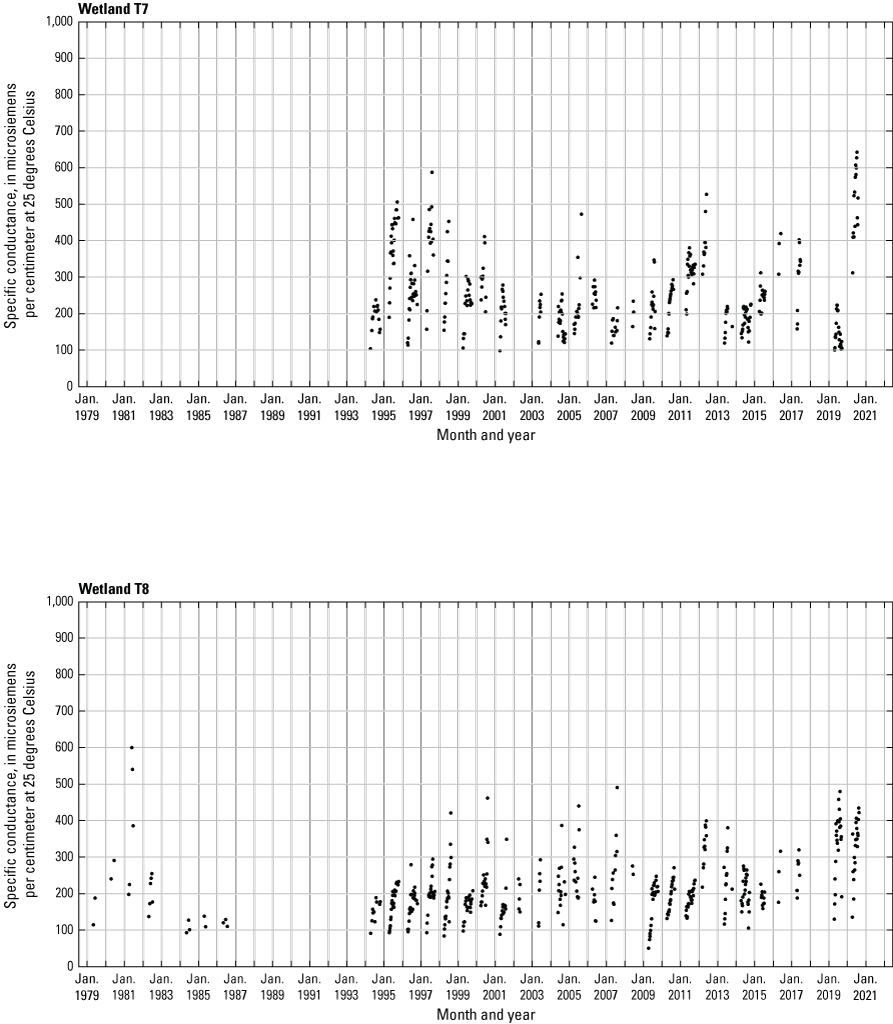
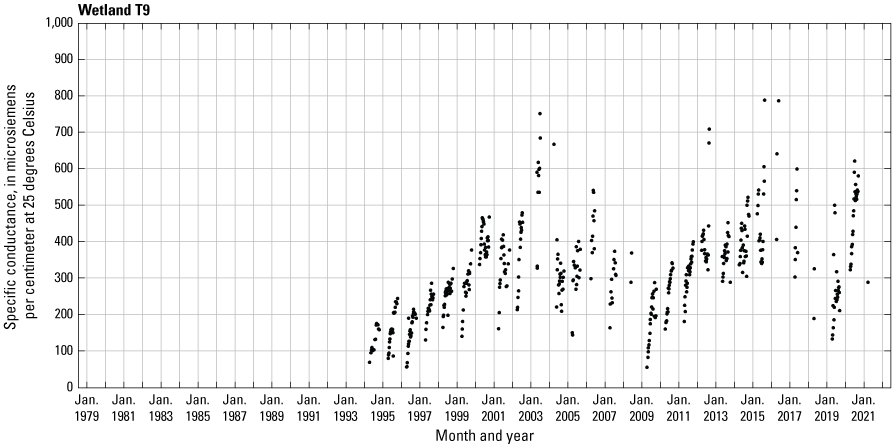
Specific conductance of wetland pond water at the Cottonwood Lake study area, 1979–2021.
Appendix 10. Aquatic Macroinvertebrates of the Cottonwood Lake Study Area
Table 10.1.
Aquatic-macroinvertebrates of the Cottonwood Lake study area.[--, not applicable]
Appendix 11. Breeding-Bird Survey—Indicated Pairs
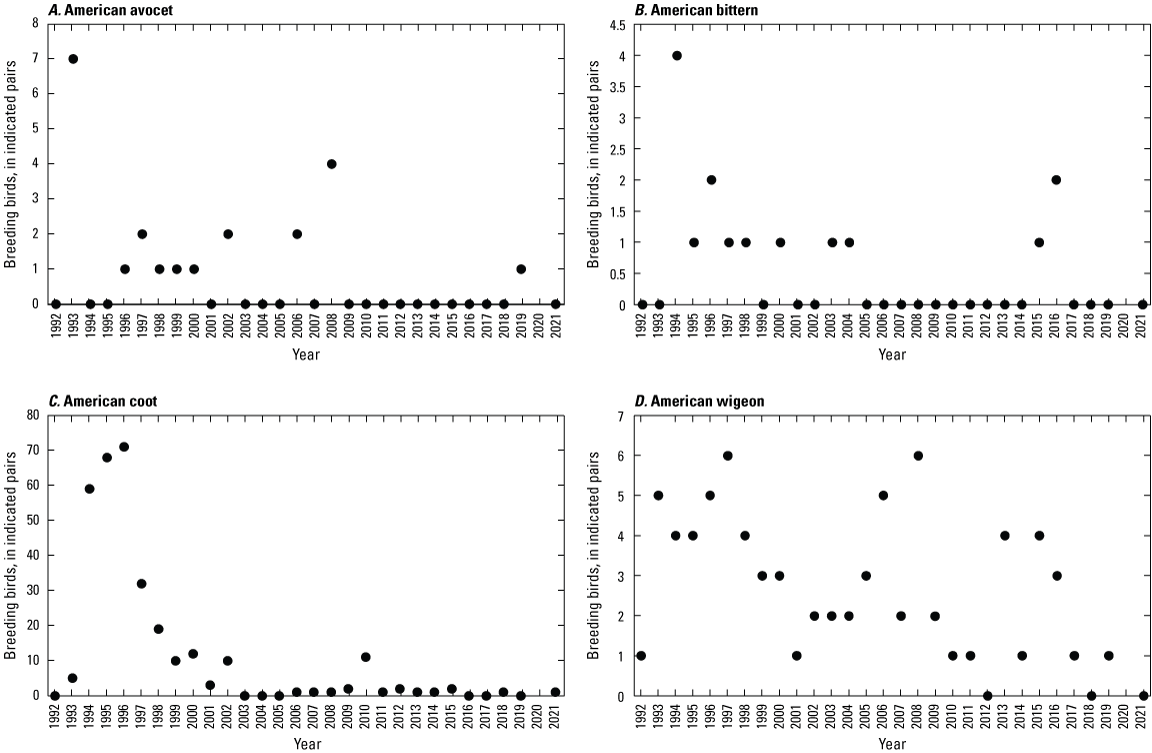
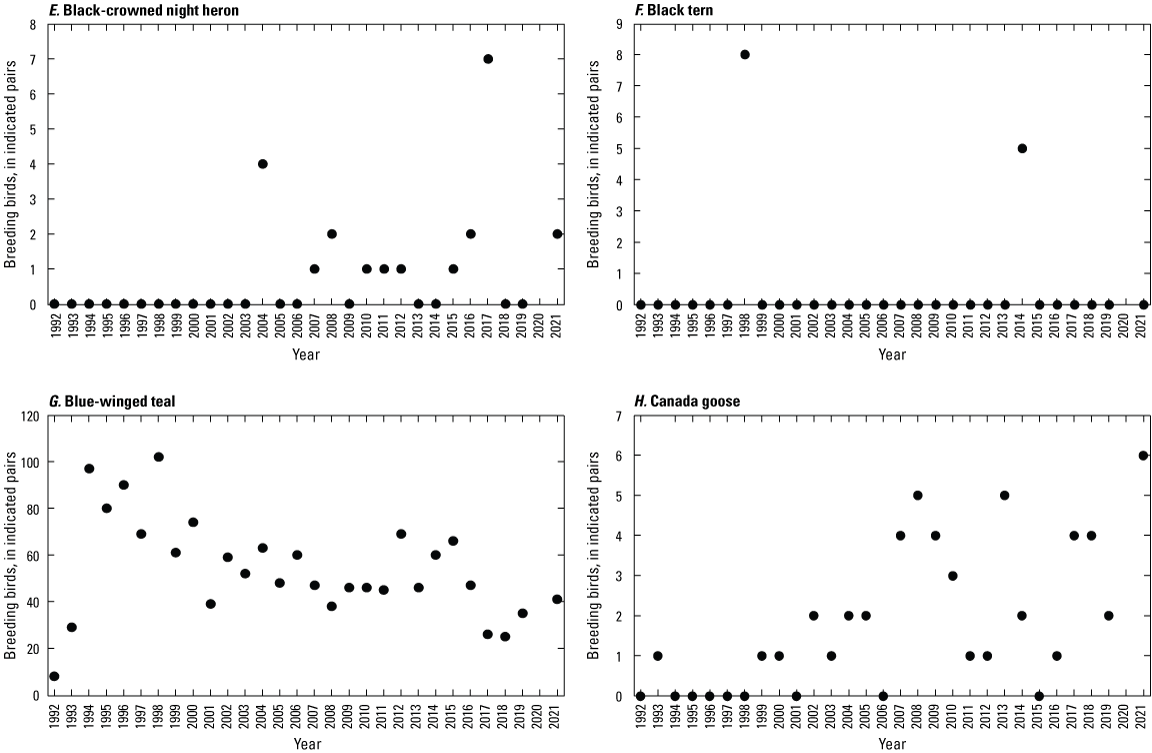
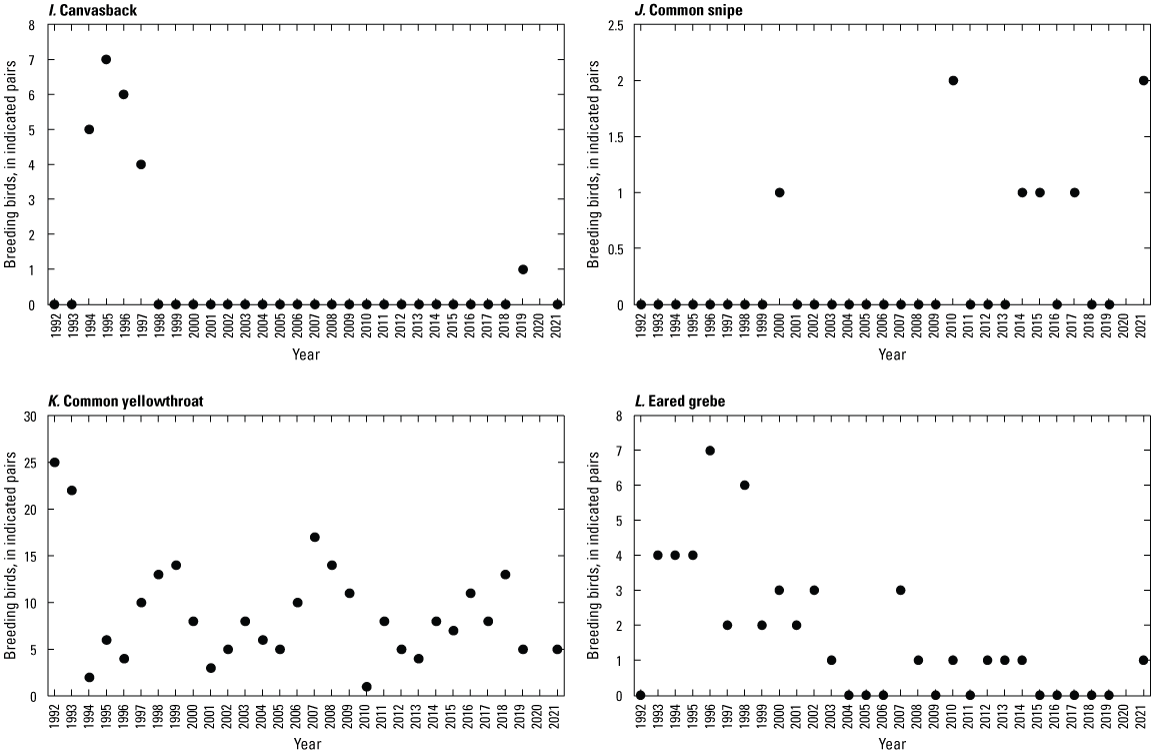
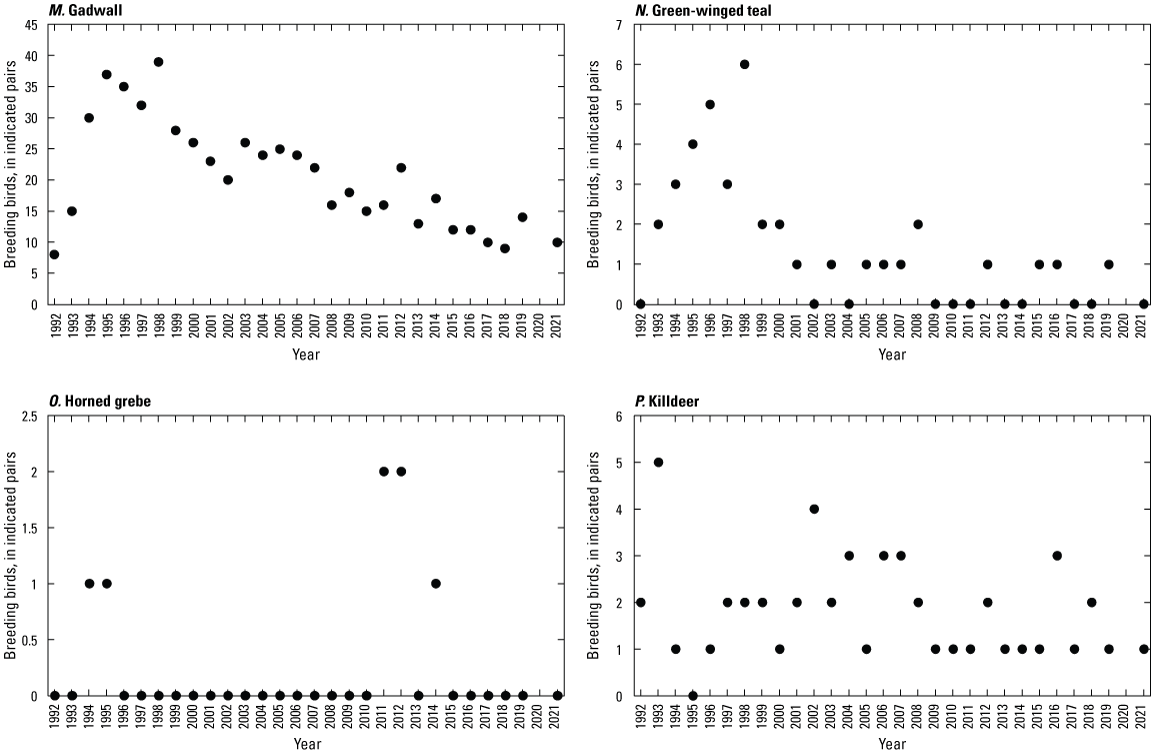
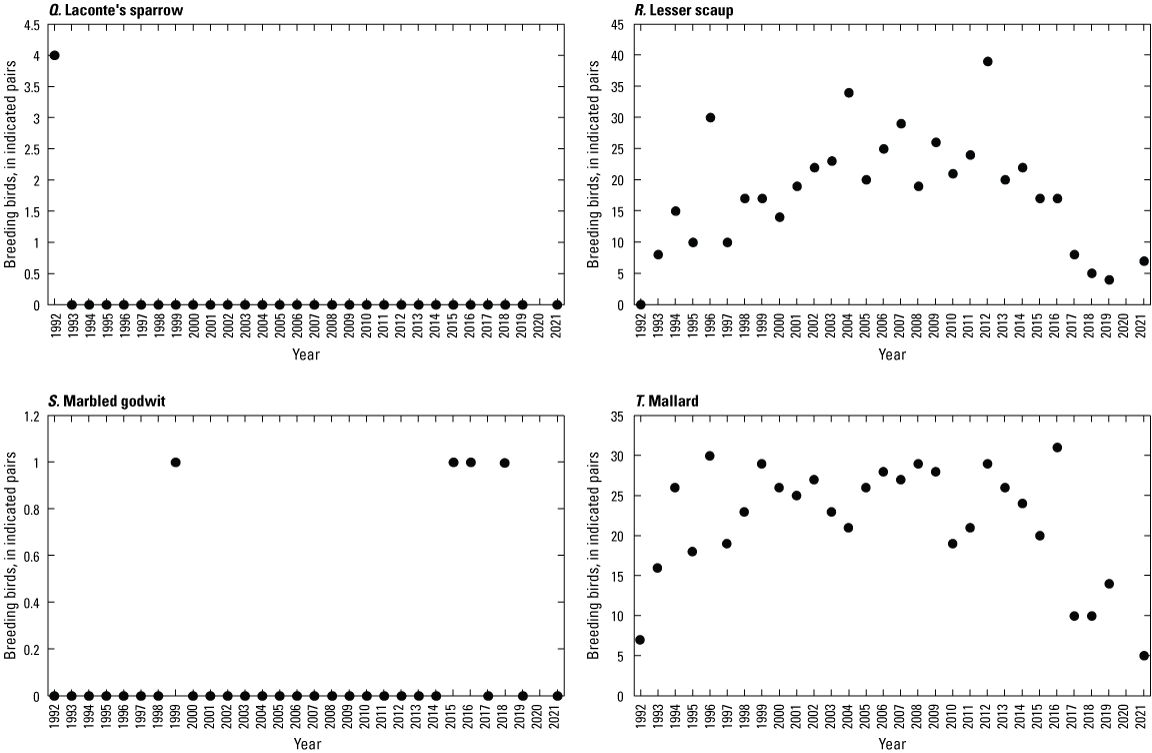
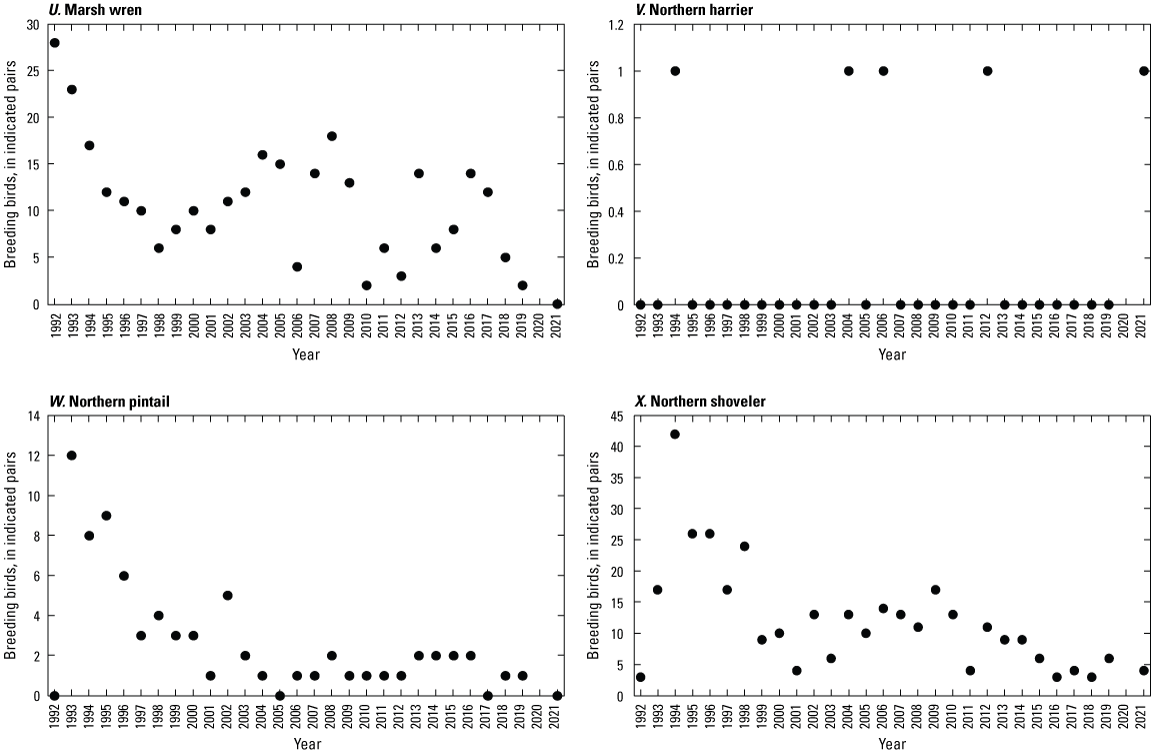
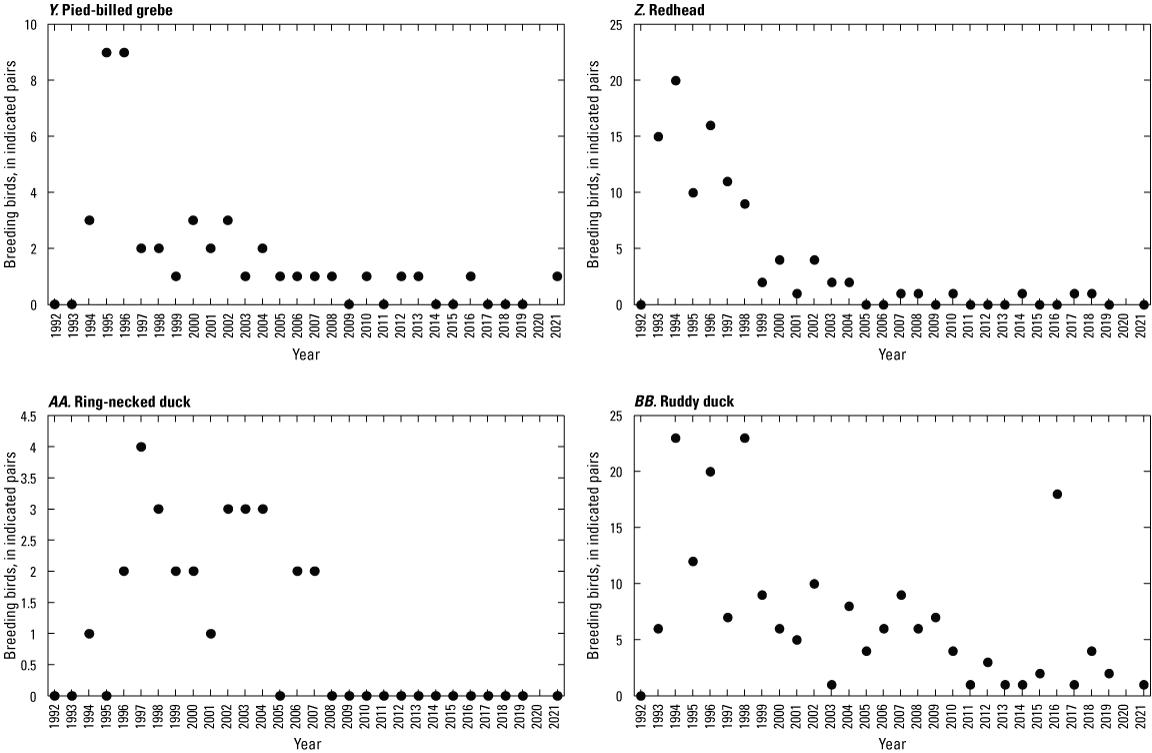
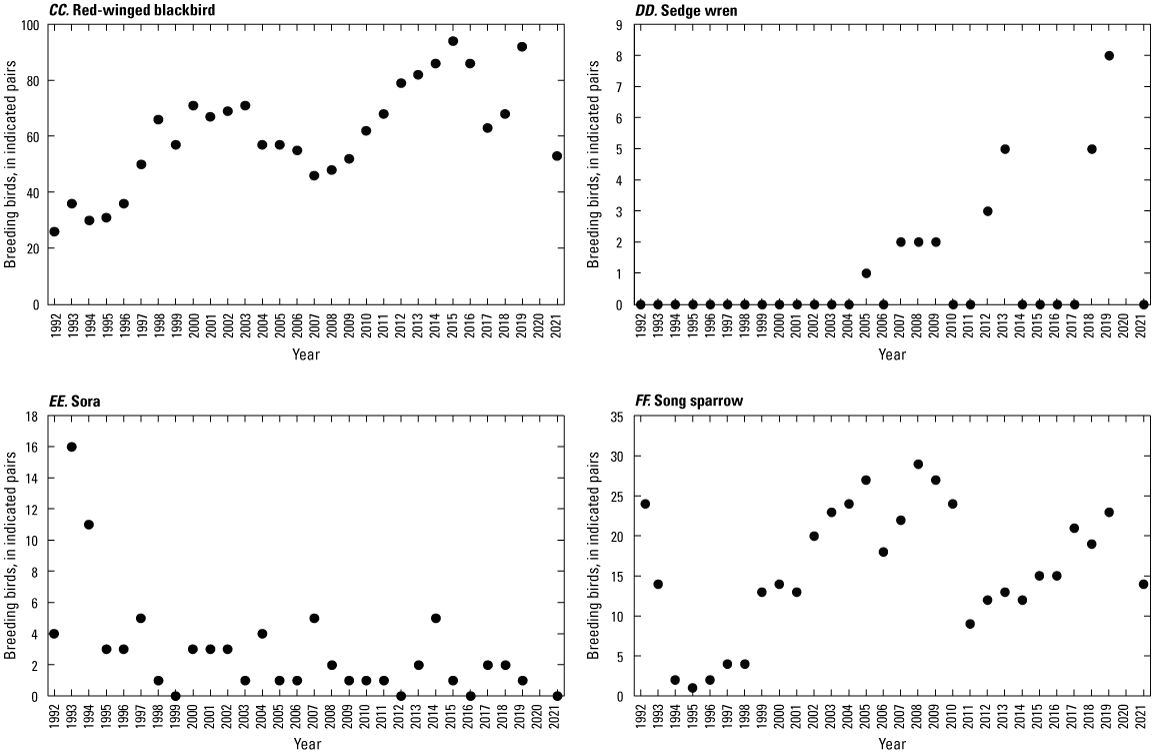
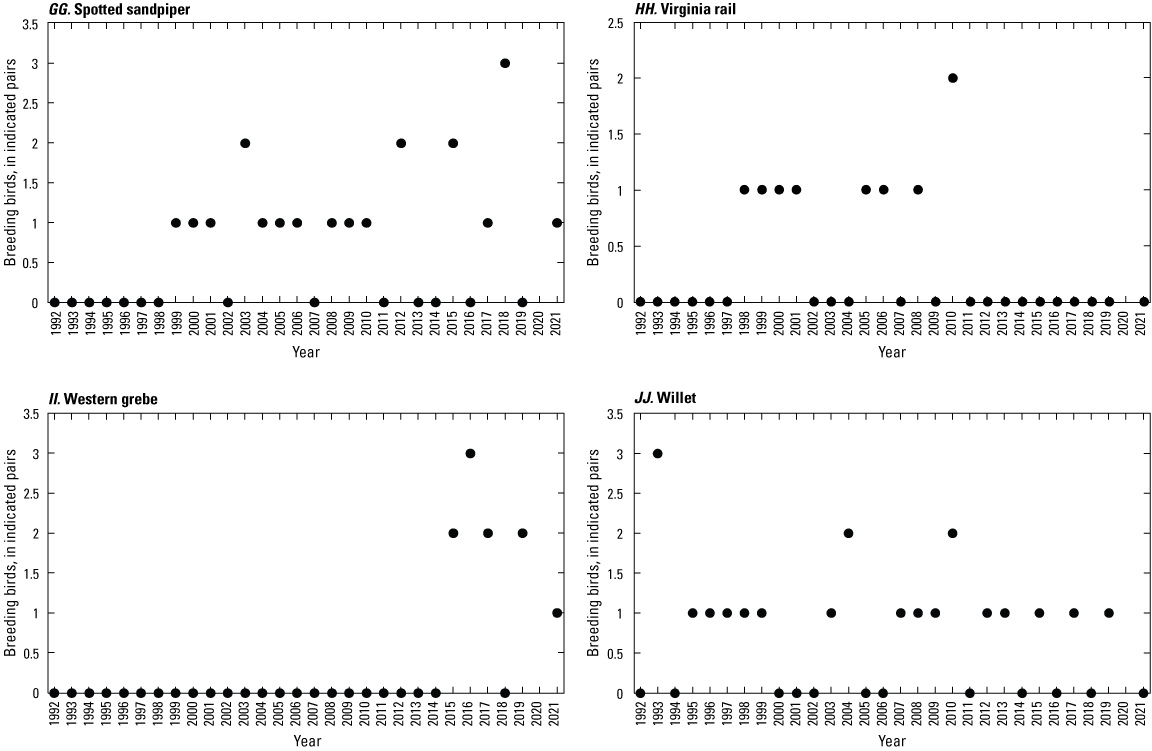
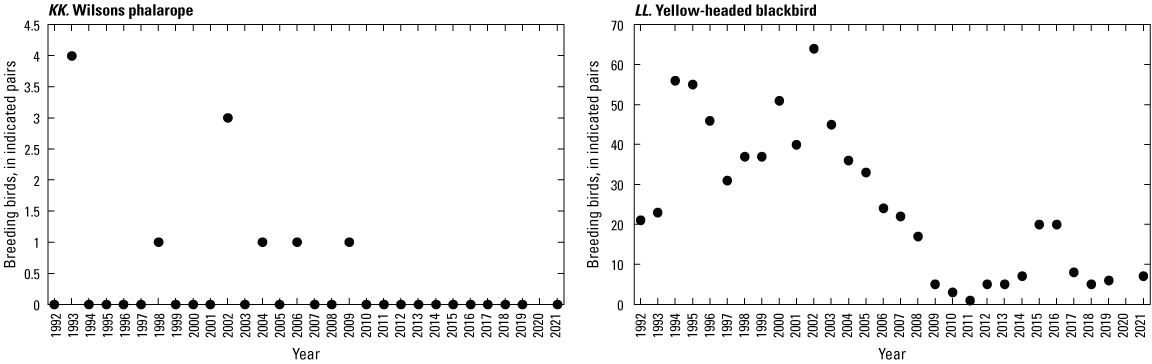
Number of indicated pairs observed in wetlands of the Cottonwood Lake study area, 1992–2021.
Conversion Factors
International System of Units to U.S. customary units
Temperature in degrees Celsius (°C) may be converted to degrees Fahrenheit (°F) as follows: °F = (1.8 × °C) + 32.
Datum
Vertical coordinate information is referenced to North American Vertical Datum of 1988 (NAVD 88).
Elevation, as used in this report, refers to distance above the vertical datum.
Supplemental Information
Specific conductance is given in microsiemens per centimeter at 25 degrees Celsius (µS/cm at 25 °C).
Concentrations of chemical constituents in water are given in either milligrams per liter (mg/L) or micrograms per liter (µg/L).
Abbreviations
CH4
methane
CO2
carbon dioxide
FWS
U.S. Fish and Wildlife Service
GHG
Greenhouse Gas
NDGF
North Dakota Game and Fish
N2O
nitrous oxide
NWS
National Weather Service
PHDI
Palmer Hydrological Drought Index
PHyLiSS
Pothole Hydrology-Linked Systems Simulator
PPR
Prairie Pothole Region
PVC
polyvinyl chloride
SOC
soil organic carbon
USGS
U.S. Geological Survey
WPA
Waterfowl Production Area
For more information about this publication, contact:
Director, USGS Northern Prairie Wildlife Research Center
8711 37th Street Southeast
Jamestown, ND 58401
701–253–5500
For additional information, visit: https://www.usgs.gov/centers/npwrc
Publishing support provided by the
Rolla Publishing Service Center
Disclaimers
Any use of trade, firm, or product names is for descriptive purposes only and does not imply endorsement by the U.S. Government.
Although this information product, for the most part, is in the public domain, it also may contain copyrighted materials as noted in the text. Permission to reproduce copyrighted items must be secured from the copyright owner.
Suggested Citation
Mushet, D.M., Euliss, N.H., Jr., Rosenberry, D.O., LaBaugh, J.W., Bansal, S., Levy, Z.F., McKenna, O.P., McLean, K.I., Mills, C.T., Neff, B.P., Nelson, R.D., Solensky, M.J., and Tangen, B.A., 2022, Lessons learned from wetlands research at the Cottonwood Lake Study Area, Stutsman County, North Dakota, 1967–2021: U.S. Geological Survey Professional Paper 1874, 162 p., https://doi.org/10.3133/pp1874.
ISSN: 2330-7102 (online)
Study Area
| Publication type | Report |
|---|---|
| Publication Subtype | USGS Numbered Series |
| Title | Lessons learned from wetlands research at the Cottonwood Lake Study Area, Stutsman County, North Dakota, 1967–2021 |
| Series title | Professional Paper |
| Series number | 1874 |
| DOI | 10.3133/pp1874 |
| Publication Date | October 17, 2022 |
| Year Published | 2022 |
| Language | English |
| Publisher | U.S. Geological Survey |
| Publisher location | Reston, VA |
| Contributing office(s) | Northern Prairie Wildlife Research Center |
| Description | Report: xi, 162 p.; 19 Data Releases |
| Country | United States |
| State | North Dakota |
| County | Stutsman County |
| Other Geospatial | Cottonwood Lake Study Area |
| Online Only (Y/N) | Y |