Water Quality in the Missouri River Alluvial Aquifer near the Independence, Missouri, Well Field, 1997–2018
Links
- Document: Report (3.89 MB pdf) , HTML , XML
- Appendixes:
- Appendix 1 (204 kB xlsx) —Tables 1.1 to 1.70
- Appendix 1 (61 kB csv) —Tables 1.1 to 1.70
- Appendix 2 (68.8 kB xlsx) —Tables 2.1 to 2.30
- Appendix 2 (16 kB csv) —Tables 2.1 to 2.30
- Dataset: USGS National Water Information System database —USGS water data for the Nation
- Download citation as: RIS | Dublin Core
Abstract
Groundwater-quality data collected from 1997 through 2018 from 68 monitoring locations open to the Missouri River alluvial aquifer (hereafter referred to as the “alluvial aquifer”) near the Independence, Missouri, well field were analyzed by the U.S. Geological Survey, in cooperation with the City of Independence, Missouri. This analysis was done to assess the quality of the water in the alluvial aquifer near the well field, identify trends in water quality in the alluvial aquifer from 1997 through 2018, assess hydraulic interaction between the Missouri River and the groundwater system, identify potential threats to the potability of the water extracted from the well field, and identify ways to improve the monitoring effort. Water-quality data indicate that water from the Missouri River recharges the alluvial aquifer. Recharge is exacerbated by pumping from the well field so that the quality of the water pumped from the well field is similar to that of the river for many constituents. Water-quality data indicate that the alluvial aquifer is under oxygen- and nitrate-reducing conditions, and iron- and manganese-reducing conditions are present in most of the alluvial aquifer. Sulfate-reducing conditions are present along the northern and western parts of the monitoring network north of the Missouri River. Maximum contaminant levels for antimony, arsenic, barium, lead, selenium, and uranium were exceeded in at least one sample, and the median concentrations of arsenic exceeded the maximum contaminant level in several monitoring wells on the periphery of the well field. Secondary maximum contaminant levels were exceeded for iron, manganese, and sulfate in multiple wells. Low concentrations of a variety of organic compounds, primarily derived from recharge from the Missouri River with lesser amounts potentially derived from application at land surface in the study area, are present in the alluvial aquifer and in water extracted from the well field.
Introduction
The City of Independence, Missouri, operates a well field near the Missouri River (fig. 1). The well field consists of the area where production wells are present, and discharge/pumping from the well field is synonymous with discharge from the production wells within the well field. The well field occupies a part of the study area (fig. 1), draws groundwater from the Missouri River alluvial aquifer (hereafter referred to as the “alluvial aquifer”), and supplies more than 250,000 people in several communities in eastern Jackson County (Karen Kelly, City of Independence Water Department, written commun., 2019). Potential anthropogenic sources of water-quality degradation near the well field include three landfills, permitted hazardous-waste disposal sites, commercial development, highway construction, highway and rail line traffic, fly ash used for mine stabilization south of the well field, a closed oil refinery, land application of solid waste to the west, a demolition landfill and off-channel sand dredging to the north, municipal wastewater treatment facilities, application of road salts, and agricultural activity (fig. 2; Kelly, 1996, 2011; Wilkison, 2012). There is the possibility that these contaminant sources can degrade groundwater quality in the alluvial aquifer, which has the potential to affect the quality of water extracted from the well field. The effects of recharge from the Missouri River on water quality in the alluvial aquifer also are a concern.
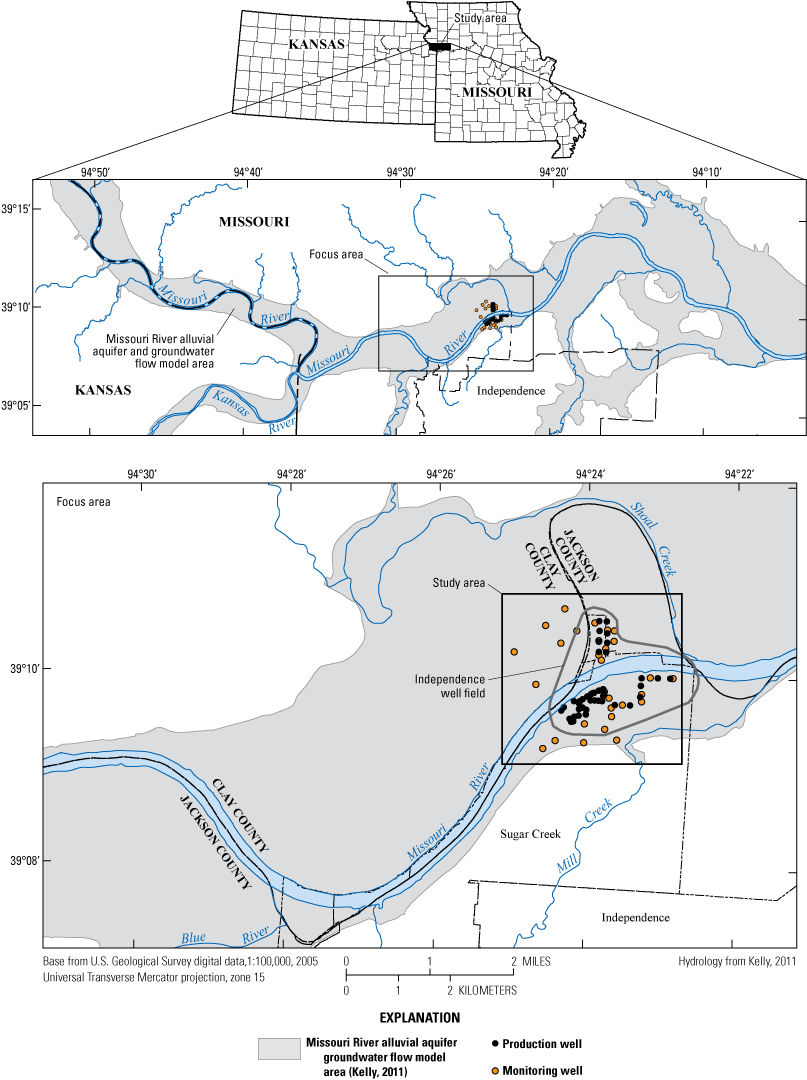
Location of model area, alluvial aquifer, monitoring and production wells, study area, and city of Independence well field, Missouri (modified from Wilkison, 2012).

Potential sources of groundwater contamination near the Independence well field, Missouri (modified from Wilkison, 2012).
To assess the potential for degradation of water quality in the alluvial aquifer and at the well field, from 1997 through 2018 the U.S. Geological Survey (USGS) sampled groundwater from a monitoring network consisting of 68 monitoring wells near the well field; each monitoring well had a 5-foot (ft) screen connecting the well to the surrounding alluvial aquifer (fig. 1; table 1). A spigot provided a composite of the water pumped from the production wells. Testing for several constituents including dissolved oxygen, nutrients, major ions, trace elements, and organic compounds that are components of gasoline began in 1997. Organic compounds that are components of wastewater and agricultural chemicals also were tested for periodically.
Table 1.
Monitoring well information, Independence well field, Missouri (U.S. Geological Survey, 2019c).[USGS, U.S. Geological Survey; NGVD 29, National Geodetic Vertical Datum of 1929]
A comprehensive analysis of water-quality data collected from the monitoring network during 1997–2018 has not been completed. An analysis of water-quality trends in the monitoring network can provide a better understanding of the natural and anthropogenic processes affecting water quality in the alluvial aquifer. The insights gained from this evaluation can be used by the City of Independence and others to continue to identify sources of water to the well field, to improve the sampling regimen to more effectively monitor water-quality changes in the alluvial aquifer, to identify threats to the water quality and productivity of the well field, and to devise mitigation strategies to protect the well field if it becomes necessary.
Purpose and Scope
This report summarizes the results of an analysis of water-quality data collected during 1997–2018 from 68 monitoring wells near the Independence, Mo., well field and a spigot that samples composite water pumped from the production wells that constitute the well field. These monitoring wells are open to the alluvial aquifer through a 5-foot screen at the bottom of the well. This report provides a general overview of the alluvial aquifer and the pumping history of the well field. Temporal trends in the concentration of selected constituents in each well during 1997–2018 are calculated. The analyses were designed to identify geochemical conditions in the alluvial aquifer, exceedances of water-quality standards, water-quality trends, and temporal and spatial changes to water quality. Potential changes to the monitoring program also are discussed. This report supports groundwater protection activities and provides resource managers and the public with information that can be used to develop a groundwater protection plan and identify potential threats to water quality in the alluvial aquifer.
Previous Investigations
To assess the potential for groundwater-quality degradation at the well field, the USGS and the City of Independence, Mo., completed a series of studies on groundwater flow and water quality near the well field (Kelly and Blevins, 1995; Kelly, 1996; Kelly, 2002a, b; Wilkison, 2012). The insights obtained from these studies were used to design the groundwater monitoring network to characterize water quality of the alluvial aquifer near the Independence well field (Kelly, 1996, 2002b11, 2011; Wilkison, 2012).
The well field draws water from the alluvial aquifer. The alluvial aquifer is composed of sand and gravel deposits that are present on both sides of the Missouri River. The alluvial aquifer is as much as 100 ft thick at the well field and is overlain by about 20 ft of clay, silt, and sand deposits (Kelly, 1996). The Missouri River has eroded through the silt and clay deposits and is in direct contact with the sand and gravel deposits (Kelly and Rydlund, 2006).
Groundwater flow in the alluvial aquifer within the model area identified in figure 1 and shown in figure 3 is generally from west to east in keeping with the gradient of the Missouri River, and the lowest groundwater levels are at the well field (Wilkison, 2012; fig. 3). Analysis of water-level data combined with groundwater flow models and isotopic mixing models determined that most of the water in the alluvial aquifer in the study area is derived from recharge from the Missouri River (fig. 4, table 2). This recharge occurs west of the well field at a bend in the river and at the well field. Recharge at the well field is enhanced by pumping from the production wells. This modeling does not differentiate between recharge from the river occurring west of the study area and recharge from the river occurring near the well field.
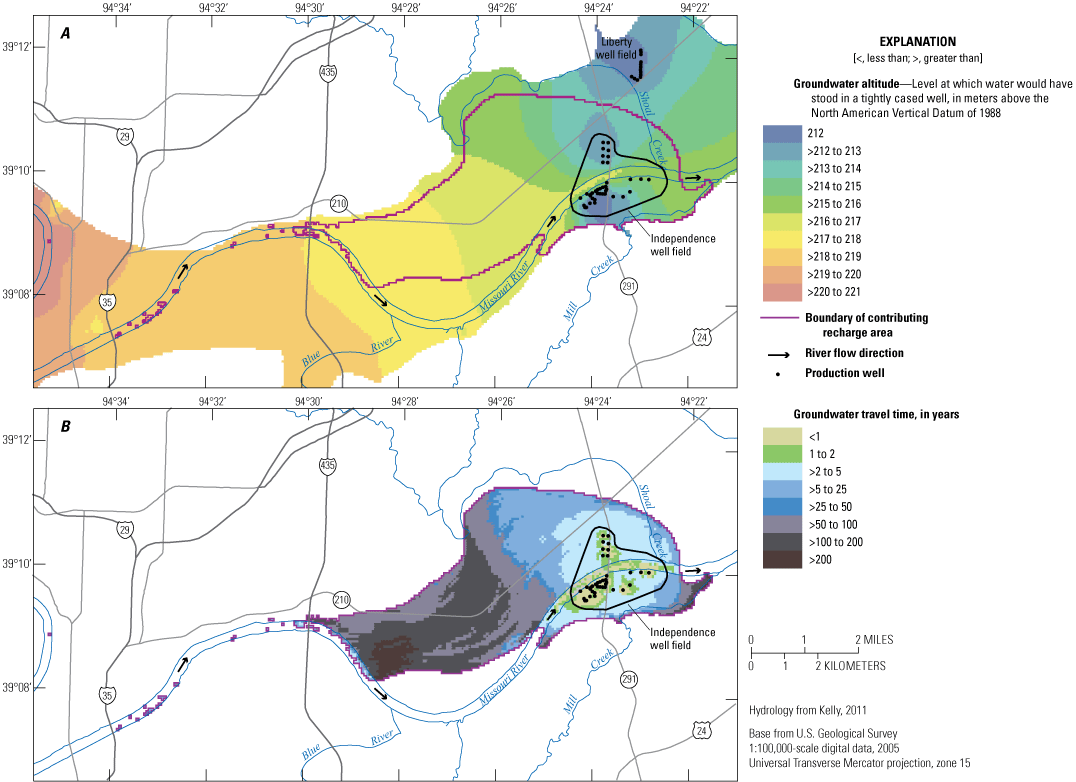
The contributing recharge area for the Independence well field, Missouri (modified from Wilkison, 2012). A, average water-level altitude; B, contributing recharge area and average groundwater travel times.
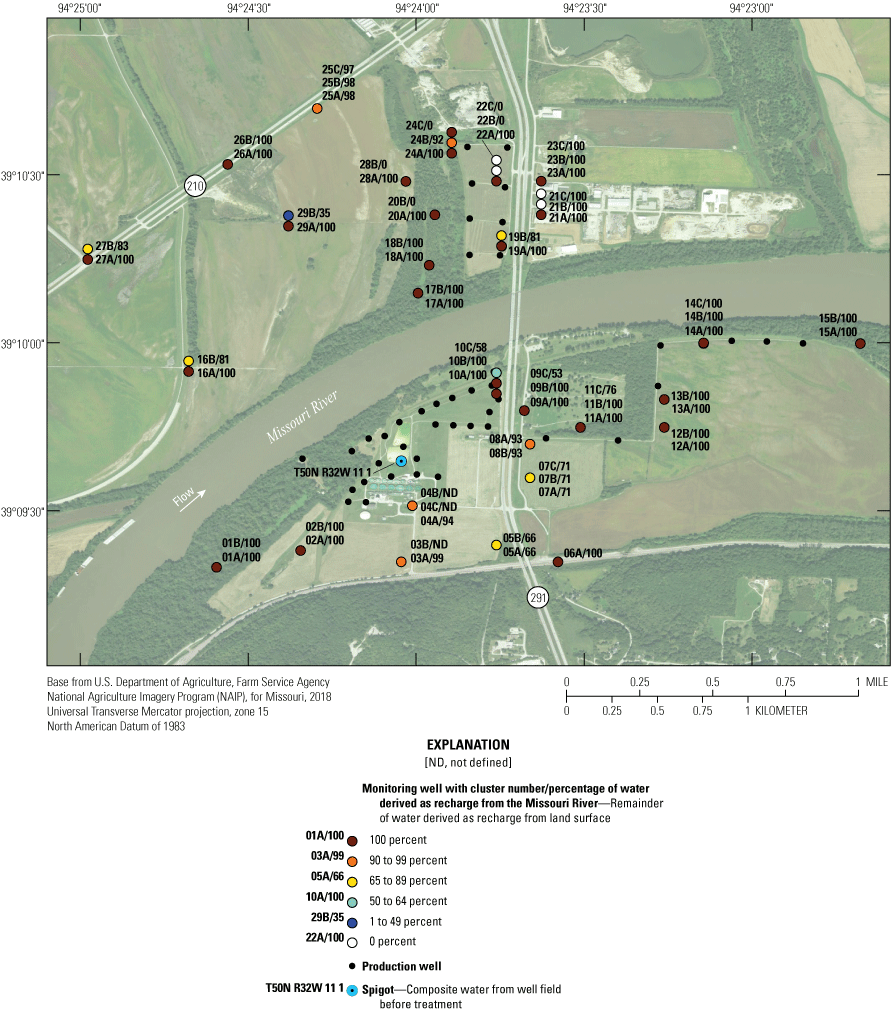
Percentage of groundwater recharge in monitoring well clusters derived from the Missouri River near the Independence well field, Missouri (percentage of water derived as recharge from Missouri River data from Kelly, 2011).
Table 2.
Simulated travel time (residence time) and percentage of water derived from the Missouri River at monitoring wells, Independence well field, Missouri.[Simulation results from Kelly, 2011]
Modeling completed by Kelly (2011) indicates that groundwater travels from the recharge areas to monitoring wells in the study area; the shortest travel time (about 2 years) occurs near the well field, and the longest travel time (more than 50 years) occurs west of the well field and north of the river (fig. 5, table 2). The time of groundwater travel is an indication of the amount of time the water is in the alluvial aquifer (travel time). As a general rule, waters with longer residence times tend to have higher concentrations of dissolved constituents than waters with shorter residence times (Hem, 1985).
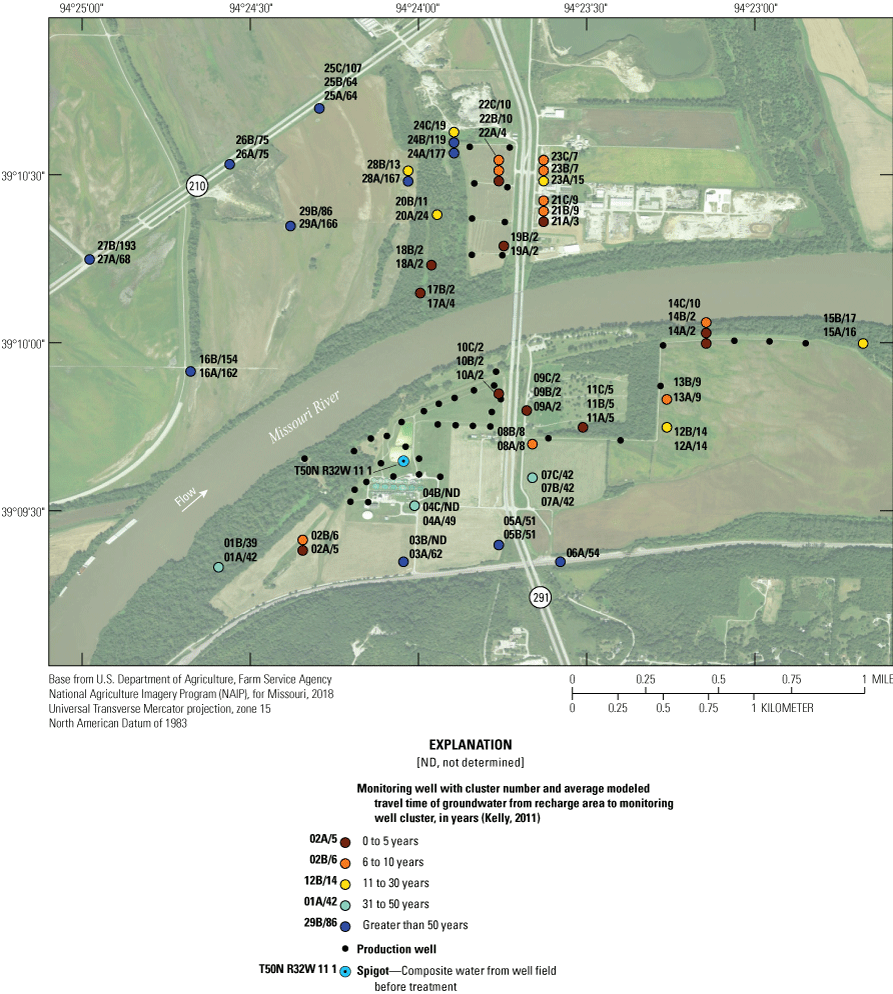
Average groundwater travel time from recharge area to monitoring well cluster at the Independence well field, Missouri (average simulated travel time of groundwater data from Kelly, 2011).
Recharge to the alluvial aquifer not derived from the river is derived from recharge of precipitation at the land surface (Kelly, 2011). In most of the alluvial aquifer, recharge from precipitation constitutes less than 10 percent of the water in the alluvial aquifer but is 7–100 percent of the water in much of the alluvial aquifer in the center of the study area near Route 291 and in the shallow part of the alluvial aquifer north of the river and west of the well field (fig. 4, table 2).
Riverbank infiltration removes or reduces the concentration of several chemical and biological constituents in the Missouri River before entering the alluvial aquifer (Kelly and Rydlund, 2006); however, low concentrations of volatile organic compounds (VOCs), pesticides, and herbicides were detected in some samples from some monitoring wells (Kelly, 2002b, 2011). Concentrations of barium greater than its U.S. Environmental Protection Agency [EPA] maximum contaminant level (MCL) and manganese, iron, and sulfate greater than their EPA secondary maximum contaminant levels (SMCLs) were detected in at least one sample (Kelly, 2002b, 2011).
The results of previous investigations indicate that water in the alluvial aquifer has the potential to be degraded by a variety of constituents applied at or near land surface above the alluvial aquifer and in recharge from the Missouri River. Recharge occurring from the river in the area of the well field is of concern because of the short time of travel from the river to parts of the well field. The type and frequency of sample collection at each monitoring well were based on assessment of the groundwater-quality data from the alluvial aquifer, the type of contamination each monitoring well is expected to intercept, groundwater travel time between the monitoring well and the well field, and the required time for adequate response to groundwater contamination if detected (Kelly, 2002a).
An evaluation of source-water contributions to monitoring and production wells, contributing recharge areas (CRAs), groundwater travel times, and water-quality conditions in the alluvial aquifer completed by Kelly (2011) was used to update the sampling effort in 2012 (Wilkison, 2012). This evaluation involved extensive groundwater modeling using particle tracking to estimate the CRA to each production well and monitoring well, the travel time (minimum, average, and maximum) from the CRA to each production well and monitoring well, and the travel time from each monitoring well to the production wells. The percentage of contribution from the Missouri River to each production well and monitoring well also was estimated. Based on this detailed groundwater modeling information and results of mixing modeling using stable isotopes, Wilkison (2012) developed a revised groundwater monitoring plan for the well field based on land use within the CRA of the well field, known or suspected areas of contamination, and estimated travel times from those potential sources to individual production wells and monitoring wells. This revision included changes to the wells monitored, the frequency of monitoring, and the analytes tested. The updated sampling plan was enacted in 2014.
Description of the Independence Well Field and Monitoring Wells
The well field is composed of 49 production wells north and south of the Missouri River (fig. 6). The first production well was constructed in 1955 and the number of production wells increased to 40 by 1994 (Karen Kelly, City of Independence Water Department, written commun., 2019; table 3). All wells constructed before 1994 are south of the Missouri River. No wells were drilled from 1994 through 1999. An additional nine wells were drilled from 2000 through 2015, eight of which are north of the river. During 1996–98 the well field pumped a total of about 25 million gallons of water per day (Mgal/d; fig. 7). Pumping increased overall to about 32 Mgal/d in 2003 before decreasing overall to about 26 Mgal/d in 2018.
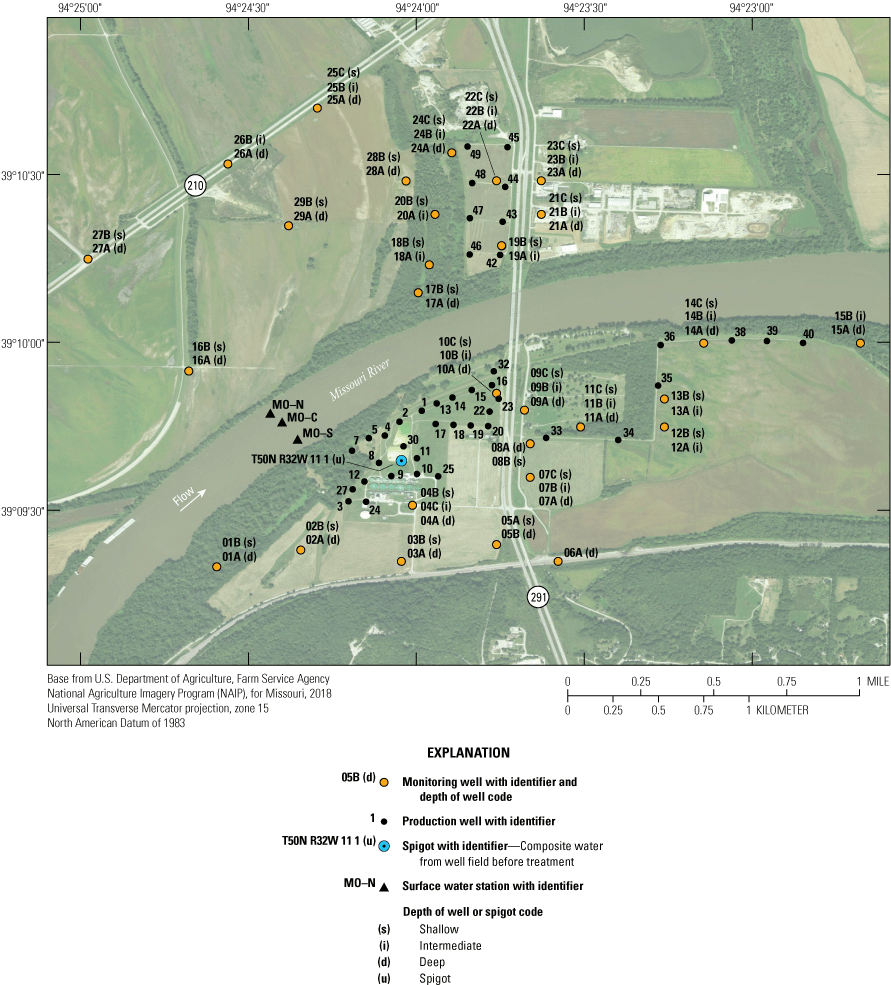
Location and identifier of monitoring and production wells, Independence well field, Missouri.
Table 3.
Production well information, Independence well field, Missouri (data from Karen Kelly, City of Independence Water Department, written commun., 2019).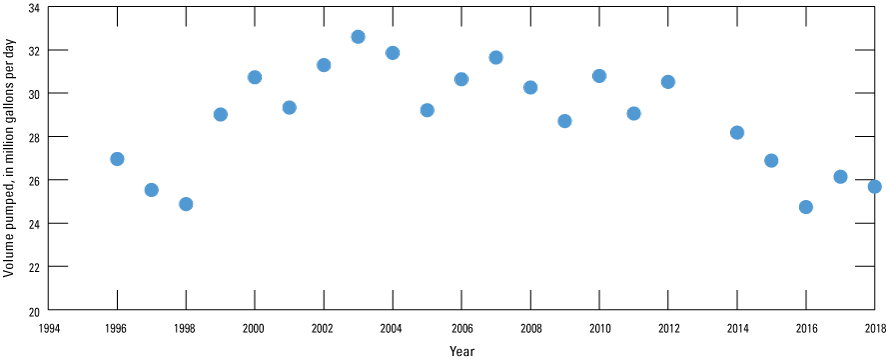
Volume of water pumped from Independence well field, Missouri, 1996–2018 (data from Karen Kelly, City of Independence Water Department, written commun., 2019).
As a consequence of the timing of well construction, water pumped from the well field before 2000 came from the production wells south of the river. From 2000 through 2018, water also was pumped from production wells north of the river so that water from the alluvial aquifer south of the river was a smaller percentage of the total withdrawals. Because the well field south of the river was pumped for a substantial period before 1997, the effects of recharge on water quality from the river to the alluvial aquifer south of the river likely were present throughout the 1997–2018 sampling period. Because the initiation of pumping from the wells north of the river encompasses most of the monitoring period, the effects of recharge from the river (relative to the existing water quality in the alluvial aquifer) on water quality north of the river would be expected to increase during 1997–2018.
The monitoring network consists of 68 wells at 28 locations near the well field and sample location T50N R32W 11 1, which is a spigot that samples composite water pumped from the production wells before treatment (fig. 6). At most locations, two or three clustered monitoring wells monitor different depths of the alluvial aquifer (table 1). The deepest well in the cluster typically is given the A designation. The B well typically corresponds to an intermediate depth if a C well is present in the cluster, or shallow depth if a C well is not present. The C well, if present, usually is the shallowest well in the cluster. Monitoring well clusters 1–15 are south of the river. Clusters 16–29 are north of the river. The monitoring network is designed to provide data that can be used to assess ambient water-quality conditions in the alluvial aquifer, to assess changes in water quality through time, and to identify sources of changes in water quality. This information can be used to verify the water pumped from the alluvial aquifer meets water-quality standards and is protective of human health.
Sample Collection, Laboratory Analysis, and Data Reporting
The USGS began collecting and analyzing water samples from monitoring wells near the Independence well field in 1997 (appendix 1, 2). Sample collection and analysis has continued through 2018. The number of samples collected ranged from as many as 30 nutrient samples at T50N R32W 11 1 to no samples of some analytes in several monitoring wells (table 4). Dissolved oxygen, major ions, and metals were sampled to understand general water-quality conditions, to identify sources of water in the alluvial aquifer, and to determine potential threats to the production wells. Nitrogen and phosphorous compounds were sampled to understand potential wastewater and agricultural effects on water quality. Reconnaissance sampling of organic compounds was used to screen for their occurrence and geographic distribution, to identify potential sources of groundwater contamination, and to assess potential effects of wastewater on groundwater quality.
Table 4.
Summary of analyte testing at the Independence well field, Missouri,1997–2018.[VOC, volatile organic compound; PAH, polynuclear aromatic hydrocarbon]
Sampling procedures followed established protocols described by the USGS National Field Manual (U.S. Geological Survey, variously dated). Temperature, dissolved oxygen, pH, turbidity, and specific conductance were measured at the well head immediately before sample collection. Samples were submitted to the USGS National Water Quality Laboratory in Denver, Colorado, or its contract laboratories for analysis. Samples of filtered and unfiltered water were analyzed for inorganic constituents, but only filtered (dissolved phase) analyses for the inorganic constituents are presented in this report.
Data Analysis
Water-quality data were compiled for each of the Independence monitoring wells sampled by the USGS during 1997–2018 from the USGS National Water Information System (NWIS) database (U.S. Geological Survey, 2019c). Summary statistics (maximum concentration, minimum concentration, median concentration, number of samples, and number of samples with exceedances of EPA regulatory criteria) were calculated for dissolved oxygen, nitrate plus nitrite as nitrogen, ammonia as nitrogen, orthophosphate, chloride, fluoride, antimony, arsenic, barium, beryllium, cadmium, chromium, copper, lead, selenium, thallium, uranium, iron, manganese, sulfate, and hardness (appendix 1). These constituents were chosen for analysis because they are indicators of the geochemical conditions in the alluvial aquifer, potential for formation of precipitates in the alluvial aquifer and at the production wells, sources of contamination in the alluvial aquifer, or areas where the Missouri River is recharging the alluvial aquifer. Piper plots (Piper, 1944) of the major ions (calcium, magnesium, sodium, potassium, alkalinity, sulfate, and chloride) also were done to identify general water chemistry, areas of recent (defined as a travel time [residence time] of 20 years or less based on the modeling of Kelly [2011]) recharge from the river, and effects of residence time on water quality. Many of these constituents also were chosen because they have EPA standards such as an MCL or an SMCL that enables identification of potential problems with the quality of the water extracted from the alluvial aquifer. The MCL is the maximum permissible level of a constituent in drinking water that can be delivered to a user by a public water system according to EPA regulations (U.S. Environmental Protection Agency, 2019a). These standards are established by considering the constituent’s effect on human health and what is technologically and economically feasible for its removal by a treatment facility. The SMCL is not a federally enforceable standard but is provided as a guideline for public water systems (U.S. Environmental Protection Agency, 2019b). The value of an SMCL is usually based on aesthetic considerations (odor, taste, and color) for the water.
When analyzing the data, results with a J or E qualifier were assumed to be the true values. A sample result with a J qualifier means that the reported result is an estimate and that the value is less than the minimum calibration level but greater than the estimated detection limit. A sample result with an E qualifier means that the sample result is an estimate and that the value exceeds the calibration range of the laboratory instrument for that analysis.
The maximum concentration was reported in appendix 1 when the constituent was tested for at least once in a well. When reporting the maximum concentration of a constituent, the maximum detected value was used. If the constituent was not detected in any sample from the well, its maximum concentration was reported to be less than the value of the greatest detection limit for the constituent in that well.
Minimum concentrations were reported when the constituent was tested for in at least two samples from a well. When reporting the minimum concentration for a constituent in a well, the smallest (of at least two) detected value was used if the detected value was less than the smallest detection limit for that constituent. If it was not, the minimum concentration was reported to be less than the smallest detection limit.
Median concentrations (the concentration separating the upper and lower halves of the dataset) were reported when the constituent was tested for in at least three samples. The median concentration was calculated using the techniques described by Helsel and Hirsch (2002). Median concentrations for constituents in which all samples were greater than the detection limit (uncensored data) were calculated using the standard method of ranking the values from smallest to greatest and identifying the middle number if the dataset has an odd number of values, or the average of the two middle numbers if the dataset has an even number of values. Median concentrations for constituents in which all sample results were less than the detection limit (censored data) were determined by ordering the detection limits from smallest to greatest and identifying the median detection limit if the number of samples was odd, or the detection limit of the higher of the two middle numbers if the number of samples was even. For constituents with a combination of censored and uncensored data with more than one-half of the results being uncensored, the results were ordered from smallest to greatest, valuing the censored samples at the detection limit. If the censored samples were all less than the median sample number, the median value was calculated using the standard method. If one or more censored values were greater than the median sample number, or if more than one-half of the values in the dataset were censored, the median value was calculated using a maximum likelihood estimator from the Nondetects and Data Analysis for Environmental Data package in the R statistical software (R Core Team, 2013). Note that use of the maximum likelihood estimator can result in the calculation of a median value that exceeds the maximum value or is less than the minimum value, particularly for analytes with a low frequency of detection and high or low detection limits relative to the values of the detections.
Trend analysis for every constituent with at least five detections in a well during the 1997–2018 period was completed by use of Kendall’s tau correlation with Sen’s slope tests (Helsel and Hirsch, 2002; Wessa, 2017). The magnitude of the trend and the probability value (p-value) is reported for all constituents. Trends with a p-value less than or equal to 0.05 are considered a rejection of the null hypothesis of the analysis that the data are statistically independent (the occurrence of a constituent value does not affect the probability of another value) to a significance level of at least 95 percent and, therefore, were considered to indicate a statistically significant trend.
Wells with at least three measurements of dissolved oxygen, nitrate plus nitrite as nitrogen, manganese, iron, and sulfate were characterized for geochemical conditions based on the analysis developed by Jurgens and others (2009). The reactions that define the geochemical conditions in the alluvial aquifer are generally facilitated by microorganisms, which gain energy by transferring electrons from donors (usually organic carbon) to acceptors (usually inorganic species) (McMahon and Chapelle, 2008). Because some electron acceptors provide more energy than others, electron acceptors that yield the most energy are used first and species that yield less energy are used in order of decreasing energy gain. This process continues until all the available donors or acceptors have been used. If carbon sources are not a limiting factor, geochemical conditions become increasingly more reducing with oxygen reduction, followed by nitrate reduction, manganese and iron reduction, then sulfate reduction and methane generation. Analysis of geochemical conditions identified the wells where conditions were oxic, anoxic, and mixed, as well as the most reducing conditions in the alluvial aquifer at the well. Because of the absence of analyses for the products of sulfate reduction, this assessment is incomplete.
Samples from many of the monitoring wells were analyzed for a variety of VOCs, semivolatile organic compounds (including phenolic compounds and polynuclear aromatic hydrocarbons), a variety of pesticides and herbicides and their degradates, and several of “emerging contaminants” (table 4). These constituents are collectively referred to as organic compounds in this report.
The number of individual organic compounds tested for often exceeded 100, and exceeded 300 in some wells. Organic compound samples collected before 2018 were analyzed for a variety of compounds listed by Kelly (2011). These analyses included more than 170 VOCs, pesticides, polynuclear aromatic hydrocarbons, and emerging contaminants detected at concentrations of micrograms per liter. The VOCs most often tested for as part of this investigation are benzene, toluene, ethylbenzene, xylene, and methyl tert-butyl ether. These compounds typically are components of gasoline. Several samples also were analyzed for a variety of chlorinated benzene, ethene, and ethane compounds. These VOCs typically are components of industrial solvents. VOC samples were collected during 2000–12 in most wells. The polynuclear aromatic hydrocarbons tested for as part of this investigation consisted of the 16 EPA priority pollutants (Keith, 2015). Polynuclear aromatic hydrocarbon samples were collected from 2004 to 2012 in most wells. Beginning in 2018, an expanded suite of 229 organic compounds were analyzed in 13 of the monitoring wells and T50N R32W 11 1 in response to the updated sampling proposed by Wilkison (2012). The sampling regimen is to be rotated so that all monitoring wells scheduled to be tested for the expanded suite of analytes will be sampled every 3 years. The expanded suite, referred to as USGS schedule 2437, includes pesticides, herbicides, their byproducts, and emerging contaminants (Shoda and others, 2018). The reporting levels for most of these 229 compounds were in concentrations of nanograms per liter.
Because of the large number of organic compounds tested for in some wells and the absence of testing for organic compounds in other wells, the differences in the types of compounds tested for, and the variable detection limits of the analytes, a summary of the organic compounds detected in each well is provided in appendix 2 rather than a description of the results of the individual compounds. Because many organic constituents were only tested for in one sample from a well, and almost every constituent with multiple samples was detected in a small percentage of the samples, organic data were not subjected to statistical analysis.
Results of USGS water-quality sampling from the Missouri River at Sibley (USGS streamgage 06894100; hereafter referred to as the “Sibley site”) during 2008–18 were compiled from the NWIS database and analyzed for median concentrations of selected inorganic constituents. No samples were collected from the Sibley site during 1997–2007. The Sibley site is about 10 river miles (mi) downstream from the well field and is the closest location to the well field where the Missouri River has been sampled for multiple years and for most of the same inorganic constituents as the monitoring well network.
Samples from the Sibley site were not analyzed for organic compounds; however, stream sites 390947094242600 Missouri River at Independence - North (MO–N on fig. 6), 390945094242400 Missouri River at Independence - Middle (MO–C), and 390942094242100 Missouri River at Independence – South (MO–S), located northwest of the well field on the south side of the river, each had one sample analyzed for organic compounds in 2003. Because there was little data from these sites, organic compound data from the Missouri River at Omaha, Nebraska (USGS streamgage 06610000), and Hermann, Mo. (USGS streamgage 06934500), during 2012–19 were used to supplement the analysis of organic compounds in the river (U.S. Geological Survey, 2019c). These are the closest sites to the study area where substantial sampling of the Missouri River for organic compounds has been done. Omaha is about 200 mi upstream from Independence. Hermann is about 160 mi downstream from Independence. Data from the river were used to help assess if recharge from the river was affecting the chemistry (organic and inorganic) of groundwater at the well field and in the rest of the alluvial aquifer in the study area.
The median concentration of selected constituents in the alluvial aquifer within the study area was evaluated, and areas where constituent concentrations were greater than or less than a level of interest at any point within the alluvial aquifer were highlighted. This analysis provides insight into parts of the alluvial aquifer where there are threats to water quality, areas of geochemical interest, or areas of potential inflow from the Missouri River. Contours were based on the maximum concentration of ammonia, iron, manganese, orthophosphate, arsenic, or barium, or the minimum concentration of sulfate, hardness, or chloride at a well cluster, and do not necessarily reflect the maximum or minimum concentration throughout the depth of the alluvial aquifer at a location.
The representation of the statistical data is complicated by differences in the number of analytes tested in samples from each well, differences in the number of samples for a given compound between wells, and differences in the period of data collection (table 4). Many of the wells have only a few samples collected with large gaps in time between sampling events. These differences could result in bias of the smaller datasets toward potentially nonrepresentative conditions for the 1997–2018 period. In addition, data from most of the wells with a large number of sampling events tend to be skewed towards the earlier part of the sampling period; for example, well 01B, which has a robust sample set, was sampled three times per year from 1997 through 2000, then about annually from 2002 through 2018. These differences could result in bias of the larger datasets toward emphasis of conditions during the early part of the 1997–2018 period.
Water Quality near the Independence Well Field
The concentration of a constituent in groundwater is affected by its availability to dissolve from the geologic materials in contact with the water, anthropogenic application or disposal of materials containing the constituents, its presence in the source of the groundwater, and the geochemical conditions in the alluvial aquifer (U.S. Geological Survey, 2019b). The discussion of water quality is done within the context of the CRA of various monitoring wells and estimated time from recharge to the well based on results of groundwater flow modeling (Kelly, 2011). The discussion begins with those constituents that characterize the general water quality of the alluvial aquifer near the Independence well field—Piper plots of the major ions, followed by discussion of constituents that are commonly used to assess the oxidizing-reducing potential or “redox” of the groundwater: dissolved oxygen, nitrate plus nitrite as nitrogen, ammonia as nitrogen, iron and manganese, and sulfate. The analysis then provides a discussion of hardness, chloride, orthophosphate, and the trace metals. The final sections focus on the occurrence of organic compounds in the alluvial aquifer. Differences in the concentrations of the various compounds with respect to CRA and estimated recharge age for monitoring wells are examined in addition to spatial and temporal trends in concentrations. Examination of the water-quality data provides insight into the presence and sources of contamination in the alluvial aquifer (if any), the effects of recharge from the Missouri River on groundwater quality, and potential causes of concern for the potability of the water extracted from the well field.
Major Ions
The major ions are those constituents typically present at the highest concentrations in the sample. For the purposes of this report, the major ions consist of calcium, magnesium, sodium, potassium, bicarbonate, carbonate, sulfate, chloride, and fluoride. Although discussed here as part of the major ions, chloride, fluoride, and sulfate also are discussed individually in later sections of this report to provide additional insight into geochemical conditions, sources of water in the alluvial aquifer, and threats to water quality. Median concentrations of the major ions for the monitoring wells with appropriate data, the Sibley site, and the composite water from the well field collected at T50N R32W 11 1 were plotted on a Piper diagram (fig. 8). Piper diagrams graphically illustrate the relative percentage of the electrical change associated with the major ions in a water sample (Piper, 1944). The diagrams consist of separate ternary plots of the major cations (calcium, magnesium, sodium, and potassium) and anions (bicarbonate and carbonate, sulfate, chloride, and fluoride) along with a diamond plot that integrates both groups of ions. Carbonate concentrations in these wells are less than 1 milligram per liter (mg/L), which is inconsequential in comparison to bicarbonate concentrations. For this reason, carbonate is not considered in these analyses. These plots can be used to evaluate spatial changes in water chemistry that may be affected by the source of water in the sample and interactions with the alluvial aquifer matrix. The plots also can be used to evaluate simple mixing scenarios of two waters of differing major-ion composition, which will plot along a straight line between the endmembers if the ions in the mixture do not chemically react as a result of the mixing (Hem, 1985).
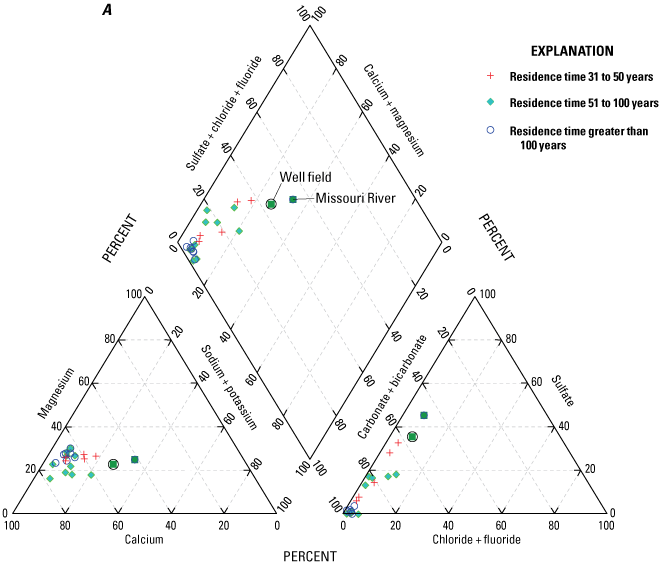
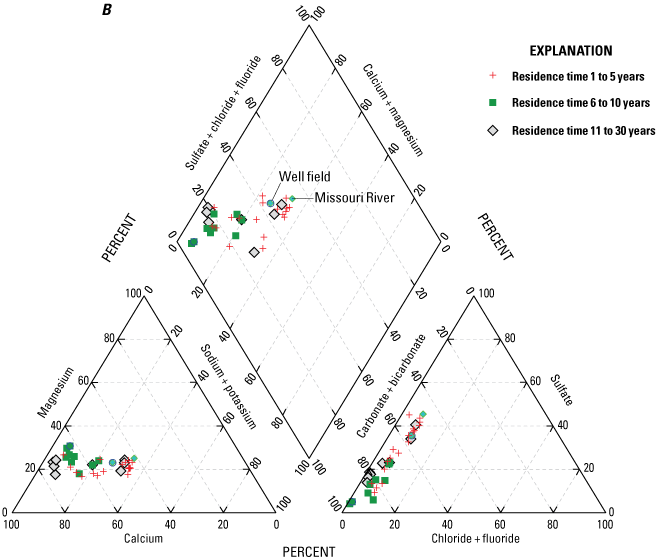
Median concentrations of major ions in the Missouri River, well-field composite samples from production wells, and monitoring wells at the Independence well field, Missouri, relative to the residence time of water in the alluvial aquifer at the monitoring wells, 1997–2018. A, for residence times of 31 to more than 100 years; B, for residence times of 1 to 30 years.
The Piper diagram indicates the Missouri River and the combined water samples from the production wells at T50N R32W 11 1 have similar chemistry (fig. 8A, B), and cations consist of about 45-percent calcium, 25-percent magnesium, and 30-percent sodium and potassium; anions consist of about 10-percent chloride, about 40-percent bicarbonate, and about 50-percent sulfate. These data points indicate the water extracted from the well field is primarily derived from pumping-affected recharge from the Missouri River, which is consistent with the results of previous investigations that indicate about 80 percent of the water extracted from the production wells originates from the Missouri River (Kelly, 2002b; Wilkison, 2012).
The monitoring well data were plotted based on the residence time in the alluvial aquifer as simulated by Kelly (2011). Wells were grouped into residence times of 1–5 years, 6–10 years, 11–30 years, 31–50 years, 51–100 years, and more than 100 years (table 2; figs. 8A, B). The wells had fairly consistent amounts of chloride, potassium, and magnesium, but were differentiated based on variations in the amounts of sulfate, bicarbonate, calcium, and sodium.
Analysis of trends in the major-ion chemistry with water residence time in the alluvial aquifer indicates that monitoring wells with residence times of more than 100 years plotted at the left margin of the Piper diagram (fig. 8A). Bicarbonate constitutes more than 90 percent of the anions (little or no sulfate and chloride), and calcium and magnesium (primarily calcium) constitute more than 90 percent of the cations in these wells. These wells are north of the river and west of the well field (fig. 5). Water quality at these wells reflects the composition of the alluvial aquifer where there is no recent recharge from the river under the effect of pumping from the well field, substantial interaction between groundwater and the alluvial aquifer matrix, and the possible presence of sulfate-reducing geochemical conditions.
Monitoring wells with water residence times of 1–5 years indicated substantial variation, ranging from nearly identical to the Missouri River to plotting near the left (minimal sulfate and sodium) edge of the diagram (fig. 8B). These wells are within or on the periphery of the well field (fig. 5) where there is substantial recent recharge from the river induced by pumping from the well field. Water quality at these wells seems to reflect a mixture of waters ranging from unaltered recent recharge from the river to waters with substantial interaction with the alluvial aquifer matrix and possibly sulfate-reducing geochemical conditions.
Wells with residence times of 6–100 years plotted between the Missouri River and the wells with a residence time more than 100 years. These patterns reflect varied amounts of sulfate (0–40 percent) relative to bicarbonate (62–98 percent) and sodium and potassium (4–31 percent) relative to calcium and magnesium (79–96 percent) in these wells (fig. 8A, B). Water quality at these wells also seems to reflect a mixture of waters ranging from nearly unaltered recent recharge from the river to water with substantial interaction with the alluvial aquifer matrix and possibly some areas of sulfate-reducing conditions.
These changes in concentration are supported by boxplots of the major-ion concentration data for the Missouri River, the composite samples from the production wells, and the monitoring wells broken down by residence time in the alluvial aquifer (fig. 9). Median concentrations of calcium and bicarbonate indicate similar trends and are substantially higher in the monitoring wells than in the river water and the composite water from the production wells. Monitoring wells with simulated groundwater residence times of less than 31 years have somewhat lower median concentrations of calcium and bicarbonate than those wells having a residence time of greater than 30 years. Median concentrations of sodium indicate an overall decrease from the river water to the water extracted from the production wells to monitoring wells with simulated residence times of more than 100 years. Median concentrations of sulfate indicate a decrease from the river water to the water extracted from the production wells to the monitoring wells. Median concentrations of sulfate are generally consistent between the simulated residence time in the monitoring wells, with the exception of the low concentration associated with the simulated residence times of more than 100 years. Median concentrations of chloride, magnesium, and potassium indicate comparatively small variations with the residence time in the monitoring wells and between the monitoring wells and the river and the production wells. Although the total variation in median chloride concentrations between groupings is small (less than 13 mg/L), median concentrations of chloride are lower at the monitoring wells with residence times of 11 years or more than at the Missouri River, in discharge from the production wells, and at the monitoring wells with residence times of 10 years or less.
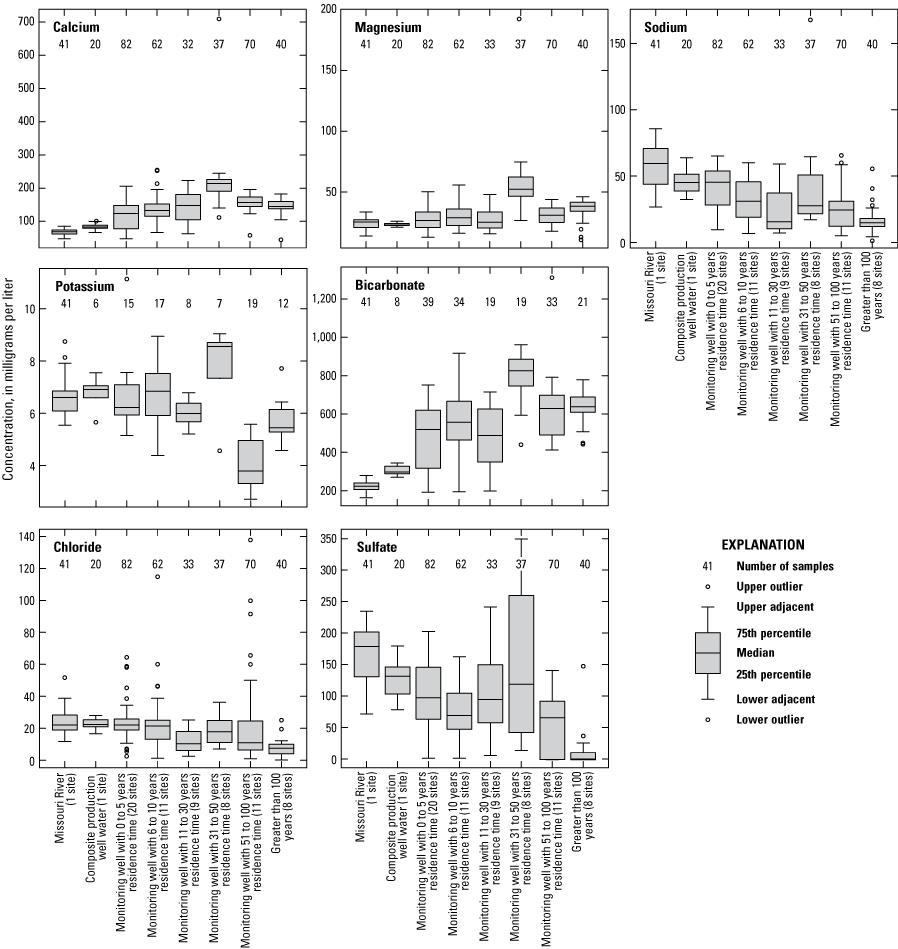
Concentrations of major ions in the Missouri River, well-field composite samples from production wells, and monitoring wells at the Independence well field, Missouri, relative to the residence time of water in the alluvial aquifer at the monitoring wells, 1997–2018.
Major-ion chemistry in the discharge from the production wells is similar to that of the Missouri River because of recharge from the river to the groundwater system induced by pumping at the well field. This interpretation supports interpretations based on groundwater modeling (Kelly, 2011). Major-ion chemistry in the alluvial aquifer at the monitoring wells ranges from similar to that of the Missouri River to water characterized by little or no sulfate. Excepting low-sulfate water associated with monitoring wells having groundwater residence times more than 100 years and some wells with residence times of 5 years or less having major-ion chemistry similar to that of the river, there are no consistent differences in major-ion chemistry with residence time.
Dissolved Oxygen
Water exposed to the atmosphere, either surface water or precipitation, contains dissolved oxygen. When oxygenated water enters the groundwater system, it is isolated from the atmosphere. Once in the groundwater, dissolved oxygen is consumed by a variety of chemical reactions, commonly biologically mediated, which typically results in low concentrations of dissolved oxygen. Water with a concentration of dissolved oxygen greater than about 0.5 mg/L is considered oxic, whereas water with a dissolved oxygen concentration of less than 0.5 mg/L is considered anoxic (Wiedemeier and others, 1998; Jurgens and others, 2009). Once dissolved oxygen is consumed, microorganisms use other constituents such as nitrogen, manganese, iron, and sulfur.
The concentration of dissolved oxygen can affect the concentration of several organic and inorganic constituents in groundwater (Holm and others, 1986; Stumm and Morgan, 1995; Wiedemeier and others, 1998; Smedley and Kinniburgh, 2002). Consequently, understanding the spatial distribution of dissolved oxygen concentrations can provide insight into the factors affecting the concentration of other constituents.
The median concentration of dissolved oxygen in 122 samples collected from the Sibley site during 2008–18 was 9.3 mg/L, indicating the river water was oxic. Concentrations of dissolved oxygen at the Sibley site indicated seasonal variations as high as 17.5 mg/L during the winter and as low as 3.9 mg/L during the summer (fig. 10).
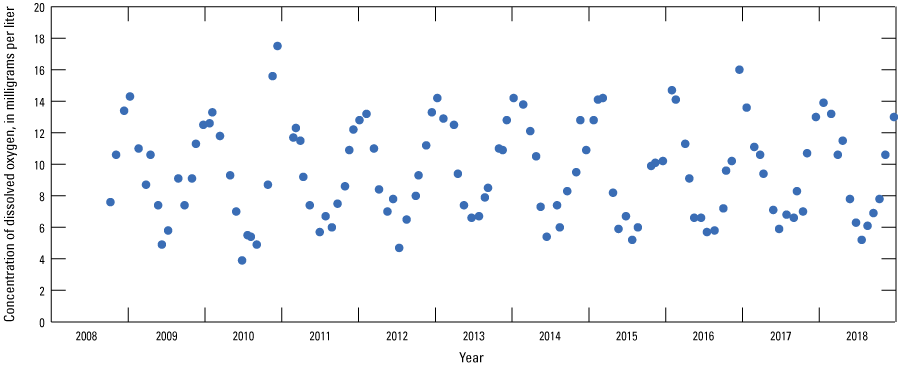
Concentrations of dissolved oxygen in the Missouri River at Sibley, Missouri (U.S. Geological Survey station 06894100; U.S. Geological Survey, 2019c), 2008–18.
The median concentration of dissolved oxygen in samples collected from the monitoring well network during 1997–2018 was less than 1.0 mg/L in every well except 12A and 22A and was less than 0.5 mg/L in most of the alluvial aquifer (fig. 11). Wells 12A and 22A are not near the river, have a small dataset (table 4), receive no water from recharge at the land surface (table 2), and have low to moderate residence time in the alluvial aquifer (14 and 4 years, respectively, according to modeling done by Kelly [2011]), which is longer than several other wells with shorter residence times closer to the river that have lower median values of dissolved oxygen. Wells 12A and 22A might have lower median values of dissolved oxygen if more measurements were made from these wells. Dissolved oxygen values indicate that groundwater in the alluvial aquifer typically is anoxic (table 5). The low dissolved oxygen values in the alluvial aquifer relative to the Missouri River indicate that the dissolved oxygen in the river water recharging the alluvial aquifer is consumed by geochemical and biologic reactions within a short distance of the river-alluvial aquifer boundary.
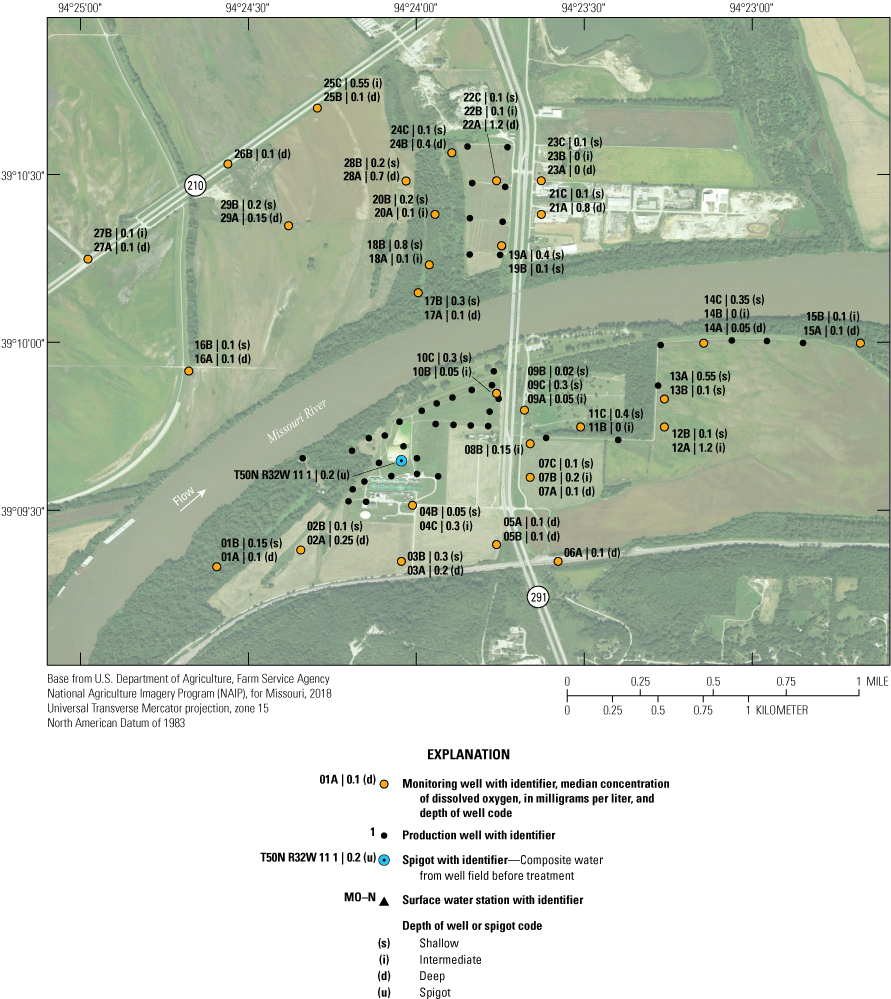
Median concentrations of dissolved oxygen in monitoring wells and well-field composite samples from production wells at the Independence well field, Missouri, 1997–2018.
Table 5.
Oxidation-reduction status of monitoring wells, Independence well field, Missouri, 1997–2018.Concentrations of dissolved oxygen were too low, and changes were too small relative to the precision of the measurement method, to be analyzed for trends in concentration during the monitoring period. The fact that concentrations of dissolved oxygen are low throughout the alluvial aquifer for the 20-year duration of the monitoring period indicates stable, anoxic conditions.
Assessment of concentrations of dissolved oxygen with residence time in the alluvial aquifer indicates median concentrations were near 0.5 mg/L throughout the alluvial aquifer but the 75th-percentile values were slightly higher for composite water samples extracted from production wells in the well field (T50N R32W 11 1) and monitoring wells with a residence time of 5 years or less than for the monitoring wells with longer residence times (fig. 12A). These data indicate that dissolved oxygen levels in those parts of the alluvial aquifer most affected by recent recharge from the river occasionally have slightly elevated concentrations of dissolved oxygen, possibly in response to periods of exceptionally high recharge because of elevated pumping or high river stage. Assessment of concentrations of dissolved oxygen with percentage of recharge from the Missouri River does not indicate any difference in data distribution (fig. 12B).
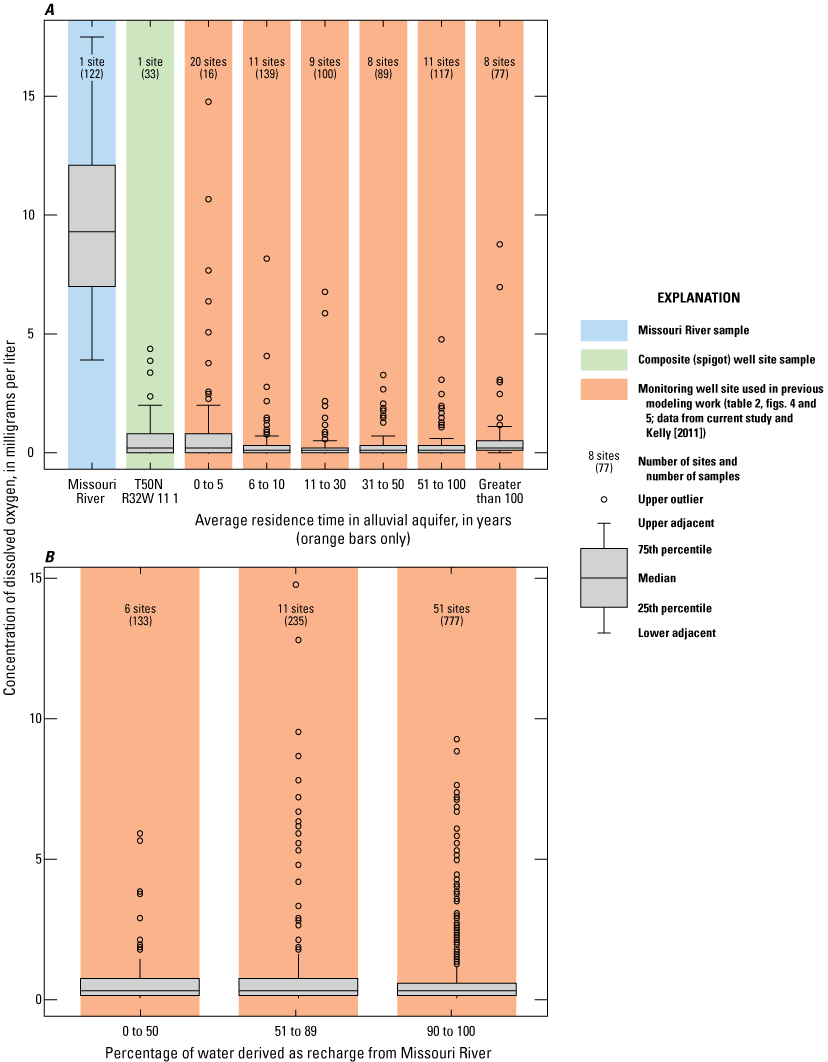
Concentrations of dissolved oxygen in the Missouri River at Sibley (U.S. Geological Survey station 06894100), well-field composite samples from production wells, and monitoring wells at the Independence well field, Missouri. A, relative to the residence time of water in the alluvial aquifer; B, relative to the percentage of water derived from recharge from the Missouri River, 1997–2018.
Median concentrations of dissolved oxygen were less than 0.5 mg/L in most of the alluvial aquifer. Oxygen in recharge from the Missouri River seems to be consumed within a short distance of entering the alluvial aquifer.
Nitrogen Compounds
Nitrate (NO3−), nitrite (NO2−), and ammonia (NH3) are naturally occurring compounds, but large quantities are produced anthropogenically by the breakdown of human waste and as a component of fertilizer (U.S. Geological Survey, 1999). The predominate nitrogen compound in groundwater is typically either nitrate or ammonia. The form of the nitrogen compound is affected by the geochemical and microbiotic environment. Microbiota can convert nitrate to ammonia in waters with low (commonly less than 0.5 mg/L) concentrations of dissolved oxygen and can convert ammonia to nitrate and nitrite in water with elevated concentrations of dissolved oxygen (McMahon and others, 2011). There are no regulatory standards for ammonia concentrations in groundwater. The MCL for nitrate as nitrogen is 10 mg/L (U.S. Environmental Protection Agency, 2019a). The MCL for nitrite as nitrogen is 1 mg/L (U.S. Environmental Protection Agency, 2019a).
The median concentration of nitrate plus nitrite as nitrogen in 122 samples from the Sibley site was 1.75 mg/L. The median concentration of ammonia as nitrogen in these samples was 0.06 mg/L. Concentrations of dissolved ammonia as nitrogen indicated seasonal variability in the Missouri River during 2008–18, typically being highest during January and February and lowest during the summer and early fall (fig. 13; U.S. Geological Survey, 2019c). Nitrate plus nitrite as nitrogen concentrations in the Missouri River during 2008–18 were more sporadic but typically were highest during March through May and lower during the late summer and early fall (fig. 13; U.S. Geological Survey, 2019c).
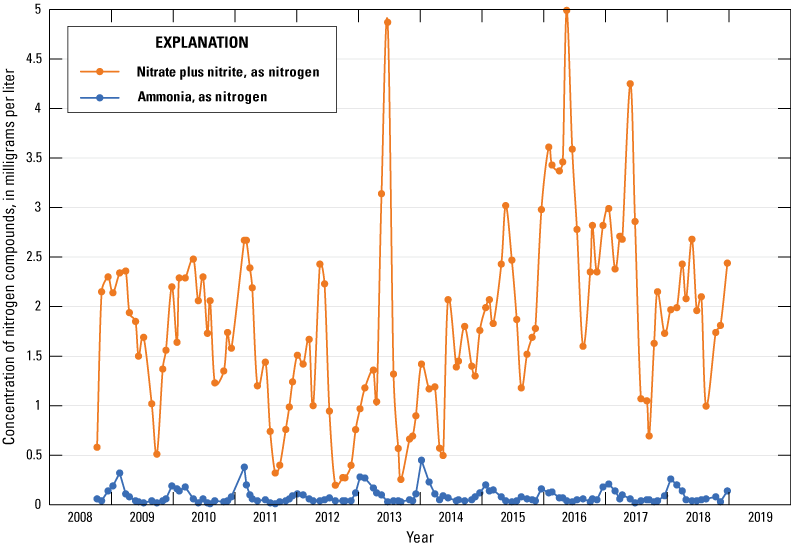
Concentrations of nitrogen compounds in the Missouri River at Sibley, Missouri (U.S. Geological Survey station 06894100; U.S. Geological Survey, 2019c), 2008–18.
The median concentration of nitrate plus nitrite as nitrogen in samples collected from the monitoring network during 1997–2018 was typically less than the limit of detection (0.06 mg/L or less; fig. 14). Median concentrations greater than the limit of detection but less than 1.0 mg/L were detected at wells 03B, 20B, 23B, 24C, 28B, and 29B and at T50N R32W 11 1 (appendix 1). With the exception of T50N R32W 11 1 and 23B, these are all shallow wells open to the upper part of the alluvial aquifer in pasture or forest land away from the well field, and mostly on the north side of the river. The residence time of water in the alluvial aquifer at monitoring wells 03B, 20B, 23B, 24C, 28B, and 29B ranged from 7 to 86 years, and the percentage of recharge from the Missouri River ranged from 0 to 100 (table 2), indicating that nitrate concentrations are affected by local geochemical conditions rather than residence time and water sources. No sample concentrations exceeded the MCL for nitrate plus nitrite as nitrogen.
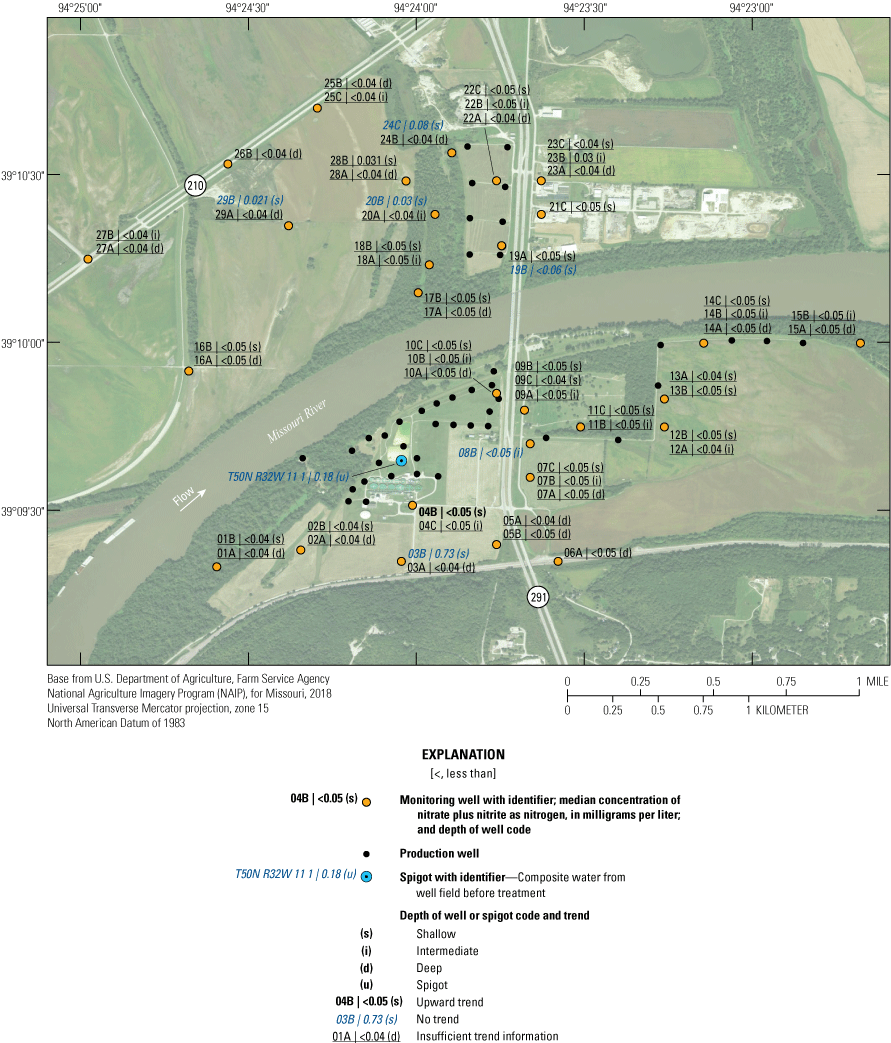
Median concentrations and temporal trends in concentration of nitrate plus nitrite as nitrogen in monitoring wells and well-field composite samples from production wells at the Independence well field, Missouri, 1997–2018.
Because of the lack of detections, there were insufficient data to identify trends in the concentration of nitrate plus nitrite as nitrogen in most of the wells during 1997–2018 (fig. 14). For those wells where detectable concentrations were present, concentrations of nitrate plus nitrite as nitrogen did not demonstrate a statistically significant change through time.
The median concentration of ammonia as nitrogen in samples collected from the monitoring well network during 1997–2018 exceeded 1.0 mg/L at wells 01A, 01B, 02A, 02B, 10C, 12B, 13B, 16B, and 17B (fig. 15). Most of these locations are in pasture land on the periphery of the well field. The residence time of water in the alluvial aquifer at monitoring wells 01A, 01B, 02A, 02B, 10C, 12B, 13B, 16B, and 17B varied from 2 to 154 years, and the percentage of recharge from the Missouri River varied from 58 to 100 (table 2), indicating that ammonia concentrations are primarily affected by local geochemical conditions rather than residence time and water sources. Concentrations of ammonia as nitrogen were substantially higher than those of nitrate plus nitrite as nitrogen in almost every well. The prevalence of ammonia relative to nitrate plus nitrite in the groundwater near the well field indicates that conditions in most or all the alluvial aquifer in the study area favor nitrate reduction. This conclusion is supported by the analysis of oxidation-reduction status at the monitoring wells provided in table 5.
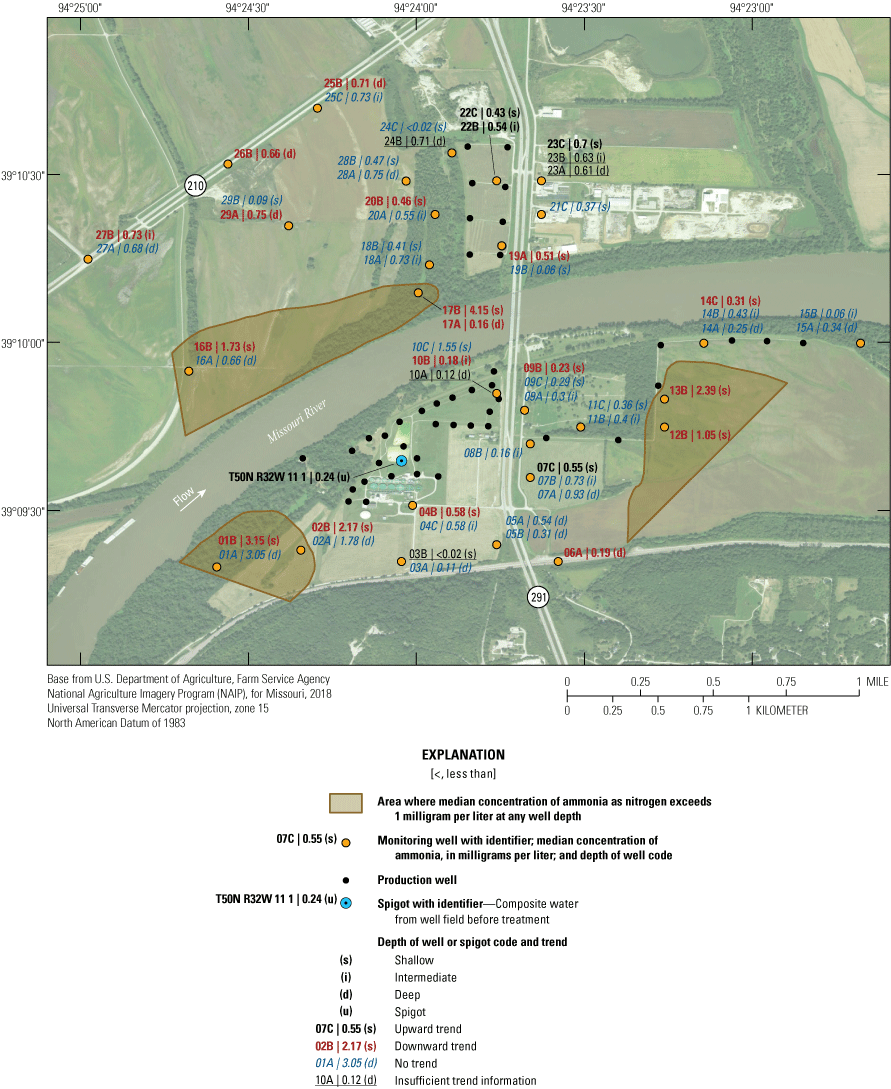
Median concentrations and temporal trends in concentration of ammonia as nitrogen in monitoring wells and well-field composite samples from production wells at the Independence well field, Missouri, 1997–2018.
Concentrations of ammonia as nitrogen indicated a statistically significant increase from 1997 through 2018 in wells 07C, 22B, 22C, and 23C and at T50N R32W 11 1 (fig. 15). These are primarily shallow wells that tend to be near, or draw water from, the well field. The total magnitude of this change had a maximum value of about 1 mg/L. The presence of increasing concentrations of ammonia near the well field and in the water discharged from the production wells may indicate that nitrate in the recharge from the Missouri River is being converted to ammonia in the alluvial aquifer where there is substantial recent recharge from the river to the alluvial aquifer.
A statistically significant decrease in the concentration of ammonia as nitrogen during 1997–2018 was identified in wells 01B, 02B, 04B, 06A, 09B, 10B, 12B, 13B, 14C, 16B, 17A, 17B, 19A, 20B, 25B, 26B, 27B, and 29A. These are predominately shallow wells that are present south of the river and a mixture of shallow and deep wells present west of the well field north of the river. The total magnitude of this change had a maximum value of about 1 mg/L, and the concentrations in wells 04B, 06A, 10B, and 17A decreased to near the detection limit by 2018.
Ammonia concentrations did not indicate a statistically significant change through time in about one-half of the wells in the study area. Many of these wells are clustered with wells where a decrease (and one well cluster with an increase) in concentration was identified in a different part of the alluvial aquifer (fig. 15). These data indicate that the alluvial aquifer is heterogeneous with respect to ammonia geochemistry.
Composite samples from the well field collected at T50N R32W 11 1 were somewhat elevated in nitrate plus nitrite as nitrogen in comparison to concentrations in monitoring wells open to the rest of the alluvial aquifer. Water from T50N R32W 11 1 and some monitoring wells near the well field also indicated an increase in the concentration of ammonia as nitrogen during monitoring. These phenomena may reflect recharge of water with higher nitrogen (as nitrate plus nitrite) from the Missouri River into the alluvial aquifer near the well field and conversion of some part of that nitrate plus nitrite to ammonia in the alluvial aquifer. The presence of detectable concentrations of nitrate plus nitrite as nitrogen in the samples from the production wells indicates this conversion may not be complete in that part of the alluvial aquifer near the production wells. The concentration of nitrate plus nitrite as nitrogen in the alluvial aquifer is too low to be a cause for concern for the potability of the water extracted from the well field.
Manganese and Iron
Manganese and iron are naturally occurring ions that typically are present in groundwater because of the dissolution of manganese or iron oxide or sulfide minerals in geologic deposits. In geochemically reducing groundwater, manganese and iron primarily exist in their soluble forms, Mn2+ and Fe2+, resulting in high concentrations of these compounds in the water (Wiedemeier and others, 1998). In an oxidizing environment, manganese (Mn4+) and iron (Fe3+) will precipitate, resulting in low concentrations of these compounds in the water. Manganese has an SMCL of 0.050 mg/L (U.S. Environmental Protection Agency, 2019b). Iron has an SMCL of 0.300 mg/L (U.S. Environmental Protection Agency, 2019b). The SMCL for these compounds is based on the color and taste they can impart to water at concentrations greater than these limits.
The median concentration of dissolved manganese in 41 samples from the Sibley site was 0.002 mg/L. The median concentration of dissolved iron in these samples was 0.009 mg/L. These low values are affected by the oxic conditions in the river water.
The concentration of manganese in samples collected from the monitoring network during 1997–2018 exceeded the SMCL in almost every sample (appendix 1). Only wells 09C, 19B, 20A, 23C, and 24C had at least one sample with a concentration less than the SMCL. Every well had a median concentration of manganese at or greater than the SMCL. These exceedances indicate that geochemical conditions in most or all of the alluvial aquifer in the study area favor manganese reduction (table 5).
The median concentration of manganese in samples collected from the monitoring network during 1997–2018 was greater than 1.0 mg/L at wells 01A, 01B, 02A, 03A, 16B, 20A, 28B, and 29B (fig. 16). These wells are west or south of the well field and typically have groundwater residence times more than 20 years (fig. 5, table 2), indicating the potential for chemical interaction with the alluvial aquifer material. Conversely, concentrations of manganese tend to be 0.50 mg/L or less near the well field and in the northern part of the study area. Some, but not all, of the area with low manganese concentrations has a short groundwater residence time and a substantial amount of recent recharge from the Missouri River. Although manganese concentrations in groundwater are elevated with respect to the Missouri River, they indicate no clear patterns with residence time in the alluvial aquifer (fig. 17A), indicating that geochemical conditions and the availability of manganese in the alluvial aquifer materials are affecting concentrations. Median concentrations of manganese tend to decrease with increasing percentage of recharge from the river (fig. 17B). Low-manganese recharge from the river may be affecting concentrations in parts of the alluvial aquifer near the well field by reducing the amount of manganese in the water and producing less intensive manganese-reducing conditions in the alluvial aquifer relative to those parts of the alluvial aquifer where recent recharge from the river is not present.
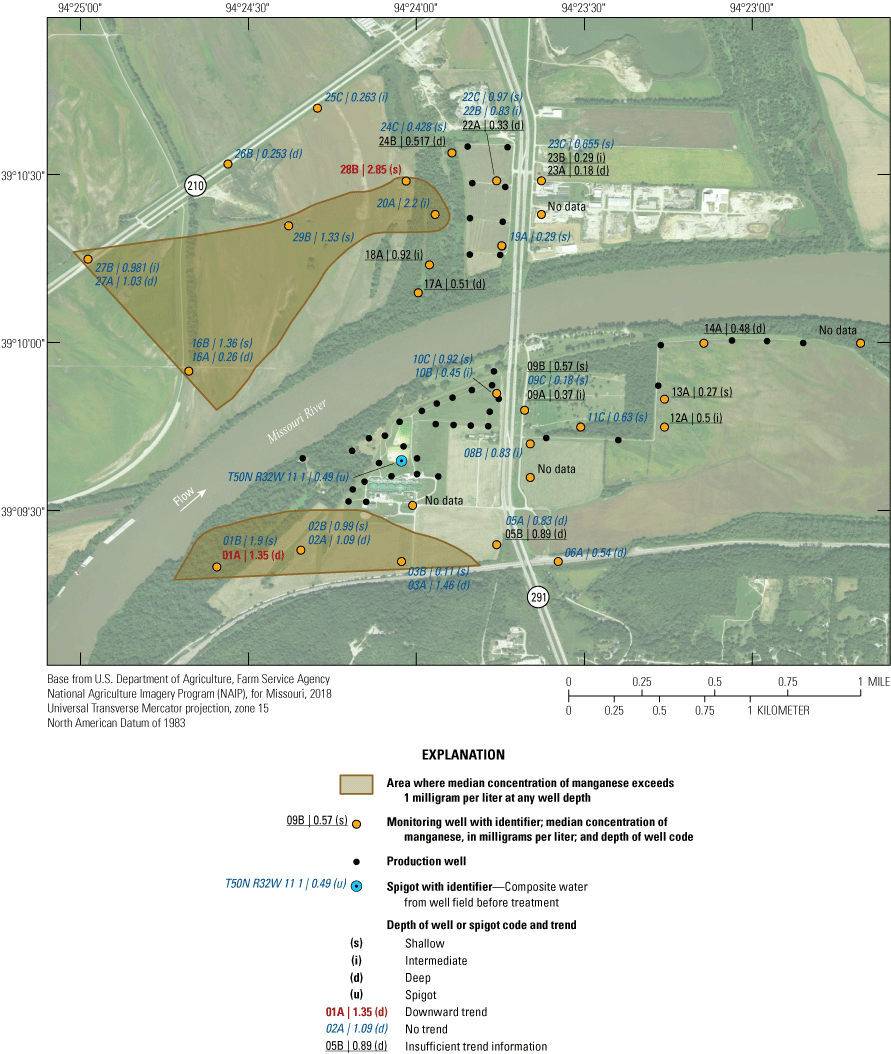
Median concentrations and temporal trends in concentration of manganese in monitoring wells and well-field composite samples from production wells at the Independence well field, Missouri, 1997–2018.
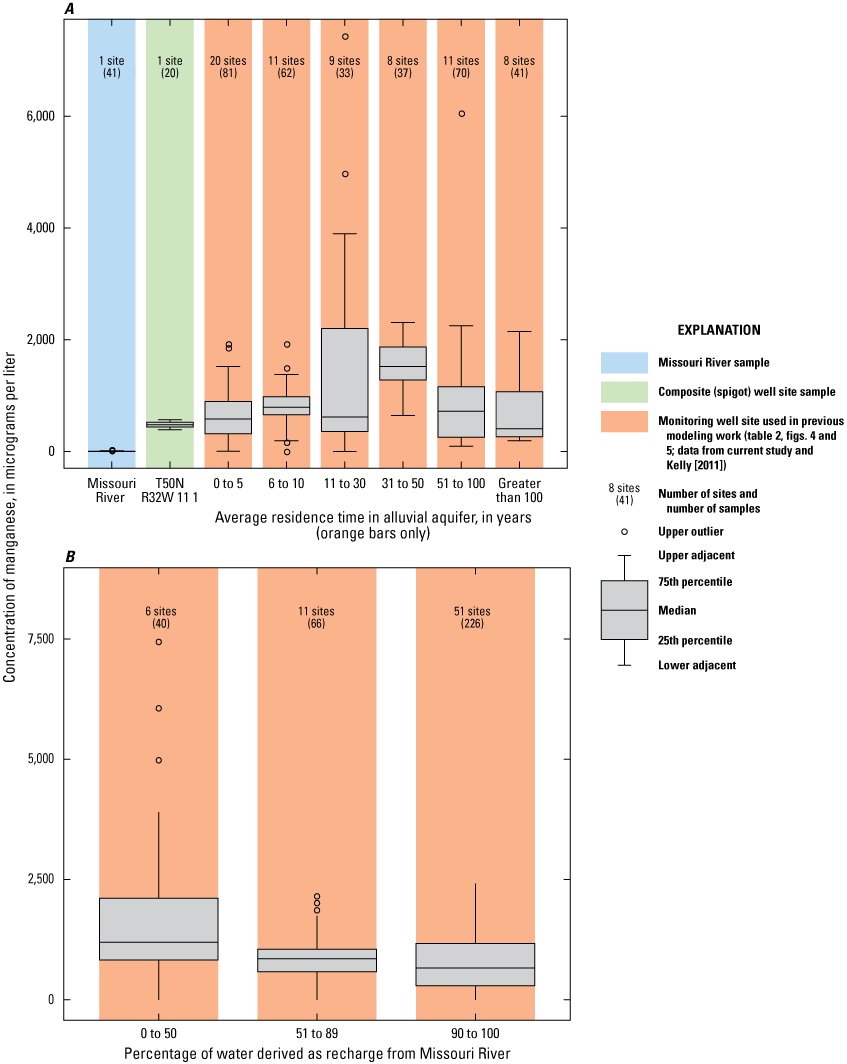
Concentrations of manganese in the Missouri River at Sibley (U.S. Geological Survey station 06894100), well-field composite samples from production wells, and monitoring wells at the Independence well field, Missouri. A, relative to the residence time of water in the alluvial aquifer; B, relative to the percentage of water derived from recharge from the Missouri River, 1997–2018.
Manganese concentrations indicated no trend (were statistically stable) through time in most of the alluvial aquifer (fig. 16). Manganese concentrations indicated a statistically significant decrease during 1997–2018 in wells 01A and 28B. Well 01A is located at the southwestern edge of the monitoring well network, and well 28B is located west of the well field north of the river. No well demonstrated a statistically significant increase in manganese concentrations.
The concentration of iron in samples collected from the monitoring network during 1997–2018 exceeded the SMCL in almost every sample (appendix 1). Only wells 03A, 03B, 09C, 11C, 19B, 20A, and 24C had at least one sample with a concentration less than the SMCL. Only wells 03B, 09C, and 24C had a median concentration of iron that was at or less than the SMCL. These exceedances indicate that geochemical conditions in almost the entire alluvial aquifer in the study area favor iron reduction (table 5).
The median concentration of iron in samples collected from the monitoring well network during 1997–2018 was less than 10 mg/L at wells 03A, 03B, 05B, 08B, 09A, 09B, 09C, 10B, 10C, 11C, 14A, 17A, 18A, 19A, 23A, 23B, 24C, and 29B and at T50N R32W 11 1 (fig. 18). In addition to the discharge from the production wells, most of the monitoring wells with a median concentration of less than 10 mg/L of iron are near the well field. Conversely, many of the wells with median iron concentrations greater than 10 mg/L are south of the well field south of the river, in the northern part of the well field, and west of the well field north of the river.
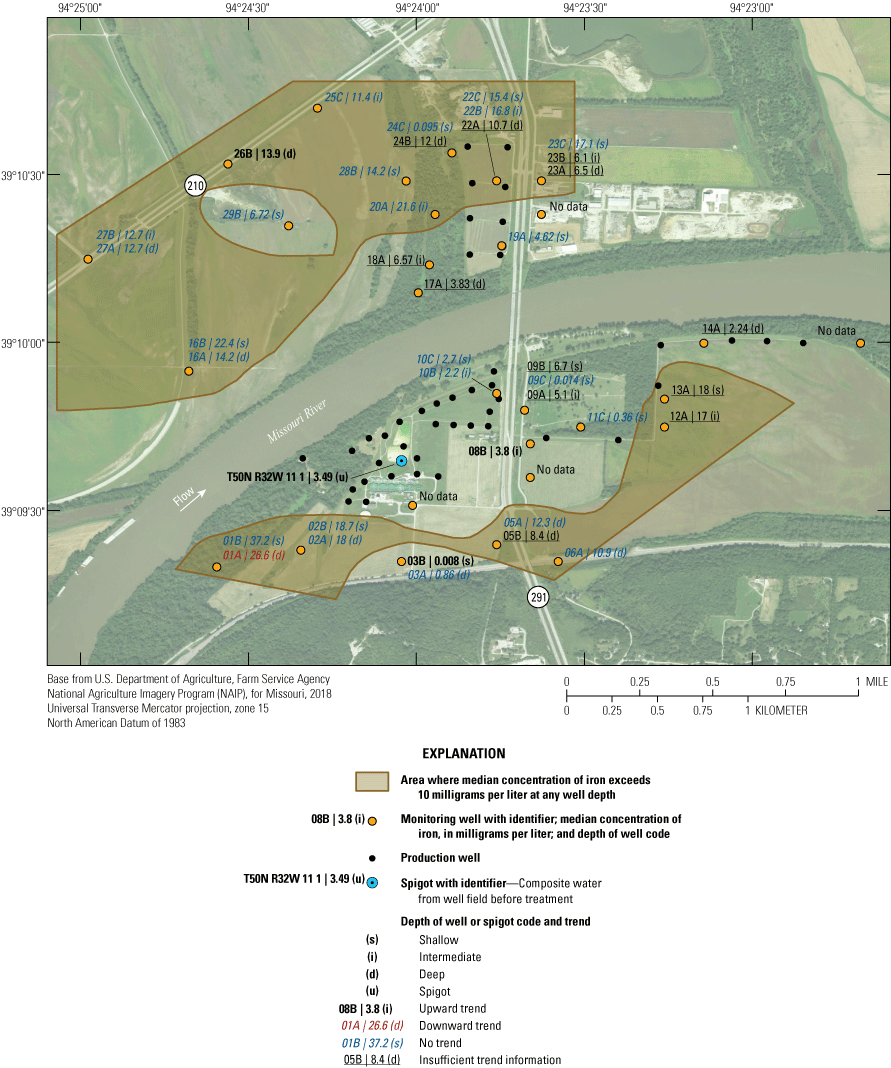
Median concentrations and temporal trends in concentration of iron in monitoring wells and well-field composite samples from production wells at the Independence well field, Missouri, 1997–2018.
Areas with low iron concentrations tend to have short groundwater residence times and contain recent recharge from the Missouri River induced by pumping from the well field. Areas with higher iron concentrations tend to have longer groundwater residence times and are not in areas with substantial recent recharge from the Missouri River. This interpretation is supported by plots of iron concentration relative to the residence time in the alluvial aquifer, which indicate median iron concentrations are lower in the production wells and in the monitoring wells with simulated residence times of 5 years or less than they are in the rest of the monitoring wells but otherwise indicate no systematic change with residence time (fig. 19A). Iron concentrations indicate no clear variations with percentage of recharge from the river (fig. 19B). Iron concentrations near the river near the well field likely are affected by the low concentrations of iron in the river water recharging the alluvial aquifer in this area and (potentially) a less intensive geochemically reducing environment in this part of the alluvial aquifer associated with the presence of the oxic recharge.
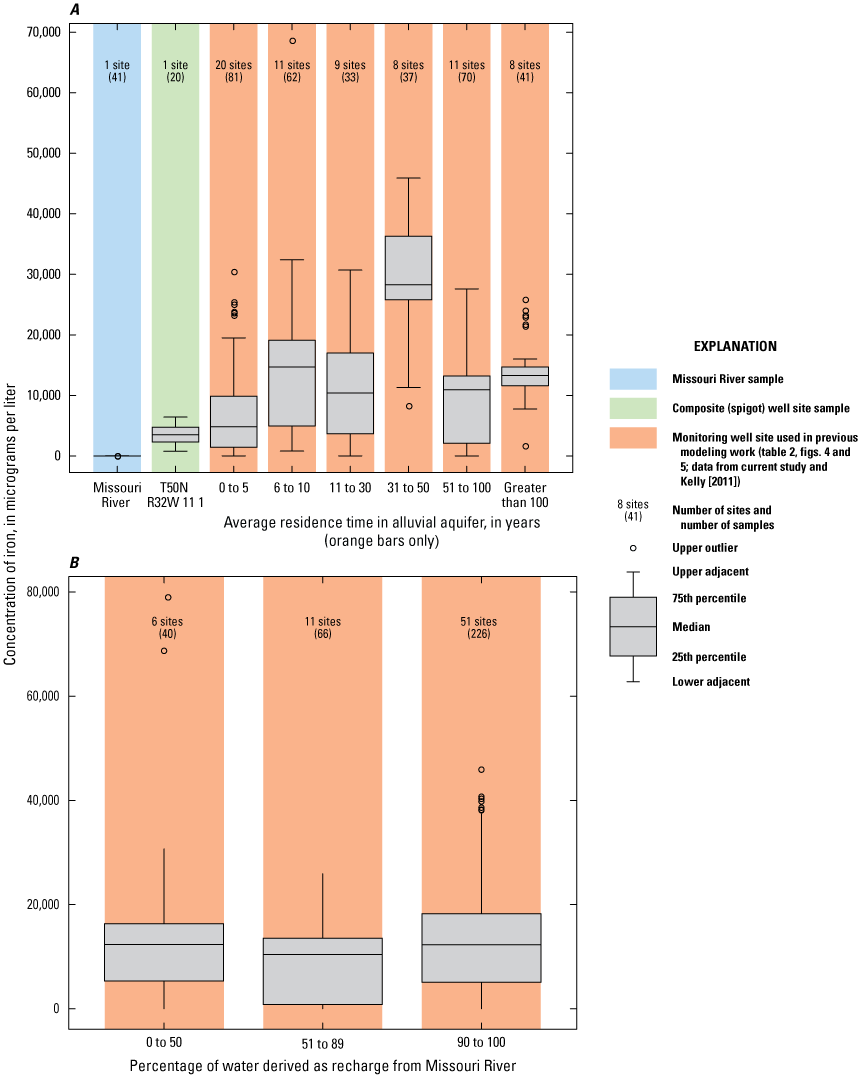
Concentrations of iron in the Missouri River at Sibley (U.S. Geological Survey station 06894100), well-field composite samples from production wells, and monitoring wells at the Independence well field, Missouri. A, relative to the residence time of water in the alluvial aquifer; B, relative to the percentage of water derived from recharge from the Missouri River, 1997–2018.
Iron concentrations indicated a statistically significant increase during 1997–2018 in wells 03B, 08B, and 26B and at T50N R32W 11 1 (fig. 18). Excepting T50N R32W 11 1, these are shallow wells, most of which are on the northern and southern edges of the monitoring well network. A statistically significant decrease in the concentration of iron was identified in well 01A. This well is at the southwestern edge of the monitoring well network. Most of the alluvial aquifer in the study area did not experience a statistically significant change in iron concentrations during 1997–2018, indicating generally stable geochemical conditions with respect to iron reduction.
Wells 03B, 09C, 11C, and 24C all have median concentrations of iron of less than 0.5 mg/L. These data indicate that siderite and iron hydroxide are potential components of any scale precipitate and have the potential to form in water extracted from most of the alluvial aquifer in most of the study area. These data also indicate that iron concentrations likely are affected by the dissolution and precipitation of siderite and (or) iron hydroxide.
Concentrations of manganese and iron were greater than their respective SMCLs in most of the study area, indicating that most or all the alluvial aquifer is experiencing manganese- and iron-reducing conditions most of the time. Concentrations of manganese and iron tended to be lower near the well field on both sides of the river than in the rest of the alluvial aquifer, indicating that pumping from the well field has induced the movement of more oxic, low-iron, low-manganese water from the Missouri River into the alluvial aquifer. However, concentrations of manganese and iron throughout the alluvial aquifer are substantially higher than in the river, indicating mixing of water from the river and the ambient alluvial aquifer and the occurrence of manganese- and iron-producing biologic and chemical reactions within the alluvial aquifer in the recharge area associated with the well field. Although manganese- and iron-reducing conditions are present throughout the alluvial aquifer, the intensity of the reducing conditions seems to be lower near the well field than in the ambient alluvial aquifer where the residence time of the water is longer and there is greater opportunity for the water to interact with the alluvial aquifer material and for more reducing geochemical conditions to develop. Manganese and iron concentrations were statistically stable through time in most of the alluvial aquifer. Iron concentrations likely are affected by the dissolution and precipitation of siderite and (or) iron hydroxide and are high enough to form scale precipitates.
Sulfate
Sulfate (SO4−2) is a naturally occurring ion that typically is present in groundwater because of the dissolution of sulfate minerals or the oxidation of sulfide minerals in geologic deposits. The conversion of sulfate to sulfide (S−2) complexes occurs under geochemically reducing conditions (after manganese and iron reduction) and can produce a “rotten egg” odor in the water (Miao and others, 2012). Sulfate has an SMCL of 250 mg/L because elevated concentrations of sulfate impart a salty taste to the water (U.S. Environmental Protection Agency, 2019b).
The median concentration of sulfate in 41 samples collected from the Sibley site during 2008–18 was 180 mg/L. Although not consistently elevated during the monitoring period, sulfate concentrations at the Sibley site were highest in October and lowest in May during 6 of the 10 years for which data are available (U.S. Geological Survey, 2019c).
The median concentration of sulfate in samples from the Independence monitoring wells during 1997–2018 ranged from less than 1 mg/L near the northwestern part of the study area at wells 16A, 25C, 26B, 27A, and 27B to 275 mg/L at well 01A in the southwestern part of the study area (fig. 20). Sulfate concentrations exceeded the SMCL in 11 of the 17 samples from well 01A but were less than the SCML in samples from all other wells (appendix 1).
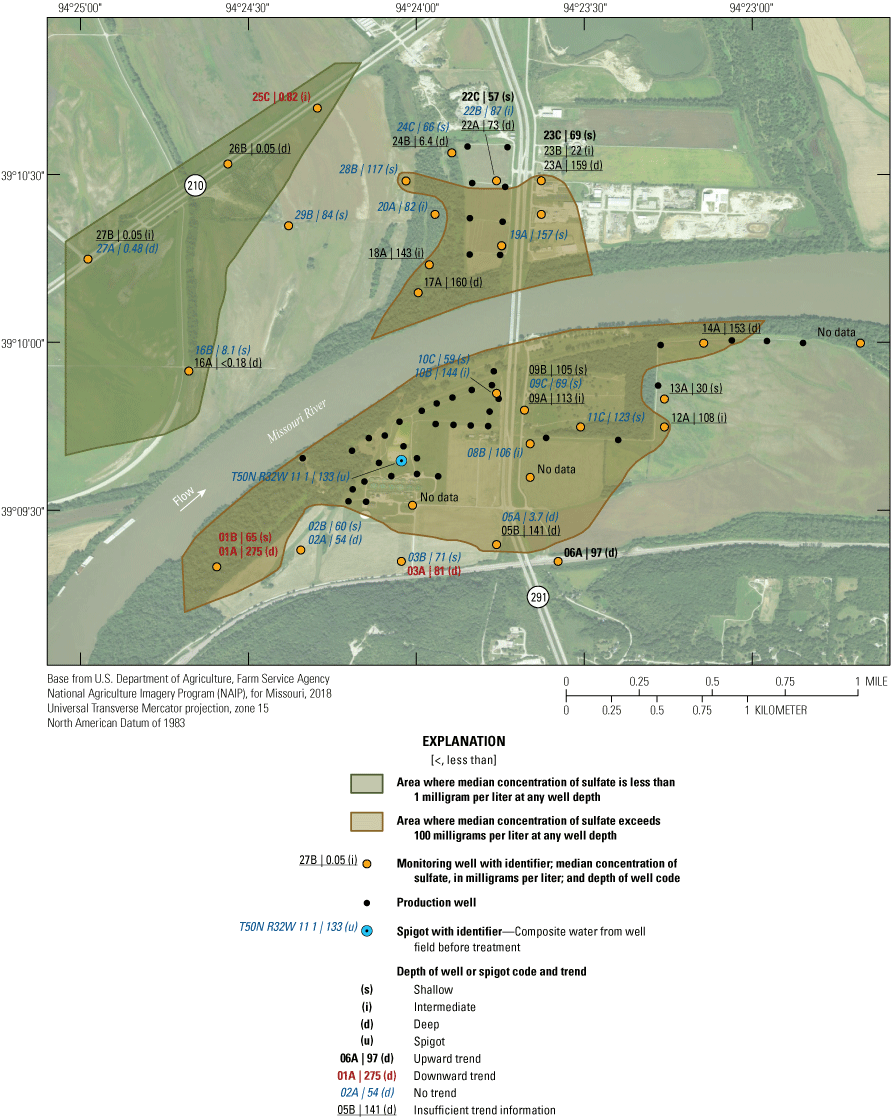
Median concentrations and temporal trends in concentration of sulfate in monitoring wells and well-field composite samples from production wells at the Independence well field, Missouri, 1997–2018.
In addition to the wells with low median concentrations of sulfate (16A, 25C, 26B, 27A, and 27B), low sulfate concentrations of less than 10 mg/L also were detected in at least one sample from wells 05A, 13A, 16A, 16B. 19A, 22B, 24B, 24C, 26B, and 27A (appendix 1). These low concentrations indicate the typical to occasional presence of sulfate-reducing conditions in the alluvial aquifer at sporadic locations south of the river, as well as in much of the western and northern parts of the study area north of the river (table 5). These areas typically have groundwater residence times of more than 50 years and little or no recent recharge from the river (table 2). Median sulfate concentrations in groundwater are lower than in the Missouri River and are substantially lower in wells with a simulated residence time of more than 100 years than in wells with shorter residence times (fig. 9).
Median sulfate concentrations exceeded 100 mg/L in many of the wells at and near the well field (fig. 20). These data indicate that recharge of high-sulfate water from the Missouri River is occurring near the well field. However, substantial concentrations of sulfate (typically about 50–97 mg/L) also are present in much of the alluvial aquifer away from the well field, indicating that sulfate concentrations in the alluvial aquifer also can be moderate to high in that part of the alluvial aquifer where there is no recent recharge from the river.
A total of six wells demonstrated a statistically significant trend (p-value less than or equal to 0.05) in sulfate concentration from 1997 through 2018 (fig. 20). The remaining wells either did not demonstrate a statistically significant trend, indicating generally stable sulfate concentrations, or did not have enough detections for analysis. An upward trend was present in wells 06A, 22C, and 23C. A downward trend was calculated at wells 01A, 01B, 03A, and 25C. Wells with a downward trend are on the southern and northern fringes of the study area away from the well field, as is well 06A. Wells 22C and 23C are near the well field north of the river. The upward trends in sulfate concentrations at wells 22C and 23C likely reflect the migration of high-sulfate water from the river to these wells associated with the initiation of pumping in the well field north of the river during the 1997–2018 sampling period.
An analysis of trend data for the geochemical indicator properties indicates an overall decrease in the number of wells indicating a statistically significant change in the direction of increased reducing conditions: from ammonia (18 locations indicating a downward trend and 5 indicating an upward trend) to manganese (2 locations indicating a downward trend) and iron (4 locations indicating an upward trend and 1 indicating a downward trend), to sulfate (3 locations indicating an upward trend and 4 indicating a downward trend). Although a few of the wells indicating trends overlap, there is no consistent pattern in wells indicating changes or the direction of change between constituents. Trends in a couple properties in a few of the wells may reflect the movement of river water to the well field in response to the initiation of pumping north of the river during the monitoring period, but most of the trends in most of the wells likely reflect localized variations in availability of chemical constituents and the intensity of geochemical (and microbial) conditions.
Sulfate concentrations indicated considerable variation with location, between sampling events, and to a degree with residence time in the alluvial aquifer. This variation indicates a geochemically heterogeneous alluvial aquifer with respect to sulfate reduction. Sulfate-reducing conditions seem to be present in parts of the alluvial aquifer away from the well field, particularly in the northern and northwestern parts of the study area. These are parts of the alluvial aquifer with groundwater residence times more than 50 years and little or no recent recharge from the river (Kelly, 2011). Higher concentrations of sulfate are present near the well field, indicating that recharge of high sulfate, oxic water from the Missouri River is bringing sulfate into the alluvial aquifer and producing a geochemical environment that retards sulfate reduction near the well field. However, sulfate concentrations are elevated in much of the alluvial aquifer south of the river and away from the well field, indicating that sulfate concentrations in parts of the alluvial aquifer unaffected by recharge from the river also can be moderate to high. Sulfate concentrations in the monitoring wells do not indicate that sulfate concentrations are high enough to be a cause for concern for the potability of the water extracted from the well field. The potential existence of sulfate-reducing conditions in parts of the alluvial aquifer is a potential concern for the aesthetic quality of the water extracted from the well field.
Hardness
Hardness (measured as calcium carbonate) is the measure of the concentration of dissolved calcium and magnesium in a sample, along with smaller amounts of divalent cation complexes associated with iron, manganese, aluminum, and some other compounds. The components of hardness in the groundwater are primarily derived from the dissolution of calcium- and magnesium-containing minerals in the geologic environment. General guidelines for the hardness classification of waters are 0 to 60 mg/L as calcium carbonate as soft; 61 to 120 mg/L as calcium carbonate as moderately hard; 121 to 180 mg/L as calcium carbonate as hard; and more than 180 mg/L as calcium carbonate as very hard (U.S. Geological Survey, 2019d). There are no regulatory criteria for hardness. Hard water requires more soap and detergents for dish washing, home laundry, and bathing and contributes to scale formation in pipes, water heaters, and industrial equipment. As a result, soft or moderately hard water often is considered more desirable by consumers than hard water.
The median value of hardness in 41 samples collected from the Sibley site during 1997–2018 was 280 mg/L as calcium carbonate (classified as very hard) and indicated no overall trend during the sampling period. Hardness values in samples collected from the Sibley site did not indicate consistent seasonal variation throughout 1997–2018 but tended to be highest in the winter and lowest in the late spring through fall.
The median value of hardness in samples from the monitoring network collected from 1997 through 2018 exceeded 180 mg/L as calcium carbonate in every well, where calculated, indicating that the water from the alluvial aquifer can be considered very hard (fig. 21). Hardness values were spatially variable in the study area. Median hardness values of less than 350 mg/L as calcium carbonate were detected in wells 14A, 17A, 18A, 19A, and 23B and at T50N R32W 11 1. These wells are near the well field or sample water from the well field. Median hardness values exceeded 350 mg/L as calcium carbonate in the rest of the monitoring wells. These patterns in concentration indicate that pumping from the well field has induced recharge of lower hardness water from the Missouri River into most of the alluvial aquifer near the well field south of the river and to the southern part of the well field north of the river. This recharge has resulted in lower hardness values near the well field. Parts of the alluvial aquifer away from the well field and with a longer groundwater residence time, in contrast, had higher hardness.
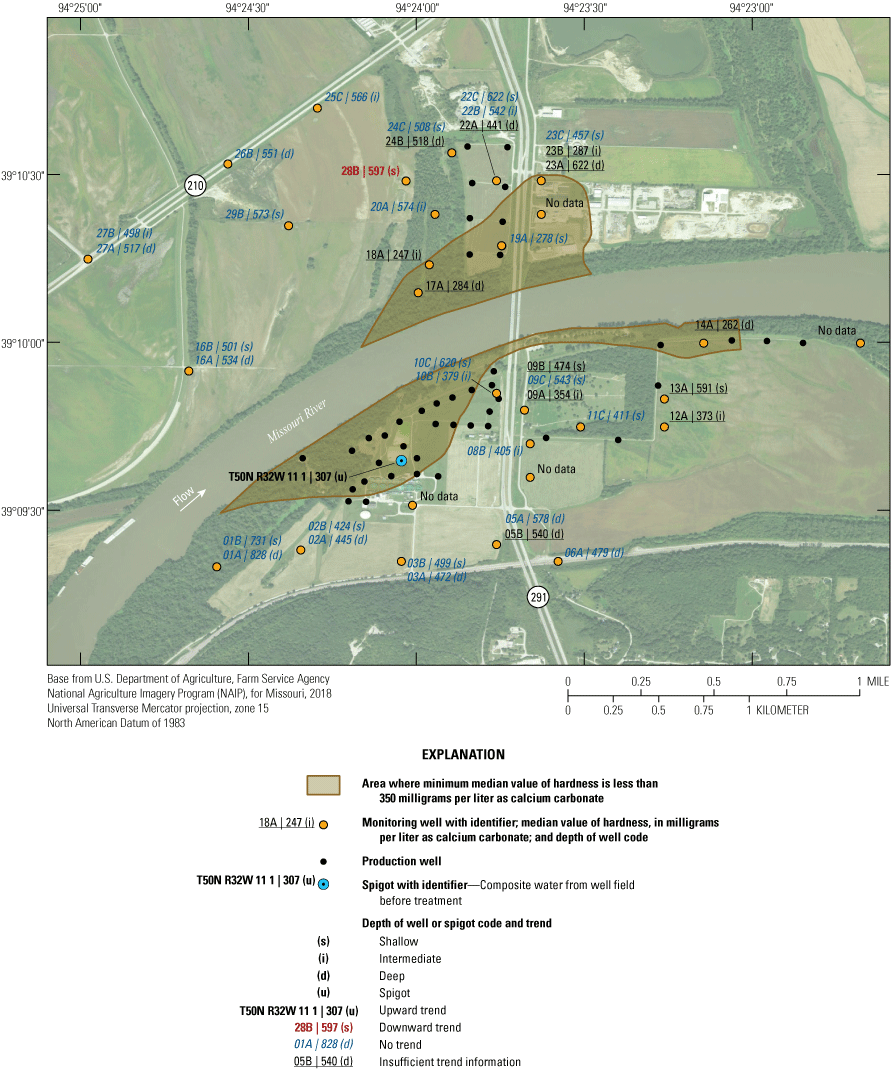
Median values and temporal trends in value of hardness in monitoring wells and well-field composite samples from production wells at the Independence well field, Missouri, 1997–2018.
This interpretation is supported by analysis of median hardness values relative to the residence time and source of recharge in the alluvial aquifer. The median hardness of the water increases from the Missouri River (280 mg/L as calcium carbonate) to the samples from the production wells (307 mg/L as calcium carbonate), through the samples from monitoring wells with residence times of 0–5 years (420 mg/L as calcium carbonate), 6–10 years (451 mg/L as calcium carbonate), and 11–30 years (488 mg/L as calcium carbonate). These values, in turn, are lower than the median values in the samples from monitoring wells with residence times of 31–50 years (762 mg/L as calcium carbonate), 51–100 years (524 mg/L as calcium carbonate), and more than 100 years (522 mg/L as calcium carbonate). These trends are similar to those of calcium (a primary component of hardness) with residence time (fig. 9).
Hardness values indicated a statistically significant decrease from 1997 through 2018 in well 28B and a statistically significant increase at T50N R32W 11 1 (fig. 21). The trend at T50N R32W 11 1 is based primarily on an increase in hardness after the 2003 sampling event (fig. 22) and may reflect the presence of higher hardness water derived from the ambient (water quality reflective of prepumping conditions) alluvial aquifer north of the river associated with the initiation of pumping from wells in the northern part of the well field after 2000. The remaining wells did not demonstrate a statistically significant change in hardness values during the sampling period, indicating stable conditions with respect to hardness in most of the alluvial aquifer.

Hardness values of well-field composite samples from production wells at monitoring location T50N R32W 11 1, Independence well field, Missouri, 1997–2018.
These wells indicate no consistent relation to location, areas of recharge from the river, or residence time in the alluvial aquifer, but there is some tendency for the wells with low hardness values to be where calcite dissolution or nonprecipitation has the potential to occur. These data do not clearly indicate calcite precipitation is likely to be substantial throughout the alluvial aquifer or in the discharge from the well field. Chemical precipitates associated with water discharged from the well field (if any) are more likely to be associated with iron minerals than calcium carbonates.
The water in the alluvial aquifer is very hard and likely would require treatment to avoid problems associated with hard water. Values of hardness were spatially variable within the study area. Lower hardness values in composite samples extracted from the well field and from monitoring wells in the southern part of the well field indicate that water from the Missouri River is recharging the groundwater system in response to pumping from the well field.
Chloride
Chloride is a naturally occurring ion in groundwater; however, it is often present at elevated concentrations because of the presence of wastewater or the dissolution of road salt (Mullaney and others, 2009). Chloride has an SMCL of 250 mg/L because elevated concentrations of chloride impart a salty taste to the water (U.S. Environmental Protection Agency, 2019b).
The median concentration of chloride in 41 samples collected from the Sibley site during 2008–18 was 23 mg/L. Chloride concentrations in samples collected from the Sibley site indicated some seasonal variation, typically being 5–30 mg/L higher in January than during the rest of the year (fig. 23; U.S. Geological Survey, 2019c). Elevated concentrations of chloride in the Missouri River during the winter months likely are at least partly due to the presence of road-salt affected runoff.
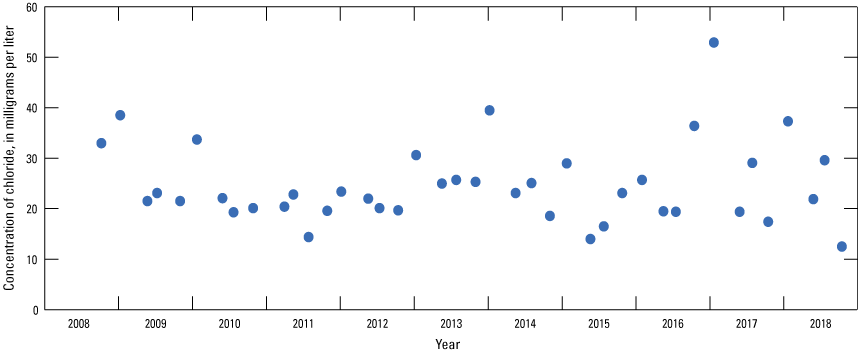
Concentrations of chloride in the Missouri River at Sibley, Missouri (U.S. Geological Survey station 06894100), 2008–18.
The median concentration of chloride in samples from the monitoring wells from 1997 through 2018 was 11 mg/L or less in the northwestern part of the study area at wells 16A, 16B, 20A, 24B, 25C, 27A, 27B, and 29B and at wells 03A, 03B, and 13A south of the river generally away from the well field (fig. 24). Median concentrations of chloride in most of the rest of the monitoring network were between 16 and 30 mg/L. The highest median concentrations of chloride were at wells 05B and 06A, which is near Route 291 at a bluff near the southern end of the study area. The elevated concentrations of chloride at wells 05B and 06A may indicate the infiltration of high-chloride water affected by road salt in this area or possibly recharge of saline water from the Pennsylvanian bedrock south of the study area (Miller, 1971). The SMCL for chloride was not exceeded in any sample (appendix 1).
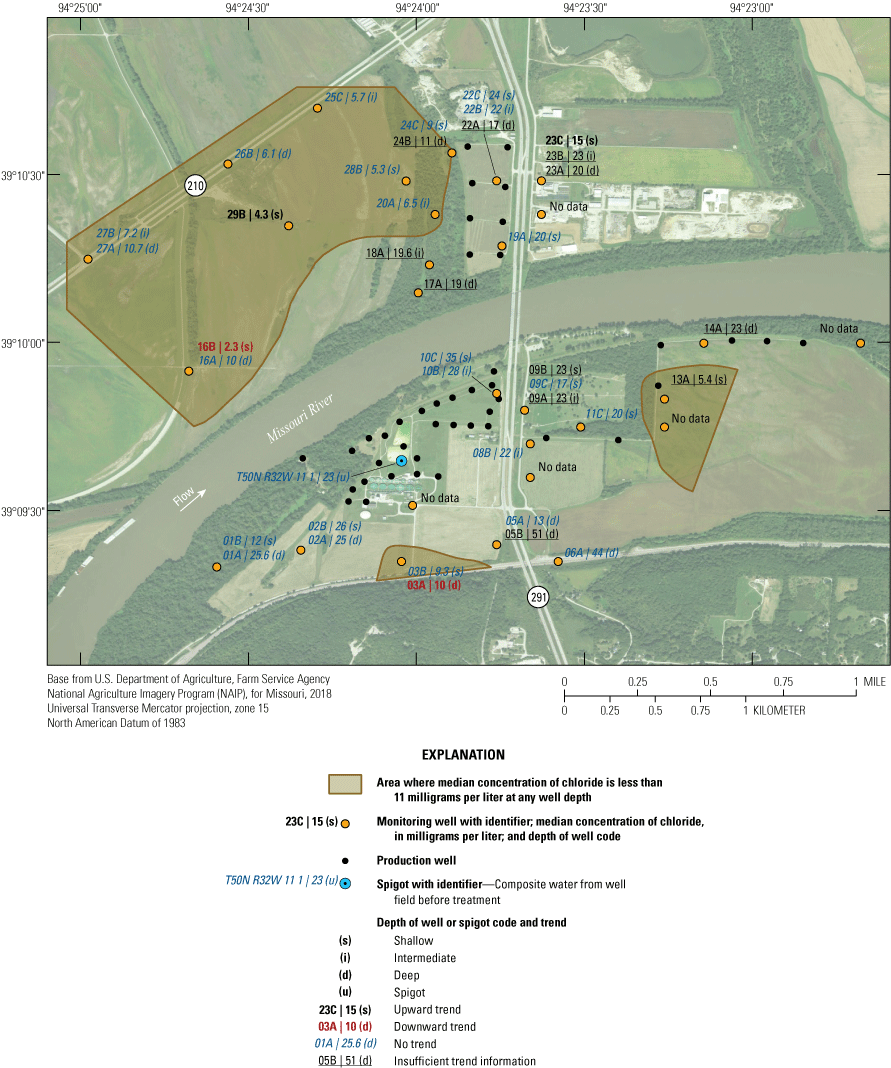
Median concentrations and temporal trends of concentration of chloride in monitoring wells and well-field composite samples from production wells at the Independence well field, Missouri, 1997–2018.
The fact that elevated chloride concentrations are present near the well field and approximate the median concentration of chloride in the Missouri River indicates recharge from the river is present near the well field. The effect of recharge from the river near the well field on chloride concentrations is further indicated by analysis of chloride concentrations broken down by water residence time. Median concentrations of chloride are similar in water from the Missouri River, in the combined discharge from the well field, and at monitoring wells with simulated residence times of 10 years or less (see chloride plots in fig. 9). These values are higher than the median concentrations for wells with a simulated residence time of 11 years or more. Chloride is not affected by the geochemical environment and likely does not participate in chemical reactions in the alluvial aquifer, making it a superior indicator of the spatial extent of recent recharge from the river in the alluvial aquifer.
Concentrations of chloride indicated a statistically significant increase from 1997 through 2018 in wells 23C and 29B and a statistically significant decrease in wells 03A and 16B (fig. 24). The remaining wells did not demonstrate a statistically significant change, indicating stable chloride concentrations in most of the alluvial aquifer, or did not have sufficient data to determine a trend. There are no apparent spatial patterns in the location of the wells with upward or downward trends.
Median chloride concentrations were low in the northwestern part of the study area and at sporadic locations south of the river in comparison to the rest of the study area. Spatial patterns in chloride concentrations and trends in chloride concentrations with residence time in the alluvial aquifer indicate water from the Missouri River is recharging the alluvial aquifer near the well field. Elevated concentrations of chloride in the south-central part of the study area near Route 291 may indicate the presence of recharge of saline water from the bedrock to the south or effects from the application of road salt. Chloride concentrations are not high enough to be a cause for concern for potability of the water extracted from the well field but may be high enough to induce corrosion of galvanic material in parts of the alluvial aquifer.
Orthophosphate
Orthophosphate (PO4−3) is a naturally occurring ion in groundwater, but it also can be present at elevated concentrations because of the presence of wastewater and the recharge of water affected by phosphate fertilizers (U.S. Geological Survey, 1999). Orthophosphate also is used as a water treatment to help prevent leaching of lead and copper from pipes.
The median concentration of orthophosphate in 122 samples collected from the Sibley site during 2008–18 was 0.38 mg/L. Orthophosphate concentrations in samples collected from the Sibley site did not indicate clear seasonal variation.
The median concentration of orthophosphate in samples collected from the monitoring network during 1997–2018 varied from about 0.04 to 0.90 mg/L (fig. 25). The median concentration of orthophosphate exceeded 0.50 mg/L in wells 02A, 07B, 18A, 20A, 24B, 27A, and 29A. These wells are screened in the middle to lower part of the alluvial aquifer in grassland or forested areas near the western part of the well field north of the river and south of the well field south of the river. Median concentrations of orthophosphate of less than 0.10 mg/L were detected in wells 03B, 04B, 06A, 07A, 08B, 09A, 09B, 10B, 10C, 11C, 14C, 15A, 16A, 16B, 17B, 19B, 20B, 24C, 25C, 28B, and 29B and at T50N R32W 11 1. These locations constitute most of the alluvial aquifer in the study area, including several wells clustered with wells indicating high median orthophosphate concentrations. Median concentrations of orthophosphate indicated no consistent variations with residence time in the alluvial aquifer. Median concentrations of orthophosphate increase with increasing percentage of recharge from the Missouri River (fig. 26A, B),
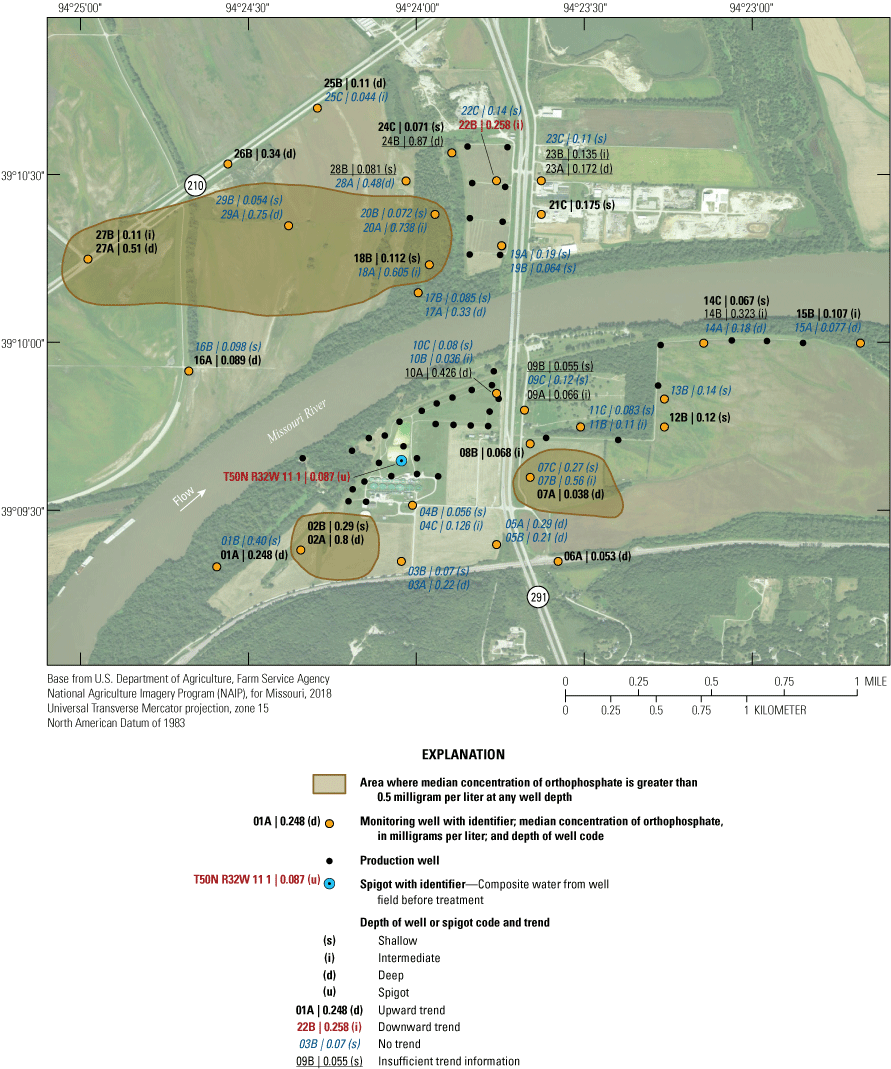
Median concentrations and temporal trends in concentration of orthophosphate in monitoring wells and well-field composite samples from production wells at the Independence well field, Missouri, 1997–2018.
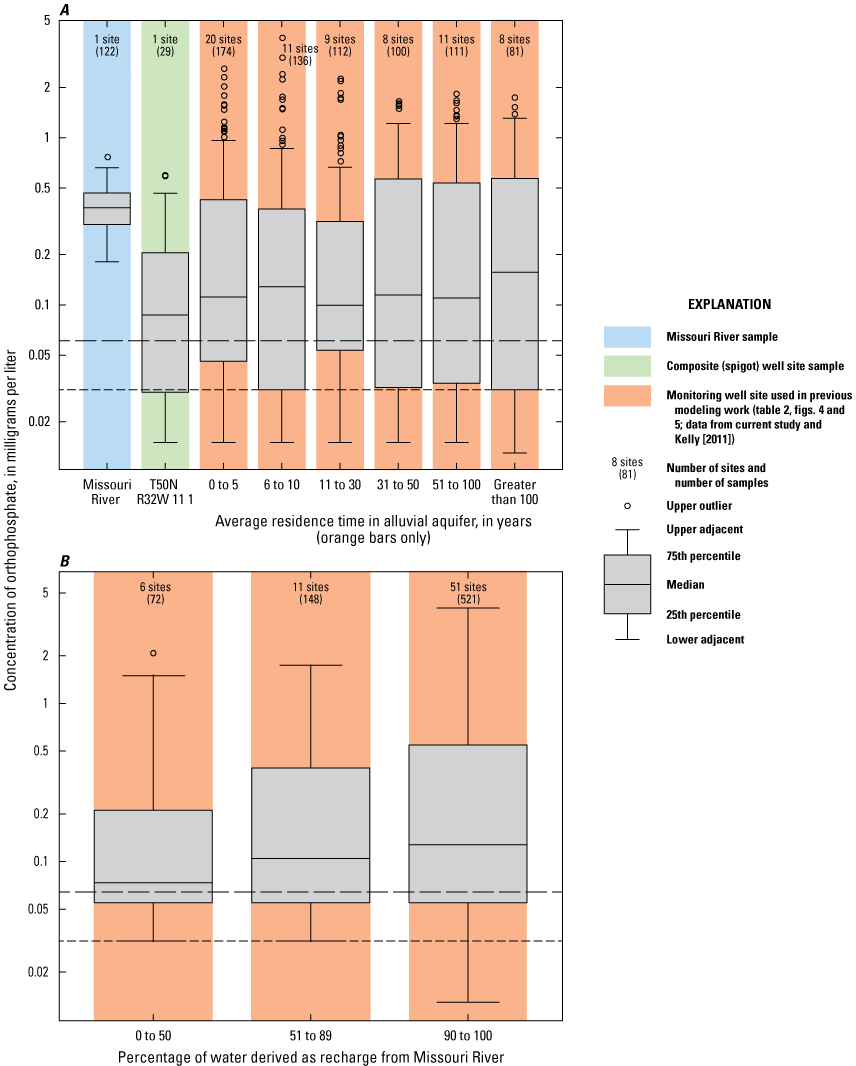
Concentrations of orthophosphate in the Missouri River at Sibley (U.S. Geological Survey station 06894100), well-field composite samples from production wells, and monitoring wells at the Independence well field, Missouri. A, relative to the residence time of water in the alluvial aquifer; B, relative to the percentage of water derived from recharge from the Missouri River, 1997–2018.
Concentrations of orthophosphate indicated a statistically significant increase from 1997 through 2018 in wells 01A, 02A, 02B, 06A, 07A, 08B, 12B, 14C, 15B, 16A, 18B, 21C, 24C, 25B, 26B, 27A, and 27B. A statistically significant decrease in concentration through time was identified in well 22B and at T50N R32W 11 1 (fig. 25). The remaining wells did not demonstrate a statistically significant change. This analysis indicates orthophosphate concentrations are increasing through time in the alluvial aquifer in much of the study area, particularly south and west of the well field.
Median orthophosphate concentrations were less than 1.0 mg/L throughout the study area but tended to be somewhat higher in the middle to lower parts of the alluvial aquifer near the western part of the well field north of the river and south of the well field south of the river. Orthophosphate concentrations increased through time in much of the study area.
Fluoride
Fluoride is a naturally occurring ion in groundwater, but it also can be present at elevated concentrations because of the use of phosphate fertilizers or the disposal of coal combustion byproducts (Bhattacharya and Samal, 2018). At concentrations of about 0.7 mg/L, fluoride helps prevent tooth decay. At concentrations greater than the MCL of 4.0 mg/L, fluoride can increase the risk of skeletal fluorosis (U.S. Environmental Protection Agency, 2019a). Fluoride also has an SMCL of 2.0 mg/L, which is recommended to prevent tooth discoloration or pitting of the tooth surface in children (U.S. Environmental Protection Agency, 2019b).
The median concentration of fluoride in 41 samples collected from the Sibley site during 1997–2018 was 0.41 mg/L. Fluoride concentrations in samples collected from the Sibley site indicated no clear seasonal variation and typically varied by less than 0.10 mg/L from the median.
The median concentration of fluoride in samples collected from the monitoring wells during 1997–2018 varied from about 0.15 to 0.41 mg/L within the study area (fig. 27). Fluoride concentrations exceeded 0.30 mg/L near the well field south of the river and in the southern part of the well field north of the river, indicating the presence of recharge from the river in these areas. Neither the MCL nor SMCL for fluoride was exceeded in any sample (appendix 1).
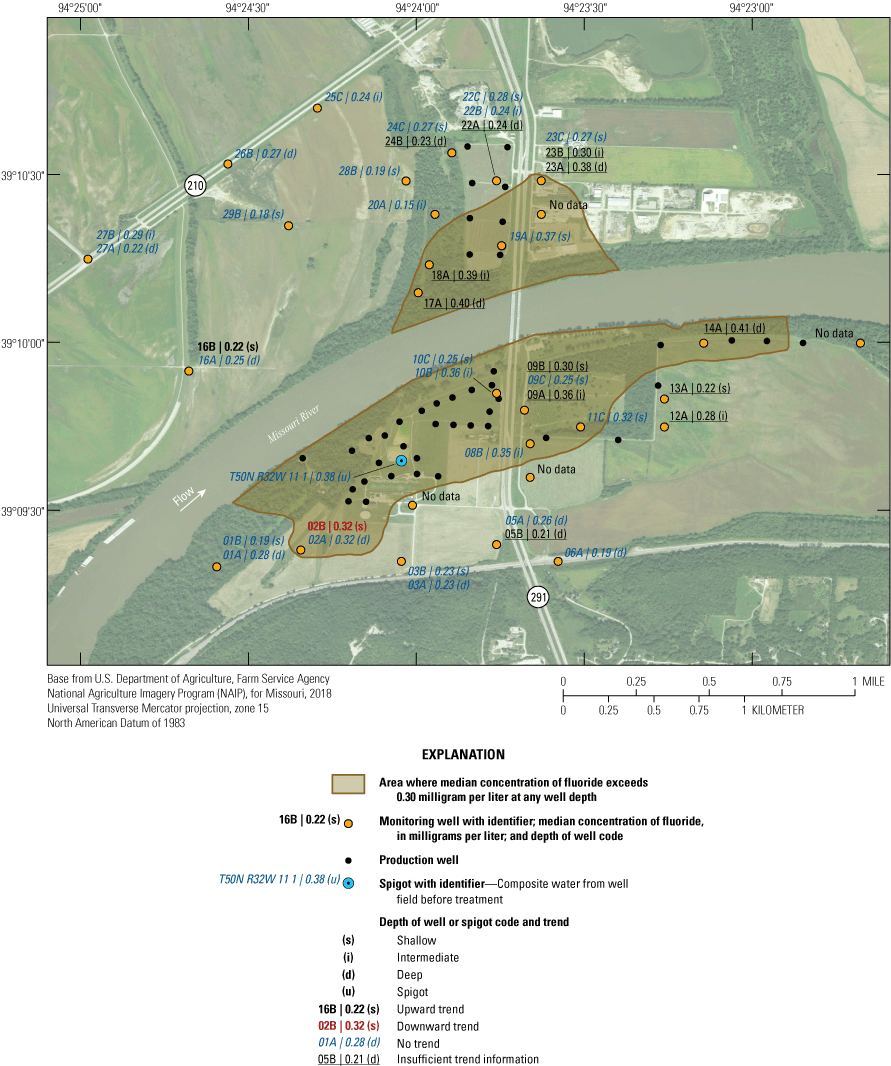
Median concentrations and temporal trends in concentration of fluoride in monitoring wells and well-field composite samples from production wells at the Independence well field, Missouri, 1997–2018.
Median concentrations of fluoride decreased from the Missouri River to the production wells to monitoring wells with simulated groundwater residence times of 10 years or less (fig. 28A). Monitoring wells with simulated groundwater residence times more than 10 years had similar median concentrations of fluoride. Median concentrations of fluoride also increased with increasing amounts of recharge from the Missouri River (fig. 28B). These patterns indicate that recent recharge from the river affects fluoride concentrations in the alluvial aquifer. Fluoride is not affected by the geochemical environment and likely does not participate in chemical reactions in the alluvial aquifer, making it (like chloride) a superior indicator of the spatial extent of recent recharge from the river in the alluvial aquifer.
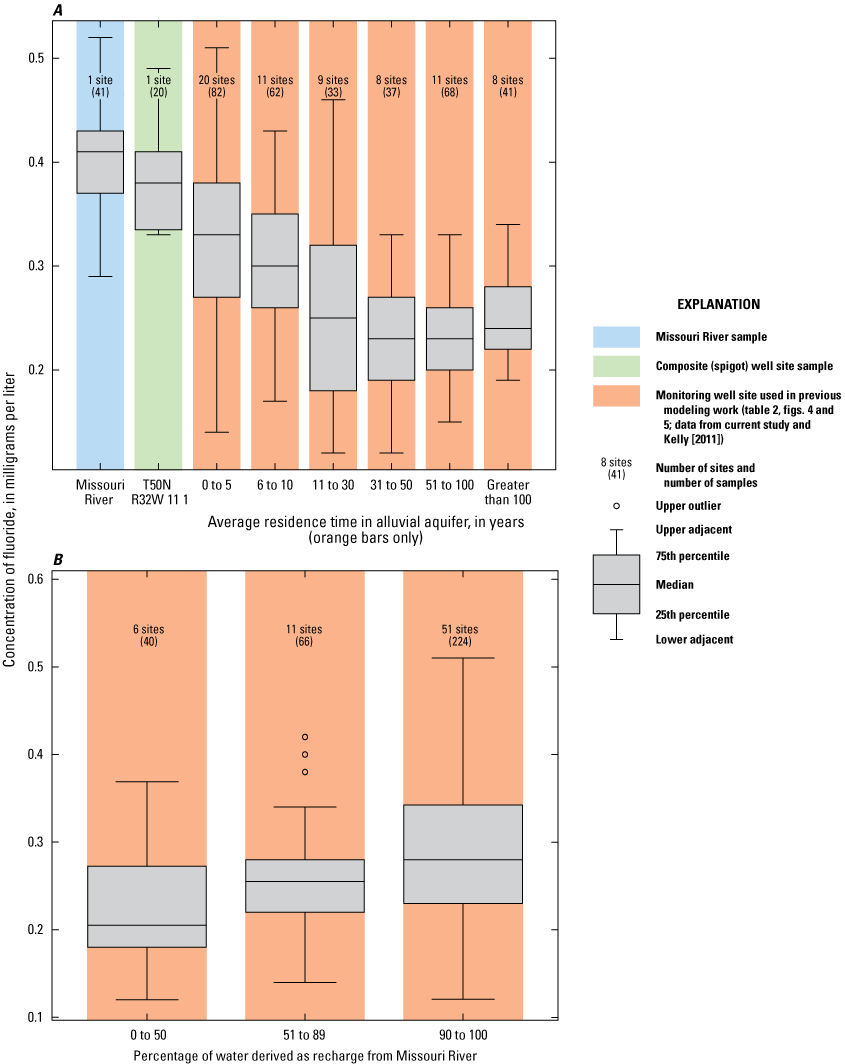
Concentrations of fluoride in the Missouri River at Sibley (U.S. Geological Survey station 06894100), well-field composite samples from production wells, and monitoring wells at the Independence well field, Missouri. A, relative to the residence time of water in the alluvial aquifer; B, relative to the percentage of water derived from recharge from the Missouri River, 1997–2018.
Concentrations of fluoride indicated a statistically significant increase from 1997 through 2018 in well 16B and a statistically significant decrease in well 02B (fig. 27). The remaining wells did not demonstrate a statistically significant trend in fluoride concentration, indicating stable concentrations of fluoride in most of the study area. Well 16B is west of the well field north of the river; well 02B is west of the well field south of the river. There is no obvious explanation for why these wells are demonstrating upward or downward trends in fluoride concentration.
Fluoride concentrations were low throughout the study area but were somewhat higher near most of the well field, indicating the presence of recent recharge from the Missouri River in these areas. Median concentrations of fluoride were higher in groundwater with residence times of 10 years or less than in wells with residence times more than 10 years. Median concentrations of fluoride increased with increasing percentage of recharge form the Missouri River. These patterns also indicate fluoride concentrations are affected by recent recharge from the river. Fluoride concentrations in every sample were less than regulatory standards, indicating they are not a cause for concern for potability of the water extracted from the well field.
Trace Metals
Water samples were analyzed for a variety of metalloids and metals. For the purposes of this report, metalloids and metals typically present at concentrations of less than 0.5 mg/L in water are collectively referred to as trace metals. Trace metals can occur naturally in water because of the dissolution of minerals containing these compounds but also can be derived from human activities such as disposal of hazardous wastes and the application of pesticides (U.S. Environmental Protection Agency, 1992). Of the trace metals tested for as part of the monitoring effort, only those with an MCL or SMCL (antimony, arsenic, barium, beryllium, cadmium, chromium, copper, lead, selenium, thallium, and uranium) are discussed in this report.
The trace metal of primary concern to drinking water quality is arsenic because its low MCL of 10 micrograms per liter (µg/L) commonly is exceeded in natural waters (U.S. Geological Survey, 2019a). The median concentration of arsenic exceeded the MCL in samples from 1997 through 2018 collected from the monitoring wells 01B, 02A, 02B, 16B, and 28B (fig. 29). These wells are all west of the well field on both sides of the river where geochemical conditions tend to be iron and manganese reducing. Although the median arsenic concentration was less than the MCL, at least one sample from wells 09C, 10C, 20A, 22B, 22C, and 29B had a concentration of arsenic at or greater than the MCL (fig. 30; appendix 1). Most of these wells are within or near the well field, indicating that water extracted from the well field may have occasional issues with arsenic. Arsenic concentrations indicated no systematic changes with residence time in the alluvial aquifer but had lower median concentrations where more of the groundwater recharge was from precipitation than was derived from the Missouri River (fig. 31). These data indicate arsenic concentrations are affected primarily by geochemical conditions in the alluvial aquifer.
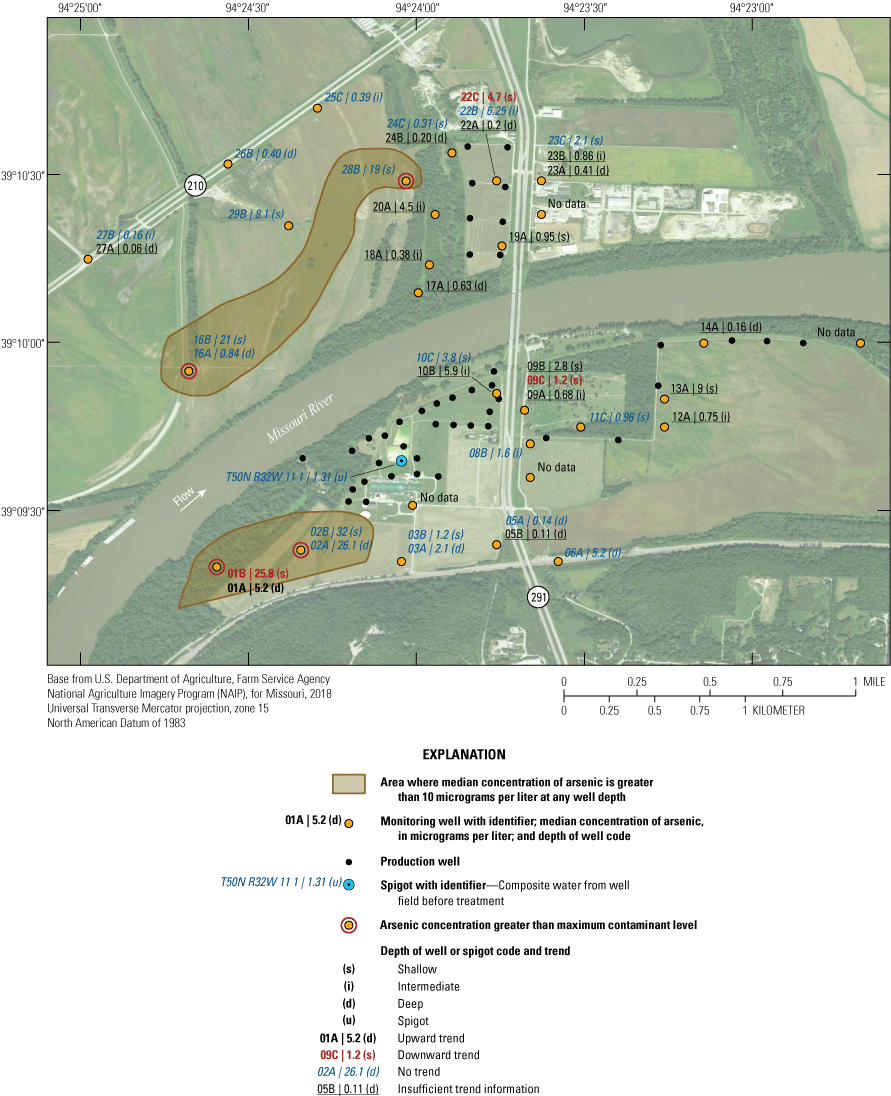
Median concentrations and trends in concentration of arsenic in monitoring wells and well-field composite samples from production wells at the Independence well field, Missouri, 1997–2018.
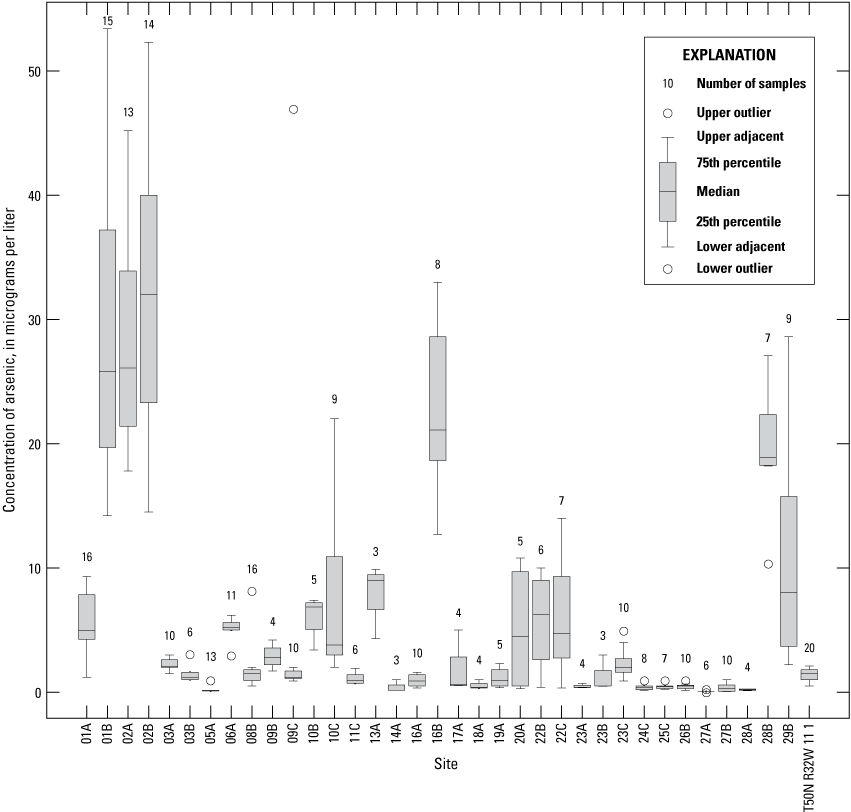
Concentrations of arsenic in monitoring wells and well-field composite samples from production wells at the Independence well field, Missouri, 1997–2018.
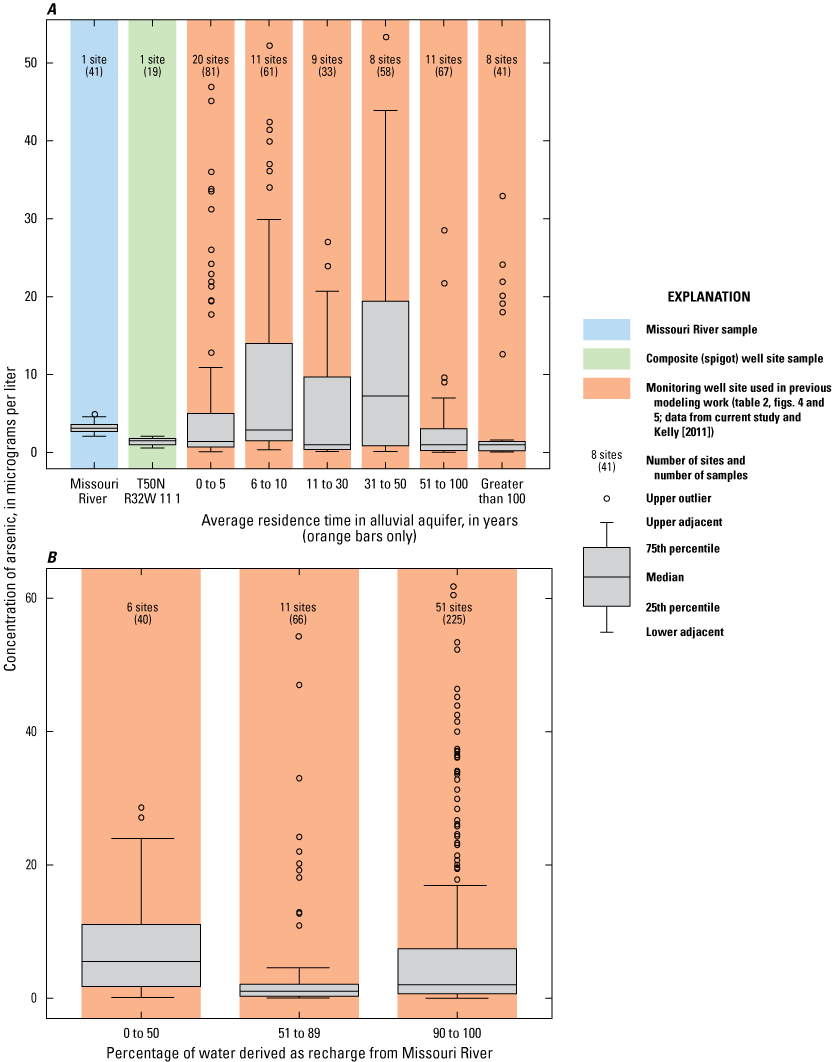
Concentrations of arsenic in the Missouri River at Sibley (U.S. Geological Survey station 06894100), well-field composite samples from production wells, and monitoring wells at the Independence well field, Missouri. A, relative to the residence time of water in the alluvial aquifer; B, relative to the percentage of water derived from recharge from the Missouri River, 1997–2018.
Concentrations of arsenic indicated a statistically significant increase from 1997 through 2018 in well 01A and a statistically significant decrease in wells 01B, 09C, and 22C (fig. 29). The remaining wells either did not contain enough samples for analysis or did not demonstrate a statistically significant trend, indicating stable arsenic concentrations in most of the alluvial aquifer.
The median concentration of uranium in samples collected from the monitoring wells from 1997 through 2018 exceeded 1 µg/L in wells 03A, 03B, 08B, 09B, 09C, 10B, 10C, 11C, 22B, 22C, and 28B and at T50N R32W 11 1 (fig. 32). The median concentration exceeded 10 µg/L in wells 24C and 29B. The MCL of 30 µg/L (U.S. Environmental Protection Agency, 2019a) was exceeded in one sample from well 24C. Statistically significant increases in uranium concentration during 1997–2018 were observed in wells 01A, 23C, and 29B.
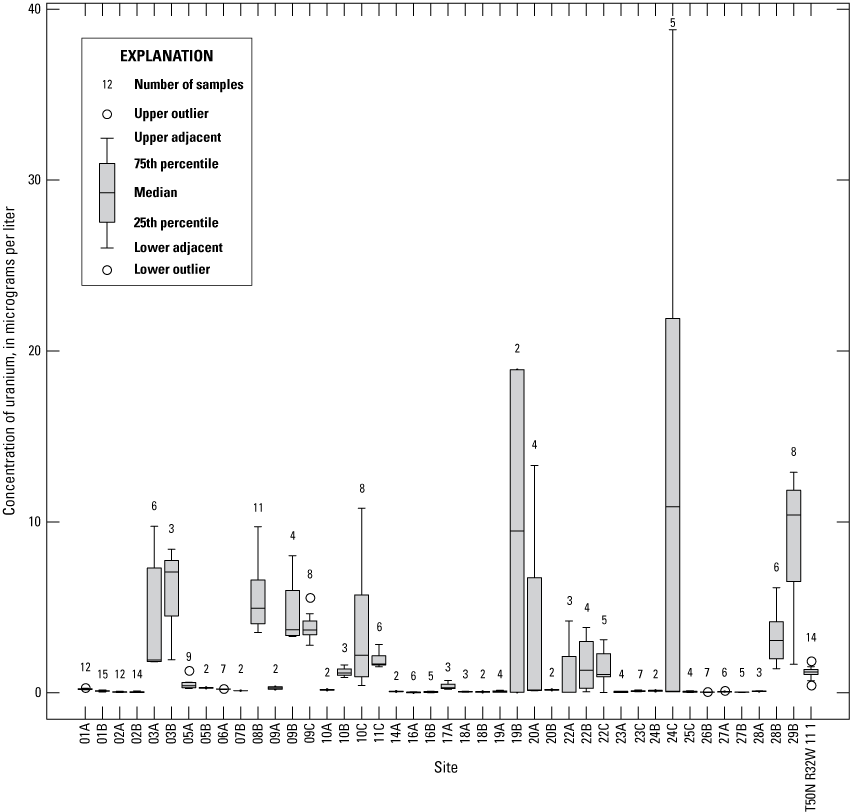
Concentrations of uranium in monitoring wells and well-field composite samples from production wells at the Independence well field, Missouri, 1997–2018.
Most of the monitoring wells with median uranium concentrations greater than 1 µg/L were near the well field and Route 291. Although the areas of elevated concentrations of uranium in the alluvial aquifer are near the production wells, the low concentration of uranium relative to its MCL and the stability of concentrations through time in most of the alluvial aquifer indicate that uranium does not pose a threat to the quality of the water extracted from the well field.
The median concentration of barium in samples collected from the monitoring wells from 1997 through 2018 exceeded 1,000 µg/L in wells 16A, 22A, 24B, 25C, and 27A (fig. 33). These wells are screened in the deep or intermediate parts of the alluvial aquifer in the northwestern part of the study area. Higher concentrations of barium may be present where sulfate-reducing conditions have reduced sulfate concentrations because of barite dissolution or nonprecipitation. The median concentration of barium exceeded the MCL of 2,000 µg/L in samples from well 16A, but no sample in any other well was greater than the MCL (U.S. Environmental Protection Agency, 2019a). Barium concentrations indicated a statistically significant decrease from 1997 through 2018 in well 01A, but concentrations were stable or there were insufficient data for analysis in most of the alluvial aquifer.
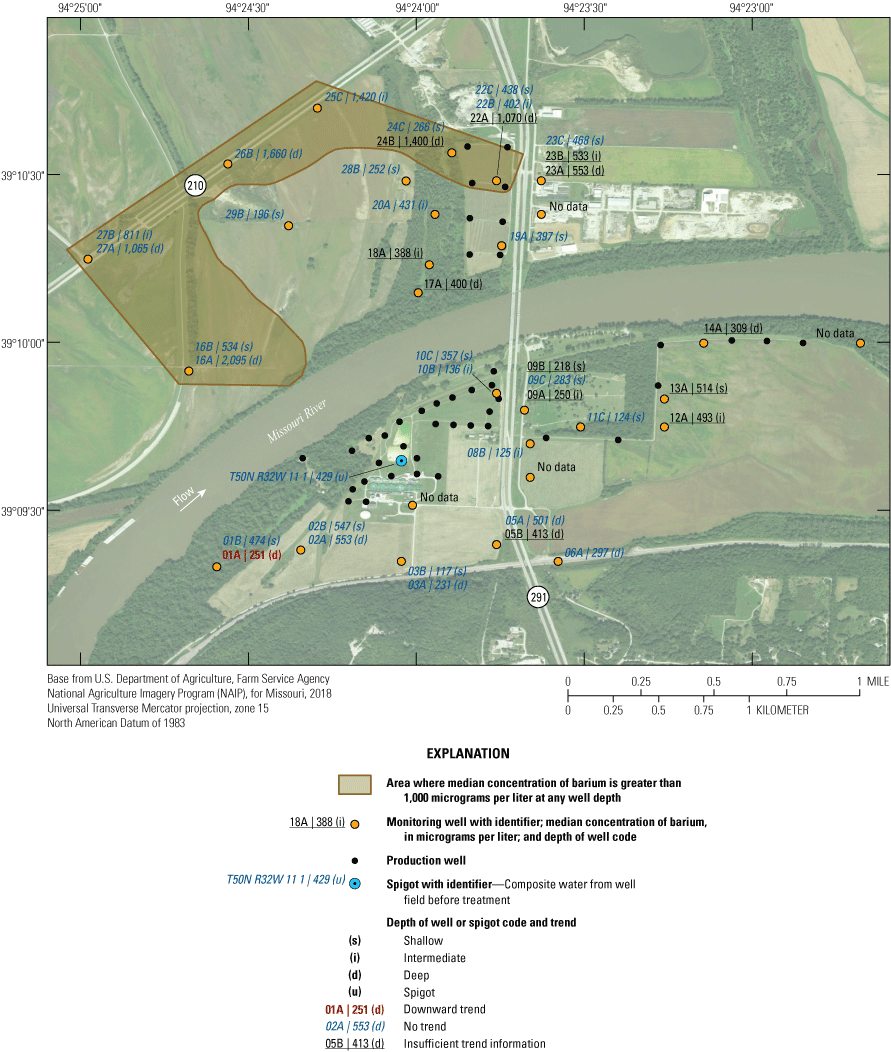
Median concentrations and temporal trends in concentration of barium in monitoring wells and well-field composite samples from production wells at the Independence well field, Missouri, 1997–2018.
The median concentration of selenium was greater than the detection limit in about one-half of the wells sampled (appendix 1). Median concentrations of selenium exceeded 1 µg/L in wells 03B and 29B. The concentration of selenium exceeded its MCL of 50 µg/L (U.S. Environmental Protection Agency, 2019a) in one sample from well 24C but was less than the MCL in all other samples. Statistically significant decreases in selenium concentrations from 1997 through 2018 were calculated at wells 01A and 01B.
Concentrations of antimony, beryllium, cadmium, chromium, copper, lead, and thallium typically were less than the detection limit (appendix 1). Only antimony in wells 03A, 03B, 05A, 05B, 06A, 09B, 09C, 10B, 10C, 11C, 14A, 16B, 17A, 18A, 20A, 22A, 22B, 22C, 23C, 24C, 25C, 28B, and 29B and at T50N R32W 11 1; beryllium in wells 03B, 05B, 06A, 23C, 24C, 25C, and 27B; cadmium in wells 03A, 03B, 09B, 09C, 10C, 11C, 20A, 22B, 22C, 23C, 24C, 28B, and 29B; chromium in wells 01A, 01B, 02A, 02B, 03A, 03B, 05A, 05B, 06A, 08B, 09C, 10C, 16A, 17A, 20A, 22B, 22C, 23C, 24C, 25C, 27A, 27B, 28B, and 29B; copper in wells 03A, 05A, 06A, 09C, 10B, 22B, 23A, 23C, 24B, 24C, 25C, 27B, 28B, and 29B and at T50N R32W 11 1; lead in wells 23C, 24C, and 25C; and thallium in wells 03A, 03B, 09C, 10B, 11C, 22C, 24C, and 28B and at T50N R32W 11 1 had a median concentration that was not censored. Wells with elevated concentrations of these trace metals tend to be the same. Many of these wells are south or west of the well field, but several are within the well field. Antimony was present at a concentration greater than its MCL in one sample from well 16B and one sample from well 22C (appendix 1). Lead was present at a concentration greater than its MCL in one sample from well 16B and one sample from T50N R32W 11 1 (appendix 1). These constituents were detected at a concentration less than their MCLs in every other sample.
Arsenic concentrations were consistently higher in the western part of the study area than in the rest of the alluvial aquifer; however, periodic detections of arsenic at concentrations greater than the MCL at several monitoring wells near the well field indicate potential concerns for the quality of the water extracted from the well field. None of the other trace metals discussed in this section are at concentrations that pose a substantial threat to the quality of the water in the well field.
Organic Compounds
Although some of the organic compounds tested for as part of this investigation occur naturally, for the purposes of this report, organic compounds are carbon-based chemical compounds whose presence in the alluvial aquifer is likely due to the disposal of industrial waste, the presence of treated wastewater, or the infiltration of urban and agricultural runoff. The presence of low concentrations of organic compounds in some of the samples may indicate effects from industrial waste, wastewater, or urban and agricultural runoff in the alluvial aquifer.
The number of samples collected, number of organic constituents tested for, and sampling frequency varied among the wells (table 4). The analysis of organic compounds can be affected by a variety of processes that can result in the detection of low concentrations of a compound in the sample even if it is not present in the alluvial aquifer. To reduce the potential for discussion of false positives in this report, the analysis focuses on organic compounds detected in at least five wells. Additional analysis of the quality assurance and quality control data for the analytes detected in at least five wells also has been done to provide a more accurate depiction of the organic compounds in the alluvial aquifer.
To facilitate the understanding of appendix 2, footnotes were added to denote VOCs, pesticide and herbicide related compounds, and emerging compounds. Compounds without a footnote are phenol and polycyclic aromatic hydrocarbons.
Volatile Organic Compounds
VOCs are a group of organic compounds characterized by high vapor pressure. VOCs tend to sublimate or evaporate from the liquid phase into the atmosphere. Few VOC samples were collected from the Missouri River. No organic samples were collected from the Sibley site. The samples collected from the Missouri River at Omaha (streamgage 06610000), Hermann (streamgage 06934500), and near the well field (MO–S, MO–C, and MO–N in fig. 6) were each sampled once for tetrachloroethene and 1,4-dichlorobenzne but no other VOCs. None of the VOCs that were tested for in the river were present at concentrations greater than the detection limit.
Benzene is a component of gasoline with an MCL of 5 µg/L (U.S. Environmental Protection Agency, 2019a). Benzene was detected in one sample from wells 02B, 09C, 10C, 11C, 22C, 23C, 28A, 28B, and 29A and was detected in two samples from wells 01B and 29B. Benzene concentrations were less than 0.51 µg/L in every sample (appendix 2). These wells were sampled a total of 62 times for benzene from 1997 through 2018, but detections only occurred in the samples collected during July 2008 (wells 28A, 28B, 29A, and 29B) and late July–early August 2018 (wells 01B, 02B, 23C, and 29B) (U.S. Geological Survey, 2019c).
Benzene was detected at a concentration of less than 0.2 µg/L in two trip blank samples collected during early August 2018 (appendix 2). Because trip blank samples do not contain water from the alluvial aquifer, the presence of benzene in the blank samples indicates that the low concentrations of benzene detected in the samples collected during July and August 2018 are likely due to field or laboratory contamination rather than its presence in the alluvial aquifer. No trip blank samples were collected during the July 2008 sampling, so it is unclear if the low concentrations of benzene detected in the samples collected on that date represent conditions in the alluvial aquifer or are due to field or laboratory contamination; however, benzene is a common field contaminant because of fuel use in generators and automobiles. Its detection in multiple wells during a single sampling event (having excluded the 2018 data as being due to laboratory contamination) is likely an indication of field or laboratory contamination.
Toluene also is a component of gasoline and has an MCL of 1,000 µg/L (U.S. Environmental Protection Agency, 2019a). Toluene was detected in at least one sample from wells 01A, 02A, 02B, 06A, 28A, 28B, 29A, 29B, and at T50N R32W 11 1 at a concentration of less than 0.6 µg/L. Each of these wells was sampled from 6 to 15 times for toluene during 1997–2018, but toluene was only detected in samples collected during September 2002 (wells 28A, 28B, and 29A), June 2006 (wells 02A and 28A), and July 2008 (wells 01A, 02A, 28A, 28B, 29A, and 29B). Note that benzene also was detected in wells 01A, 28A, 28B, 29A, and 29B during July 2008, which would be consistent with the presence of fuel components in the alluvial aquifer in these wells on that date (U.S. Geological Survey, 2019c).
A trip blank sample collected during June 2006 did not have detectable quantities of toluene, nor did any other blank sample. Trip blank samples were not collected during September 2002 and July 2008. The fact that these detections are restricted to a few sampling dates indicates they may be the result of field or laboratory contamination and are not representative of water quality in the alluvial aquifer. However, the lack of toluene detections in the blank samples indicates the detections represent water quality in the alluvial aquifer and the alluvial aquifer is vulnerable to contamination from fuel components.
Wells 01A and 02A are open to the lower part of the alluvial aquifer west of the well field south of the river (fig. 6). Wells 28A, 28B, 29A, and 29B are open to the upper and lower parts of the alluvial aquifer west of the well field north of the river. The 28 well cluster abuts a construction landfill, and the 29 well cluster is generally downgradient from this landfill (fig. 2). Wells 01A and 02A are more than 0.5 mi from potential sources of contamination south of the study area.
Phenol
Although phenol can occur naturally in the environment (U.S. Environmental Protection Agency, 2002), it is primarily produced for a variety of industrial uses, including the manufacture of plastics, nylon and other synthetic fibers, herbicides, and medicines, and is commonly a component of wastewater. Phenol does not have an MCL. Phenol was not detected at a detection limit of 0.50 µg/L in the samples collected from the Missouri River upstream from the well field at stations MO–S, MO–C, and MO–N (fig. 6) during October 2003 (U.S. Geological Survey, 2019c).
Phenol was detected in one sample from wells 02A, 05A, 11B, 19A, 19B, 23C, and 29B. Phenol was detected in at least two samples from wells 01A, 03A, and 06A and at T50N R32W 11 1. These locations indicate no consistent relation to the well field, likely sources of contamination, or recharge from the river. Each of these locations was sampled for phenol from 1 to 15 times during 1997–2018 (U.S. Geological Survey, 2019c). Phenol was detected at a concentration of less than 2 µg/L in every sample.
Phenol was detected in trip blank samples collected during June 2005 and July 2011 at a maximum concentration of 0.35 µg/L (appendix 2). Phenol was not detected in any sample from a monitoring well during July 2011 but was detected in samples collected from wells 01A, 03A, 06A, 19B, and 23C and at T50N R32W 11 1 during June 2005. The detection of phenol at these monitoring locations during the June 2005 sampling event seems to be due to field or laboratory contamination rather than its presence in the alluvial aquifer. This analysis indicates that phenol was present in the alluvial aquifer during at least one sampling event at wells 01A, 02A, 03A, 05A, 06A, 11B, 19B, and 29B and at T50N R32W 11 1. There is no obvious source of these small detections, and it is uncertain if they represent naturally occurring phenol, some anthropogenic source, or sample contamination. However, several of these wells (01A, 02A, 03A, 05A, and 06A) are in the deep part of the alluvial aquifer in proximity to each other in the southern part of the study area, which could indicate a possible common origin of the detections in these wells regardless of their source.
Pesticides and Herbicides
Pesticides and herbicides are chemical compounds used to control insects and vegetation. These compounds are applied in agricultural and urban settings and can leach into groundwater or runoff to surface water. None of the compounds discussed in this section have an MCL. None of these compounds were detected in the two field blank samples associated with the 2018 sampling event (appendix 2).
From 1997 to 2018, a total of 87 groundwater samples were collected from 31 wells and T50N R32W 11 1 and analyzed for pesticide and herbicides (table 4). The number of individual compounds analyzed in a sample varied during the monitoring period, and the samples collected during 2018 had the largest number of compounds analyzed and lowest reporting levels. A total of 34 compounds or their degradation products were detected in at least 1 sample (appendix 2), and a maximum concentration of any compound was less than 350 nanograms per liter (ng/L). Most of the detections were in the locations sampled during 2018 because of the expanded suite of analytes and the lower reporting levels (in nanograms per liter) compared to previous years. Of the 34 compounds detected in the 14 locations (13 wells and T50N R32W 11 1) sampled during 2018, the largest numbers of compounds were detected at T50N R32W 11 1 (23 detections), well 15A (16 detections), well 18A (10 detections), and wells 11C and 09C (7 detections each) (fig. 34). The highest total concentrations of the organic compounds detected during the 2018 sampling (greater than 800 ng/L) were detected in samples from the well field at T50N R32W 11 1 and at wells 15A and 18A near the river (fig. 34). The lowest total concentrations (less than 140 ng/L) were detected in samples from wells 02B, 07C, 22C, 25B, 27B, and 29B. Wells 11C, 15A, and 18A had more than 75-percent recharge from the river with average travel times from the river of about 2–15 years (table 2). Well 09C had about 50-percent recharge from the land surface (shallow well) with an average residence time of 2 years. Wells 02B, 07C, 22C, 25B, 27B, and 28B had from 0- to 100-percent recharge from the land surface and an average residence time from the recharge area of 6–193 years (table 2). These data indicate the detected compounds may be derived primarily from recharge from the Missouri River with lesser effects from pesticide or herbicide application at the land surface.
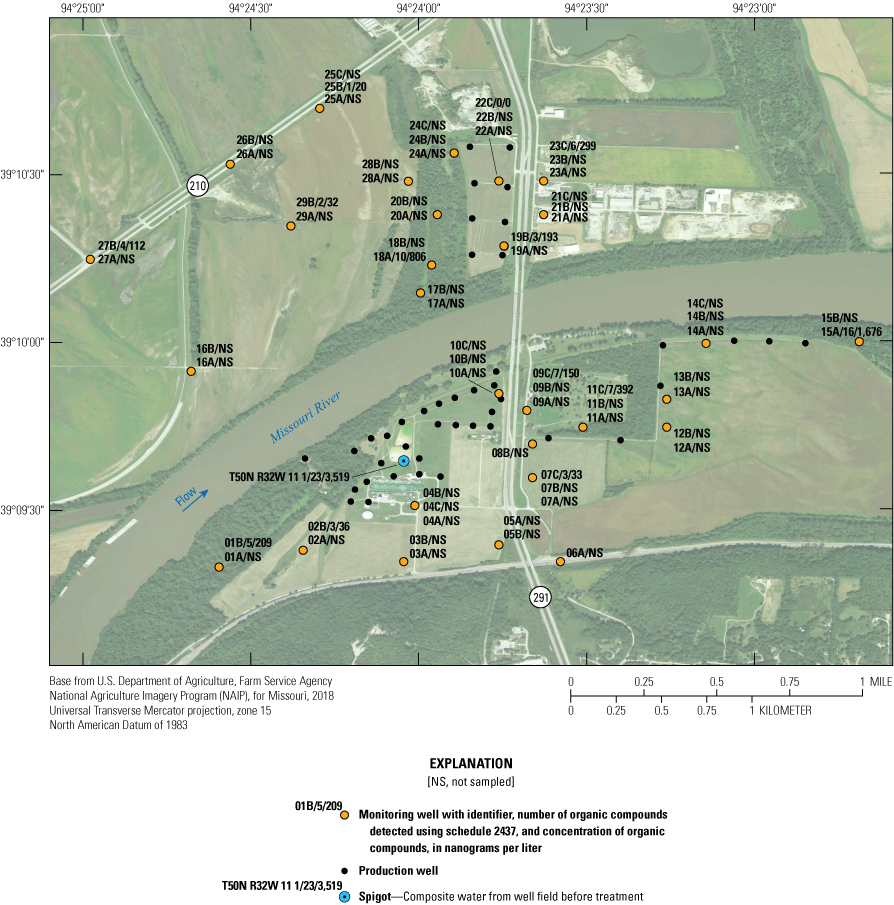
Number and total concentration of organic compounds detected in monitoring wells and well-field composite samples from production wells using schedule 2437 at the Independence well field, Missouri, 2018.
The most commonly detected compounds were the herbicides metolachlor, acetochlor, and sulfentrazone or their degradation products. These compounds, including degradation products, were only analyzed in the 2018 samples but were detected in at least one-half of the samples.
Metolachlor was detected in only 2 of 14 samples collected during 2018, but 4 of its degradation products were more frequently detected: metolachlor sulfonic acid (metolachlor SA; 11 of 14 samples), dechlorometolachlor (8 of 14 samples), hydroxymetolachlor (3 of 14 samples), and metolachlor oxanilic acid (metolachlor OA; in 3 of 14 samples) (U.S. Geological Survey, 2019c). Metolachlor has been widely used on corn, soybeans, and other crops since it was first registered for use by the EPA in 1976 (U.S. Environmental Protection Agency, 1995). Metolachlor or its degradation products were detected in wells 07C, 09C, 11C, 15A, 15B, 18A, 19B, 23C, 25B, 27B, and 29B and at T50N R32W 11 1, and a maximum concentration of 283 ng/L of metolachlor SA was detected at T50N R32W 11 1.
The second most commonly detected compounds were 2 degradation products of the herbicide acetochlor; acetochlor OA (8 of 14 samples) and acetochlor SA (2 of 14 samples). These compounds were detected in wells 07C, 09C, 11C, 15A, 18A, 19B, and 23C and at T50N R32W 11 1, and a maximum concentration of 342 ng/L of acetochlor OA was detected at well 15A. Acetochlor, a widely used agricultural herbicide used on corn and soybeans (Meyer and Scribner, 2009) since 1994, was not detected in any samples.
Sulfentrazone, an herbicide that has been in use since 1997, is used to control weeds in crops such as soybeans and in turf grasses. Sulfentrazone was detected in 7 of 14 samples (wells 09C, 11C, 15A, 18A, 23C, and 27B and at T50N R32W 11 1) at a maximum concentration of 130 ng/L in T50N R32W 11 1.
Tebuthiuron, hexazinone, isoxaflutole, and metribuzin, or their degradation products, were detected in three or more wells. Tebuthiuron is a broad-spectrum herbicide used primarily to control woody and herbaceous plants in noncrop areas. Tebuthiuron was detected in the 2018 sample from wells 01B, 02B, 09C, 11C, 15A, and at T50N R32W 11 1, and a maximum concentration of 185 ng/L was detected in T50N R32W 11 1. Hexazinone is a broad-spectrum herbicide used to control grasses, broadleaf, and woody plants in agricultural, forest, and industrial areas. Hexazinone or its degradation products (4-Hydroxyhexazinone A and Demethyl hexazinone B) were detected in 2018 samples from wells 01B, 15A, 18A, 19B, and at T50N R32W 11 1. The maximum concentration of hexazinone or its degradates was 15 ng/L of hexazinone at well 01B. Isoxaflutole is used to control certain broadleaf and grass weeds in field corn and soybeans. Isoxaflutole was not detected in any sample but its degradation product, Diketonitrile-isoxaflutole, was detected in wells 11C, 15A, 18A, 19B, and 23C, and a maximum concentration of 18.3 ng/L was detected in well 18A. Metribuzin or its degradation product desamino-metribuzin was detected in wells 15A and 18A, and the largest concentrations were detected at T50N R32W 11 1 (8.9 and 11.3 ng/L, respectively). Metribuzin has been in use since 1973 and has been widely used to selectively control certain broadleaf weeds and grassy weeds in a variety of crops including corn and soybean (U.S. Environmental Protection Agency, 1998). Other compounds detected are listed in appendix 2.
Of the 30 herbicides and pesticides detected in groundwater samples collected during 1997–2018, 27 also have been detected in the Missouri River upstream at Omaha, Nebr., or downstream at Hermann, Mo., and several were detected in the single samples from stations MO–S, MO–C, and MO–N near the well field in 2003 (U.S. Geological Survey, 2019c). Of these 27 herbicides and pesticides, all but 2 (tebuthiuron and a degradation product) were detected in a least 1 sample from the river that exceeded concentrations detected in the well field. These data indicate recharge from the Missouri River to groundwater is likely to be an important source of pesticides and herbicides near the well field. For example, metolachlor SA was detected in 85 of 103 samples from the Missouri River at Omaha with a median concentration of 127 ng/L and a maximum of 720 ng/L compared to a maximum of 283 ng/L in 2018 groundwater samples. Concentrations of metolachlor SA downstream at Hermann, Mo., were similar where it was detected in 80 of 93 samples with a median concentration of 195 ng/L and a maximum of 664 ng/L. Land application of these compounds in the study area also is a viable source.
The fact that multiple herbicides or pesticides were detected in the sole sample from these wells may indicate that a mixture of herbicides and pesticides in the recharge from the Missouri River is entering the alluvial aquifer and is being extracted from the well field. Land application of pesticides and herbicides within the study area also is a potential source of these compounds in the alluvial aquifer, as evidenced by the detection of multiple compounds in well 09C, which is simulated to have 53 percent of its recharge from the local land surface and about a 2-year recharge time (Kelly, 2011). The low concentration of the herbicides and the fact that none of the compounds discussed have an MCL indicates that these compounds are not an immediate concern to the quality of water extracted from the well field. As the remaining wells in the monitoring network are sampled for the expanded list of compounds, a more complete understanding of the distribution of pesticides and herbicides in groundwater within the study area will be obtained.
Emerging Contaminants
Emerging contaminants are defined as chemicals that as of 2020 are not regulated and about which there exist concerns regarding their effect on human or ecological health. Examples of emerging contaminants include disinfection byproducts, pharmaceutical and personal care products, and persistent organic chemicals. These compounds are commonly components of wastewater.
N,N-Diethyl-m-toluamine, also called DEET, is an ingredient in insect repellants. N,N-Diethyl-m-toluamine was detected in at least one-half of the samples from every well in which it was tested for (01A, 03A, 03B, 05A, 06A, 19B, 22B, 22C, and 23C) at a concentration of less than 0.20 µg/L. These wells are south of the well field or are in or near the well field north of the river. N,N-Diethyl-m-toluamine was detected in 8 sample from T50N R32W 11 1, with a max concentration of 0.24 µg/L, indicating that it had entered the well field. Note that N,N-Diethyl-m-toluamine was detected in eight samples from T50N R32W 11 1, indicating that it had entered the well field. N,N-Diethyl-m-toluamine was detected in two of the four trip blank samples for which it was tested at a maximum concentration of 0.17 µg/L (appendix 2). The presence of N,N-Diethyl-m-toluamine in the blank samples indicates the compound may be present in the samples because of field or laboratory contamination rather than being present in the alluvial aquifer. Use of insect repellent by field sampling personnel may account for the high frequency of detection for this compound. There is no regulatory standard for N,N-Diethyl-m-toluamine in water.
Caffeine is a component of coffee and colas and can be a component of wastewater. Caffeine was detected in one sample from wells 03A, 03B, 22C, and 23C and at T50N R32W 11 1. Each of these wells was sampled from 3 to 10 times for caffeine. Caffeine was detected in two of the six samples it was tested for in well 03A. Caffeine was detected at a maximum concentration of 0.5 µg/L. Caffeine was not detected in any blank sample, indicating that these detections are representative of alluvial aquifer conditions.
Caffeine was not detected at a detection limit of 0.08 µg/L in any of the four samples collected from the Missouri River at Omaha and was not tested for at Hermann. N,N-Diethyl-m-toluamine was not tested for in the samples from the Missouri River at Omaha and Hermann (U.S. Geological Survey, 2019c).
Samples collected from the Missouri River at stations MO–S, MO–C, and MO–N (fig. 6) during 2003 were analyzed for a subset of emerging contaminants. N,N-Diethyl-m-toluamine was detected in one of these samples at a concentration of 0.12 µg/L (U.S. Geological Survey, 2019c). Because of its widespread presence in blank samples, N,N-Diethyl-m-toluamine detections in the river and alluvial aquifer are assumed to be due to field or laboratory contamination (appendix 2). Caffeine was detected at each of the stations at concentrations ranging from 0.04 to 0.39 µg/L, indicating that caffeine entering the alluvial aquifer in recharge from the Missouri River may be extracted from the well field at T50N R32W 11 1.
Implications for Future Monitoring
Sampling data indicate that the water quality in the alluvial aquifer has been modified near the well field as a result of recharge from the Missouri River induced by pumping from the well field. As a result of this recharge, water quality at the production wells and in parts of the alluvial aquifer near the well field is similar to that of the river. As a consequence, the primary threat to the potability of the water extracted from the well field is the quality of the water in the river, especially organic compounds. The effects of recharge from the river on water quality are modified by the geochemical conditions in the alluvial aquifer, which range from mixed oxic/anoxic) in several of wells near the well field with travel times of 10 years or less to sulfate reducing near the northwestern part of the well field where residence times in the alluvial aquifer exceed 100 years. Geochemical conditions play a role in the concentration of many of constituents in the alluvial aquifer, including those that affect precipitation-dissolution reactions and the treatability and potability of the water extracted from the well field. Therefore, the geochemical conditions in the alluvial aquifer also affect the potability and treatability of the water extracted from the well field.
Although it is probable that areas of the alluvial aquifer with low concentrations of sulfate have sulfate-reducing conditions, this interpretation cannot be verified with the available data. Analysis of samples for concentrations of sulfide compounds during at least one sampling event would fill this data gap. Because sulfate-reducing conditions also can be associated with the generation of methane, sampling of selected wells for concentrations of methane also could be considered.
Adding bromide to the list of analytes would enable identification of chloride/bromide ratios. These data can be used to identify sources of chloride (Davis and others, 1998), which can be used to assess groundwater travel times and provide insight into the sources of other chemical constituents.
Geochemical conditions in the alluvial aquifer are affected by the type and intensity of microbiotic reactions. These reactions use organic carbon. Sampling for organic carbon during at least one sampling event would provide insight into geochemical conditions in the alluvial aquifer.
Data analysis is complicated by the differences in the number of samples collected for the various analytes and the small number of samples collected at some wells. More robust sampling for more analytes at more wells, including continued routine (every well every 3 years) sampling for organic compounds using the more comprehensive laboratory schedule 2437 from the USGS National Water Quality Laboratory, would improve the ability to characterize threats to water quality in the study area. These analyses can be run at the lowest practical detection limit to improve the utility of the analysis. The characterization of water quality is especially needed in the southeastern part of the well field at the 11–15 well clusters where fewer samples have been collected. Expanded sampling in these wells (and others) would improve the characterization of the alluvial aquifer and the identification of threats to the quality of composite water extracted from the well field. Sampling of organic compounds in the Missouri River at the well field also could be considered.
The only constituent consistently detected at concentrations greater than its MCL in the alluvial aquifer was arsenic. Although not consistently detected at concentrations greater than its MCL near the well field, the potential exists for high-arsenic waters on the periphery of the well field to migrate to the pumped wells, particularly if pumping or geochemical conditions change. Median arsenic concentrations indicate some tendency to be highest in areas where median iron and manganese concentrations are elevated but indicate no clear relation to median sulfate concentrations. This interpretation is consistent with the observation that the valence state of arsenic affects its toxicity, concentration, and mobility in the aqueous environment (Jain and Ali, 2000). Ongoing sampling of geochemical indicator properties (dissolved oxygen, nitrate plus nitrite as nitrogen, ammonia as nitrogen, iron, manganese, and sulfate, perhaps sulfide) would help future assessment of the threat of arsenic and other constituents to the well field. Sampling for arsenic species also would help to assess the threat posed by arsenic to the potability of the composite water extracted from the well field.
Monitoring technology has improved since 1997 with the ability to collect continuous (every 15 minutes) readings in near real-time of dissolved oxygen, temperature, specific conductance, chloride, nitrate, and a variety of other constituents by use of ion-specific electrodes. The concentrations of many of these constituents in the alluvial aquifer differ substantially from their concentrations in the Missouri River. Therefore, collection of continuous water-quality data in selected monitoring wells near the river and the well field has the potential to improve the understanding of the timing and extent of recharge from the Missouri River to the alluvial aquifer, particularly for constituents whose concentrations indicate seasonal variation in the river. Analysis of these data could improve time-of-travel estimates through the alluvial aquifer, verify geochemical conditions in parts of the alluvial aquifer, enable identification of seasonality of geochemical conditions and other aspects of water quality (if present), and (possibly) enable identification of optimal sampling times, especially for those compounds brought in with recharge from the river. This information can improve the ability of the City of Independence to identify threats to the quality of water at the well field.
Detailed analysis of the amount of water pumped from each of the water-production wells on a monthly or annual basis would help refine the understanding of the driving force behind flow in the alluvial aquifer and the location and extent of recharge from the river. This information could be used to refine the assessment of the water chemistry in the well-field area and help explain variations in water quality in the composite water extracted from the well field at T50N R32W 11 1. This information also can be used to help refine the pumping regimen so as to minimize issues with water quality at the well field.
Data from 20 years of sampling have identified the constituents that are present in the alluvial aquifer at concentrations greater than and less than regulatory standards. The compounds present at concentrations greater than regulatory standards (especially iron, manganese, and arsenic) have the potential to affect the treatability and potability of water at the well field. The efficacy of the monitoring effort could be improved if the analysis focused on geochemical indicators (dissolved oxygen, nitrate plus nitrite as nitrogen, iron, manganese, and sulfate), indicators of common sources of contamination and means of differentiating source waters (organic compounds, orthophosphate, ammonia, chloride, and hardness, as well as temperature, pH, and specific conductance), and constituents detected at concentrations greater than MCLs with some frequency (arsenic). Less frequent monitoring for constituents that do not have implications for water treatment or whose concentrations were substantially less than MCLs or SMCLs has the potential to save on analytical costs without sacrificing the ability to protect the water resource.
Summary and Conclusions
The U.S. Geological Survey, in cooperation with the City of Independence, Missouri, completed statistical analysis of samples collected from 68 monitoring locations open to the Missouri River alluvial aquifer (hereafter referred to as the “alluvial aquifer”). Samples were collected by the U.S. Geological Survey from 1997 through 2018. This analysis was done to assess the quality of the water in the alluvial aquifer near the well field, identify trends in water quality in the alluvial aquifer from 1997 through 2018, assess hydraulic interaction between the Missouri River and the groundwater system, identify potential threats to the potability of the water extracted from the well field, and identify ways to improve the monitoring effort.
Concentrations of orthophosphate indicated a statistically significant increase in the alluvial aquifer in much of the study area from 1997 through 2018. Concentrations of ammonia as nitrogen indicated a statistically significant decrease during 1997–2018 in much of the shallow part of the alluvial aquifer. The remaining constituents subjected to analysis did not indicate a statistically significant trend (upward or downward) in most of the alluvial aquifer during 1997–2018.
Data indicate that oxygen- and nitrate-reducing conditions are present throughout the alluvial aquifer in the study area. Iron- and manganese-reducing conditions also are present in most or all of the alluvial aquifer. Sulfate-reducing conditions are present in the northern and western parts of the alluvial aquifer away from the well field. Recharge of oxic water from the Missouri River seems to modify the intensity of the iron and manganese reduction near the well field.
Water quality in the alluvial aquifer is generally adequate for public supply, but some issues exist. Iron and manganese concentrations were greater than their secondary maximum contaminant levels in most of the alluvial aquifer. Hardness values indicate water in the alluvial aquifer is very hard. Arsenic concentrations were greater than the maximum contaminant level for drinking water in much of the alluvial aquifer away from the well field. Maximum contaminant levels for antimony, barium, lead, selenium, and uranium were exceeded in at least one sample collected during 1997–2018. Maximum contaminant levels were not exceeded for any other inorganic constituent tested. A variety of organic compounds were detected in the alluvial aquifer at concentrations substantially less than regulatory standards.
Recent recharge of water from the Missouri River to the alluvial aquifer, enhanced by pumping from the well field, is a substantial source of water to the well field. Recharge of water from the Missouri River affects the geochemical environment within the alluvial aquifer, as well as the concentration of several organic and inorganic constituents in the alluvial aquifer. The overall effect of this recharge is to improve the quality of the water extracted from the well field by reducing concentrations of iron, manganese, and arsenic; however, water from the river also contains a variety of organic compounds that likely are being extracted at low concentrations from the well field.
References Cited
Bhattacharya, P., and Samal, A.C., 2018, Fluoride contamination in groundwater, soil and cultivated foodstuffs of India and its associated health risks—A review: Research Journal of Recent Sciences, v. 7, no. 4, p. 36–47, accessed September 20, 2019, at http://www.isca.in/rjrs/archive/v7/i4/6.ISCA-RJRS-2018-028.php.
Davis, S.N., Whittemore, D.O., and Fabryka-Martin, J., 1998, Uses of chloride/bromide ratios in studies of potable water: Ground Water, v. 36, no. 2, p. 338–350. [Also available at https://doi.org/10.1111/j.1745-6584.1998.tb01099.x.]
Helsel, D.R., and Hirsch, R.M., 2002, Statistical methods in water resources: U.S. Geological Survey Techniques of Water-Resources Investigations, book 4, chap. A3, 522 p., accessed September 1, 2019, at https://doi.org/10.3133/twri04A3.
Hem, J.D., 1985, Study and interpretation of the chemical characteristics of natural water (3d ed.): U.S. Geological Survey Water-Supply Paper 2254, 263 p. [Also available at https://pubs.usgs.gov/wsp/wsp2254/.]
Holm, T.R., George, G.K., and Barcelona, M.J., 1986, Dissolved oxygen and oxidation-reduction potentials in ground water: U.S. Environmental Protection Agency, EPA/600/2–86/042, 56 p. [Also available at https://nepis.epa.gov/Exe/ZyPDF.cgi/9100P1BV.PDF?Dockey=9100P1BV.PDF].
Jain, C.K., and Ali, I., 2000, Arsenic—Occurrence, toxicity and speciation techniques: Water Research, v. 34, no. 17, p. 4304–4312, accessed September 18, 2019, at https://doi.org/10.1016/S0043-1354(00)00182-2.
Jurgens, B.C., McMahon, P.B., Chapelle, F.H., and Eberts, S.M., 2009, An Excel workbook for identifying redox processes in ground water: U.S. Geological Survey Open-File Report 2009–1004, 8 p., accessed January 2020 at https://doi.org/10.3133/ofr20091004.
Keith, L.H., 2015, The source of U.S. EPA’s sixteen PAH priority pollutants, polycyclic aromatic compounds, v. 35, nos. 2–4, p. 147–160. [Also available at https://doi.org/10.1080/10406638.2014.892886.]
Kelly, B.P., 1996, Design of a monitoring well network for the City of Independence, Missouri, well field using simulated ground-water flow paths and travel times: U.S. Geological Survey Water-Resources Investigations Report 96–4264, 27 p. [Also available at https://doi.org/10.3133/wri964264.]
Kelly, B.P., 2002a, Ground-water flow simulation and chemical and isotopic mixing equation analysis to determine source contributions to the Missouri River alluvial aquifer in the vicinity of the Independence, Missouri, well field: U.S. Geological Survey Water-Resources Investigations Report 2002–4208, 31 p. [Also available at https://doi.org/10.3133/wri024208.]
Kelly, B.P., 2002b, Ground-water monitoring plan, water quality, and variability of agricultural chemicals in the Missouri River alluvial aquifer near the City of Independence, Missouri, well field, 1998–2000: U.S. Geological Survey Water-Resources Investigations Report 2002–4096, 19 p. [Also available at https://doi.org/10.3133/wri024096.]
Kelly, B.P., 2011, Contributing recharge areas, groundwater travel time, and groundwater quality of the Missouri River alluvial aquifer near the Independence, Missouri, well field, 1997–2008: U.S. Geological Survey Scientific Investigations Report 2010–5232, 133 p. [Also available at https://doi.org/10.3133/sir20105232.]
Kelly, B.P., and Blevins, D.W., 1995, Vertical hydraulic conductivity of soil and potentiometric surface of the Missouri River alluvial aquifer at Kansas City, Missouri and Kansas–August 1992 and January 1993: U.S. Geological Survey Open-File Report 95–322, 19 p. [Also available at https://doi.org/10.3133/ofr95322.]
Kelly, B.P., and Rydlund, P.H., Jr., 2006, Water-quality changes caused by riverbank filtration between the Missouri River and three pumping wells of the Independence, Missouri, well field 2003–05: U.S. Geological Survey Scientific Investigations Report 2006–5174, 48 p. [Also available at https://doi.org/10.3133/sir20065174.]
McMahon, P.B., and Chapelle, F.H., 2008, Redox processes and water quality of selected principal alluvial aquifer systems: Ground Water, v. 46, no. 2, p. 259–271. [Also available at https://doi.org/10.1111/j.1745-6584.2007.00385.x.]
McMahon, P.B., Chapelle, F.H., and Bradley, P.M., 2011, Evolution of redox processes in groundwater, chap. 26 of Tratnyek, P.G., Grundi, T.J., and Haderlein, S.B., eds., Aquatic redox chemistry: Washington, D.C., American Chemical Society, ACS Symposium Series, v. 1071, p. 581–597. [Also available at https://doi.org/10.1021/bk-2011-1071.ch026.]
Meyer, M.T., and Scribner, E.A., 2009, The evolution of analytical technology and its impact on water-quality studies for selected herbicides and their degradation products in water, chap. 13 of Ahuja, S., ed., Handbook of water purity and quality: Amsterdam, Academic Press, p. 289–313., accessed April 15, 2020, at https://doi.org/10.1016/B978-0-12-374192-9.00013-3.
Miao, Z., Brusseau, M.L., Carroll, K.C., Carreón-Diazconti, C., and Johnson, B., 2012, Sulfate reduction in groundwater—Characterization and applications for remediation: Environmental Geochemistry and Health, v. 34, no. 4, p. 539–550, accessed September 23, 2019, at https://doi.org/10.1007/s10653-011-9423-1.
Mullaney, J.R., Lorenz, D.L., and Arntson, A.D., 2009, Chloride in groundwater and surface water in areas underlain by the glacial alluvial aquifer system, northern United States: U.S. Geological Survey Scientific Investigations Report 2009–5086, 41 p., accessed September 23, 2019, at https://doi.org/10.3133/sir20095086.
Piper, A.M., 1944, A graphic procedure in the geochemical interpretation of water-analyses: Transactions of the American Geophysical Union, v. 25, no. 6, p. 914–928. [Also available at https://doi.org/10.1029/TR025i006p00914.]
R Core Team, 2013, R—A language and environment for statistical computing: Vienna, Austria, R Foundation for Statistical Computing, accessed November 2019 at https://www.r-project.org/.
Shoda, M.E., Nowell, L.H., Stone, W.W., Sandstrom, M.W., and Bexfield, L.M., 2018, Data analysis considerations for pesticides determined by National Water Quality Laboratory schedule 2437: U.S. Geological Survey Scientific Investigations Report 2018–5007, 458 p., accessed November 2019 at https://doi.org/10.3133/sir20185007.
Smedley, P.L., and Kinniburgh, D.G., 2002, A review of the source, behavior, and distribution of arsenic in natural waters: Applied Geochemistry, v. 17, no. 5, p. 517–568, accessed September 25, 2019, at https://doi.org/10.1016/S0883-2927(02)00018-5.
Stumm, W., and Morgan, J.J., 1995, Aquatic chemistry—Chemical equilibria and rates in natural waters (3d ed.): New York, John Wiley and Sons, 1,040 p. [Also available at https://www.wiley.com/en-us/Aquatic+Chemistry%3A+Chemical+Equilibria+and+Rates+in+Natural+Waters%2C+3rd+Edition-p-9780471511854.]
U.S. Environmental Protection Agency, 1992, Ground water issue, behavior of metals in soils: U.S. Environmental Protection Agency, EPA–540–S–92–018, 25 p., accessed April 15, 2020, at https://nepis.epa.gov/Exe/ZyPDF.cgi/10002DSF.PDF?Dockey=10002DSF.PDF.
U.S. Environmental Protection Agency, 1995, R.E.D. facts—Metolachlor: U.S. Environmental Protection Agency, EPA–738–F–95–00, 14 p., accessed April 15, 2020, at https://www3.epa.gov/pesticides/chem_search/reg_actions/reregistration/fs_PC-108801_1-Apr-95.pdf.
U.S. Environmental Protection Agency, 1998, R.E.D. facts—Metriuzin: U.S. Environmental Protection Agency, EPA–738–F–96–006, 7 p., accessed April 15, 2020, at https://www3.epa.gov/pesticides/chem_search/reg_actions/reregistration/fs_PC-101101_1-Feb-98.pdf.
U.S. Environmental Protection Agency, 2002, Toxicological review of phenol: U.S. Environmental Protection Agency, EPA/635/R–02/006, 213 p., accessed April 29, 2020, at https://cfpub.epa.gov/ncea/iris/iris_documents/documents/toxreviews/0088tr.pdf.
U.S. Environmental Protection Agency, 2019a, National primary drinking water regulations: U.S. Environmental Protection Agency web page, accessed September 13, 2019, at https://www.epa.gov/ground-water-and-drinking-water/national-primary-drinking-water-regulations.
U.S. Environmental Protection Agency, 2019b, Secondary drinking water standards—Guidance for nuisance chemicals: U.S. Environmental Protection Agency web page, accessed September 13, 2019, at https://www.epa.gov/sdwa/secondary-drinking-water-standards-guidance-nuisance-chemicals.
U.S. Geological Survey, 1999, The quality of our Nations’ waters—Nutrient and pesticides: U.S. Geological Survey Circular 1225, 82 p., accessed September 20, 2019, at https://doi.org/10.3133/cir1225.
U.S. Geological Survey, 2019a, Arsenic found in groundwater: U.S. Geological Survey web page, accessed September 13, 2019, at https://www.usgs.gov/mission-areas/water-resources/science/arsenic-and-drinking-water?qt-science_center_objects=3#qt-science_center_objects.
U.S. Geological Survey, 2019b, Contamination of groundwater: U.S. Geological Survey web page, accessed September 13, 2019, at https://www.usgs.gov/special-topic/water-science-school/science/contamination-groundwater?qt-science_center_objects=0#qt-science_center_objects.
U.S. Geological Survey, 2019c, USGS water data for the Nation: U.S. Geological Survey National Water Information System database, accessed September 4, 2019, at https://doi.org/10.5066/F7P55KJN.
U.S. Geological Survey, 2019d, Water hardness and alkalinity: U.S. Geological Survey web page, accessed September 13, 2019, at https://water.usgs.gov/owq/hardness-alkalinity.html#briggs. [Also available at https://www.usgs.gov/special-topic/water-science-school/science/water-properties-information-topic?qt-science_center_objects=0#qt-science_center_objec ts.]
U.S. Geological Survey, [variously dated], National field manual for the collection of water-quality data: U.S. Geological Survey Techniques of Water-Resources Investigations, book 9, chaps. A1–A9, accessed September 2019 at https://www.usgs.gov/mission-areas/water-resources/science/national-field-manual-collection-water-quality-data-nfm?qt-science_center_objects=0#qt-scie nce_center_objects.
Wessa, P., 2017, Kendall tau rank correlation (ver. 1.0.13)—Free statistics software (ver. 1.2.1): Office for Research Development and Education web page, accessed July 29, 2019, at https://www.wessa.net/rwasp_kendall.wasp.
Wiedemeier, T.H., Swanson, M.A., Moutoux, D.E., Gordon, E.K., Wilson, J.T., Wilson, B.H., Kampbell, D.H., Hansen, J.E., Haas, P.E., Miller, R.N., Hansen, J.E., and Chapelle, F.H., 1998, Technical protocol for evaluating natural attenuation of chlorinated solvents in ground water: U.S. Environmental Protection Agency, EPA/600/R–98/128, variously paged. [Also available at https://cfpub.epa.gov/si/si_public_record_Report.cfm?Lab=NRMRL&dirEntryID=99187.]
Wilkison, D.H., 2012, Groundwater monitoring plan for the Missouri River alluvial aquifer in the vicinity of the City of Independence, Missouri, well field: U.S. Geological Survey Scientific Investigations Report 2012–5050, 35 p., accessed August 2019 at https://doi.org/10.3133/sir20125050.
Appendix 1. Summary Statistics for Selected Constituents in Samples from the Independence Well Field, 2008–18
Reference Cited
U.S. Geological Survey, 2019, USGS water data for the Nation: U.S. Geological Survey National Water Information System database, accessed September 4, 2019, at https://doi.org/10.5066/F7P55KJN.
Appendix 2. Summary of Organic Compounds Detected in Samples from the Independence Well Field, 2008–18
Reference Cited
U.S. Geological Survey, 2019, USGS water data for the Nation: U.S. Geological Survey National Water Information System database, accessed September 4, 2019, at https://doi.org/10.5066/F7P55KJN.
Datum
Vertical coordinate information is referenced to the National Geodetic Vertical Datum of 1929 (NGVD 29) or North American Vertical Datum of 1988 (NAVD 88).
Horizontal coordinate information is referenced to the North American Datum of 1983 (NAD 83).
Elevation, as used in this report, refers to distance above the vertical datum.
Supplemental Information
Concentrations of chemical constituents in water are given in milligrams per liter (mg/L), micrograms per liter (μg/L), or nanograms per liter (ng/L).
For more information about this publication, contact:
Director, USGS Central Midwest Water Science Center
1400 Independence Road
Rolla, MO 65401
573–308–3667
For additional information, visit: https://www.usgs.gov/centers/cm-water
Publishing support provided by the
Rolla Publishing Service Center
Disclaimers
Any use of trade, firm, or product names is for descriptive purposes only and does not imply endorsement by the U.S. Government.
Although this information product, for the most part, is in the public domain, it also may contain copyrighted materials as noted in the text. Permission to reproduce copyrighted items must be secured from the copyright owner.
Suggested Citation
Kay, R.T., Krempa, H.M., and Hulsey, K.M., 2022, Water quality in the Missouri River alluvial aquifer near the Independence, Missouri, well field, 1997–2018: U.S. Geological Survey Scientific Investigations Report 2022–5027, 63 p., https://doi.org/10.3133/sir20225027.
ISSN: 2328-0328 (online)
Study Area
| Publication type | Report |
|---|---|
| Publication Subtype | USGS Numbered Series |
| Title | Water quality in the Missouri River alluvial aquifer near the Independence, Missouri, well field, 1997–2018 |
| Series title | Scientific Investigations Report |
| Series number | 2022-5027 |
| DOI | 10.3133/sir20225027 |
| Publication Date | May 17, 2022 |
| Year Published | 2022 |
| Language | English |
| Publisher | U.S. Geological Survey |
| Publisher location | Reston, VA |
| Contributing office(s) | Central Midwest Water Science Center |
| Description | Report: vi, 63 p.; Appendixes; Dataset |
| Country | United States |
| State | Missouri |
| City | Independence |
| Other Geospatial | Missouri River |
| Online Only (Y/N) | Y |
| Additional Online Files (Y/N) | Y |


