

Water-Quality Data and Trends in the Rapid Creek Basin, South Dakota, 1970–2020
Links
- Document: Report (21.1 MB pdf) , HTML , XML
- Dataset: USGS National Water Information System database —USGS water data for the Nation
- Data Release: USGS data release - Model scripts and water-quality data for trends in the Rapid Creek Basin, South Dakota, 1970–2020
- NGMDB Index Page: National Geologic Map Database Index Page (html)
- Download citation as: RIS | Dublin Core
Acknowledgments
The authors would like to thank the South Dakota Department of Agriculture and Natural Resources and the City of Rapid City Public Works Department for providing data and technical guidance for this study.
The authors also would like to acknowledge the staff from the U.S. Geological Survey Dakota Water Science Center who supported the project by assisting with data collection, administration, and technical reviews.
Abstract
Surface-water-quality data in the Rapid Creek Basin in South Dakota were compiled to assess basic trends in the water quality of Rapid Creek. Spatial and temporal patterns in water quality were described for major ions, sediment, total suspended solids, nutrients, field measurements, bacteria, and select metals for the period of 1970–2020, and a water-quality trend analysis was completed for sites with enough data for selected constituents.
Major ions and total suspended solids had higher median concentrations in the lower basin (downstream from the city of Rapid City) relative to the upper and middle basins. Nutrient concentrations were generally low, and increased concentrations were only detected at the sites downstream from the City of Rapid City Water Reclamation Facility. Fecal indicator bacteria (Escherichia coli and fecal coliform) concentrations were highest downstream from the main urbanized area of Rapid City.
Water-quality trends were analyzed for total dissolved solids, specific conductance, calcium, magnesium, total suspended solids, total phosphorus, dissolved phosphorus, and total Kjeldahl nitrogen for the period of 1979–2019. Concentrations for major ions and total dissolved solids typically changed by less than 15 percent. Total dissolved solids concentrations upstream from Rapid City were generally decreasing, whereas concentrations downstream were generally increasing. The flow-averaged geometric mean concentration of total dissolved solids at three sites upstream from Rapid City decreased overall by 3–5 percent, and concentrations at two sites downstream from Rapid City increased by at least 7 percent between 1979 and 2019. Trends in specific conductance in the Rapid Creek Basin were mixed with alternating increasing and decreasing trends at many of the sites between 1979 and 2014. Total suspended solids concentrations were observed to be decreasing at two sites analyzed for trends. Concentrations in total phosphorus were observed to be decreasing at every site analyzed for trends between 1989 and 2014. Significant downward trends in total Kjeldahl nitrogen were observed at two sites in the lower Rapid Creek Basin for the trend period of 1999–2019. The decreases in total suspended solids and nutrient concentrations in the Rapid Creek Basin could be related to several processes such as the implementation of a stormwater management plan in Rapid City, improvements to the water reclamation facility downstream from Rapid City, and residual climatic effects.
Introduction
Rapid Creek in the Black Hills of South Dakota is a valuable spawning area for a self-sustaining trout fishery, actively used for recreation; a municipal water supply for the city of Rapid City and other entities; and a water supply for agricultural irrigation. It is important to monitor and assess changes in water-quality conditions in Rapid Creek for management and sustainability of these uses. The South Dakota Department of Agriculture and Natural Resources (SD DANR) assigns streams and rivers in the State with 1 or more of 11 beneficial uses: (1) domestic water-supply waters; (2) cold water permanent fish life propagation waters; (3) cold water marginal fish life propagation waters; (4) warm water permanent fish life propagation waters; (5) warm water semipermanent fish life propagation waters; (6) warm water marginal fish life propagation waters; (7) immersion recreation waters; (8) limited contact recreation waters; (9) fish and wildlife propagation, recreation, and stock watering waters; (10) irrigation waters; and (11) commerce and industry waters (South Dakota Department of Agriculture and Natural Resources, 2021). Rapid Creek within and upstream from the city of Rapid City has beneficial uses of groups 1, 2, and 7–10, representing uses for water supply, fisheries, recreation, and irrigation. Rapid Creek downstream from the Rapid City Water Reclamation Facility (WRF; fig. 1) has beneficial uses of groups 4 and 7–10.
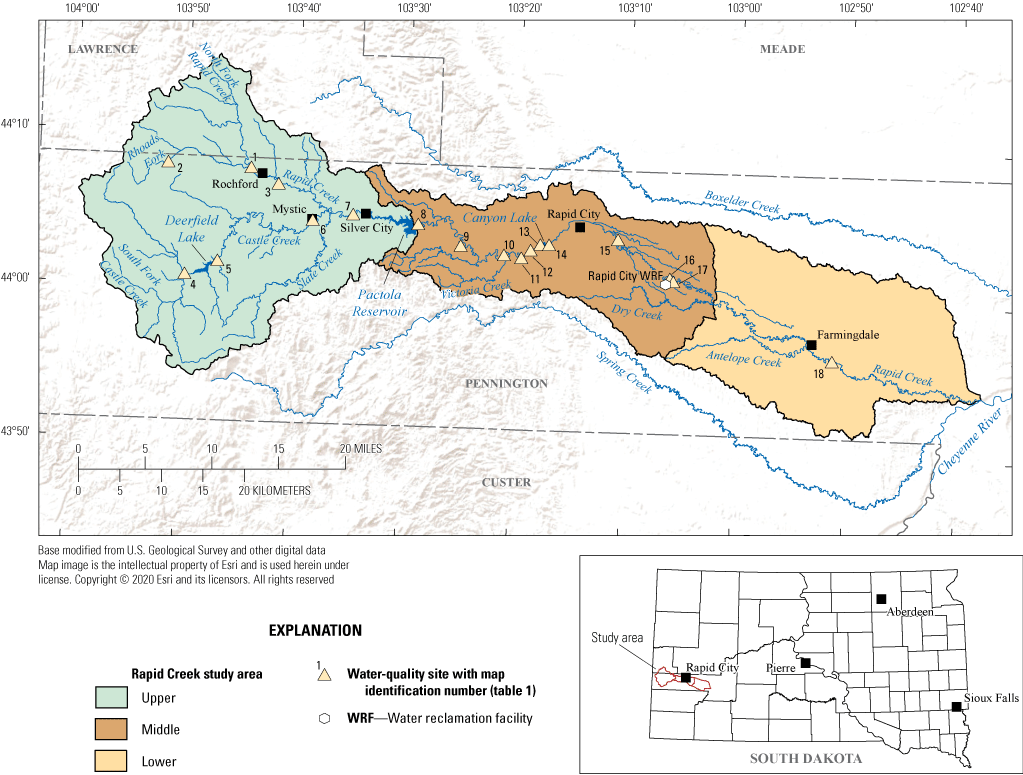
Location of Rapid Creek and study sites.
Numerous governmental and academic entities have collected water-quality data in the Rapid Creek Basin since the 1970s with varying record durations and spatial locations. Data collected as part of the SD DANR’s ambient water-quality monitoring program (South Dakota Department of Agriculture and Natural Resources, 2022) form the longest and most complete record of long-term water quality in Rapid Creek, and data from 1970 through 2020 were collected at numerous sites. Several other synoptic studies have been completed in the Rapid Creek Basin, typically lasting 3–5 years. In these shorter term studies, water-quality constituents associated with the SD DANR beneficial-use criteria were often the only constituents monitored, and the most common were total suspended solids (TSS), fecal indicator bacteria (Escherichia coli [E. coli] and fecal coliform; referred to as “bacteria”), nutrient constituents, and field measurements (pH, specific conductance [SC], dissolved oxygen, and water temperature). Data from these studies are not always stored in a uniform manner, and some data are not archived in publicly available online databases, which represents a challenge to Rapid Creek water management agencies when comparing water-quality information from the last 5 to 10 years to previous data collected over the past 50 years.
Purpose and Scope
The purpose of this report is to compile and describe the available surface-water-quality data in the Rapid Creek Basin spatially and temporally using statistical summaries and trend analysis, where sufficient data exist. This effort is intended to meet a critical need to understand water quality in the basin by describing spatial and temporal patterns in water quality, identifying gaps in the data, and providing a framework for future monitoring efforts. Water-quality data were compiled for 1970–2020 from the National Water Quality Monitoring Council Water Quality Portal (WQP; National Water Quality Monitoring Council, 2022), and streamflow data for selected sites were obtained from the U.S. Geological Survey (USGS) National Water Information System (NWIS) database (U.S. Geological Survey, 2022).
Description of Study Area
Rapid Creek originates from springs on what is commonly referred to as the “Limestone Plateau” in the western Black Hills and flows east through Rapid City to its mouth at the Cheyenne River, draining an area of about 715 square miles (mi2; fig. 1). The mean annual streamflow for Rapid Creek above Pactola Reservoir at Silver City (site 7; fig. 1, table 1) was 56 cubic feet per second (ft3/s) during water years 1970–2020 with a drainage area of 293 mi2. The mean annual streamflow for Rapid Creek at Rapid City (USGS streamgage 06414000, not shown) during water years 1970–2020 was 78 ft3/s with a drainage area of 413 mi2. The mean annual streamflow during water years 1970–2020 for Rapid Creek near Farmingdale (site 18) was 89 ft3/s with a drainage area of 603 mi2. All streamflow data are from the USGS NWIS database (U.S. Geological Survey, 2022).
Table 1.
Sites in the Rapid Creek Basin included in the data compilation and analyses.[USGS, U.S. Geological Survey; SD DANR, South Dakota Department of Agriculture and Natural Resources; --, not applicable; SS, statistical summary; T, trend analysis; WRF, water reclamation facility]
| Map identification number (fig. 1) | USGS site identification number(s)1 | SD DANR site identification number(s) | Site name | Collecting agency | Latitude, in decimal degrees | Longitude, in decimal degrees | Flow data | Analysis type1 |
|---|---|---|---|---|---|---|---|---|
| 1 | -- | UPRAPIDT04, 460178 | North Fork Rapid Creek, S. Dak. | SD DANR | 44.13143 | −103.73629 | -- | SS |
| 2 | 06408700 | 460179 | Rhoads Fork near Rochford, S. Dak. | USGS, SD DANR | 44.13387149 | −103.86159 | USGS, 06408700 | SS, T |
| 3 | -- | 460647 | Rapid Creek near Rochford, S. Dak. | SD DANR | 44.11485 | −103.69431 | Estimated | SS, T |
| 4 | 06409000 | -- | Castle Creek above Deerfield Reservoir near Hill City, S. Dak. | USGS | 44.01359238 | −103.83048 | USGS, 06409000 | SS, T |
| 5 | 06410000 | RAPSPECCCD03, CASTLETSS03, | Castle Creek below Deerfield Dam, S. Dak. | USGS, SD DANR | 44.02914848 | −103.78187 | USGS, 06410000 | SS, T |
| 6 | -- | RAPSPECCCD01, 460646 | Castle Creek near Mystic, S. Dak. | SD DANR | 44.076833 | −103.64096 | Estimated | SS, T |
| 7 | 06410500 | RAPSPECRC0A | Rapid Creek above Pactola Reservoir at Silver City, S. Dak. | USGS, SD DANR | 44.08470785 | −103.58047 | USGS, 06410500 | SS, T |
| 8 | 06411500, 440436103285402 | CANYONZCL01, RAPSPECRC0, RAPSPECRC1, 460920 | Rapid Creek below Pactola Dam, S. Dak. | USGS, SD DANR | 44.07665378 | −103.48213 | USGS, 06411500 | SS, T |
| 9 | 06412000 | CANYONZCL02, CANYONZCL03 | Rapid Creek at Big Bend near Rapid City, S. Dak. | USGS | 44.05498747 | −103.41713 | USGS, 06412000 | SS |
| 10 | 06412200 | -- | Rapid Creek above Victoria Creek near Rapid City, S. Dak. | USGS | 44.0465988 | −103.35157 | USGS, 06412200 | SS |
| 11 | 440239103193001 | RAPSPECRC4, 460669 | Rapid Creek below Tittle Springs, S. Dak. | USGS, SD DANR | 44.04415446 | −103.32546 | Estimated | SS, T |
| 12 | 06412500, 06412510 | LRCABOVECANYON | Rapid Creek above Canyon Lake near Rapid City, S. Dak. | USGS, SD DANR | 44.05276555 | −103.31185 | USGS, 06412510 | SS, T |
| 13 | 06412900 | -- | Rapid Creek below Cleghorn Springs at Rapid City, S. Dak. | USGS | 44.0591544 | −103.29741 | USGS, 06412900 | SS |
| 14 | 06413200, 440333103170001 | CANYONZCL07, LRCPARKDRIVE | Rapid Creek below Park Drive at Rapid City, S. Dak. | USGS, SD DANR | 44.05915448 | −103.28435 | USGS, 06413200 | SS |
| 15 | 06416000 | LRCHAWTHORNE, 460173 | Rapid Creek below Hawthorn Ditch at Rapid City, S. Dak. | USGS, SD DANR | 44.06726568 | −103.18093 | USGS, 06416000 | SS |
| 16 | 06418800, 440126103054701 | LRCABOVEWWTP, 460110 | Rapid Creek above WRF near Rapid City, S. Dak. | USGS, SD DANR | 44.02680556 | −103.10111 | USGS, 06418800 | SS, T |
| 17 | 06418900, 440123103053300 | LRCBELOWWWTP, LOWCHEYRPC03, 46092 | Rapid Creek below sewage treatment plant near Rapid Creek, S. Dak. | USGS, SD DANR | 44.0236549 | −103.09584 | USGS, 06418900 | SS, T |
| 18 | 06421500, 435630102511502 | LOWCHEYRPC04, LRCFARMINGDALE, 460910 | Rapid Creek near Farmingdale, S. Dak. | USGS, SD DANR | 43.94210239 | −102.85392 | USGS, 06421500 | SS, T |
Land use in the Rapid Creek Basin is largely rural; 48 percent is forested, 35 percent is grasslands, and only 5 percent is developed (fig. 2; Dewitz and U.S. Geological Survey, 2021). Agricultural land use in the basin consists of only about 5 percent of the basin, 3 percent is hay and pasture and 2 percent is cultivated crops, and generally is in the lower basin (fig. 2; Dewitz and U.S. Geological Survey, 2021). Forest land use is mainly in the upper basin and is defined as evergreen forest, deciduous forest, and mixed forest land-use types (Homer and others, 2015; Dewitz and U.S. Geological Survey, 2021). Developed land use in the Rapid Creek Basin increased from about 34 mi2 in 2001 to 39 mi2 in 2019, or about 1 percent (Homer and others, 2004; Dewitz and U.S. Geological Survey, 2021). Cotillon (2013) investigated land-use changes in the Black Hills from 1950 to 2010 and determined that in the Black Hills National Forest, 53 percent of the sampled area’s land use had changed; however, most of that change was from dense forest to medium forest, open forest, or grassland. That study also indicated that some of the changes included converting forest land to pasture or developed land (Cotillon, 2013).
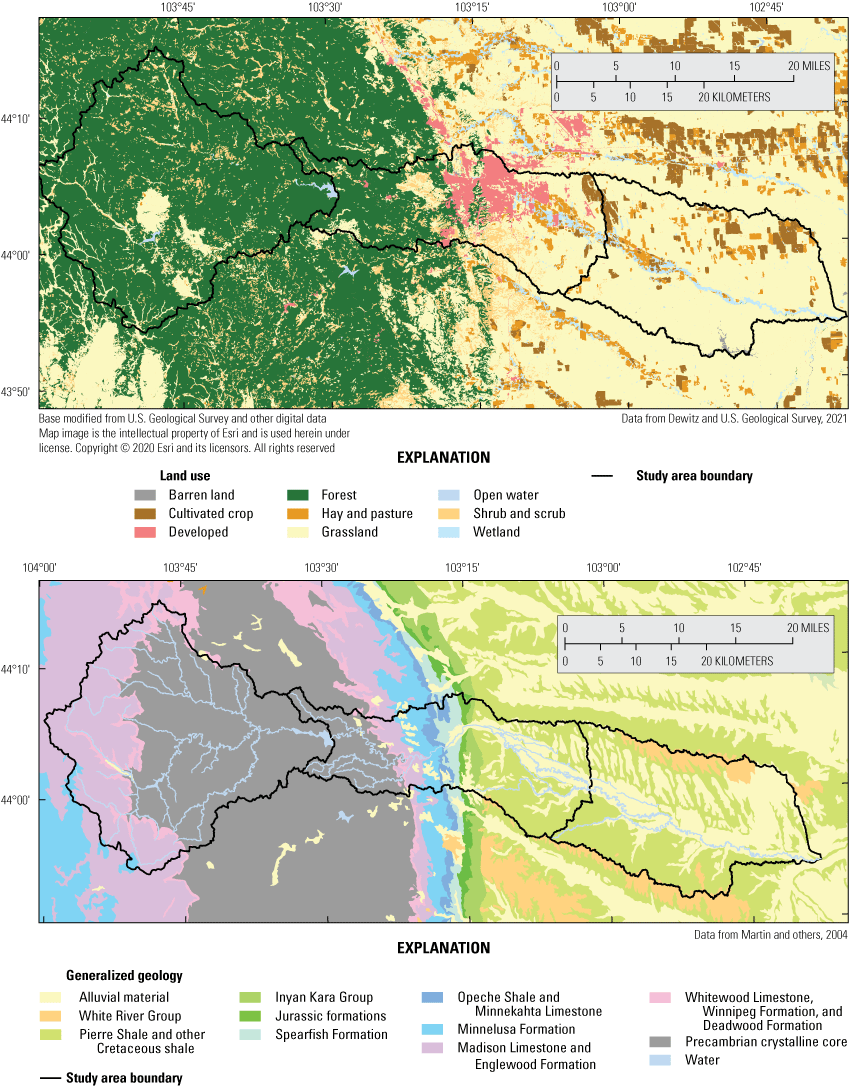
Land use (modified from Dewitz and U.S. Geological Survey, 2021) and generalized geology (modified from Martin and others, 2004) in the Rapid Creek Basin.
Most of the higher elevations in the basin are heavily forested with Pinus ponderosa Douglas ex P. Lawson & C. Lawson (ponderosa pine), which is the primary product of an active timber industry. Picea engelmannii Parry ex Engelm. (white spruce), Populus tremuloides Michx. (quaking aspen), Betula papyrifera Marshall (paper birch), and other native trees and shrubs are in cooler, wetter areas (Orr, 1959). The lower elevation areas surrounding the Black Hills primarily are urban, suburban, and agricultural. Rangeland, hay land, and winter wheat farming are the principal agricultural uses for dryland areas. Alfalfa, corn, and vegetables are produced in bottom lands and in irrigated areas. Various other crops, primarily for cattle fodder, are produced in dryland areas and in bottom lands.
Beginning in the 1870s, the Black Hills have been mined for many commodities including gold, silver, tin, tungsten, mica, feldspar, bentonite, beryl, lead, zinc, uranium, lithium, sand, gravel, and oil (U.S. Department of Interior, 1967). Mines within the study area have used placer mining, small surface pits, underground mines, and open-pit mines. Much of the mining activities in the Rapid Creek Basin were active in the upper basin near Rochford, South Dakota, but those mines have not been operational since the late 1930s (Bayley, 1972).
Previous Work
Water-quality conditions in the Black Hills through 1998 are summarized in Williamson and Carter (2001) and include primarily USGS data sources. Surface-water quality depends largely on the geology of the area. Williamson and Carter (2001) described water quality for headwater springs, crystalline core sites, artesian springs, and exterior sites of the Black Hills. Headwater springs originate from the Paleozoic units, such as the Madison Limestone, on the western side of the Black Hills, and the springs tend to have mostly unchanging water-quality characteristics because of the groundwater source. Other streams originate in the Precambrian rocks of the crystalline core and tend to have more variability than the headwater springs. Artesian springs develop downgradient from loss zones and contribute much of the base flow to exterior streams beyond the Black Hills (Williamson and Carter, 2001). The Rapid Creek Basin is within all four of these geologic areas, originating in the western headwater springs and flowing east across the crystalline core and onto the exterior plains (fig. 2).
Several short-term (3 to 5 years) monitoring efforts have examined Rapid Creek water quality on the western edge of Rapid City upstream from and within Canyon Lake. Stewart and others (1989) sampled nine sites between 1987 and 1988 to examine the effects of the Cleghorn Springs State Fish Hatchery on downstream water quality. Delzer (1993) describes a similar extension of this monitoring effort during 1991 and 1992. These studies focused on nutrient loading coming from the Cleghorn Springs State Fish Hatchery discharge entering Rapid Creek just upstream from Canyon Lake. The Cleghorn Springs State Fish Hatchery was renovated in 2006 in part to improve the water quality of discharged water to Rapid Creek (Woodard, 2006). More recent USGS sampling efforts have collected nutrient and bacteria data around Canyon Lake during 2017–21; these data are available in the USGS NWIS database (U.S. Geological Survey, 2022). Another sampling study focused on sources of bacteria in Rapid Creek in the reach from Canyon Lake downstream to the WRF during 2016–17 (H2E, Inc., 2018).
For the urban area inside the Rapid City boundary, multiple studies have examined the quantity and quality of the runoff associated with storm events. Hoogestraat (2015, 2020) provided the most recent compilation of stormwater information in the Rapid City area, wherein stormwater quality was assessed in urban drainages during 2008–18. In those studies, event-mean concentrations of TSS and bacteria typically exceeded relevant beneficial-use criteria for Rapid Creek by 1–2 orders of magnitude. Baker (2010) presented an early subset of the water-quality data for the Arrowhead drainage basin (not shown). Fisher (2011) evaluated the effectiveness of several structures for the management of stormwater quantity and quality on the Rapid Creek drainage basin. Krantz (2002) implemented a 2-year water-quality sampling program on Rapid Creek to investigate potential effects of stormwater runoff on the Salmo trutta (Linnaeus, 1758) (brown trout) population. Results of the study by Krantz (2002) indicated that TSS and turbidity increase in Rapid Creek through the city of Rapid City to levels that could potentially pose a threat to trout health. Pirner and Harms (1978) completed a study to determine the potential of urban runoff as a source of pollution in Rapid Creek. The Nationwide Urban Runoff Program chose Rapid City as one of its locations for study during the early 1980s and tested for numerous water-quality constituents (U.S. Environmental Protection Agency, 1983). In a report to the South Dakota Department of Environment and Natural Resources and the City of Rapid City, Kenner and Craft (1997) described a study on different parts of the Rapid Creek drainage to assess the effects on the quality of the overall creek system. Schiferl (2011) evaluated the potential contribution of bottom sediments as a source of fecal coliform bacteria in stormwater runoff in two drainage basins in Rapid City. Prann (2013) evaluated the effect of impervious surfaces on surface-water quality using calibrated hydrologic models. All these studies indicate that the TSS concentrations and fecal coliform concentrations in the stormwater runoff in urban drainage basins have the potential to adversely affect the quality of the waters in the Rapid Creek Basin. Groundwater quality in the Rapid Creek Basin was not a focus of this study but is described in Williamson and Carter (2001), Driscoll and others (2002), and Putnam and others (2008).
Methods of Analysis
Water-quality data for selected sites and constituents in the Rapid Creek Basin were obtained from the WQP (National Water Quality Monitoring Council, 2022), and available streamflow data for selected sites were obtained from the USGS NWIS database (U.S. Geological Survey, 2022). Data were selected for the period of 1970–2020. The water-quality data compiled and described in this report also are available in a USGS data release (Tatge and others, 2022b). Analyses applied to this study include descriptive statistics, such as percentiles of constituent concentrations, and trend analysis to evaluate long-term changes in the Rapid Creek Basin.
Site and Constituent Selection
Water-quality data for all sites with major ions, total dissolved solids (TDS), suspended sediment and solids, nutrients, field measurements, bacteria, and trace metals in the Rapid Creek Basin were retrieved from the WQP (National Water Quality Monitoring Council, 2022). Trace metal data before 1992 were not used in this study because of changes in analyses at the USGS National Water Quality Laboratory and changes in data collection methods (Hoffman and others, 1996). The WQP retrieval included data collected by various Federal and State agencies, including the USGS and SD DANR.
Within the Rapid Creek Basin, 18 sites were selected for water-quality analyses (table 1; fig. 1). The initial retrieval of water-quality data from the WQP produced 382 sites. Sites associated with an urban study and lake, spring, and precipitation sites were removed. Additionally, USGS sites with one value or only 1 year of sampling were removed, and colocated USGS sites that had different USGS station numbers were combined. Lastly, USGS and SD DANR sites that were in proximity were combined to finalize the 18 stream sites with enough data available for analysis.
Constituents collected at the selected sites in the basin also were evaluated for data availability, and constituents with less than 20 samples were eliminated. Some constituents, such as color and volatile solids, were eliminated because they provided minimal value in understanding water quality in the basin. The remaining constituents were mostly major ions, sediment or suspended solids, nutrients, field measurements, bacteria, and some trace metals (table 2). Each constituent also had multiple descriptors in the dataset such as total, dissolved, and total recoverable, and some constituents also had multiple descriptors in the WQP. The data were examined statistically and graphically. Laboratory methods were reviewed to determine if constituents with different descriptors were comparable—if the different descriptors were comparable, these data were combined, if not, these data were kept separate. For example, the nitrogen species often referred to by USGS as “nitrate plus nitrite as nitrogen” also was identified in the WQP data results as inorganic nitrogen, dissolved nitrate, and total nitrate among other collection agencies. These constituents spanned 10 combinations of names and descriptors. For the analysis discussed in this report, these 10 constituents were combined into 1 constituent, referred to as “nitrate plus nitrite” (table 2); however, variations of “total” phosphorus were combined separately from variations of “dissolved” phosphorus (table 2). The final list of constituents selected for analysis in this report, including the various combinations of constituent names, descriptors, and units, is provided in table 2. Relevant beneficial-use criteria information for water-quality constituents listed by the SD DANR (South Dakota Department of Agriculture and Natural Resources, 2022) also is included in table 2.
Table 2.
Summary of constituents evaluated in the Rapid Creek Basin.[WQP, National Water Quality Monitoring Council Water Quality Portal; SD DANR, South Dakota Department of Agriculture and Natural Resources; mg/L, milligram per liter; --, not applicable; SO4, sulfate; μg/L, microgram per liter; N, nitrogen; P, phosphorus; µS/cm, microsiemens per centimeter at 25 degrees Celsius; µohm/cm, microohm per centimeter; >, greater than; mpn, most probable number; mL, milliliter; cfu, colony forming units; no., number]
From South Dakota Department of Agriculture and Natural Resources (2022). If multiple beneficial uses are listed, the most stringent value for a constituent is used.
From equation 3 in appendix A of South Dakota Department of Agriculture and Natural Resources (2022), using a typical pH of 8.0 and temperature of 15 degrees Celsius.
Many of the selected constituents had censored values, which are values that represent concentrations too low to be accurately quantified (Foreman and others, 2021). The censoring level can change through time and among laboratories because of changes in analytical methods, sensitivity of laboratory equipment, or dilutions during laboratory analysis. Censored values are an important consideration in statistical analysis, especially for trend and load analyses (Helsel and others, 2020). For comparability of data and consistent statistical analysis, constituents with multiple censoring levels were recensored to a common value, and the newly censored dataset was used for all analyses. When choosing a common censoring level, the highest consistent censoring level or most recently observed was thought to be most likely to represent an actual measured concentration and was selected. On occasion, a higher censoring level was reported, and these censoring levels were generally isolated or outliers because of a dilution issue with a laboratory; these higher values were not used if fewer than 5 values were with the censoring level. When these values were censored at a value greater than the common censoring level, they were left unchanged because the program used to determine trends, R–QWTREND, can handle multiple censoring levels (Vecchia and Nustad, 2020). The remaining censored values were recoded to the common censoring level, and uncensored values less than the common censoring level were recoded as censored values at the common censoring level. For most constituents, a higher censoring level was chosen because the lower censor levels were reported in the earlier period of data collection and likely did not represent an actual measured concentration. For example, TSS data had censoring levels ranging from 1 to 10 milligrams per liter (mg/L), and 10 mg/L was the highest consistent censoring level and was selected as the common censoring level (table 2). A censoring level of −1 was listed for some data points in the Rapid Creek Basin and was determined to be a placeholder for unknown censoring levels, which was generally used for what SD DANR considers “historical” data (Aaron Leingang, SD DANR, written commun., 2021). Data points with censoring levels of −1 were eliminated from the analysis. Eight of the selected constituents (TSS, ammonia, nitrate plus nitrite, dissolved phosphorus, total phosphorus, total Kjeldahl nitrogen [TKN], E. coli, and fecal coliform) had multiple censoring levels that were recoded to a common censoring level for data analyses (table 2).
Streamflow
Streamflow data from the USGS NWIS database also were compiled for the 18 selected sites (U.S. Geological Survey, 2022; table 1). Four of the selected sites (North Fork Rapid Creek [site 1], Rapid Creek near Rochford [site 3], Castle Creek near Mystic [site 6], and Rapid Creek below Tittle Springs [site 11]) did not have available streamflow data for the trend analysis; therefore, it was estimated, which is described later in this section. Four other sites (Castle Creek below Deerfield Dam [site 5], Rapid Creek above WRF near Rapid City [site 16], Rapid Creek below WRF near Rapid City [site 17], and Rapid Creek near Farmingdale [site 18]) had a seasonal or incomplete daily record of streamflow that was estimated for periods of missing record. Streamflow estimation techniques at selected sites may have introduced bias into the results but were necessary because of the lack of streamflow data at some of the sites in the basin.
Seven sites, three of which were in the upper basin, were identified with water-quality data suitable for trend analysis but had incomplete streamflow records. A complete daily streamflow record is a requirement to compute trends using the R–QWTREND program (Vecchia and Nustad, 2020). Site 5 has a USGS streamgage (06410000) that was operated as a year-round streamgage until 1983 when it was transitioned to a seasonal streamgage operating from March through September. To fill in the missing winter streamflow values at this site, releases from Deerfield Reservoir by the Bureau of Reclamation were used to estimate flow during the winter months (Bureau of Reclamation, 2021). Site 3 had a USGS streamgage (06408860) that was operated from October 1, 1989, to September 30, 1994, but a complete streamflow record was needed from 1975 to 2020. To estimate flow for the remaining period at site 3, the recorded and estimated data from site 5 were subtracted from streamflow at Rapid Creek above Pactola Reservoir at Silver City, S. Dak. (site 7; Joel Petersen, USGS, written commun., 2021). Underlying geology in this section of the Rapid Creek Basin is the impervious crystalline core (Redden and DeWitt, 2008), and minimal water loss to groundwater or water use was assumed through this reach. Site 6 did not have any streamflow data, and the streamflow record from site 5 was used at site 6 because it was assumed that geology and land use gains and losses in this reach were minimal (Joel Petersen, USGS, written commun., 2021).
The remaining four sites were in the middle and lower basins. Site 11 did not have a streamflow record and is in a section of Rapid Creek with various streamflow gains and losses (Hortness and Driscoll, 1998; Anderson and others, 1999; Driscoll and others, 2002). Streamflow losses between the confluence with Victoria Creek and Rapid Creek above Canyon Lake near Rapid City (site 12; USGS streamgage 06412510) were estimated to be 8.5 ft3/s (Anderson and others, 1999). The distance between site 11 and site 12 was determined to be 1.25 miles (mi), and the distance between Victoria Creek and site 12 was 3.5 mi. This ratio (1.25/3.5 mi) of 0.36 multiplied by the 8.5-ft3/s loss in this section was determined to be 3 ft3/s, and 3 ft3/s was added to streamflow from site 12 to estimate the streamflow at site 11. At site 16, a USGS streamgage (06418800) was established in 2016 and collects daily streamflow data. This streamgage was previously at site 17, USGS streamgage (06418900), which was downstream from the WRF, from 1981 to 2016 and collected daily streamflow data (Joel Petersen, USGS, written commun., 2021). Releases from the WRF were known from 2016 to 2020 (Leah Hall, City of Rapid City, written commun., 2021) and were estimated based on the population of Rapid City, Rapid Valley (not shown), and Blackhawk (not shown) from 1970 to 2016 (U.S. Census Bureau, 2021). Streamflow data at site 17 were estimated for 2016–20 by adding discharges from the WRF to streamflow data from site 16. To estimate streamflow before 2016 at site 16, estimates for WRF discharge were subtracted from site 17 to estimate the record of streamflow at site 16. Site 18 had a USGS streamgage (06421500) recording daily streamflow data for the study period of 1970–2020, except for 1991. In 1991, the USGS operated a streamgage on Rapid Creek at Creston, S. Dak. (USGS streamgage 06422000; not shown; U.S. Geological Survey, 2022), and these data were used for the missing year of data at site 18 (Joel Petersen, USGS, written commun., 2021).
Descriptive Statistics
Descriptive statistics were computed for selected constituents at the 18 sites in the Rapid Creek Basin with at least 10 samples collected between 1970 and 2020 to describe the spatial variability of concentrations in the basin. The total number of values or observations for constituents varied by site because samples were collected by multiple agencies or groups for different purposes. Constituents were recensored to the highest common censoring level, as previously described (table 2). Statistics included the minimum; maximum; and 10th, 25th, 50th (median), 75th, and 90th percentiles of values for individual constituents at each site. Median concentrations for selected constituents were plotted on maps of the Rapid Creek Basin to show spatial patterns in concentration across the basin.
Trend Analysis
Water-quality trends were evaluated using R–QWTREND, which is a statistical model for estimating constituent concentrations from water-quality samples and streamflow data (Vecchia, 2000, 2003, 2005; Vecchia and Nustad, 2020). R–QWTREND can run the time-series model, determine model fit, verify trend models, and produce an output for interpreting and evaluating the results (Vecchia and Nustad, 2020). One of the model’s variables, FRVAR, was designed to capture as much natural flow-related variability in logarithmically transformed concentrations as possible. FRVAR is a function of variables called flow anomalies that depend on concurrent and antecedent streamflow (Vecchia and Nustad, 2020). Flow anomalies address the relation between a constituent concentration and concurrent and lagged streamflow at annual, seasonal, and daily time scales. In addition, the periodic functions of sine and cosine are included to model seasonal variation that is not captured by flow anomalies (Vecchia and Nustad, 2020). Because of the variable hydroclimate in the basin, characterizing flow-related variability in concentrations at multiple time scales is important because concentrations of water-quality constituents interact with the streamflow in complex ways that cannot be captured using a simple regression between concentration and concurrent streamflow. By accounting for the natural flow-related variability, the ability to detect trends in concentration that are independent of streamflow and climate variability is greatly increased (Vecchia, 2003). In R–QWTREND, step trends based on sample attributes can be used to model potential bias; that is, a systemic tendency for sample concentrations to over or underestimate actual concentration based on a particular laboratory-analytical method or collection method (Vecchia and Nustad, 2020). Step trends were used in this study to account for laboratory differences, reporting differences, and known changes at the Rapid City WRF.
Trends detected by R–QWTREND indicate long-term (generally 10 or more years) changes in the annual “flow-averaged” geometric mean concentration (GMC) that are unrelated to year-to-year changes in streamflow (Vecchia and Nustad, 2020). R–QWTREND requires at least 60 water-quality samples distributed between seasons, a complete daily streamflow record, and preferably no more than 25 percent of the dataset containing censored values (Vecchia and Nustad, 2020). To determine the significance of the trend results, the generalized likelihood ratio test statistic was used and is described in Vecchia and Nustad (2020). Three levels of significance were used for this study: a probability (p) value of less than or equal to 0.01 was considered significant, a p-value between 0.01 and 0.05 was considered mildly significant, and a p-value greater than 0.05 was considered nonsignificant. A small p-value indicates that a real trend was detected by R–QWTREND; for example, a trend with a p-value of less than 0.05 indicates a less than 5-percent chance that the results of the analysis are random, which indicates that the null (no trend) model should be rejected. A nonsignificant trend indicates that a trend was inconclusive given the available data and does not necessarily mean the data have no trend (Helsel and others, 2020). It is possible that these data have a trend that is too small to be detected in relation to the natural variability of the data.
Censored values, or values less than the method detection level for which an exact value is not known (Foreman and others, 2021), need to be considered during trend analysis (Helsel and others, 2020). R–QWTREND handles censored values and estimates a value, but it is recommended the dataset be no more than 25-percent censored (Vecchia and Nustad, 2020). To include as many sites and constituents as possible in the analysis, sites with constituents having as much as 55-percent censored data were analyzed for trends for this report. Results at sites 3, 6, and 16 for total phosphorus and site 17 for TSS had more censored data than recommended and should be interpreted with caution. Too few data were available to evaluate trends for ammonia in the Rapid Creek Basin, because nearly all the data were censored. Nitrate plus nitrite, total phosphorus, dissolved phosphorus, TKN, and TSS had multiple censoring levels and were recensored to a common censoring level (table 2). After recensoring, some sites had more than 55-percent censored data and were not analyzed for trends.
After the data cleanup, trend analyses were completed for 8 constituents among 12 of the 18 sites. The 8 constituents were divided into 4 categories: major ions (TDS, calcium, and magnesium), field measurements (specific conductance [SC]), TSS, and nutrients (total phosphorus, dissolved phosphorus, and TKN). Major ion trends were identified among 5 sites, SC trends were identified at 13 sites, TSS trends were identified at 5 sites, and nutrient trends were identified among 5 sites.
Water-Quality Data in the Rapid Creek Basin
Water-quality data from the 18 selected sites in the basin were summarized using descriptive statistics. Summaries were provided for select constituents with 10 or more values and included number of values, number of censored values, percentage of data censored, and the period of record at each site (tables 3–7). Within the basin, 9 of the 18 sites (sites 3, 4, 6, 8, 11, Rapid Creek below Hawthorn Ditch at Rapid City, S. Dak. [site 15], and 16–18) had the bulk of the data collected (tables 3–7). Summary statistics are presented using five constituent groups: major ions and dissolved solids, total suspended solids and suspended sediment, nutrients, field measurements, and bacteria. Summary statistics were not computed for trace metals because too few data were available across the basin.
Table 3.
Summary of available data and descriptive statistics for major ions and total dissolved solids for selected sites in the Rapid Creek Basin.[<, less than; --, not applicable]
| Map identification number (fig. 1) | Number of observations | Number of censored values | Percentage of data that are censored | Beginning sample year | Ending sample year | Number of years of sample record | Concentration | ||||||
|---|---|---|---|---|---|---|---|---|---|---|---|---|---|
| Minimum | Maximum | 10th percentile | 25th percentile | Median | 75th percentile | 90th percentile | |||||||
| 1 | 74 | 1 | 1 | 2001 | 2020 | 19 | <5 | 240 | 138 | 160 | 187 | 200 | 213 |
| 2 | 29 | 0 | 0 | 1991 | 2020 | 29 | 203 | 261 | 211 | 224 | 235 | 250 | 256 |
| 3 | 501 | 0 | 0 | 1970 | 2020 | 50 | 118 | 340 | 182 | 210 | 230 | 249 | 266 |
| 4 | 385 | 4 | 1 | 1970 | 1996 | 26 | 148 | 476 | 227 | 242 | 257 | 266 | 274 |
| 5 | -- | -- | -- | -- | -- | -- | -- | -- | -- | -- | -- | -- | -- |
| 6 | 505 | 0 | 0 | 1970 | 2020 | 50 | 100 | 440 | 197 | 218 | 238 | 255 | 276 |
| 7 | 12 | 0 | 0 | 1999 | 2020 | 21 | 193 | 262 | 216 | 223 | 232 | 248 | 256 |
| 8 | 221 | 0 | 0 | 1970 | 2009 | 39 | 124 | 304 | 201 | 205 | 214 | 224 | 235 |
| 9 | 66 | 0 | 0 | 1987 | 2007 | 20 | 164 | 306 | 186 | 201 | 218 | 234 | 255 |
| 10 | 26 | 0 | 0 | 1989 | 1993 | 4 | 204 | 253 | 210 | 214 | 224 | 238 | 247 |
| 11 | 495 | 1 | <1 | 1975 | 2020 | 45 | <5 | 783 | 173 | 196 | 214 | 230 | 249 |
| 12 | 34 | 1 | 3 | 1980 | 2000 | 20 | <5 | 228 | 184 | 193 | 197 | 212 | 218 |
| 13 | 19 | 0 | 0 | 1991 | 2000 | 9 | 184 | 228 | 202 | 207 | 210 | 218 | 223 |
| 14 | 90 | 4 | 4 | 1987 | 2007 | 20 | <5 | 292 | 180 | 193 | 204 | 216 | 236 |
| 15 | 162 | 3 | 2 | 1980 | 2020 | 40 | <5 | 534 | 271 | 302 | 345 | 386 | 417 |
| 16 | 359 | 1 | <1 | 1987 | 2020 | 33 | <5 | 966 | 321 | 371 | 439 | 520 | 590 |
| 17 | 476 | 2 | <1 | 1979 | 2020 | 41 | <5 | 3,800 | 406 | 486 | 560 | 637 | 748 |
| 18 | 942 | 3 | <1 | 1970 | 2020 | 50 | <5 | 1,700 | 446 | 532 | 628 | 702 | 803 |
| 1 | 15 | 1 | 7 | 2001 | 2002 | 1 | <1 | 83 | 29 | 35 | 48 | 68 | 79 |
| 2 | 2 | 0 | 0 | 1991 | 1995 | 4 | -- | -- | -- | -- | -- | -- | -- |
| 3 | 499 | 0 | 0 | 1970 | 2020 | 50 | 4 | 3,640 | 25 | 28 | 31 | 35 | 40 |
| 4 | 203 | 9 | 4 | 1970 | 1996 | 26 | <1 | 29 | 5 | 6 | 7 | 9 | 11 |
| 5 | 1 | 0 | 0 | 2009 | 2009 | 0 | -- | -- | -- | -- | -- | -- | -- |
| 6 | 44 | 0 | 0 | 1974 | 2009 | 35 | 25 | 85 | 31 | 37 | 48 | 73 | 81 |
| 7 | 9 | 0 | 0 | 2005 | 2020 | 15 | -- | -- | -- | -- | -- | -- | -- |
| 8 | 172 | 1 | <1 | 1970 | 2009 | 39 | 10 | 65 | 39 | 42 | 44 | 48 | 51 |
| 9 | 66 | 0 | 0 | 1987 | 2007 | 20 | 20 | 70 | 34 | 37 | 40 | 44 | 51 |
| 10 | 13 | 0 | 0 | 1989 | 1993 | 4 | 38 | 47 | 39 | 41 | 44 | 46 | 46 |
| 11 | 508 | 1 | <1 | 1975 | 2020 | 45 | <1 | 3,470 | 33 | 35 | 40 | 44 | 48 |
| 12 | 11 | 0 | 0 | 1980 | 1994 | 14 | 38 | 46 | 39 | 39 | 39 | 42 | 44 |
| 13 | -- | -- | -- | -- | -- | -- | -- | -- | -- | -- | -- | -- | -- |
| 14 | 45 | 0 | 0 | 1987 | 2007 | 20 | 24 | 47 | 30 | 31 | 35 | 37 | 40 |
| 15 | 129 | 0 | 0 | 1980 | 2020 | 40 | 55 | 166 | 76 | 87 | 102 | 117 | 131 |
| 16 | 152 | 0 | 0 | 1993 | 2020 | 27 | 71 | 350 | 104 | 124 | 146 | 171 | 198 |
| 17 | 8 | 0 | 0 | 1991 | 2007 | 16 | -- | -- | -- | -- | -- | -- | -- |
| 18 | 224 | 2 | <1 | 1970 | 2009 | 39 | <1 | 406 | 170 | 200 | 239 | 278 | 310 |
| 1 | 9 | 0 | 0 | 2002 | 2002 | 0 | -- | -- | -- | -- | -- | -- | -- |
| 2 | 2 | 1 | 50 | 1991 | 1995 | 4 | -- | -- | -- | -- | -- | -- | -- |
| 3 | 497 | 129 | 26 | 1970 | 2020 | 50 | <1 | 22 | <1 | <1 | 1.9 | 3.0 | 4.0 |
| 4 | 202 | 73 | 36 | 1970 | 1996 | 26 | <1 | 10 | <1 | <1 | 1.2 | 1.6 | 2.6 |
| 5 | 1 | 0 | 0 | 2009 | 2009 | 0 | -- | -- | -- | -- | -- | -- | -- |
| 6 | 44 | 12 | 27 | 1974 | 2009 | 35 | <1 | 5.6 | <1 | <1 | 2.0 | 2.8 | 4.4 |
| 7 | 9 | 1 | 11 | 2005 | 2020 | 15 | -- | -- | -- | -- | -- | -- | -- |
| 8 | 172 | 22 | 13 | 1970 | 2009 | 39 | <1 | 11 | <1 | 1 | 2 | 2 | 3 |
| 9 | 3 | 0 | 0 | 2007 | 2007 | 0 | -- | -- | -- | -- | -- | -- | -- |
| 10 | 13 | 0 | 0 | 1989 | 1993 | 4 | 1.7 | 6.5 | 2.0 | 2.5 | 3.2 | 5.7 | 6.1 |
| 11 | 510 | 44 | 9 | 1975 | 2020 | 45 | <1 | 27 | 1.6 | 3.0 | 4.0 | 5.4 | 7.0 |
| 12 | 47 | 1 | 2 | 1980 | 1994 | 14 | <1 | 4.5 | 1.4 | 2.2 | 3.0 | 3.5 | 3.8 |
| 13 | -- | -- | -- | -- | -- | -- | -- | -- | -- | -- | -- | -- | -- |
| 14 | 2 | 0 | 0 | 1988 | 2007 | 19 | -- | -- | -- | -- | -- | -- | -- |
| 15 | 180 | 0 | 0 | 1980 | 2020 | 40 | 2.6 | 100 | 7.1 | 13 | 20 | 28 | 44 |
| 16 | 151 | 0 | 0 | 1993 | 2020 | 27 | 4.0 | 310 | 15.0 | 22 | 29 | 35 | 50 |
| 17 | 8 | 0 | 0 | 1991 | 2007 | 16 | -- | -- | -- | -- | -- | -- | -- |
| 18 | 224 | 2 | <1 | 1970 | 2009 | 39 | <1 | 140 | 14 | 25 | 34 | 50 | 63 |
| 1 | 9 | 0 | 0 | 2002 | 2002 | 0 | -- | -- | -- | -- | -- | -- | -- |
| 2 | 2 | 2 | 100 | 1991 | 1995 | 4 | -- | -- | -- | -- | -- | -- | -- |
| 3 | 38 | 0 | 0 | 1974 | 1977 | 3 | 1.3 | 2.4 | 1.5 | 1.6 | 1.8 | 1.9 | 2.1 |
| 4 | 205 | 31 | 15 | 1970 | 1996 | 26 | <1 | 6.8 | <1 | 1.1 | 1.2 | 1.4 | 1.7 |
| 5 | 1 | 0 | 0 | 2009 | 2009 | 0 | -- | -- | -- | -- | -- | -- | -- |
| 6 | 43 | 0 | 0 | 1974 | 2009 | 35 | 2.4 | 4.6 | 2.7 | 2.9 | 3.1 | 3.4 | 3.6 |
| 7 | 5 | 0 | 0 | 2005 | 2005 | 0 | -- | -- | -- | -- | -- | -- | -- |
| 8 | 177 | 1 | <1 | 1970 | 2009 | 39 | <1 | 7.0 | 2.5 | 2.6 | 2.7 | 2.9 | 3.4 |
| 9 | 3 | 0 | 0 | 2007 | 2007 | 0 | -- | -- | -- | -- | -- | -- | -- |
| 10 | 13 | 0 | 0 | 1989 | 1993 | 4 | 2.5 | 3.1 | 2.5 | 2.6 | 2.7 | 2.7 | 2.9 |
| 11 | 44 | 0 | 0 | 1975 | 2009 | 34 | 2.0 | 3.0 | 2.2 | 2.4 | 2.5 | 2.6 | 2.8 |
| 12 | 11 | 0 | 0 | 1980 | 1994 | 14 | 2.2 | 3.1 | 2.4 | 2.5 | 2.5 | 2.6 | 2.8 |
| 13 | 5 | 0 | 0 | 1991 | 1998 | 7 | -- | -- | -- | -- | -- | -- | -- |
| 14 | 9 | 0 | 0 | 1988 | 2007 | 19 | -- | -- | -- | -- | -- | -- | -- |
| 15 | 3 | 0 | 0 | 1980 | 1981 | 1 | -- | -- | -- | -- | -- | -- | -- |
| 16 | 10 | 0 | 0 | 1993 | 1994 | 1 | 3.1 | 5.5 | 3.2 | 3.2 | 3.2 | 3.3 | 4.2 |
| 17 | 4 | 0 | 0 | 1993 | 2007 | 14 | -- | -- | -- | -- | -- | -- | -- |
| 18 | 223 | 2 | <1 | 1970 | 2009 | 39 | <1 | 12.0 | 4.7 | 5.4 | 6.4 | 7.3 | 8.3 |
| 1 | 9 | 0 | 0 | 2002 | 2002 | 0 | -- | -- | -- | -- | -- | -- | -- |
| 2 | 2 | 2 | 100 | 1991 | 1995 | 4 | -- | -- | -- | -- | -- | -- | -- |
| 3 | 352 | 12 | 3 | 1970 | 2020 | 50 | <1 | 45 | 1.9 | 2.0 | 2.0 | 2.4 | 3.0 |
| 4 | 203 | 7 | 3 | 1970 | 1996 | 26 | <1 | 6.2 | 1.2 | 1.4 | 1.5 | 1.9 | 2.5 |
| 5 | 1 | 0 | 0 | 2009 | 2009 | 0 | -- | -- | -- | -- | -- | -- | -- |
| 6 | 45 | 0 | 0 | 1974 | 2009 | 35 | 2.2 | 6.0 | 2.4 | 2.9 | 3.3 | 3.8 | 4.0 |
| 7 | 5 | 0 | 0 | 2005 | 2005 | 0 | -- | -- | -- | -- | -- | -- | -- |
| 8 | 176 | 1 | <1 | 1970 | 2009 | 39 | <1 | 83 | 3.0 | 3.1 | 3.4 | 4.0 | 4.7 |
| 9 | 3 | 0 | 0 | 2007 | 2007 | 0 | -- | -- | -- | -- | -- | -- | -- |
| 10 | 13 | 0 | 0 | 1989 | 1993 | 4 | 3.4 | 4.9 | 3.6 | 3.7 | 4.2 | 4.5 | 4.7 |
| 11 | 457 | 0 | 0 | 1975 | 2020 | 45 | 2.0 | 78 | 3.2 | 3.9 | 4.0 | 4.8 | 5.5 |
| 12 | 19 | 0 | 0 | 1980 | 1994 | 14 | 3.6 | 4.9 | 3.8 | 4.0 | 4.1 | 4.2 | 4.4 |
| 13 | 4 | 0 | 0 | 1991 | 1992 | 1 | -- | -- | -- | -- | -- | -- | -- |
| 14 | 6 | 0 | 0 | 1988 | 2007 | 19 | -- | -- | -- | -- | -- | -- | -- |
| 15 | 148 | 0 | 0 | 1980 | 2020 | 40 | 7.0 | 72 | 9.4 | 11 | 13 | 16 | 30 |
| 16 | 202 | 1 | <1 | 1986 | 2020 | 34 | <1 | 210 | 11 | 14 | 17 | 21 | 27 |
| 17 | 166 | 0 | 0 | 1979 | 2020 | 41 | 10 | 140 | 16 | 25 | 37 | 49 | 67 |
| 18 | 387 | 1 | <1 | 1970 | 2020 | 50 | 1.0 | 240 | 22 | 33 | 46 | 58 | 70 |
| 1 | 6 | 0 | 0 | 2002 | 2002 | 0 | -- | -- | -- | -- | -- | -- | -- |
| 2 | 1 | 0 | 0 | 1995 | 1995 | 0 | -- | -- | -- | -- | -- | -- | -- |
| 3 | 139 | 0 | 0 | 1974 | 2015 | 41 | 95 | 290 | 160 | 210 | 230 | 240 | 260 |
| 4 | 119 | 0 | 0 | 1970 | 1990 | 20 | 180 | 350 | 260 | 290 | 310 | 320 | 320 |
| 5 | 1 | 0 | 0 | 2009 | 2009 | 0 | -- | -- | -- | -- | -- | -- | -- |
| 6 | 146 | 0 | 0 | 1974 | 2015 | 41 | 140 | 260 | 180 | 190 | 210 | 220 | 230 |
| 7 | 1 | 0 | 0 | 1999 | 1999 | 0 | -- | -- | -- | -- | -- | -- | -- |
| 8 | 155 | 0 | 0 | 1970 | 2009 | 39 | 160 | 210 | 170 | 180 | 180 | 190 | 200 |
| 9 | -- | -- | -- | -- | -- | -- | -- | -- | -- | -- | -- | -- | -- |
| 10 | -- | -- | -- | -- | -- | -- | -- | -- | -- | -- | -- | -- | -- |
| 11 | 133 | 0 | 0 | 1975 | 2015 | 40 | 270 | 170 | 180 | 180 | 200 | 200 | 200 |
| 12 | -- | -- | -- | -- | -- | -- | -- | -- | -- | -- | -- | -- | -- |
| 13 | 1 | 0 | 0 | 1997 | 1997 | 1 | -- | -- | -- | -- | -- | -- | -- |
| 14 | 1 | 0 | 0 | 1997 | 1997 | 1 | -- | -- | -- | -- | -- | -- | -- |
| 15 | 56 | 0 | 0 | 2010 | 2015 | 5 | 180 | 380 | 200 | 210 | 210 | 220 | 230 |
| 16 | 95 | 0 | 0 | 2007 | 2015 | 8 | 120 | 1,020 | 190 | 210 | 220 | 230 | 240 |
| 17 | 94 | 0 | 0 | 2007 | 2015 | 8 | 140 | 260 | 200 | 210 | 210 | 220 | 230 |
| 18 | 276 | 0 | 0 | 1970 | 2015 | 45 | 120 | 310 | 200 | 220 | 240 | 260 | 270 |
| 1 | 15 | 1 | 7 | 2001 | 2002 | 1 | <1 | 57 | 37 | 39 | 40 | 47 | 51 |
| 2 | 2 | 0 | 0 | 1991 | 1995 | 4 | -- | -- | -- | -- | -- | -- | -- |
| 3 | 313 | 0 | 0 | 1974 | 2020 | 46 | 21 | 74 | 37 | 45 | 49 | 54 | 58 |
| 4 | 203 | 0 | 0 | 1970 | 1996 | 26 | 25 | 67 | 50 | 53 | 56 | 58 | 59 |
| 5 | 1 | 0 | 0 | 2009 | 2009 | 0 | -- | -- | -- | -- | -- | -- | -- |
| 6 | 235 | 0 | 0 | 1974 | 2015 | 41 | 35 | 62 | 39 | 42 | 43 | 46 | 49 |
| 7 | 5 | 0 | 0 | 2005 | 2005 | 0 | -- | -- | -- | -- | -- | -- | -- |
| 8 | 176 | 1 | <1 | 1970 | 2009 | 39 | <1 | 120 | 38 | 39 | 41 | 43 | 44 |
| 9 | 3 | 0 | 0 | 2007 | 2007 | 0 | -- | -- | -- | -- | -- | -- | -- |
| 10 | 13 | 0 | 0 | 1989 | 1993 | 4 | 40 | 49 | 42 | 43 | 43 | 47 | 47 |
| 11 | 360 | 0 | 0 | 1975 | 2020 | 45 | 18 | 230 | 38 | 40 | 42 | 44 | 47 |
| 12 | 11 | 0 | 0 | 1980 | 1994 | 14 | 38 | 43 | 38 | 39 | 39 | 41 | 42 |
| 13 | 4 | 0 | 0 | 1991 | 1992 | 1 | -- | -- | -- | -- | -- | -- | -- |
| 14 | 6 | 0 | 0 | 1988 | 2007 | 19 | -- | -- | -- | -- | -- | -- | -- |
| 15 | 130 | 0 | 0 | 1980 | 2020 | 40 | 48 | 98 | 56 | 61 | 69 | 76 | 82 |
| 16 | 302 | 0 | 0 | 1986 | 2020 | 34 | 9 | 150 | 64 | 72 | 84 | 94 | 110 |
| 17 | 292 | 1 | <1 | 1979 | 2020 | 41 | <1 | 410 | 68 | 80 | 90 | 100 | 110 |
| 18 | 512 | 4 | <1 | 1970 | 2020 | 50 | <1 | 170 | 71 | 83 | 95 | 110 | 120 |
| 1 | 15 | 1 | 7 | 2001 | 2002 | 1 | <1 | 23 | 15 | 17 | 17 | 21 | 23 |
| 2 | 2 | 0 | 0 | 1991 | 1995 | 4 | -- | -- | -- | -- | -- | -- | -- |
| 3 | 313 | 0 | 0 | 1974 | 2020 | 46 | 8 | 52 | 16 | 20 | 22 | 24 | 25 |
| 4 | 203 | 0 | 0 | 1970 | 1996 | 32 | 20 | 34 | 28 | 29 | 30 | 31 | 31 |
| 5 | 1 | 0 | 0 | 2009 | 2009 | 0 | -- | -- | -- | -- | -- | -- | -- |
| 6 | 235 | 0 | 0 | 1974 | 2015 | 41 | 18 | 39 | 24 | 25 | 27 | 28 | 30 |
| 7 | 5 | 0 | 0 | 2005 | 2005 | 15 | -- | -- | -- | -- | -- | -- | -- |
| 8 | 176 | 1 | <1 | 1970 | 2009 | 41 | <0.2 | 43 | 19 | 20 | 20 | 22 | 23 |
| 9 | 3 | 0 | 0 | 2007 | 2007 | 0 | -- | -- | -- | -- | -- | -- | -- |
| 10 | 13 | 0 | 0 | 1989 | 1993 | 4 | 20 | 26 | 21 | 22 | 24 | 24 | 25 |
| 11 | 360 | 0 | 0 | 1975 | 2020 | 45 | 3 | 32 | 18 | 19 | 21 | 23 | 24 |
| 12 | 11 | 0 | 0 | 1980 | 1994 | 14 | 18 | 22 | 18 | 18 | 18 | 21 | 22 |
| 13 | 4 | 0 | 0 | 1991 | 1992 | 7 | -- | -- | -- | -- | -- | -- | -- |
| 14 | 6 | 0 | 0 | 1988 | 2007 | 19 | -- | -- | -- | -- | -- | -- | -- |
| 15 | 130 | 0 | 0 | 1980 | 2020 | 67 | 19 | 33 | 22 | 25 | 26 | 28 | 29 |
| 16 | 303 | 0 | 0 | 1986 | 2020 | 34 | 18 | 97 | 27 | 30 | 33 | 37 | 41 |
| 17 | 289 | 0 | 0 | 1979 | 2020 | 41 | 19 | 210 | 28 | 32 | 36 | 40 | 44 |
| 18 | 510 | 2 | <1 | 1970 | 2020 | 67 | <1 | 111 | 29 | 34 | 39 | 45 | 50 |
Table 4.
Summary of available data and descriptive statistics for total suspended solids and suspended sediment concentration at selected sites in the Rapid Creek Basin.[<, less than; --, not applicable]
| Map identification number (fig. 1) | Number of observations | Number of censored values | Percentage of data that are censored | Beginning sample year | Ending sample year | Number of years of sample record | Concentration | ||||||
|---|---|---|---|---|---|---|---|---|---|---|---|---|---|
| Minimum | Maximum | 10th percentile | 25th percentile | Median | 75th percentile | 90th percentile | |||||||
| 1 | 74 | 49 | 66 | 2001 | 2020 | 19 | <10 | 45 | <10 | <10 | <10 | 14 | 25 |
| 2 | 27 | 27 | 100 | 1991 | 2020 | 29 | <10 | 10 | <10 | <10 | <10 | <10 | <10 |
| 3 | 531 | 295 | 56 | 1970 | 2020 | 50 | <10 | 240 | <10 | <10 | <10 | 17 | 33 |
| 4 | 11 | 7 | 64 | 1970 | 1977 | 7 | <10 | 23 | <10 | <10 | <10 | 11 | 20 |
| 5 | 10 | 10 | 100 | 2009 | 2017 | 8 | <10 | 10 | <10 | <10 | <10 | <10 | <10 |
| 6 | 528 | 277 | 52 | 1970 | 2020 | 50 | <10 | 410 | <10 | <10 | <10 | 21.25 | 42 |
| 7 | 9 | 8 | 89 | 2005 | 2020 | 15 | <10 | 59 | <10 | <10 | <10 | <10 | 20 |
| 8 | 52 | 49 | 94 | 1987 | 2009 | 22 | <10 | 20 | <10 | <10 | <10 | <10 | <10 |
| 9 | 63 | 61 | 97 | 1987 | 1988 | 1 | <10 | 18 | <10 | <10 | <10 | <10 | <10 |
| 10 | 14 | 13 | 93 | 1988 | 1993 | 5 | <10 | 16 | <10 | <10 | <10 | <10 | <10 |
| 11 | 488 | 433 | 89 | 1975 | 2020 | 45 | <10 | 240 | <10 | <10 | <10 | <10 | 11 |
| 12 | 59 | 54 | 92 | 1980 | 2000 | 20 | <10 | 25 | <10 | <10 | <10 | <10 | <10 |
| 13 | 30 | 30 | 100 | 1991 | 2019 | 28 | <10 | 10 | <10 | <10 | <10 | <10 | <10 |
| 14 | 103 | 98 | 95 | 1987 | 2019 | 32 | <10 | 64 | <10 | <10 | <10 | <10 | <10 |
| 15 | 218 | 139 | 64 | 1980 | 2020 | 40 | <10 | 1,800 | <10 | <10 | <10 | 25 | 330 |
| 16 | 390 | 218 | 56 | 1987 | 2020 | 33 | <10 | 460 | <10 | <10 | <10 | 20 | 42 |
| 17 | 519 | 200 | 39 | 1979 | 2020 | 41 | <10 | 1,500 | <10 | <10 | 15 | 30 | 49 |
| 18 | 797 | 153 | 19 | 1970 | 2020 | 50 | <10 | 46,000 | <10 | 13 | 34 | 90 | 200 |
| 1 | -- | -- | -- | -- | -- | -- | -- | -- | -- | -- | -- | -- | -- |
| 2 | 1 | 0 | 0 | 1991 | 1991 | 0 | -- | -- | -- | -- | -- | -- | -- |
| 3 | -- | -- | -- | -- | -- | -- | -- | -- | -- | -- | -- | -- | -- |
| 4 | 192 | 0 | 0 | 1967 | 1996 | 26 | 3.0 | 370 | 21 | 31 | 47 | 75 | 98 |
| 5 | -- | -- | -- | -- | -- | -- | -- | -- | -- | -- | -- | -- | -- |
| 6 | -- | -- | -- | -- | -- | -- | -- | -- | -- | -- | -- | -- | -- |
| 7 | -- | -- | -- | -- | -- | -- | -- | -- | -- | -- | -- | -- | -- |
| 8 | 1 | 0 | 0 | 1998 | 1998 | 0 | 2.0 | 2.0 | 2.0 | 2.0 | 2.0 | 2.0 | 2.0 |
| 9 | -- | -- | -- | -- | -- | -- | -- | -- | -- | -- | -- | -- | -- |
| 10 | 7 | 0 | 0 | 1990 | 1997 | 7 | 0.8 | 34 | 2.1 | 4.0 | 5.0 | 9.0 | 20 |
| 11 | -- | -- | -- | -- | -- | -- | -- | -- | -- | -- | -- | -- | -- |
| 12 | 38 | 0 | 0 | 1980 | 1982 | 2 | 1.0 | 170 | 1.0 | 4.0 | 10 | 25 | 57 |
| 13 | 27 | 0 | 0 | 1996 | 1998 | 2 | 2.0 | 700 | 4.8 | 7.0 | 13 | 22 | 50 |
| 14 | 27 | 0 | 0 | 1996 | 1998 | 2 | 2.0 | 1,500 | 3.0 | 5.0 | 6.0 | 11 | 23 |
| 15 | 52 | 0 | 0 | 1980 | 1982 | 2 | 4 | 3,600 | 23 | 49 | 190 | 550 | 990 |
| 16 | 1 | 0 | 0 | 1994 | 1994 | 0 | -- | -- | -- | -- | -- | -- | -- |
| 17 | 2 | 0 | 0 | 1994 | 1994 | 0 | -- | -- | -- | -- | -- | -- | -- |
| 18 | 8 | 0 | 0 | 1991 | 1997 | 6 | -- | -- | -- | -- | -- | -- | -- |
Table 5.
Summary of available data and descriptive statistics for nutrients for selected sites in the Rapid Creek Basin.[--, not applicable; <, less than]
| Map identification number (fig. 1) | Number of observations | Number of censored values | Percentage of data that are censored | Beginning sample year | Ending sample year | Number of years of sample record | Concentration | ||||||
|---|---|---|---|---|---|---|---|---|---|---|---|---|---|
| Minimum | Maximum | 10th percentile | 25th percentile | Median | 75th percentile | 90th percentile | |||||||
| 1 | -- | -- | -- | -- | -- | -- | -- | -- | -- | -- | -- | -- | -- |
| 2 | 1 | 1 | 100 | 1991 | 1991 | 0 | -- | -- | -- | -- | -- | -- | -- |
| 3 | 184 | 180 | 98 | 1999 | 2015 | 16 | <0.03 | 0.11 | <0.03 | <0.03 | <0.03 | <0.03 | <0.03 |
| 4 | 107 | 87 | 81 | 1970 | 1996 | 28 | <0.03 | 0.10 | <0.03 | <0.03 | <0.03 | <0.03 | 0.04 |
| 5 | 1 | 1 | 100 | 2009 | 2009 | 0 | -- | -- | -- | -- | -- | -- | -- |
| 6 | 189 | 186 | 98 | 1999 | 2015 | 16 | <0.03 | 0.07 | <0.03 | <0.03 | <0.03 | <0.03 | <0.03 |
| 7 | 8 | 8 | 100 | 1999 | 2005 | 6 | -- | -- | -- | -- | -- | -- | -- |
| 8 | 143 | 130 | 91 | 1970 | 2009 | 39 | <0.03 | 2.00 | <0.03 | <0.03 | <0.03 | <0.03 | <0.03 |
| 9 | 3 | 3 | 100 | 2007 | 2007 | 0 | -- | -- | -- | -- | -- | -- | -- |
| 10 | 21 | 21 | 100 | 1988 | 1997 | 9 | <0.03 | <0.03 | <0.03 | <0.03 | <0.03 | <0.03 | <0.03 |
| 11 | 191 | 189 | 99 | 1989 | 2015 | 26 | <0.03 | 0.07 | <0.03 | <0.03 | <0.03 | <0.03 | <0.03 |
| 12 | 27 | 27 | 100 | 1980 | 1982 | 2 | <0.03 | <0.03 | <0.03 | <0.03 | <0.03 | <0.03 | <0.03 |
| 13 | 6 | 6 | 100 | 1997 | 2000 | 3 | -- | -- | -- | -- | -- | -- | -- |
| 14 | 12 | 12 | 100 | 1988 | 2007 | 19 | <0.03 | 0.05 | <0.03 | <0.03 | <0.03 | <0.03 | <0.03 |
| 15 | 92 | 81 | 88 | 1980 | 2015 | 35 | <0.03 | 0.09 | <0.03 | <0.03 | <0.03 | <0.03 | 0.04 |
| 16 | 177 | 170 | 96 | 1988 | 2015 | 27 | <0.03 | 0.08 | <0.03 | <0.03 | <0.03 | <0.03 | <0.03 |
| 17 | 202 | 2 | 1 | 1999 | 2015 | 16 | <0.03 | 2.20 | 0.21 | 0.35 | 0.52 | 0.71 | 1.00 |
| 18 | 356 | 18 | 5 | 1970 | 2015 | 45 | <0.03 | 2.00 | 0.09 | 0.18 | 0.31 | 0.62 | 0.97 |
| 1 | 37 | 10 | 27 | 2001 | 2017 | 16 | <0.01 | 0.06 | <0.01 | <0.01 | 0.02 | 0.02 | 0.034 |
| 2 | 11 | 3 | 27 | 2016 | 2017 | 1 | <0.01 | 0.01 | <0.01 | 0.01 | 0.01 | 0.01 | 0.012 |
| 3 | 386 | 172 | 45 | 1978 | 2017 | 39 | <0.01 | 1.30 | <0.01 | <0.01 | 0.02 | 0.03 | 0.057 |
| 4 | 187 | 48 | 26 | 1970 | 1996 | 26 | <0.01 | 0.64 | <0.01 | <0.01 | 0.02 | 0.04 | 0.06 |
| 5 | 1 | 0 | 0 | 2009 | 2009 | 0 | -- | -- | -- | -- | -- | -- | -- |
| 6 | 393 | 151 | 38 | 1978 | 2017 | 39 | <0.01 | 0.34 | <0.01 | <0.01 | 0.02 | 0.03 | 0.05 |
| 7 | 12 | 8 | 67 | 1999 | 2020 | 21 | <0.01 | 0.09 | <0.01 | <0.01 | <0.01 | 0.01 | 0.03 |
| 8 | 179 | 83 | 46 | 1970 | 2009 | 39 | <0.01 | 0.18 | <0.01 | <0.01 | 0.01 | 0.03 | 0.05 |
| 9 | 64 | 33 | 52 | 1987 | 2007 | 20 | <0.01 | 0.28 | <0.01 | <0.01 | <0.01 | 0.02 | 0.02 |
| 10 | 4 | 3 | 75 | 1988 | 1989 | 1 | -- | -- | -- | -- | -- | -- | -- |
| 11 | 382 | 237 | 62 | 1978 | 2017 | 39 | <0.01 | 0.51 | <0.01 | <0.01 | <0.01 | 0.02 | 0.04 |
| 12 | 51 | 30 | 59 | 1980 | 2000 | 20 | <0.01 | 0.05 | <0.01 | <0.01 | <0.01 | 0.02 | 0.04 |
| 13 | 33 | 23 | 70 | 1991 | 2019 | 28 | <0.01 | 0.05 | <0.01 | <0.01 | 0.02 | 0.03 | 0.03 |
| 14 | 106 | 37 | 35 | 1987 | 2019 | 32 | <0.01 | 0.25 | <0.01 | 0.01 | 0.02 | 0.03 | 0.04 |
| 15 | 159 | 63 | 40 | 1980 | 2017 | 37 | <0.01 | 1.6 | <0.01 | <0.01 | 0.02 | 0.07 | 0.34 |
| 16 | 305 | 104 | 34 | 1987 | 2017 | 30 | <0.01 | 0.68 | <0.01 | <0.01 | 0.02 | 0.04 | 0.06 |
| 17 | 413 | 2 | <1 | 1981 | 2017 | 36 | <0.01 | 5.3 | 0.27 | 0.42 | 0.71 | 1.1 | 2.0 |
| 18 | 568 | 5 | 1 | 1970 | 2017 | 47 | <0.01 | 9.8 | 0.25 | 0.35 | 0.52 | 0.83 | 1.3 |
| 1 | 37 | 37 | 100 | 2001 | 2017 | 16 | <0.1 | <0.1 | <0.1 | <0.1 | <0.1 | <0.1 | <0.1 |
| 2 | 11 | 11 | 100 | 2016 | 2017 | 1 | <0.1 | <0.1 | <0.1 | <0.1 | <0.1 | <0.1 | <0.1 |
| 3 | 170 | 170 | 100 | 2004 | 2017 | 13 | <0.1 | <0.1 | <0.1 | <0.1 | <0.1 | <0.1 | <0.1 |
| 4 | 48 | 42 | 88 | 1980 | 1992 | 12 | <0.1 | 0.17 | <0.1 | <0.1 | <0.1 | <0.1 | 0.11 |
| 5 | 1 | 1 | 100 | 2009 | 2009 | 0 | -- | -- | -- | -- | -- | -- | -- |
| 6 | 180 | 180 | 100 | 2004 | 2017 | 13 | <0.1 | <0.1 | <0.1 | <0.1 | <0.1 | <0.1 | <0.1 |
| 7 | 5 | 5 | 100 | 2005 | 2005 | 0 | -- | -- | -- | -- | -- | -- | -- |
| 8 | 27 | 27 | 100 | 1988 | 2009 | 21 | <0.1 | <0.1 | <0.1 | <0.1 | <0.1 | <0.1 | <0.1 |
| 9 | 63 | 63 | 100 | 1987 | 1988 | 1 | <0.1 | <0.1 | <0.1 | <0.1 | <0.1 | <0.1 | <0.1 |
| 10 | 4 | 4 | 100 | 1988 | 1989 | 1 | -- | -- | -- | -- | -- | -- | -- |
| 11 | 184 | 184 | 100 | 1989 | 2017 | 28 | <0.1 | <0.1 | <0.1 | <0.1 | <0.1 | <0.1 | <0.1 |
| 12 | 25 | 25 | 100 | 1980 | 2000 | 20 | <0.1 | <0.1 | <0.1 | <0.1 | <0.1 | <0.1 | <0.1 |
| 13 | -- | -- | -- | -- | -- | -- | -- | -- | -- | -- | -- | -- | -- |
| 14 | 72 | 71 | 99 | 1987 | 2000 | 13 | <0.1 | 0.14 | <0.1 | <0.1 | <0.1 | <0.1 | <0.1 |
| 15 | 122 | 111 | 91 | 1980 | 2017 | 37 | <0.1 | 0.40 | <0.1 | <0.1 | <0.1 | <0.1 | <0.1 |
| 16 | 188 | 187 | 99 | 1988 | 2017 | 29 | <0.1 | 0.13 | <0.1 | <0.1 | <0.1 | <0.1 | <0.1 |
| 17 | 182 | 143 | 79 | 1999 | 2017 | 18 | <0.1 | 1.8 | <0.1 | <0.1 | <0.1 | <0.1 | 0.25 |
| 18 | 209 | 188 | 90 | 1988 | 2017 | 29 | <0.1 | 0.76 | <0.1 | <0.1 | <0.1 | <0.1 | 0.10 |
| 1 | 37 | 29 | 78 | 2001 | 2017 | 16 | <0.1 | 0.2 | <0.1 | <0.1 | <0.1 | <0.1 | 0.1 |
| 2 | 13 | 6 | 46 | 1987 | 2017 | 30 | <0.1 | 0.2 | <0.1 | <0.1 | 0.10 | 0.1 | 0.1 |
| 3 | 175 | 107 | 61 | 1988 | 2017 | 29 | <0.1 | 0.6 | <0.1 | <0.1 | <0.1 | 0.2 | 0.3 |
| 4 | 224 | 91 | 41 | 1971 | 1996 | 25 | <0.1 | 2 | <0.1 | <0.1 | 0.1 | 0.2 | 0.2 |
| 5 | 1 | 1 | 100 | 1987 | 1987 | 0 | -- | -- | -- | -- | -- | -- | -- |
| 6 | 179 | 122 | 68 | 1988 | 2017 | 29 | <0.1 | 1 | <0.1 | <0.1 | <0.1 | 0.1 | 0.3 |
| 7 | 7 | 6 | 86 | 1999 | 2020 | 21 | -- | -- | -- | -- | -- | -- | -- |
| 8 | 161 | 130 | 81 | 1970 | 2000 | 30 | <0.1 | 1 | <0.1 | <0.1 | <0.1 | <0.1 | 0.1 |
| 9 | 66 | 46 | 70 | 1987 | 2007 | 20 | <0.1 | 0.3 | <0.1 | <0.1 | <0.1 | 0.1 | 0.2 |
| 10 | 25 | 22 | 88 | 1988 | 1997 | 9 | <0.1 | 0.2 | <0.1 | <0.1 | <0.1 | <0.1 | 0.1 |
| 11 | 171 | 150 | 88 | 1988 | 2017 | 29 | <0.1 | 0.7 | <0.1 | <0.1 | <0.1 | <0.1 | 0.1 |
| 12 | 52 | 44 | 85 | 1980 | 2000 | 20 | <0.1 | 0.2 | <0.1 | <0.1 | <0.1 | <0.1 | 0.1 |
| 13 | 33 | 17 | 52 | 1991 | 2019 | 28 | <0.1 | 0.2 | <0.1 | <0.1 | <0.1 | 0.2 | 0.2 |
| 14 | 111 | 63 | 57 | 1987 | 2019 | 32 | <0.1 | 2 | <0.1 | <0.1 | <0.1 | 0.2 | 0.2 |
| 15 | 159 | 24 | 15 | 1980 | 2017 | 37 | <0.1 | 2 | <0.1 | 0.19 | 0.3 | 0.4 | 0.5 |
| 16 | 197 | 60 | 30 | 1988 | 2017 | 29 | <0.1 | 0.8 | <0.1 | <0.1 | 0.2 | 0.3 | 0.4 |
| 17 | 187 | 2 | 1 | 1988 | 2017 | 29 | <0.1 | 9 | 1 | 2 | 3 | 5 | 6 |
| 18 | 359 | 15 | 4 | 1970 | 2017 | 47 | <0.1 | 6 | 0.5 | 0.9 | 2 | 3 | 4 |
| 1 | 59 | 59 | 100 | 2016 | 2020 | 4 | <0.5 | <0.5 | <0.5 | <0.5 | <0.5 | <0.5 | <0.5 |
| 2 | 26 | 26 | 100 | 2016 | 2020 | 4 | <0.5 | <0.5 | <0.5 | <0.5 | <0.5 | <0.5 | <0.5 |
| 3 | 232 | 208 | 90 | 1974 | 2020 | 46 | <0.5 | 3 | <0.5 | <0.5 | <0.5 | <0.5 | 0.5 |
| 4 | 75 | 57 | 76 | 1980 | 1996 | 16 | <0.5 | 5 | <0.5 | <0.5 | <0.5 | <0.5 | 0.8 |
| 5 | 2 | 2 | 100 | 2009 | 2009 | 0 | -- | -- | -- | -- | -- | -- | -- |
| 6 | 245 | 227 | 93 | 1974 | 2020 | 46 | <0.5 | 2 | <0.5 | <0.5 | <0.5 | <0.5 | <0.5 |
| 7 | 9 | 8 | 89 | 2005 | 2020 | 15 | -- | -- | -- | -- | -- | -- | -- |
| 8 | 61 | 54 | 89 | 1987 | 2009 | 22 | <0.5 | 1 | <0.5 | <0.5 | <0.5 | <0.5 | 0.6 |
| 9 | 63 | 58 | 92 | 1987 | 1988 | 1 | <0.5 | 0.6 | <0.5 | <0.5 | <0.5 | <0.5 | <0.5 |
| 10 | 4 | 4 | 100 | 1988 | 1989 | 1 | -- | -- | -- | -- | -- | -- | -- |
| 11 | 241 | 228 | 95 | 1989 | 2020 | 31 | <0.5 | 2 | <0.5 | <0.5 | <0.5 | <0.5 | <0.5 |
| 12 | 47 | 46 | 98 | 1980 | 2000 | 20 | <0.5 | 0.6 | <0.5 | <0.5 | <0.5 | <0.5 | <0.5 |
| 13 | 29 | 29 | 100 | 1991 | 2019 | 28 | <0.5 | 0.5 | <0.5 | <0.5 | <0.5 | <0.5 | <0.5 |
| 14 | 102 | 94 | 92 | 1987 | 2019 | 32 | <0.5 | 2 | <0.5 | <0.5 | <0.5 | <0.5 | <0.5 |
| 15 | 189 | 156 | 83 | 1980 | 2020 | 40 | <0.5 | 5 | <0.5 | <0.5 | <0.5 | <0.5 | 1 |
| 16 | 253 | 210 | 83 | 1988 | 2020 | 32 | <0.5 | 7 | <0.5 | <0.5 | <0.5 | <0.5 | 0.6 |
| 17 | 289 | 47 | 16 | 1999 | 2020 | 21 | <0.5 | 4 | <0.5 | 0.6 | 0.9 | 1 | 1 |
| 18 | 327 | 54 | 17 | 1974 | 2020 | 46 | <0.5 | 10 | <0.5 | 0.6 | 0.9 | 1 | 2 |
Table 6.
Summary of available data and descriptive statistics for field parameters at selected sites in the Rapid Creek Basin.[--, not applicable; <, less than]
| Map identification number (fig. 1) | Number of observations | Number of censored values | Percentage of data that are censored | Beginning sample year | Ending sample year | Number of years of sample record | Concentration | ||||||
|---|---|---|---|---|---|---|---|---|---|---|---|---|---|
| Minimum | Maximum | 10th percentile | 25th percentile | Median | 75th percentile | 90th percentile | |||||||
| 1 | 67 | 0 | 0 | 2001 | 2020 | 19 | 6.8 | 8.9 | 7.8 | 8.0 | 8.2 | 8.4 | 8.5 |
| 2 | 30 | 0 | 0 | 1991 | 2020 | 29 | 7.9 | 8.6 | 8.1 | 8.2 | 8.4 | 8.4 | 8.5 |
| 3 | 662 | 0 | 0 | 1970 | 2020 | 50 | 6.9 | 8.8 | 7.8 | 8.1 | 8.2 | 8.4 | 8.5 |
| 4 | 281 | 0 | 0 | 1970 | 1996 | 26 | 7.2 | 9.6 | 8.0 | 8.1 | 8.3 | 8.4 | 8.6 |
| 5 | 9 | 0 | 0 | 2016 | 2017 | 1 | -- | -- | -- | -- | -- | -- | -- |
| 6 | 663 | 0 | 0 | 1970 | 2020 | 50 | 6.9 | 8.8 | 7.8 | 8.1 | 8.3 | 8.4 | 8.5 |
| 7 | 13 | 0 | 0 | 1999 | 2020 | 21 | 7.5 | 9.0 | 7.6 | 7.9 | 8.2 | 8.3 | 8.5 |
| 8 | 212 | 0 | 0 | 1970 | 2008 | 38 | 7.0 | 8.8 | 7.7 | 7.9 | 8.1 | 8.2 | 8.4 |
| 9 | 130 | 0 | 0 | 1987 | 2007 | 20 | 7.2 | 8.6 | 7.6 | 7.8 | 7.9 | 8.0 | 8.3 |
| 10 | 34 | 0 | 0 | 1988 | 1997 | 9 | 8.0 | 8.9 | 8.2 | 8.2 | 8.4 | 8.5 | 8.6 |
| 11 | 654 | 0 | 0 | 1975 | 2020 | 45 | 6.8 | 8.9 | 7.8 | 8.1 | 8.3 | 8.4 | 8.6 |
| 12 | 114 | 0 | 0 | 1980 | 2000 | 20 | 7.4 | 8.8 | 7.9 | 8.0 | 8.1 | 8.3 | 8.4 |
| 13 | 54 | 0 | 0 | 1988 | 2019 | 31 | 7.5 | 8.5 | 7.9 | 8.0 | 8.2 | 8.3 | 8.4 |
| 14 | 160 | 0 | 0 | 1987 | 2019 | 32 | 7.5 | 8.9 | 7.9 | 8.0 | 8.2 | 8.3 | 8.4 |
| 15 | 246 | 0 | 0 | 1980 | 2020 | 40 | 7.3 | 8.7 | 7.7 | 7.9 | 8.2 | 8.3 | 8.4 |
| 16 | 567 | 0 | 0 | 1982 | 2020 | 38 | 6.9 | 9.1 | 7.6 | 7.9 | 8.1 | 8.2 | 8.4 |
| 17 | 614 | 0 | 0 | 1979 | 2020 | 41 | 6.8 | 8.9 | 7.5 | 7.8 | 8.0 | 8.2 | 8.3 |
| 18 | 1,086 | 1 | <1 | 1970 | 2020 | 50 | 6.0 | 11 | 7.7 | 8.0 | 8.2 | 8.4 | 8.6 |
| 1 | 57 | 0 | 0 | 2016 | 2020 | 4 | 175 | 473 | 252 | 325 | 356 | 371 | 381 |
| 2 | 241 | 0 | 0 | 1981 | 2020 | 39 | 296 | 525 | 430 | 442 | 457 | 466 | 474 |
| 3 | 482 | 0 | 0 | 1970 | 2020 | 50 | 200 | 540 | 320 | 370 | 400 | 423 | 447 |
| 4 | 523 | 0 | 0 | 1970 | 2015 | 45 | 53 | 715 | 420 | 450 | 470 | 482 | 502 |
| 5 | 278 | 0 | 0 | 1977 | 2017 | 40 | 266 | 1,950 | 375 | 393 | 409 | 430 | 447 |
| 6 | 485 | 0 | 0 | 1970 | 2020 | 50 | 130 | 510 | 362 | 390 | 410 | 430 | 450 |
| 7 | 350 | 0 | 0 | 1977 | 2020 | 43 | 135 | 506 | 301 | 360 | 388 | 410 | 428 |
| 8 | 514 | 0 | 0 | 1970 | 2015 | 45 | 222 | 728 | 333 | 352 | 370 | 388 | 400 |
| 9 | 193 | 0 | 0 | 1987 | 2014 | 27 | 319 | 450 | 360 | 375 | 390 | 400 | 414 |
| 10 | 209 | 0 | 0 | 1988 | 2015 | 27 | 211 | 748 | 324 | 352 | 372 | 389 | 406 |
| 11 | 489 | 0 | 0 | 1975 | 2020 | 45 | 250 | 6,700 | 340 | 356 | 374 | 390 | 407 |
| 12 | 483 | 0 | 0 | 1977 | 2015 | 38 | 1.00 | 740 | 329 | 350 | 368 | 385 | 399 |
| 13 | 171 | 0 | 0 | 1987 | 2019 | 32 | 225 | 450 | 321 | 342 | 370 | 385 | 393 |
| 14 | 217 | 0 | 0 | 1987 | 2019 | 32 | 1.00 | 681 | 319 | 345 | 369 | 380 | 390 |
| 15 | 362 | 0 | 0 | 1980 | 2020 | 40 | 1.00 | 998 | 373 | 464 | 537 | 630 | 687 |
| 16 | 381 | 0 | 0 | 1986 | 2020 | 34 | 1.00 | 1,670 | 547 | 603 | 699 | 796 | 900 |
| 17 | 818 | 0 | 0 | 1979 | 2020 | 41 | 2.00 | 4,340 | 660 | 777 | 895 | 1,000 | 1,120 |
| 18 | 1,276 | 0 | 0 | 1970 | 2020 | 50 | 1.00 | 2,400 | 690 | 823 | 945 | 1,070 | 1,200 |
| 1 | 67 | 0 | 0 | 2001 | 2020 | 19 | 7.5 | 14 | 8.5 | 9.4 | 11 | 12 | 13 |
| 2 | 24 | 0 | 0 | 2016 | 2020 | 4 | 9.7 | 12 | 10 | 11 | 11 | 11 | 12 |
| 3 | 526 | 0 | 0 | 1970 | 2020 | 50 | 7.5 | 15 | 8.9 | 9.8 | 11 | 12 | 13 |
| 4 | -- | -- | -- | -- | -- | -- | -- | -- | -- | -- | -- | -- | -- |
| 5 | 9 | 0 | 0 | 2016 | 2017 | 1 | 9.2 | 11 | 9.3 | 9.5 | 10 | 10 | 11 |
| 6 | 527 | 0 | 0 | 1970 | 2020 | 50 | 7.9 | 18 | 9.1 | 10.0 | 11 | 12 | 13 |
| 7 | 3 | 0 | 0 | 2005 | 2005 | 0 | -- | -- | -- | -- | -- | -- | -- |
| 8 | 32 | 0 | 0 | 1987 | 2008 | 21 | 11 | 14 | 11 | 11 | 12 | 12 | 13 |
| 9 | 62 | 0 | 0 | 1987 | 1988 | 1 | 8.9 | 14 | 9.7 | 11 | 12 | 12 | 13 |
| 10 | -- | -- | -- | -- | -- | -- | -- | -- | -- | -- | -- | -- | -- |
| 11 | 528 | 0 | 0 | 1975 | 2020 | 45 | 6.0 | 120 | 9.3 | 9.9 | 11 | 12 | 13 |
| 12 | 17 | 0 | 0 | 1999 | 2000 | 1 | 7.5 | 15 | 8.6 | 9.3 | 10 | 12 | 12 |
| 13 | -- | -- | -- | -- | -- | -- | -- | -- | -- | -- | -- | -- | -- |
| 14 | 56 | 0 | 0 | 1987 | 2000 | 13 | 7.6 | 14 | 9.2 | 9.9 | 11 | 12 | 12 |
| 15 | 139 | 0 | 1 | 1999 | 2020 | 21 | 2.9 | 15 | 8.8 | 9.5 | 11 | 13 | 14 |
| 16 | 466 | 0 | 0 | 1982 | 2020 | 38 | 5.3 | 16 | 7.6 | 8.7 | 11 | 12 | 13 |
| 17 | 506 | 1 | <1 | 1979 | 2020 | 41 | 4.6 | 22 | 7.5 | 8.7 | 10 | 12 | 12 |
| 18 | 572 | 0 | 0 | 1970 | 2020 | 50 | 1.9 | 18 | 7.8 | 9.0 | 11 | 13 | 14 |
Table 7.
Summary of available data and descriptive statistics for bacteria parameters at selected sites in the Rapid Creek Basin.[<, less than; --, not applicable]
| Map identification number (fig. 1) | Number of observations | Number of censored values | Percentage of data that are censored | Beginning sample year | Ending sample year | Number of years of sample record | Concentration | ||||||
|---|---|---|---|---|---|---|---|---|---|---|---|---|---|
| Minimum | Maximum | 10th percentile | 25th percentile | Median | 75th percentile | 90th percentile | |||||||
| 1 | 25 | 1 | 4 | 2016 | 2020 | 4 | <1.0 | 1,050 | 13.5 | 29.2 | 70.8 | 276 | 704 |
| 2 | 20 | 3 | 15 | 2016 | 2020 | 4 | <1.0 | 18.7 | 1.0 | 2.0 | 4.7 | 8.9 | 9.9 |
| 3 | 57 | 1 | 2 | 2009 | 2020 | 11 | <1.0 | 345 | 10.4 | 19.0 | 41.0 | 86.0 | 166 |
| 4 | -- | -- | -- | -- | -- | -- | -- | -- | -- | -- | -- | -- | -- |
| 5 | -- | -- | -- | -- | -- | -- | -- | -- | -- | -- | -- | -- | -- |
| 6 | 62 | 2 | 3 | 2009 | 2020 | 11 | <1.0 | 115 | 3.3 | 12.1 | 28.1 | 45.0 | 61.9 |
| 7 | -- | -- | -- | -- | -- | -- | -- | -- | -- | -- | -- | -- | -- |
| 8 | 1 | 0 | 0 | 1998 | 1998 | 1 | -- | -- | -- | -- | -- | -- | -- |
| 9 | -- | -- | -- | -- | -- | -- | -- | -- | -- | -- | -- | -- | -- |
| 10 | -- | -- | -- | -- | -- | -- | -- | -- | -- | -- | -- | -- | -- |
| 11 | 62 | 0 | 0 | 2009 | 2020 | 11 | 2.0 | 186 | 7.0 | 8.6 | 16.0 | 31.8 | 57.9 |
| 12 | -- | -- | -- | -- | -- | -- | -- | -- | -- | -- | -- | -- | -- |
| 13 | 3 | 0 | 0 | 1997 | 1998 | 2 | -- | -- | -- | -- | -- | -- | -- |
| 14 | 3 | 0 | 0 | 1997 | 1998 | 2 | -- | -- | -- | -- | -- | -- | -- |
| 15 | 49 | 0 | 0 | 2011 | 2020 | 9 | 8.0 | 2,420 | 25.2 | 44.0 | 80.0 | 144 | 330 |
| 16 | 62 | 1 | 2 | 2009 | 2020 | 11 | <1.0 | 1,990 | 42.3 | 68.4 | 127 | 240 | 576 |
| 17 | 60 | 0 | 0 | 2009 | 2020 | 11 | 21.8 | 2,420 | 76.8 | 105 | 173 | 393 | 877 |
| 18 | 91 | 0 | 0 | 2000 | 2020 | 20 | 5.0 | 2,420 | 18.0 | 61.2 | 132 | 291 | 727 |
| 1 | 8 | 5 | 63 | 2001 | 2002 | 2 | -- | -- | -- | -- | -- | -- | -- |
| 2 | 1 | 1 | 100 | 1991 | 1991 | 1 | -- | -- | -- | -- | -- | -- | -- |
| 3 | 222 | 91 | 41 | 1970 | 2014 | 44 | <10 | 1,200 | <10 | <10 | 18 | 38 | 70 |
| 4 | 136 | 74 | 54 | 1973 | 1996 | 23 | <10 | 600 | <10 | <10 | <10 | 34 | 70 |
| 5 | -- | -- | -- | -- | -- | -- | -- | -- | -- | -- | -- | -- | -- |
| 6 | 183 | 92 | 50 | 1970 | 2014 | 44 | <10 | 870 | <10 | <10 | <10 | 23 | 48 |
| 7 | -- | -- | -- | -- | -- | -- | -- | -- | -- | -- | -- | -- | -- |
| 8 | 20 | 19 | 95 | 1988 | 1998 | 10 | <10 | 13 | <10 | <10 | <10 | <10 | <10 |
| 9 | 29 | 12 | 41 | 1988 | 1988 | 1 | <10 | 130 | <10 | <10 | 15 | 42 | 76 |
| 10 | 9 | 9 | 100 | 1989 | 1993 | 4 | -- | -- | -- | -- | -- | -- | -- |
| 11 | 203 | 102 | 50 | 1975 | 2014 | 39 | <10 | 140 | <10 | <10 | <10 | 24 | 50 |
| 12 | 42 | 7 | 17 | 1980 | 2000 | 20 | <10 | 700 | <10 | 20 | 55 | 185 | 256 |
| 13 | 13 | 6 | 46 | 1991 | 1998 | 7 | <10 | 55 | <10 | <10 | 13 | 28 | 46 |
| 14 | 48 | 19 | 40 | 1988 | 2000 | 12 | <10 | 420 | <10 | <10 | 16 | 38 | 82 |
| 15 | 67 | 4 | 6 | 1980 | 2014 | 34 | <10 | 51,000 | 18 | 58 | 200 | 2,500 | 9,000 |
| 16 | 179 | 15 | 8 | 1982 | 2018 | 36 | <10 | 490,000 | 15 | 49 | 120 | 290 | 1,000 |
| 17 | 302 | 4 | 1 | 1979 | 2018 | 39 | <10 | 94,000 | 100 | 200 | 575 | 9,100 | 20,000 |
| 18 | 563 | 64 | 11 | 1967 | 2014 | 47 | <10 | 33,000 | <10 | 37 | 110 | 270 | 794 |
Major Ions and Total Dissolved Solids
Median concentrations of all major ions and TDS were generally similar at sites upstream from Rapid City, and median concentrations at sites downstream from Rapid City were generally higher (figs. 3 and 4, table 3); however, two patterns were detected in median concentrations for different constituents in the basin. The first pattern includes TDS, sulfate, chloride, potassium, and sodium, and the second pattern includes bicarbonate, calcium, and magnesium. Patterns in water quality in the Rapid Creek Basin are likely affected by natural geologic sources, groundwater interactions, urban activities, and agricultural activities. Also, some of the sites in this analysis have few (10–20) observations, so the median concentrations may be less representative of the long-term (50-year) concentrations compared to other sites with more years of data.
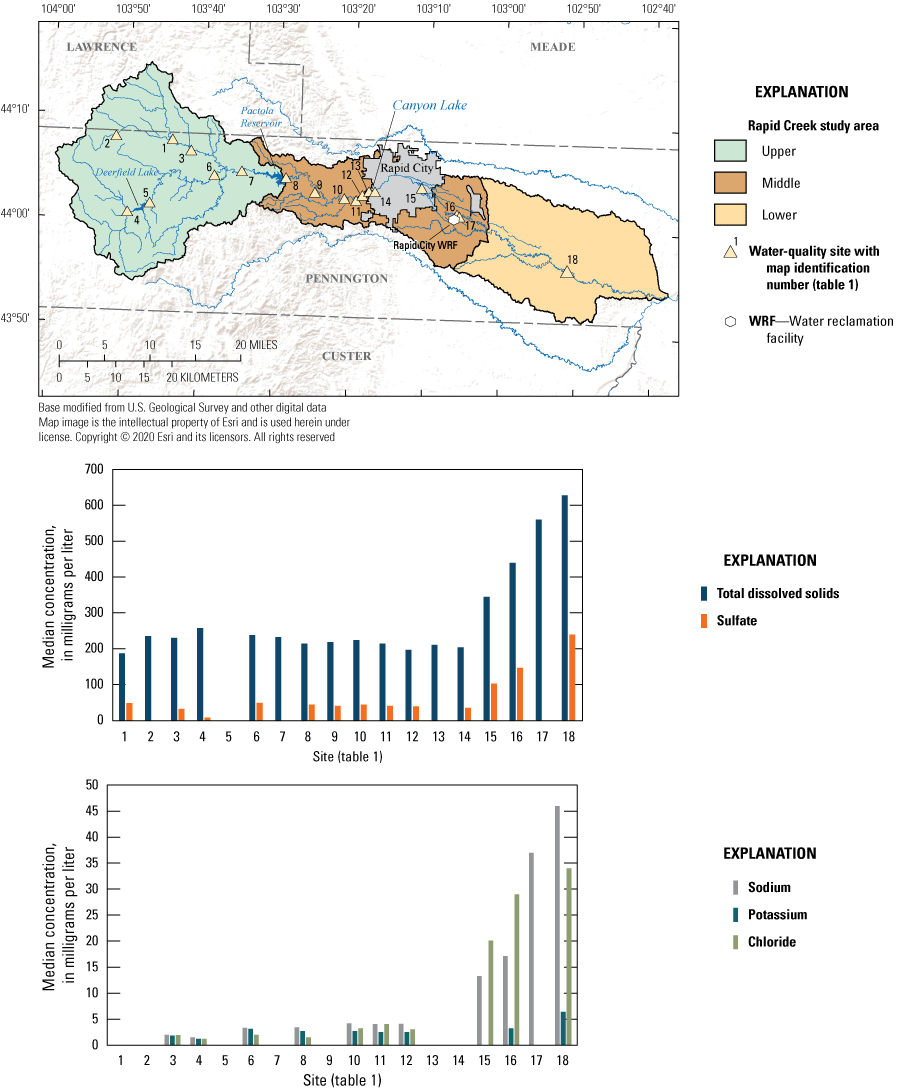
Median concentrations of total dissolved solids, sulfate, sodium, potassium, and chloride in the Rapid Creek Basin. Sites are ordered from upstream to downstream by site number (table 1).
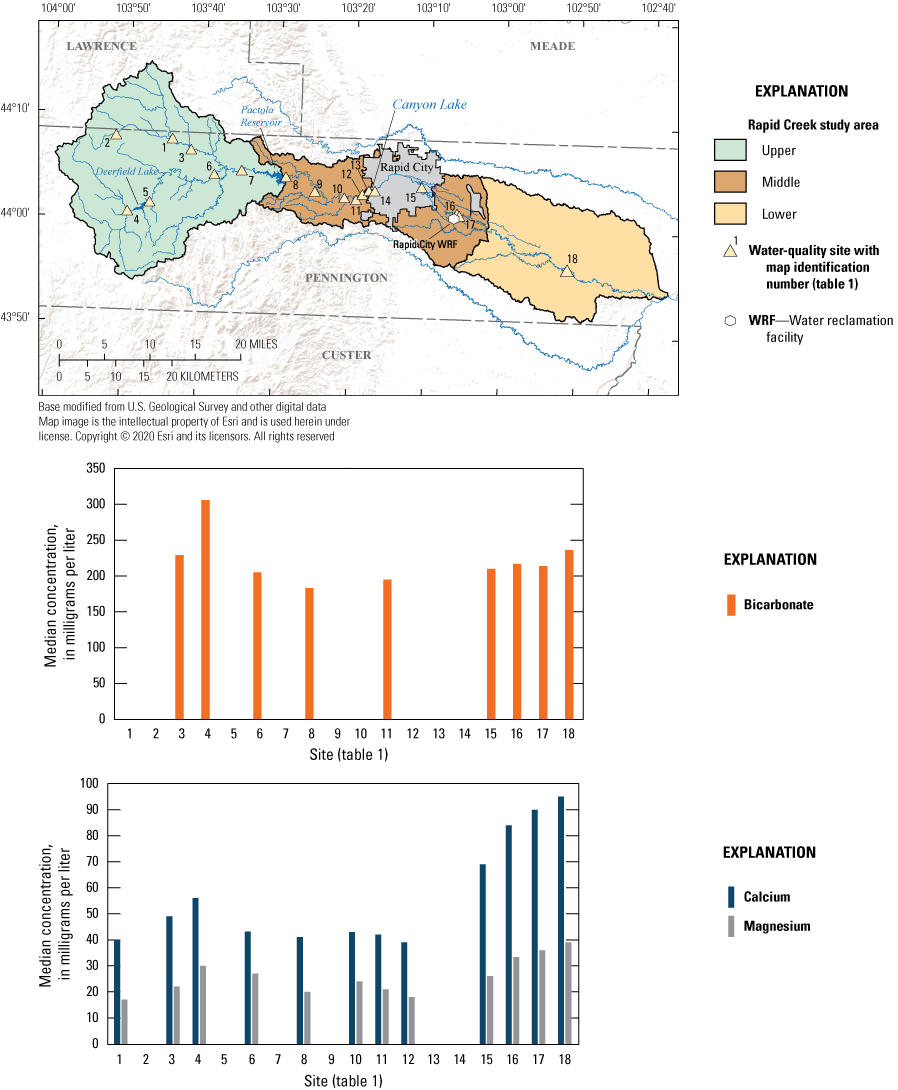
Median concentrations of bicarbonate, calcium, and magnesium in the Rapid Creek Basin. Sites are ordered from upstream to downstream by site number (table 1).
Median concentrations of TDS, sulfate, chloride, potassium, magnesium, and sodium were lowest at sites in the upper basin and were highest in the lower basin (figs. 3 and 4). For TDS and chloride and all sites in the basin, median concentrations were less than SD DANR standards (tables 2 and 3). The highest median concentrations for TDS, sulfate, chloride, potassium, magnesium, and sodium were observed at site 18 and were 628, 239, 34, 6.4, 39, and 46 mg/L, respectively (table 3). For TDS concentrations, the lowest median value in the basin was 187 mg/L at site 1 in the upper basin (table 3). Site 4 had the lowest concentrations in the basin for sulfate, chloride, potassium, and sodium with median values of 7, 1.2, 1.2, and 1.5 mg/L, respectively (table 3).
Effects on TDS, sulfate, chloride, potassium, and sodium concentrations in the Rapid Creek Basin are likely from urban activities, natural geologic sources, and agricultural practices. Evidence for the listed sources were observed in the patterns of these constituents where the highest concentrations were downstream from Rapid City on the plains east of the Black Hills (not shown; figs. 3 and 4). TDS in streams is composed of major ions (such as calcium, magnesium, sodium, potassium, sulfate, and chloride) and many other constituents that are present in small quantities. TDS concentrations may be affected by different constituents in different locations; for example, downstream from Rapid City, TDS was affected more by sulfate, chloride, and sodium, whereas upstream, it was affected more by bicarbonate, calcium, and magnesium. Sulfate in streams may be affected by land-use changes that can increase or decrease the exposure of naturally occurring sulfur to surface runoff, such as the irrigation practices and livestock management in the lower basin (Tatge and others, 2022a). Urban effects on sulfate include emissions from burning fossil fuels and wastewater discharge from municipal operations (Hem, 1985). Soils in the northern Great Plains have high contents of salts including sodium-sulfate salts, which can correspond to higher concentrations of sulfate because anions are removed from the soil by water more easily than cations (Carlson and others, 2015). The sodium-sulfate salts detected in soils in the northern Great Plains also dissolve and affect sodium concentrations in Rapid Creek. Additional urban activities that may introduce additional chloride and sodium in the Rapid Creek Basin include roadway and driveway deicing and industrial or municipal wastewater discharge (Hem, 1985; Granato and others, 2015).
Median concentrations of bicarbonate, calcium, and magnesium indicated a different pattern than TDS, sulfate, chloride, potassium, and sodium, where the lowest median concentrations generally were detected between Pactola Reservoir and Rapid City and the highest median concentrations were at sites upstream from Pactola Reservoir and downstream from Rapid City (figs. 3 and 4). Sites 8–14 had the lowest median concentrations of bicarbonate and for calcium sites 1 and 8–14 had the lowest median concentrations (table 3). Site 4 had the highest median concentration for bicarbonate at 306 mg/L. Site 18 had the highest median concentration for calcium and magnesium at 95 and 39 mg/L, respectively (table 3). Site 8 and 12, which are between Pactola Reservoir and Rapid City, had the lowest median bicarbonate and calcium concentrations of 183 mg/L and 39 mg/L, respectively. Sites 1 and 12 had the lowest concentrations of magnesium with median values of 17 and 18 mg/L, respectively. Overall median magnesium concentrations were observed to be lower between Pactola Reservoir and Rapid City than in the upper basin (fig. 4).
Regional geology and groundwater-surface-water interactions most likely have the most control on bicarbonate, calcium, and magnesium concentrations in the Rapid Creek Basin (Williamson and Carter, 2001; Driscoll and others, 2002). Rapid Creek is sourced from springs on the Limestone Plateau in the Madison Limestone unit. The spring water likely has higher concentrations of bicarbonate and calcium and moderate concentrations of magnesium because of the dissolution of calcite and dolomite. Magnesium concentrations in the basin are lower, likely because of dissolution kinetics in which calcite dissolves faster than dolomite (Appelo and Postma, 2005). Between Pactola Reservoir and Rapid City, many gains and losses in streamflow have been studied. The gains and losses mostly are detected where the stream crosses outcrops of the Madison Limestone (Hortness and Driscoll, 1998; Anderson and others, 1999; Driscoll and others, 2002). This interaction between the groundwater and surface water likely contributes to the patterns in bicarbonate, calcium, and magnesium. Increased concentrations in the lower basin and downstream from Rapid City likely have two sources: urban effects from Rapid City and the marine Cretaceous shales, notably the Pierre Shale, that form the bedrock of the plains to the east of the Black Hills (Schultz and others, 1980; Martin and others, 2004).
Total Suspended Solids and Suspended Sediment
Patterns in TSS concentrations were similar to TDS, where concentrations were higher at lower basin sites compared to upper basin sites, and the highest concentrations were at site 18, the farthest downstream site. Median TSS concentrations at sites upstream from Rapid City and through Rapid City (sites 1–16) were less than 10 mg/L, and only two sites had a median TSS concentration greater than 10 mg/L in the basin. The highest median TSS concentration was 34 mg/L at site 18 (table 4). The SD DANR standard for TSS is 30 mg/L, and only site 18 had a median value that exceeded that standard (table 2; South Dakota Department of Agriculture and Natural Resources, 2022).
Only five sites had data for suspended sediment concentration (SSC), and the spatial pattern seems to indicate the highest concentrations at sites in the middle and lower basin, except for site 4. Median SSC concentrations ranged from 6 mg/L at Rapid Creek below Canyon Lake Park (site 14) to 194 mg/L at site 15 (table 4). Both constituents measure the sediment or solids component of the water sample; however, analytical differences between these constituents do not allow the combination of SSC and TSS data (Gray and others, 2000).
Effects on TSS and SSC are likely from urban activities and surface and bank erosion. TSS concentrations likely increase downstream from Rapid City because of the stormwater runoff discharging into Rapid Creek and the WRF discharging into Rapid Creek. The U.S. Environmental Protection Agency (EPA) requires the City of Rapid City to monitor stormwater for water-quality compliance (U.S. Environmental Protection Agency, 2000). Rapid City invests in improving the stormwater discharges and runoff; however, TSS concentrations are still higher likely due to the large urban area with impervious surfaces, which increase solid particle runoff. Bank and surface erosion downstream from Rapid City also are likely affecting the increase in concentrations in the lower basin. The shale bedrock units provide materials for the creek and runoff to erode (Redden and DeWitt, 2008) and may increase concentrations.
Nutrients
Summary statistics were computed for five nutrient constituents with available data in the Rapid Creek Basin: dissolved phosphorus, total phosphorus, ammonia, nitrate plus nitrite, and TKN. Median nutrient concentrations were mostly low in the basin, and concentrations were higher at sites downstream from the Rapid City WRF (fig. 5). The Rapid Creek Basin is mostly rural with minor urban and agricultural effects. Upstream from Rapid City, much of the basin is forest land cover or minor urban effects; however, downstream from Rapid City, farming or ranching and urban effects from Rapid City dominate.
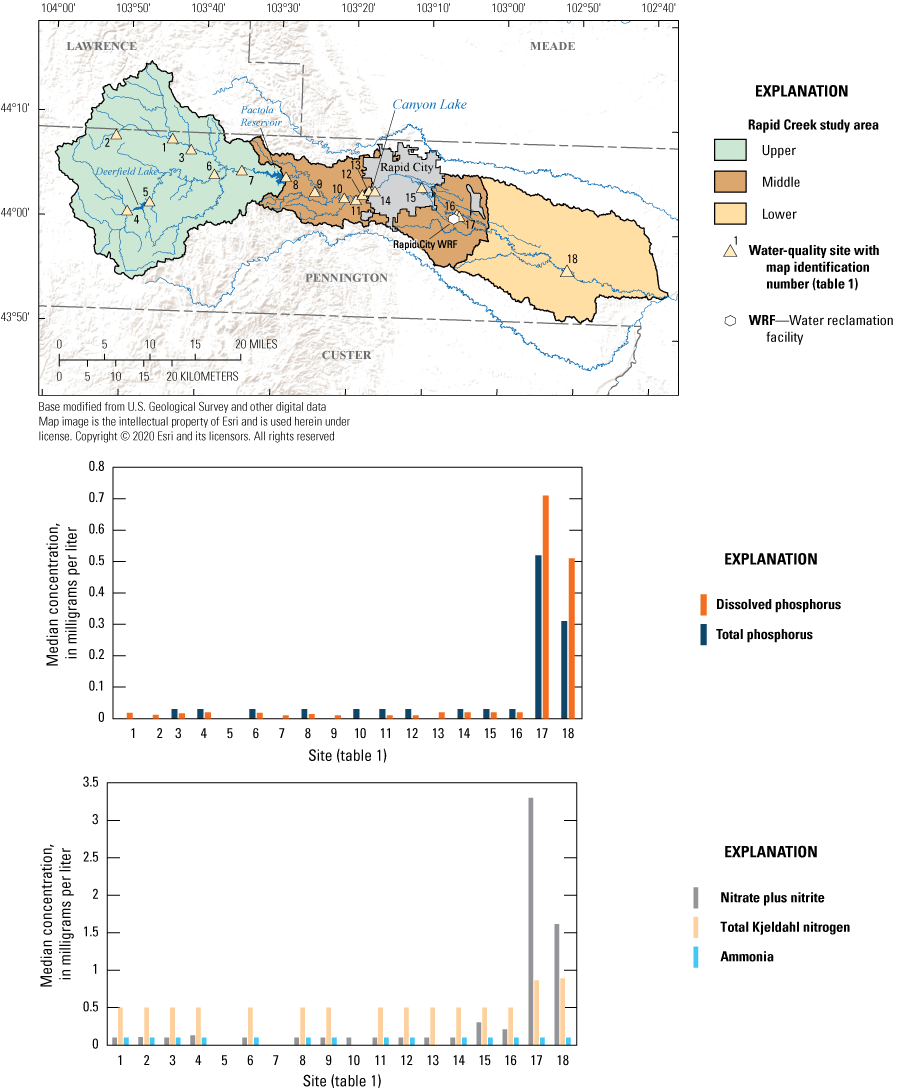
Median concentrations of nitrate plus nitrite, total Kjeldahl nitrogen, ammonia, dissolved phosphorus, and total phosphorus in the Rapid Creek Basin. Sites are ordered from upstream to downstream by site number (table 1).
Median concentrations of dissolved and total phosphorus in the Rapid Creek Basin are generally lower upstream from the Rapid City WRF, and the highest concentrations for both are at sites downstream from the Rapid City WRF (fig. 5). Of the 18 sites in the study, 10 had median concentrations of dissolved phosphorus at the reporting level (less than 0.03 mg/L as phosphorus). The two most downstream sites in the study had concentrations greater than the reporting level, and the highest median concentration of 0.52 mg/L as phosphorus was at site 17, immediately downstream from the WRF (fig. 5, table 5). Median total phosphorus concentrations ranged from less than 0.01 mg/L as phosphorus at five sites to 0.71 mg/L as phosphorus at site 17 (fig. 5, table 5).
Median concentrations of ammonia, nitrate plus nitrite, and TKN were at or less than the reporting level for each constituent at sites in the upper and middle basins of the Rapid Creek Basin (fig. 5). Median concentrations of nitrate plus nitrite and TKN were highest in the lower Rapid Creek Basin sites, and median concentrations of ammonia were at the recensored reporting level of 0.1 mg/L as nitrogen for all sites (table 5). The SD DANR standard for total ammonia is 2.4 mg/L as nitrogen (table 2; South Dakota Department of Agriculture and Natural Resources, 2022), and the highest concentration during the study period was 1.8 mg/L as nitrogen at site 17. Median nitrate plus nitrite concentrations in the basin ranged from less than 0.1 mg/L as nitrogen at 10 sites to 3.3 mg/L as nitrogen at site 17 (table 5). Nitrate plus nitrite concentrations at all sites were less than the SD DANR standard for nitrate plus nitrite of 10 mg/L as nitrogen (table 2; South Dakota Department of Agriculture and Natural Resources, 2022). Median TKN concentrations were at or less than the recensored level of 0.5 mg/L as nitrogen at all sites except two; the highest median concentration was 0.9 mg/L as nitrogen at site 18 (table 5). Concentrations of nitrate plus nitrite and TKN were higher at sites downstream from the Rapid City WRF (fig. 5).
Nutrient dynamics are controlled by activities in the basin and instream processes. WRF discharge and septic system discharge can be major point sources of nitrogen (mainly nitrate), phosphorus, and organic material (Hem, 1985). The upper basin is rural and sparsely populated, and septic systems could be possible point sources that may affect nutrient concentrations. Farther downstream, higher median concentrations of nutrients at sites downstream from the WRF indicate that the WRF likely affects the concentrations of nutrients in Rapid Creek (fig. 5). The lower Rapid Creek Basin also has more agricultural and urban land use, which also can affect nutrient concentrations through livestock production and urban stormwater runoff (Hem, 1985). Several microbiologically mediated processes control the nitrogen cycle, cycling the initial form of nitrogen from organic matter or fertilizers to ammonia and ammonium, then to nitrite and nitrate, and finally either back to organic matter by plant consumption or transformed to nitrogen gas through the denitrification process (Sawyer, 2006). Instream nitrogen cycle processes also are likely working to lower nutrient concentrations between site 17 and site 18 (fig. 5).
Field Measurements
Field measurements include water temperature, pH, dissolved oxygen, SC, and turbidity and are typically measured in the stream. Only pH, SC, and dissolved oxygen were included in the statistical summary for the selected sites. Summary statistics for pH and SC were computed at all 18 sites, and summary statistics for dissolved oxygen were computed at only 15 sites because of insufficient data available at 3 sites.
In the Rapid Creek Basin, median pH values were generally highest in the upper basin and lowest downstream from Pactola Reservoir (fig. 6, table 6). The median pH values ranged from 7.9 at Rapid Creek at Big Bend near Rapid City (site 9) to 8.4 at sites 2 and 10. All but site 9 had median pH values between 8 and 8.4, which meets the SD DANR pH standard of 6.5–9.0 (table 2; South Dakota Department of Agriculture and Natural Resources, 2022). Median pH values for Rapid Creek are between 6.5 and 8.5, which is the range of pH in natural streams not affected by pollution (Hem, 1985). The pH is likely controlled by limestone geology in the basin, which can act as a buffer and create a small range of pH values within the basin (Hem, 1985).
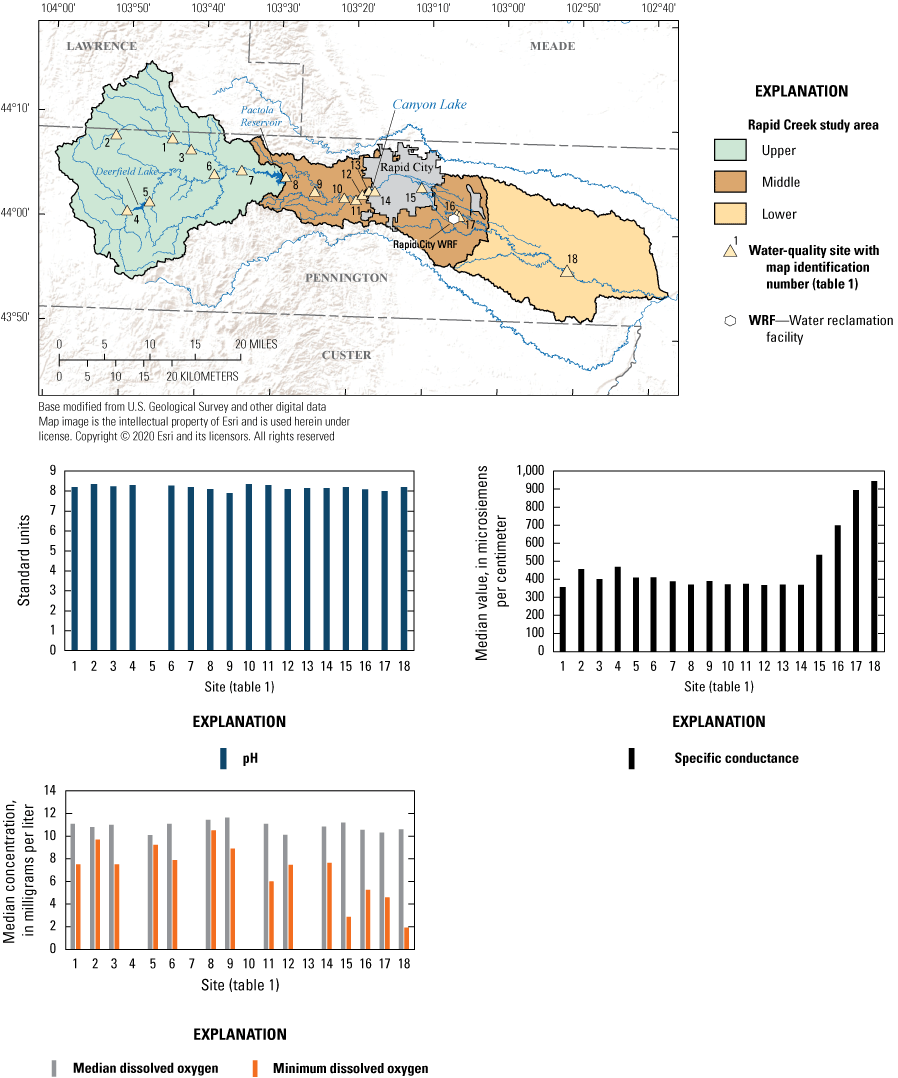
Median concentrations of pH, specific conductance, and dissolved oxygen in the Rapid Creek Basin. Minimum dissolved oxygen concentrations also were plotted with median. Sites are ordered from upstream to downstream by site number (table 1).
Median SC values were generally highest downstream from Rapid City (fig. 6, table 6). Median SC values were generally greater than or equal to 400 microsiemens per centimeter at 25 degrees Celsius (µS/cm at 25 °C) in the upper basin, except for site 1, which had the lowest median value in the basin, and site 7. In contrast, median SC values were less than 400 µS/cm in the middle basin upstream from Rapid City (sites 8–14; table 6). Median SC values were higher at sites downstream from Rapid City, and the highest median value for the basin was at site 18. The SD DANR standard for SC is 2,500 µS/cm, and all sites had median values that were less than the standard (table 2; South Dakota Department of Agriculture and Natural Resources, 2022). SC is often correlated to measures of total dissolved solids and thus closely follows the pattern previously described with TDS. Like effects on TDS, geology, urban activities, and agricultural activities in the Rapid Creek Basin also affect SC concentrations.
Median dissolved oxygen concentrations were generally highest in the upper basin but varied little across the basin (fig. 6; table 6). Dissolved oxygen concentrations vary seasonally and diurnally, which can cause variation depending upon sampling time; however, the median concentrations should give a representative concentration at selected sites in the basin. Median dissolved oxygen concentrations ranged from 10.1 mg/L at sites 5 and 12 to 11.7 mg/L at site 9, and the lowest measured dissolved oxygen concentration in the basin was 1.9 mg/L at site 18 (table 6). The SD DANR standard for dissolved oxygen is a daily minimum greater than 5 mg/L, which was met at all sites for median dissolved oxygen concentrations, but sites in the lower Rapid Creek Basin had minimum dissolved oxygen concentrations that did not meet the criterion (table 2; South Dakota Department of Agriculture and Natural Resources, 2022). Rapid Creek may have higher concentrations in the upper basin because of a steeper slope, more turbulence, and less organic matter, and in the lower basin, the stream has a shallower slope, less turbulence, and more organic matter.
Bacteria
Fecal indicator bacteria (such as fecal coliform, E. coli, or enterococci) are not necessarily a health threat themselves when present in water but are used to indicate if other potentially harmful bacteria may be present. Sources of fecal indicator bacteria include wastewater treatment plant effluent; leaking septic systems; stormwater runoff; domestic animal and wildlife waste; and runoff from manure storage areas, pastures, rangelands, and feedlots. Natural, nonfecal sources of fecal indicator bacteria, including plants, sand, soil, and sediments, also contribute to a certain background level in ambient waters and vary based on local environmental and meteorological conditions. In the 1960s, the U.S. Public Health Service recommended using fecal coliform as the fecal indicator bacteria for recreational waters. Later, the EPA published revised criteria in 1986 that recommended E. coli as the fecal indicator bacteria for recreational waters (U.S. Environmental Protection Agency, 2022). E. coli is part of the fecal coliform group and has been credited to be a more specific indicator of fecal contamination than the more general test for fecal coliform bacteria. The presence of nonfecal coliform bacteria from sources other than the gastrointestinal tracts of humans and other warm-blooded animals reduces the usefulness of fecal coliforms as an indicator of fecal contamination of surface water. In 2012, the EPA recommended using the fecal indicator bacteria enterococci or E. coli as indicators of fecal contamination for freshwater and enterococci for marine water (U.S. Environmental Protection Agency, 2022). Bacteria are measured by analyzing bacterial growth in laboratory analyses, either by a membrane filter procedure (with final values listed with units of colony forming units per 100 milliliters [cfu/100 mL]) or by colorimetric test kits (typically listed with units of most probable number per 100 milliliters [mpn/100 mL]).
In the Rapid Creek Basin, fecal coliform and E. coli data were available during 1970–2020. The most common fecal indicator bacteria data before 2000 were fecal coliform; fecal coliform and E. coli data were available between 2000 and 2014, and E. coli was generally the only fecal bacteria indicator used after 2014. Only E. coli concentrations are discussed in the following paragraphs because E. coli represents the most accurate indicator of contamination for freshwater according to the EPA (U.S. Environmental Protection Agency, 2022).
In general, E. coli concentrations were highest downstream from Rapid City at sites 15–18 (table 7, fig. 7). Median E. coli concentrations in the Rapid Creek Basin ranged from 4.7 mpn/100 mL at site 2 (Rhoads Fork near Rochford) to 173 mpn/100 mL at site 17. The median concentrations for sites 17 and 18 exceeded the SD DANR standard for E. coli of 126 mpn/100 mL (table 2; South Dakota Department of Agriculture and Natural Resources, 2022). The 126 mpn/100 mL SD DANR standard is a geometric mean based on a minimum of five samples obtained during separate 24-hour periods for any 30-day period. A standard of 235 mpn/100 mL of E. coli also should not be exceeded in any one sample. Median fecal coliform concentrations ranged from less than the detection level of 10 cfu/100 mL at four sites upstream from Rapid City (sites 4, 6, 8, and 11) to 575 cfu/100 mL at site 17. Notable increases in median bacteria concentrations were detected between the upper and lower Rapid Creek Basin boundaries and Rapid City. Median E. coli densities were generally higher at sites 16–18 than the upper and middle basin sites. Median fecal coliform densities increased from 16 to 200 cfu/100 mL between sites 14 and 15, representing approximately the upper and lower boundaries for the city of Rapid City. Another subsequent increase in median fecal coliform densities was between sites 16 and 17 (120 and 575 cfu/100 mL, respectively), which is likely attributed to the effect of the Rapid City WRF effluent discharge into Rapid Creek.
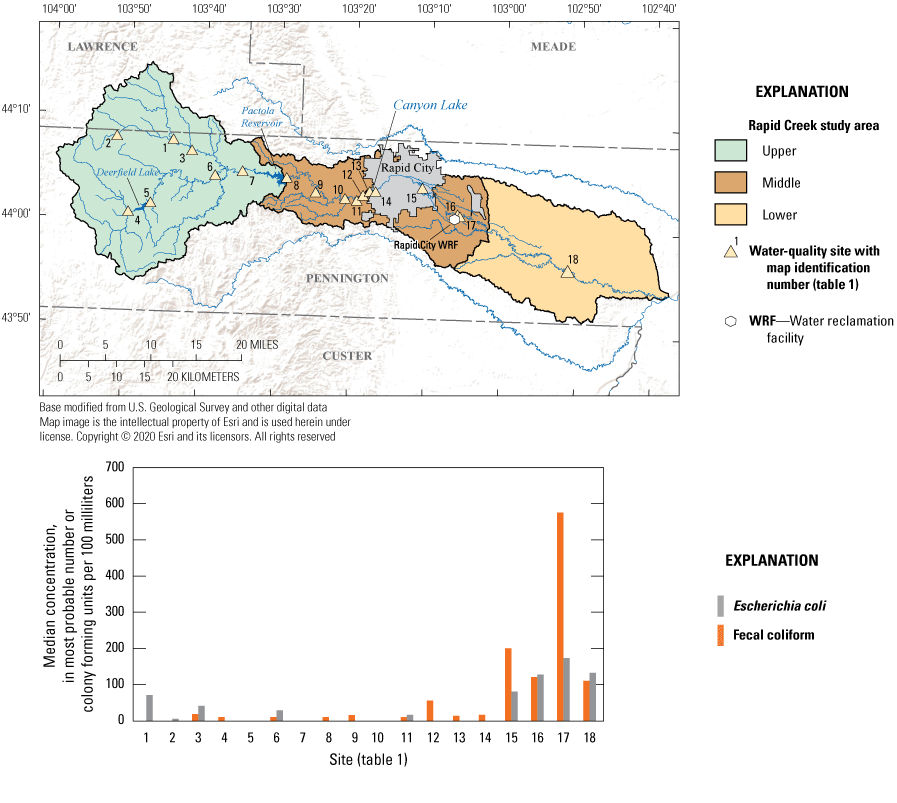
Median concentrations of Escherichia coli (in most probable number per 100 milliliters) and fecal coliform concentrations (in colony forming units per 100 milliliters) in the Rapid Creek Basin. Sites are ordered from upstream to downstream by site number (table 1).
Bacteria concentrations are typically affected by urban and agricultural effects. In the Rapid Creek Basin, the agricultural effects upstream from Rapid City are minor with most of the basin in a forested land coverage. Urban effects in the Rapid Creek Basin are primarily from stormwater runoff within the city of Rapid City (Hoogestraat, 2015, 2020) and wastewater treatment (Kenner and Smith, 2010). These two urban effects are documented in the bacteria data for site 15 (representing only urban stormwater runoff effects) and farther downstream at site 17 (representing stormwater and wastewater treatment effects). Median E. coli concentrations increased from 16.0 mpn/100 mL at site 11 to 80.0 mpn/100 mL at site 15, indicating the urban development effects, and further increased to 173 mpn/100 mL at site 17, indicating the additional wastewater treatment effects. Effluent from wastewater treatment plants can be treated to varying levels of fecal bacteria content during the year because the SD DANR beneficial-use criteria for the immersion recreation only applies during the months of May–September of a calendar year (South Dakota Department of Agriculture and Natural Resources, 2021). Thus, some fecal coliform samples collected outside the recreation season months were exceptionally high compared to those collected during the warmer summer months when different treatment processes were used at the WRF. Agricultural effects on bacteria can include manure application to fields or from pastures with livestock (Kenner and Smith, 2010).
Water-Quality Trends for Selected Sites in the Rapid Creek Basin
Water-quality data from 1970 to 2020 were used to analyze water-quality trends for the trend period of 1979–2019. Trends were analyzed for TDS, SC, calcium, magnesium, TSS, dissolved phosphorus, total phosphorus, and TKN. A two- or three-period trend model was used for TDS, SC, and TSS analysis, and the trend period (1979–2019) was broken into two or three monotonic trends using a combination of the early (1979–89), middle (1989–99), and late (1999–2019) periods. A one-trend model between 1989 and 2019 was used for calcium and magnesium trends, and a one-trend model was used between 1999 and 2019 for dissolved phosphorus, total phosphorus, and TKN. Total phosphorus had available data from 1989 through 2014, and SC had available data from 1979 through 2014; these were the trend periods used for those constituents. As discussed in the “Methods of Analysis” section, a trend is considered significant if the p-value is less than 0.01, mildly significant if the p-value is between 0.01 and 0.05, and nonsignificant if the p-value is greater than 0.05. Concentrations for constituents are reported in the flow-averaged GMC as R–QWTREND removes the effects of streamflow on water-quality concentrations (Vecchia and Nustad, 2020). Results for the trend analysis provide insight into temporal and spatial water-quality changes in the basin. The results are presented using figures showing the change in concentration from the start to the end of the period in annual flow-averaged GMC plotted with the annual GMC, a map showing water-quality trends at each site, and a table that summarizes the results. Annual GMC is an annual mean concentration that is not flow averaged and can indicate the flow-related variability of a given constituent (Nustad and Vecchia, 2020; Vecchia and Nustad, 2020). The greater variation of annual GMC from the fitted trend line indicates that flow-related variability is greater for that constituent.
Major Ions and Total Dissolved Solids
Major ion and dissolved ion constituents analyzed for trends in the Rapid Creek Basin include TDS, calcium, and magnesium. For two sites, a step trend was applied to account for differences in the dataset. A step trend was applied for calcium at site 11 to account for the difference between total and dissolved calcium. Dissolved calcium, in this case, was biased high compared to total calcium by 4 percent at site 11, which would not be physically possible. These differences may be related to a change in the analyzing laboratory. A step trend was applied for SC at site 17 because of differences between SC corrected to 25 degrees Celsius and SC that was not corrected by temperature. In this case, SD DANR data were biased low by about 3.5 percent compared to USGS data. These changes were accounted for in the model when the changes were known and determined to be statistically significant (p-value less than 0.01) to eliminate artificial trends in the dataset.
Changes in major ions and TDS concentrations in the Rapid Creek Basin were determined to be small (less than 15 percent) or mostly constant. Trends in TDS were evaluated at five sites with small, generally decreasing concentrations at sites upstream from Rapid City (sites 3, 6, and 11) and increasing concentrations at sites downstream from Rapid City (sites 17 and 18; figs. 8 and 9). In the early period (1979–89), four sites could be analyzed, and all sites had significant or mildly significant decreasing concentrations except for site 18, which had mildly significant increasing concentrations (fig. 9). For the middle period (1989–99), five sites were analyzed; upstream from Rapid City, concentrations were significantly increasing, and downstream from Rapid City, concentrations were nonsignificantly or mildly significantly decreasing (fig. 9). Five sites also were analyzed for the late period with significant and mildly significant decreasing concentrations at sites upstream from Rapid City and nonsignificant and mildly significant increasing concentrations at sites downstream from Rapid City (fig. 9). Between 1979 and 2019, sites upstream from Rapid City had a decrease in the flow-averaged GMC of TDS and sites downstream from Rapid City had an increase in the flow-averaged GMC of TDS (table 8).
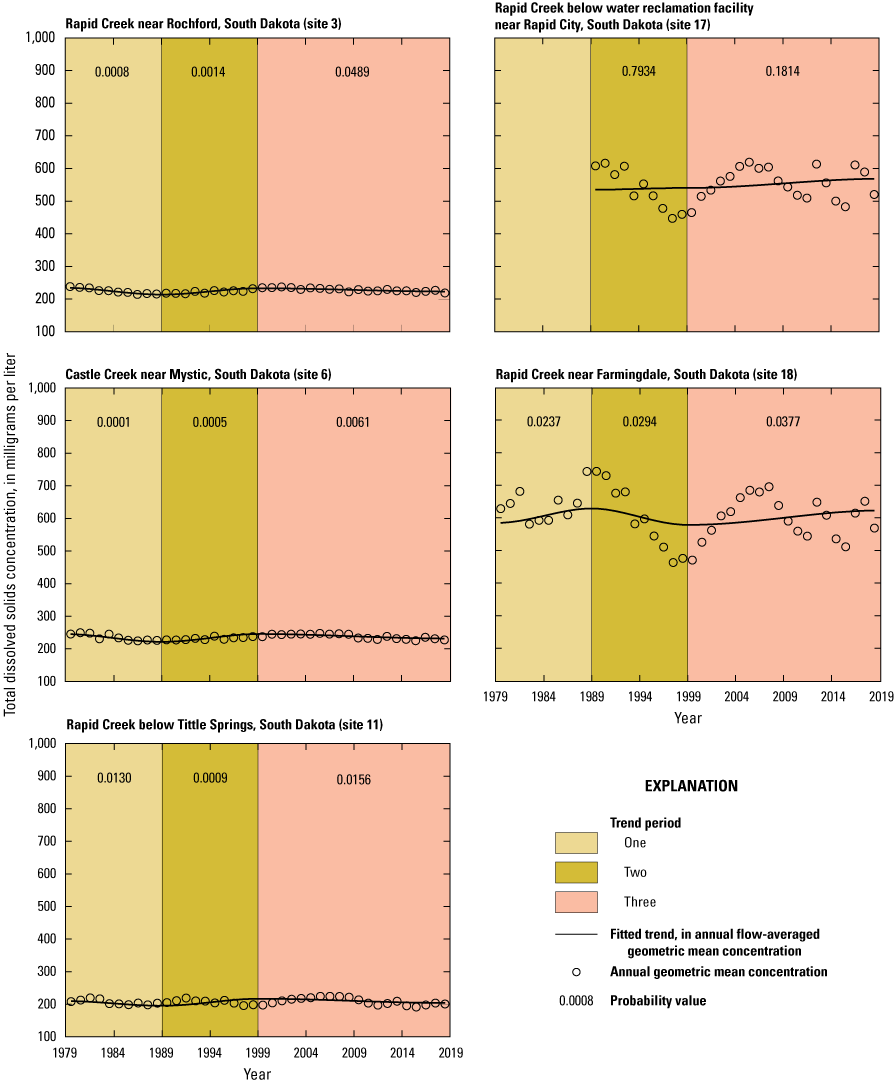
Fitted trends for total dissolved solids in annual flow-averaged geometric mean concentration of total dissolved solids at five sites in the Rapid Creek Basin for the trend period (1979–2019).
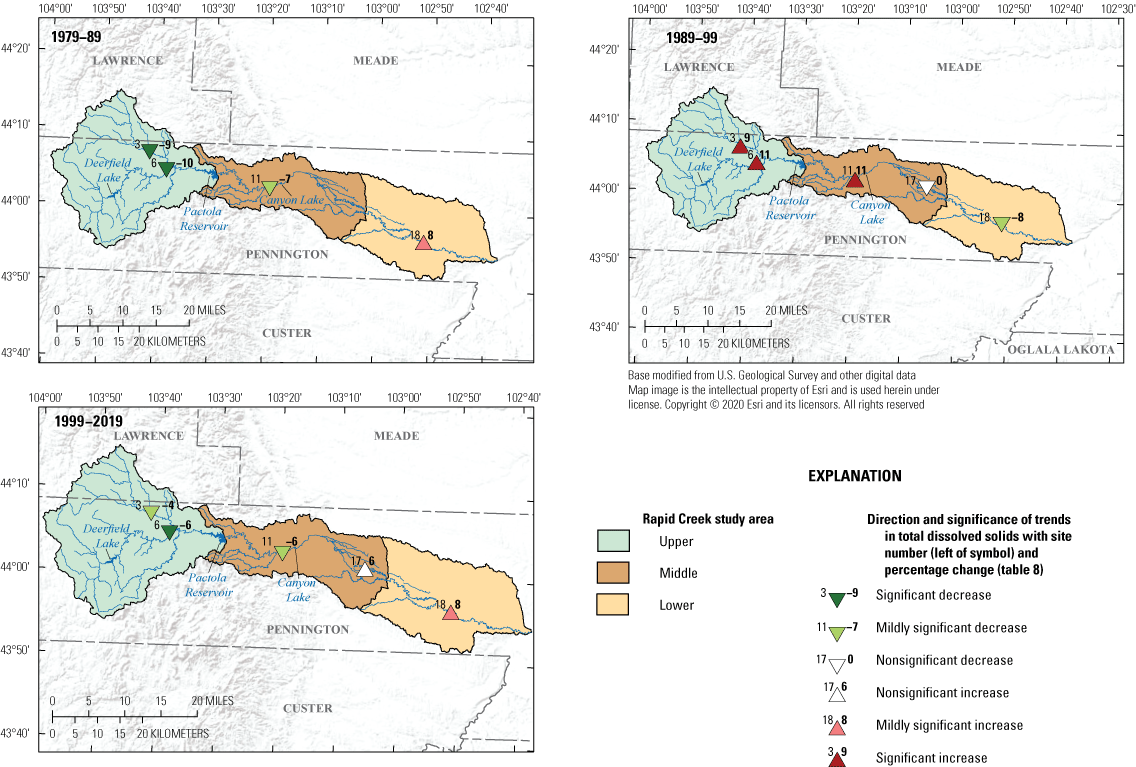
Direction and significance of trends in total dissolved solids at 5 sites for each of the 3 periods analyzed for trends between 1979 and 2019 in the Rapid Creek Basin.
Table 8.
Summary of trend results for total dissolved solids, major ions, specific conductance, and total suspended solids at selected sites in the Rapid Creek Basin between 1979 and 2019.[p-value, probability value; GMC, geometric mean concentration; WRF, water reclamation facility]
| Site location (fig. 1) | Rapid Creek Basin identifier | Site name | Trend model | Trend period | Step trend | p-value | Significance level | Annual flow-averaged GMC for first year in trend period | Annual flow-averaged GMC for last year in trend period | Change, in percent, from first to last yeara |
|---|---|---|---|---|---|---|---|---|---|---|
| 3 | Upper | Rapid Creek near Rochford, S. Dak. | Three | 1979–89 | No | 0.0008 | Significant decrease | 234 | 214 | −9 |
| 1989–99 | 0.0014 | Significant increase | 214 | 233 | 9 | |||||
| 1999–2019 | 0.0489 | Mildly significant decrease | 233 | 223 | −4 | |||||
| 6 | Upper | Castle Creek at Mystic, S. Dak. | Three | 1979–89 | No | 0.0001 | Significant decrease | 245 | 222 | −10 |
| 1989–99 | 0.0005 | Significant increase | 222 | 246 | 11 | |||||
| 1999–2019 | 0.0061 | Significant decrease | 246 | 232 | −6 | |||||
| 11 | Middle | Rapid Creek below Tittle Springs, S. Dak. | Three | 1979–89 | No | 0.0130 | Mildly significant decrease | 215 | 201 | −7 |
| 1989–99 | 0.0009 | Significant increase | 201 | 222 | 11 | |||||
| 1999–2019 | 0.0156 | Mildly significant decrease | 222 | 209 | −6 | |||||
| 17 | Middle | Rapid Creek below WRF near Rapid City, S. Dak. | Two | 1989–99 | No | 0.7934 | Nonsignificant decrease | 536 | 540 | 0 |
| 1999–2019 | 0.1814 | Nonsignificant increase | 540 | 569 | 6 | |||||
| 18 | Lower | Rapid Creek near Farmingdale, S. Dak. | Three | 1979–89 | No | 0.0237 | Mildly significant increase | 584 | 628 | 8 |
| 1989–99 | 0.0294 | Mildly significant decrease | 628 | 578 | −8 | |||||
| 1999–2019 | 0.0377 | Mildly significant increase | 578 | 622 | 8 | |||||
| 3 | Upper | Rapid Creek near Rochford, S. Dak. | One | 1989–2019 | No | 0.4302 | Nonsignificant increase | 48 | 50 | 3 |
| 11 | Middle | Rapid Creek below Tittle Springs, S. Dak. | One | 1989–2019 | Yes | 0.7052 | Nonsignificant decrease | 42 | 41 | −2 |
| 17 | Middle | Rapid Creek below WRF near Rapid City, S. Dak. | One | 1989–2019 | No | 0.1568 | Nonsignificant decrease | 92 | 88 | −5 |
| 18 | Lower | Rapid Creek near Farmingdale, S. Dak. | One | 1989–2019 | No | 0.6890 | Nonsignificant decrease | 93 | 92 | −1 |
| 3 | Upper | Rapid Creek near Rochford, S. Dak. | One | 1989–2019 | No | 0.3001 | Nonsignificant increase | 21 | 22 | 5 |
| 11 | Middle | Rapid Creek below Tittle Springs, S. Dak. | One | 1989–2019 | No | 0.3830 | Nonsignificant increase | 21 | 22 | 5 |
| 17 | Middle | Rapid Creek below WRF near Rapid City, S. Dak. | One | 1989–2019 | No | 0.8465 | Nonsignificant decrease | 36 | 35 | −1 |
| 18 | Lower | Rapid Creek near Farmingdale, S. Dak. | One | 1989–2019 | No | 0.1628 | Nonsignificant increase | 38 | 39 | 5 |
| 2 | Upper | Rhoads Fork near Rochford, S. Dak. | Two | 1989–99 | No | 0 | Significant increase | 444 | 464 | 5 |
| 1999–2014 | 0.5256 | Nonsignificant decrease | 464 | 462 | −1 | |||||
| 3 | Upper | Rapid Creek near Rochford, S. Dak. | Three | 1979–89 | No | 0.1334 | Nonsignificant increase | 382 | 392 | 3 |
| 1989–99 | 0.6675 | Nonsignificant decrease | 392 | 389 | −1 | |||||
| 1999–2014 | 0.0322 | Mildly significant increase | 389 | 402 | 3 | |||||
| 4 | Upper | Castle Creek above Deerfield Reservoir near Hill City, S. Dak. | Three | 1979–89 | No | 0.0014 | Significant decrease | 475 | 453 | −5 |
| 1989–99 | 0.0071 | Significant increase | 453 | 476 | 5 | |||||
| 1999–2014 | 0.2333 | Nonsignificant decrease | 476 | 466 | −2 | |||||
| 5 | Upper | Castle Creek below Deerfield Dam, S. Dak. | Three | 1979–89 | No | 0 | Significant decrease | 441 | 399 | −10 |
| 1989–99 | 0.0265 | Mildly significant increase | 399 | 412 | 3 | |||||
| 1999–2014 | 0.0086 | Significant decrease | 412 | 399 | −3 | |||||
| 6 | Upper | Castle Creek near Mystic, S. Dak. | Three | 1979–89 | No | 0.1180 | Nonsignificant increase | 412 | 421 | 2 |
| 1989–99 | 0.0026 | Significant decrease | 421 | 398 | −6 | |||||
| 1999–2014 | 0.0625 | Nonsignificant increase | 398 | 409 | 3 | |||||
| 7 | Upper | Rapid Creek above Pactola Reservoir at Silver City, S. Dak. | Three | 1979–89 | No | 0.0089 | Significant decrease | 395 | 369 | −7 |
| 1989–99 | 0.0051 | Significant increase | 369 | 396 | 7 | |||||
| 1999–2014 | 0.0032 | Significant decrease | 396 | 369 | −7 | |||||
| 8 | Middle | Rapid Creek below Pactola Dam, S. Dak. | Three | 1979–89 | No | 0.6527 | Nonsignificant decrease | 360 | 357 | −1 |
| 1989–99 | 0.0367 | Mildly significant increase | 357 | 375 | 5 | |||||
| 1999–2014 | 0.2192 | Nonsignificant decrease | 375 | 365 | −3 | |||||
| 11 | Middle | Rapid Creek below Tittle Springs, S. Dak. | Three | 1979–89 | No | 0.1988 | Nonsignificant increase | 361 | 371 | 3 |
| 1989–99 | 0.4749 | Nonsignificant increase | 371 | 377 | 1 | |||||
| 1999–2014 | 0.8221 | Nonsignificant increase | 377 | 378 | 0.4 | |||||
| 12 | Middle | Rapid Creek above Canyon Lake near Rapid City, S. Dak. | Three | 1979–89 | No | 0.0331 | Mildly significant decrease | 374 | 353 | −6 |
| 1989–99 | 0.0151 | Mildly significant increase | 353 | 377 | 7 | |||||
| 1999–2014 | 0.7647 | Nonsignificant decrease | 377 | 375 | −1 | |||||
| 16 | Middle | Rapid Creek above WRF near Rapid City, S. Dak. | Two | 1989–99 | No | 0.8575 | Nonsignificant decrease | 662 | 658 | −1 |
| 1999–2014 | 0.0016 | Significant increase | 658 | 732 | 11 | |||||
| 17 | Middle | Rapid Creek below WRF near Rapid City, S. Dak. | Two | 1989–99 | Yes | 0.0152 | Significant decrease | 898 | 833 | −7 |
| 1999–2014 | 0.0010 | Significant increase | 833 | 928 | 12 | |||||
| 18 | Lower | Rapid Creek near Farmingdale, S. Dak. | Three | 1979–89 | No | 0.0012 | Significant increase | 883 | 963 | 9 |
| 1989–99 | 0.0038 | Significant decrease | 963 | 885 | −8 | |||||
| 1999–2014 | 0.0003 | Significant increase | 885 | 981 | 11 | |||||
| 17 | Middle | Rapid Creek below WRF near Rapid City, S. Dak. | Two | 1989–99 | Yes | 0.0025 | Significant decrease | 24 | 16 | −33 |
| 1999–2019 | 0.006 | Significant decrease | 16 | 11 | −31 | |||||
| 18 | Lower | Rapid Creek near Farmingdale, S. Dak. | Three | 1979–89 | Yes | 0.1481 | Nonsignificant decrease | 40 | 34 | −14 |
| 1989–99 | 0.2184 | Nonsignificant increase | 34 | 39 | 14 | |||||
| 1999–2019 | 0.0020 | Significant decrease | 39 | 27 | −30 |
Less flow-related variability in TDS concentrations was evident at sites in the upper Rapid Creek Basin compared to the middle and lower Rapid Creek Basin. The flow-related variability in concentration is determined by how closely the annual GMC values compare to the fitted trend line (fig. 8). The annual GMC for TDS indicates that TDS concentrations had less flow-related variability at sites 3, 6, and 11 in the upper part of Rapid Creek Basin compared to sites 17 and 18 in the middle and lower Rapid Creek Basin that had higher flow variability (fig. 8). Removing the flow variability from variations in water quality indicates the trends are based on changes from effects other than streamflow.
Although many of the trends in TDS concentration were significant or mildly significant, the percentage change from starting to ending year were small and indicate that changes on the land surface in the basin have largely not affected total dissolved solids concentrations in Rapid Creek. Total dissolved solids concentrations in the basin are likely dominated by calcium, magnesium, and bicarbonate concentrations in the upper and middle basins because of the limestone units. The small trends in TDS concentrations observed across the basin were likely due to the strong effect of groundwater interactions and lack of major land-use changes (Anderson and others, 1999; Cotillon, 20139). Sites 17 and 18 on Rapid Creek east of Rapid City had small increases in TDS concentrations, potentially because of the change in geology in the lower basin compared to the upper and middle basin (Martin and others, 2004).
Small nonsignificant trends were detected at all sites for calcium and magnesium concentrations between 1989 and 2019 (sites 3, 11, 17, and 18; figs. 10–13, table 8). Calcium concentrations nonsignificantly decreased at all sites between 1989 and 2019, except site 3, which had nonsignificant increasing concentrations (figs. 10 and 11, table 8). The change for calcium concentrations ranged from 3 to −5 percent across the basin (table 8). Magnesium concentrations were determined to be nonsignificantly increasing at sites across the basin except site 17 (figs. 12 and 13, table 8). The change in the flow-averaged GMC of magnesium ranged from −1 to 5 percent (table 8).
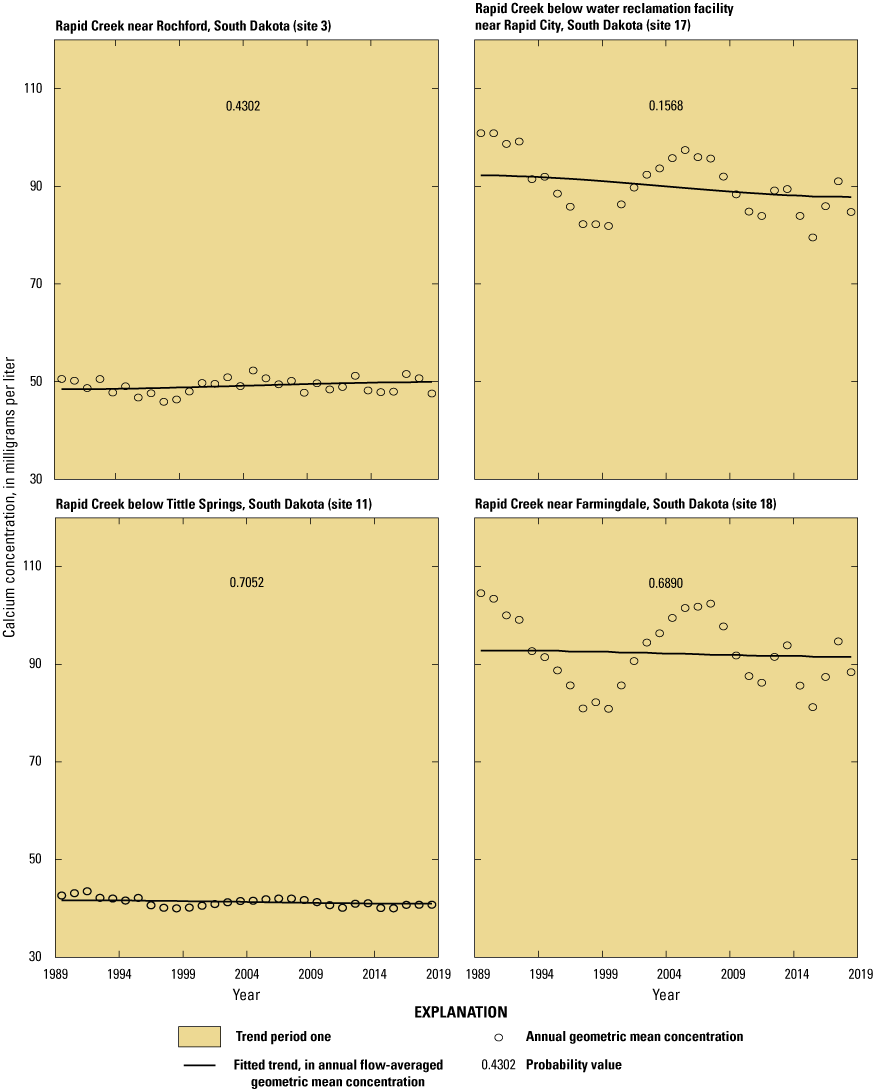
Fitted trends for calcium in annual flow-averaged geometric mean concentration of calcium at four sites in the Rapid Creek Basin for the trend period (1989–2019).
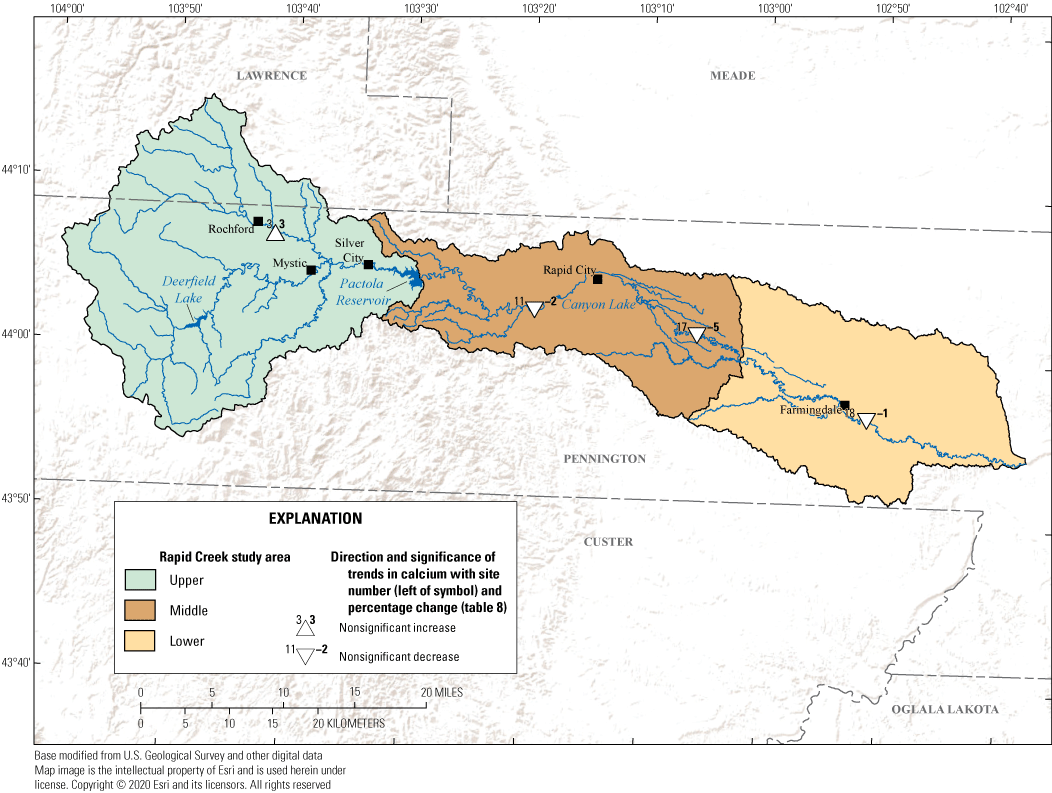
Direction and significance of trends in calcium at four sites for the period analyzed for trends between 1979 and 2019 in the Rapid Creek Basin.
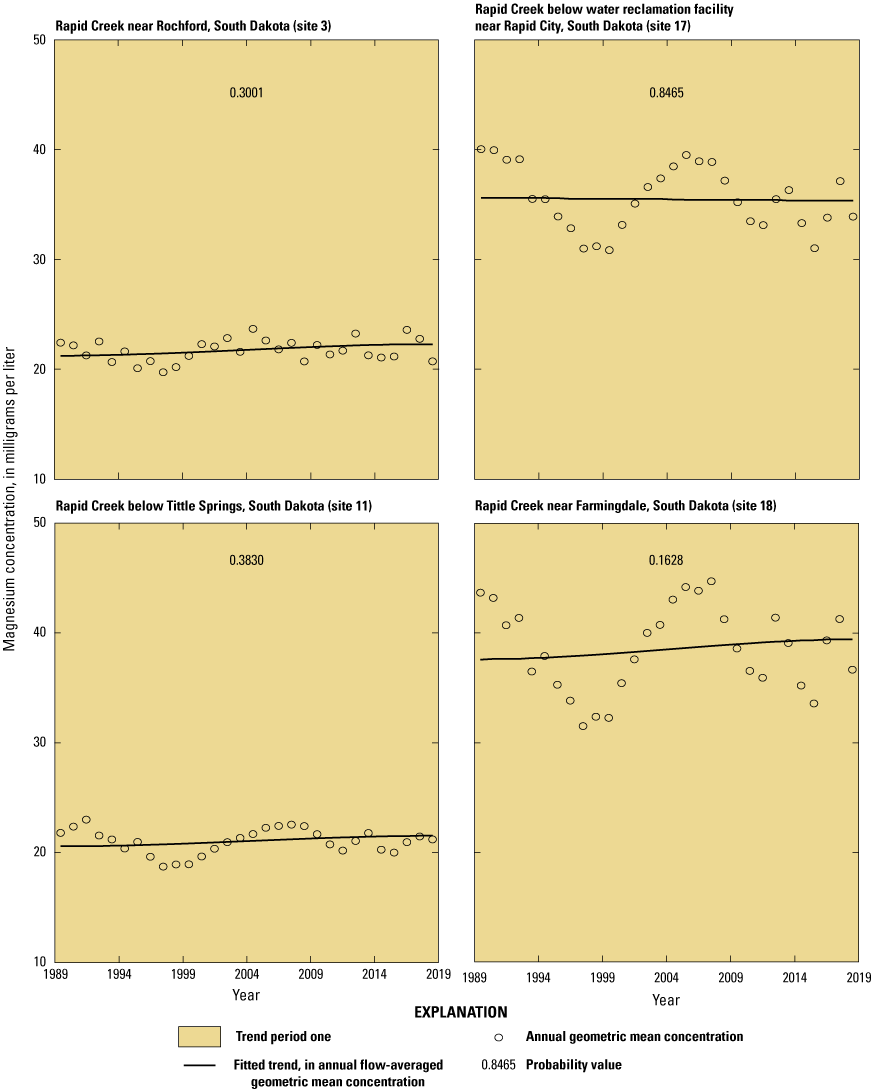
Fitted trends for magnesium in annual flow-averaged geometric mean concentration of magnesium at four sites in the Rapid Creek Basin for the trend period (1989–2019).
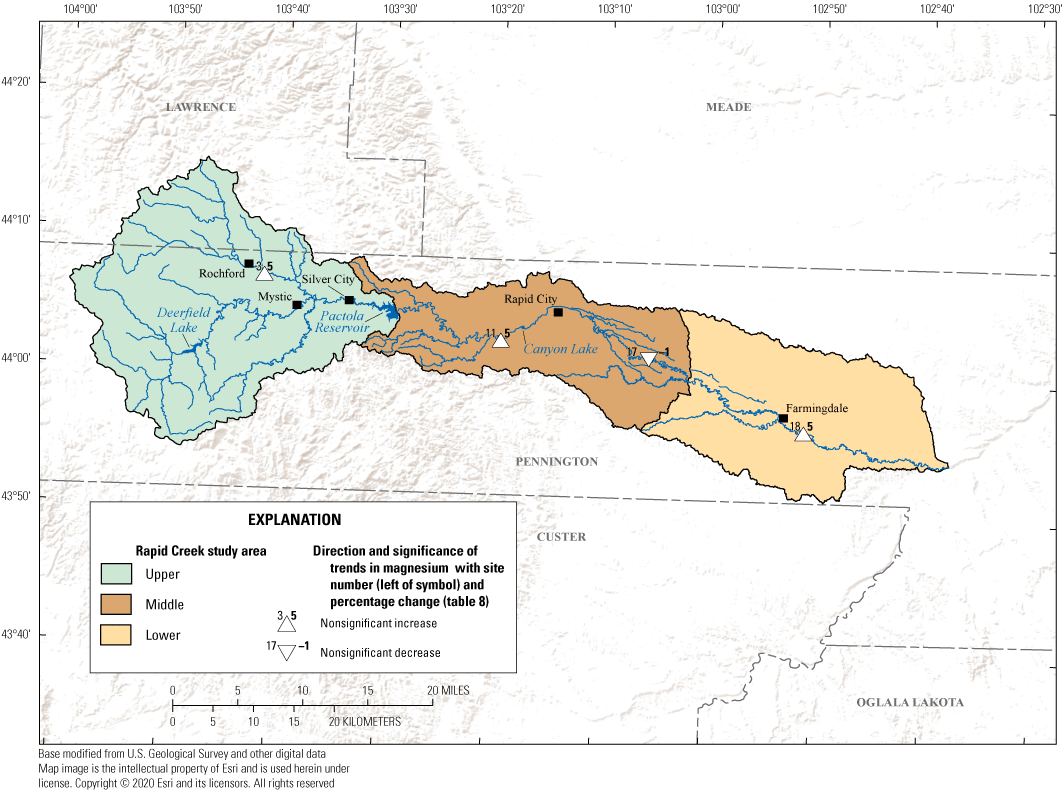
Direction and significance of trends in magnesium at four sites for the period analyzed for trends between 1979 and 2019 in the Rapid Creek Basin.
At sites near Rapid Creek’s headwaters, the annual GMC for calcium had lower flow-related variability than sites farther downstream (fig. 10); for example, sites 3 and 11 are near the headwaters and calcium concentrations have less flow-related variability. Sites 17 and 18 in the lower basin had larger flow-related variability. The annual GMC for magnesium follows a similar trend, except flow-related variability is evident at all sites (fig. 12). Differences in flow-related variability between calcium and magnesium are likely due to the differential dissolution rates between calcite and dolomite in limestones. The mostly constant trends in calcium and magnesium also are likely the result of dissolution of calcite and dolomite within the Madison Limestone. Flow rates in springs are generally consistent, but in response to a prolonged wet period and increase in flow rates (Carter and others, 2002), more magnesium may be transported in response to the increase in water table and flow.
Field Measurements
A total of 12 sites were evaluated for SC trends: 6 sites in the upper Rapid Creek Basin (sites 2–7) and 6 sites in the middle and lower basins (fig. 14A, B). Trends in SC values in the Rapid Creek Basin were mixed with alternating increasing and decreasing trends at many of the sites between 1979 and 2014 (fig. 15). The annual GMC for SC follows the same general pattern as TDS, as expected, with flow-related variability less pronounced upstream and more evident downstream (fig. 14A, B).
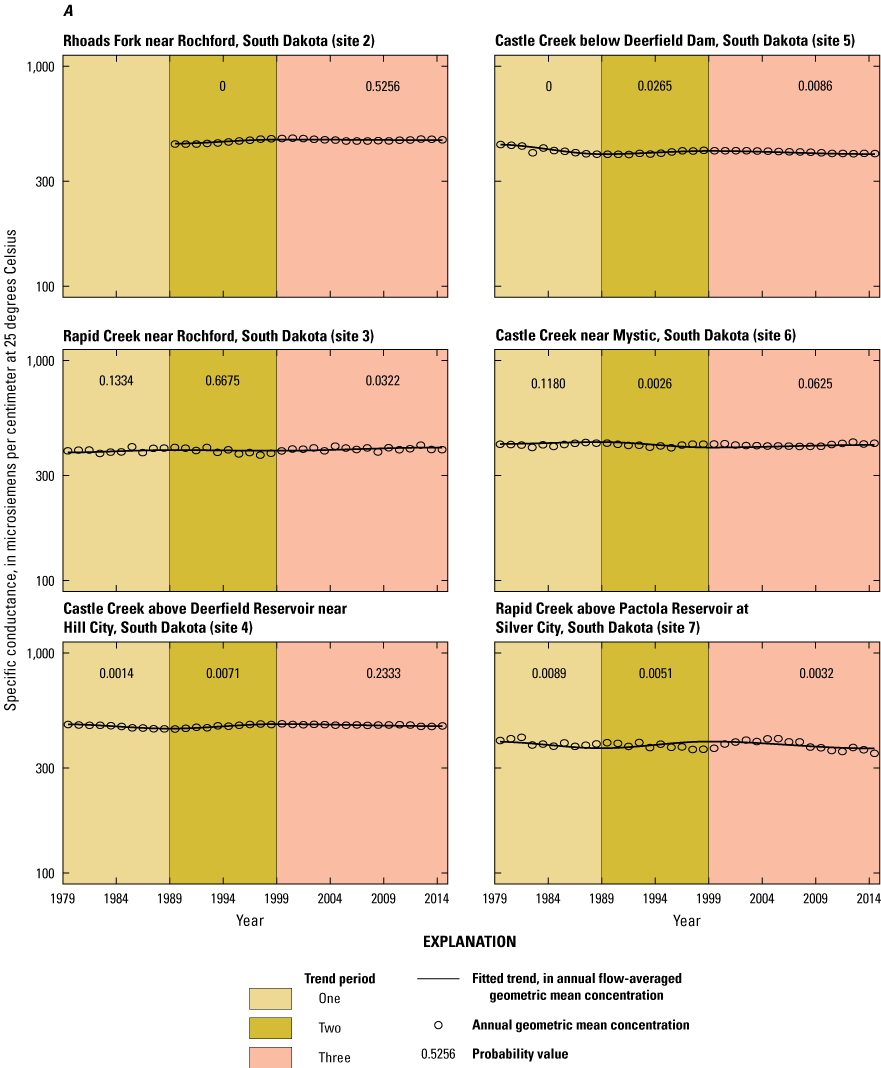
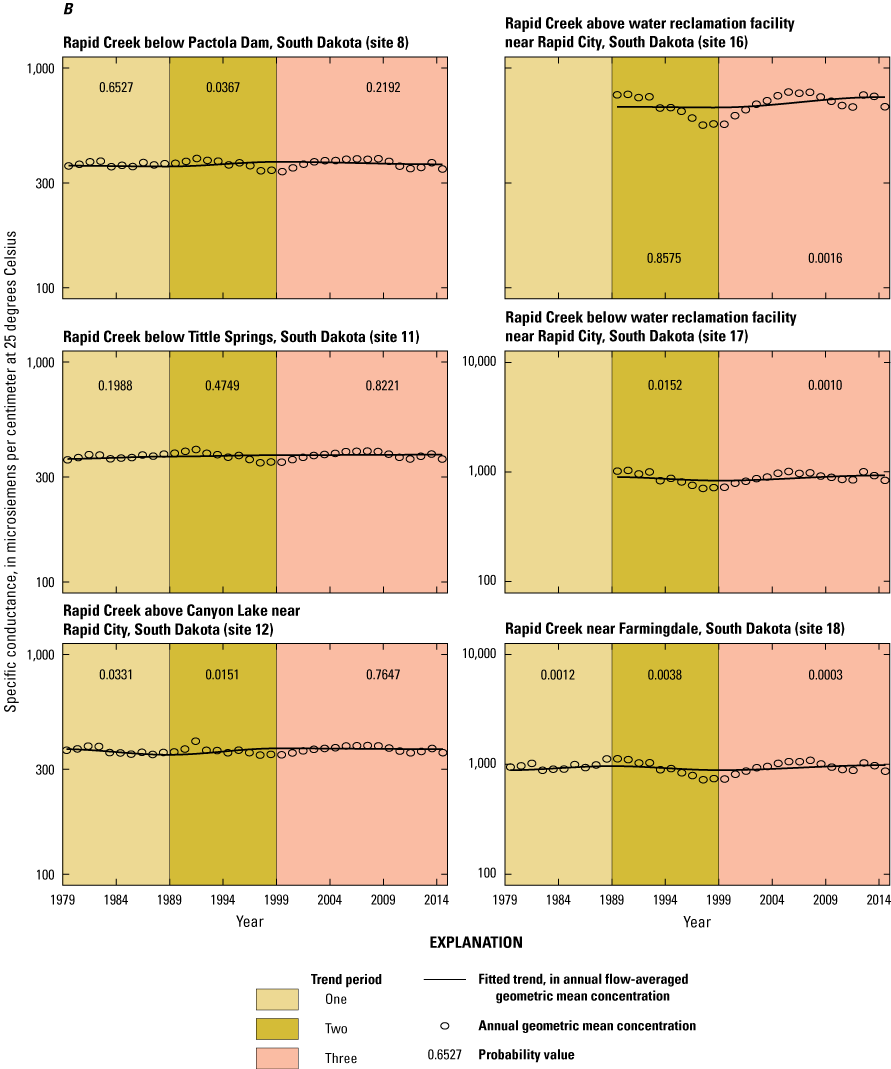
Fitted trends for specific conductance in annual flow-averaged geometric mean concentration of specific conductance at 12 sites with annual geometric mean concentrations for specific conductance in the Rapid Creek Basin for the trend period (1979–2014). A, upper basin; B, middle and lower basin.
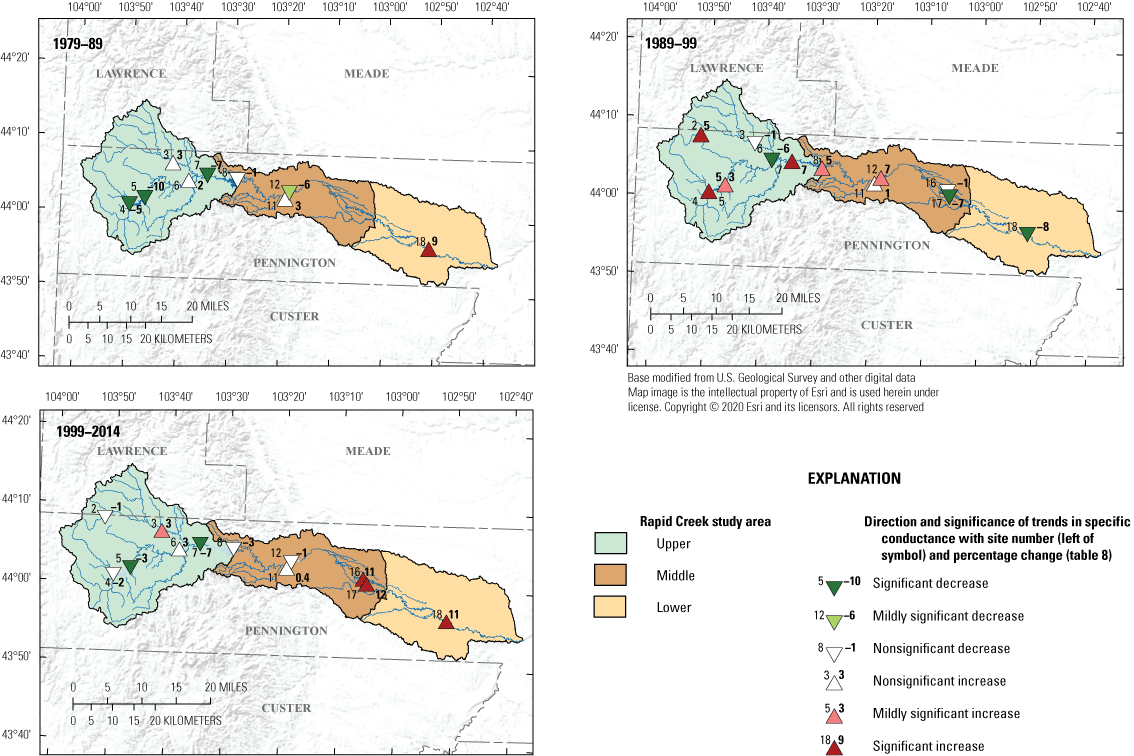
Direction and significance of trends in specific conductance at 12 sites for each of the 3 periods analyzed for trends between 1979 and 2014 in the Rapid Creek Basin.
Upper basin trends in SC had mixed trend directions but had little change between 1979 and 2014 (figs. 14A and 15, table 8). Five upper basin sites (sites 3, 4, 5, 6, and 7) were evaluated for SC trends in the early period (1979–89); sites 4, 5, and 7 had decreasing concentrations, and sites 3 and 6 had increasing concentrations. The same five sites in the middle period (1989–99) each changed in the trend direction, where sites 4, 5, and 7 had increasing concentrations and sites 3 and 6 had decreasing concentrations (fig. 14A). In addition, site 2 was added during the middle period and had an increase in SC concentrations. During the late period (1999–2014), the six sites reversed trend direction again, so sites 2, 4, 5, and 7 had decreasing concentrations and sites 3 and 6 had increasing concentrations (table 8 and fig. 14A).
The six sites in the middle and lower basins evaluated for trends in SC concentrations were generally increasing from 1979 to 2014, and differing trend directions were detected among the three trend periods (figs. 14B and 15). During the early period (1979–89), four sites were evaluated for trends (sites 8, 11, 12, and 18). Sites 11 and 18 had increasing concentrations (nonsignificant and significant, respectively) and sites 8 and 12 had decreasing concentrations in SC (nonsignificant and mildly significant, respectively; table 8). Sites 16 and 17 were added during the middle period, and of the six sites evaluated, three had increasing concentrations and three had decreasing concentrations. Sites 8 and 12 had mildly significantly increasing concentrations, and site 11 had nonsignificantly increasing concentrations. Sites 17 and 18 had significantly decreasing concentrations in the middle period, and site 16 had nonsignificantly decreasing concentrations. During the late period, all sites upstream from Rapid City had nonsignificant trends with two decreasing (sites 8 and 12) and one increasing (site 11). The sites downstream from Rapid City in the late period all had significantly increasing concentrations. All the sites among the three periods (early, middle, and late) had the direction of the trend change, except site 11, which had nonsignificantly increasing concentrations over each of the three periods.
Trends in SC can be used as a proxy for sites with too few data for TDS trends to be analyzed. Overall, trends in SC indicated that total dissolved solids concentrations in Rapid Creek have not been largely affected by changes in land surface. The trends in SC across the basin were generally small and indicated little change in total dissolved solids in Rapid Creek. Geologic and hydrologic effects on Rapid Creek are likely the reason for less significant changes in concentration upstream from Rapid City. Because of the crystalline core of the Black Hills, dilution from many of the small tributaries containing low total dissolved solids concentrations likely affects the concentrations in Rapid Creek upstream from Rapid City. Urban, geologic, and agricultural effects are likely affecting the significant changes in concentrations downstream from Rapid City.
Total Suspended Solids
TSS concentrations were observed to be decreasing at the two sites analyzed for trends in the Rapid Creek Basin between 1979 and 2019 (figs. 16 and 17, table 8). Site 18 was analyzed using a three-trend model between 1979 and 2019, and site 17 was analyzed using a two-trend model between 1989 and 2019. Step trends were used to correct for differences in data caused by nonenvironmental factors such as laboratory-analytical methods at the two sites analyzed in the basin (table 8). At site 17, samples analyzed using EPA method 160.1 were determined to be biased high by about 35 percent compared to the standard method 2540D. A step trend was applied to account for these laboratory differences. At site 18, TSS results from SD DANR that were identified as suspended were determined to be biased high by about 25 percent compared to TSS results from USGS and SD DANR identified as not applicable (NA), and a significant step trend was applied. Accounting for these biases provides the reasonable assumption that the trends analyzed for TSS reflect changes from factors other than laboratory differences, such as land-use changes. Each step trend applied was tested to ensure that it was statistically significant (p-value less than or equal 0.1).
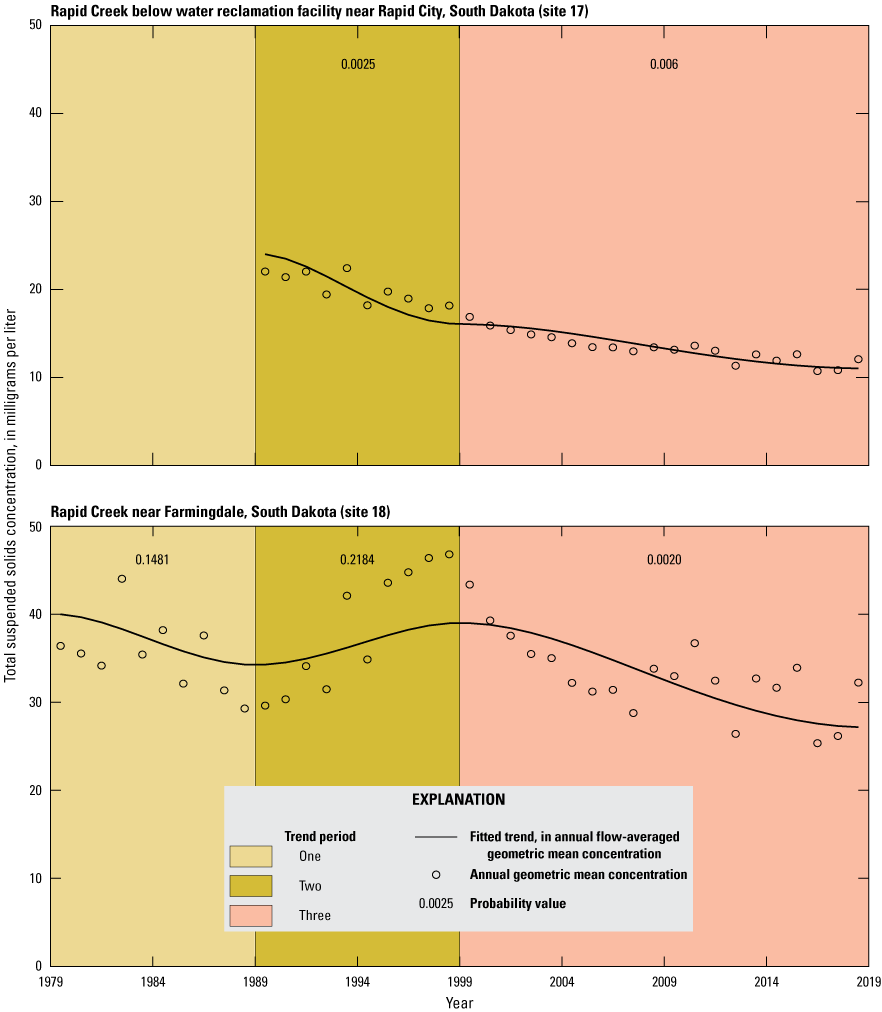
Fitted trends for total suspended solids in annual flow-averaged geometric mean concentration of total suspended solids at two sites with annual geometric mean concentrations in the Rapid Creek Basin for the trend period (1979–2019).
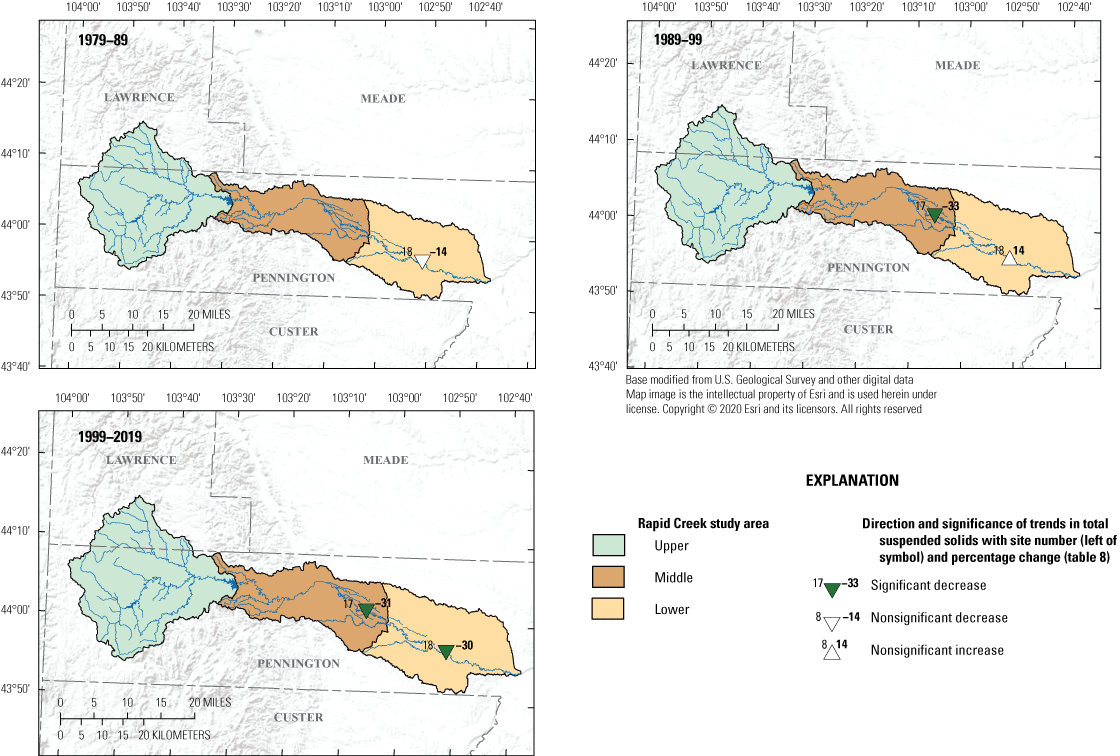
Direction and significance of trends in total suspended solids at 2 sites for each of the 3 periods analyzed between 1979 and 2019 in the Rapid Creek Basin.
Trends in TSS concentrations were generally observed to be decreasing at the two sites between 1979 and 2019 (figs. 16 and 17, table 8). Site 17 had significant decreases in flow-averaged GMC for TSS in the middle and late periods compared to site 18, which only had a significant decrease in the late period and had a nonsignificant increase in the middle period. At site 18, between 1979 and 1999, the concentration did not change because both periods had nonsignificant trends (table 8). Sites upstream from Rapid City had too few data to analyze trends to determine if similar trends were observed. The annual GMC (fig. 16) was observed to have more flow-related variability at site 18 as compared to site 17. Site 17 likely has less flow-related variability because a substantial amount of the flow in this part of Rapid Creek during low flow conditions is most likely discharge from the WRF.
The decreases in TSS concentrations in the Rapid Creek Basin could be related to several factors such as the implementation of a stormwater management plan in Rapid City, improvements to the Rapid City WRF, and residual effects of the overall climatic regime. The EPA began to require urbanized areas to manage stormwater in 1990, beginning with large cities with populations greater than 100,000, and then in 1999, smaller cities such as Rapid City were subject to the same regulations (U.S. Environmental Protection Agency, 2000). Management of stormwater by Rapid City after 1999 may be contributing to decreasing concentrations at the sites below the WRF (fig. 17). The Rapid City WRF also has had numerous improvements during the trend period, which may have had some effect on the decreases in TSS concentrations (HDR, 2016).
Nutrients
Total phosphorus, dissolved phosphorus, and TKN were analyzed for trends in the Rapid Creek Basin. Five sites were analyzed for total phosphorus concentration trends using a one-period trend model between 1989 and 2014. Data were available to analyze trends for dissolved phosphorus and TKN concentrations at only two sites in the basin between 1999 and 2014 and 1999 and 2019, respectively. An interval-based step trend was applied at sites 17 and 18 for total phosphorus to account for major renovations and improvements to the Rapid City WRF in 1992 and 2003 (HDR, 2016). An interval-based step trend is used to model abrupt changes in the flow-adjusted concentrations from an anthropogenic source, such as the WRF on Rapid Creek (Vecchia and Nustad, 2020).
To account for the improvements to the WRF, two interval-based step trends in 1992 and 2003 (HDR, 2016) were tested at sites 17 and 18. Both step trends indicated a significant decrease in total phosphorus when tested without a monotonic trend; however, when the monotonic trend was added, the step trends were smaller and nonsignificant but still indicated decreasing concentrations. Given that these are known improvements, the interval-based step trends were included in the final models, and although the magnitude of the decrease cannot be reliably determined, the analysis indicates that WRF improvements in 1992 and 2003 resulted in decreased total phosphorus concentrations at downstream sites. By applying the interval-based step trends, the effects from WRF improvements were removed and the changes in concentration detected from the monotonic trends were assumed to be the results of other processes in the basin.
Concentrations in total phosphorus were observed to be significantly decreasing at all sites between 1989 and 2014 (figs. 18 and 19, table 9). Each site had a significant decrease in total phosphorus concentrations that ranged from 43 to 75 percent. Each of the three sites upstream from the Rapid City WRF had relatively low flow-averaged GMCs that decreased from about 0.03 to 0.01 mg/L as phosphorus (table 9). The two sites downstream from the Rapid City WRF had smaller percentage changes but larger flow-averaged GMCs that decreased by 0.35 and 0.30 mg/L as phosphorus at sites 17 and 18, respectively (table 9). As previously mentioned, the trend results in table 9 reflect a decrease in concentrations that is due to processes unrelated to the known WRF improvements. Annual GMCs of total phosphorus show that site 16 had the least flow-related variability and site 17 had the largest flow-related variability (fig. 18).
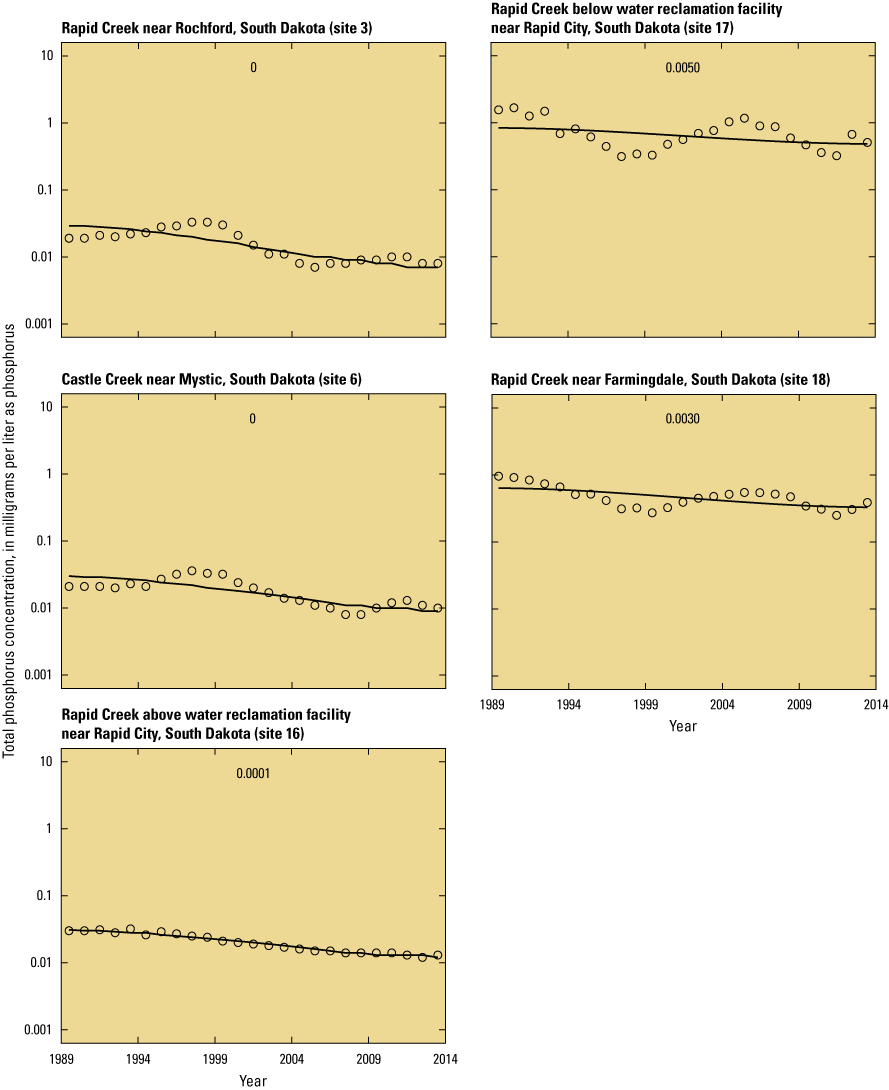
Fitted trends for total phosphorus in annual flow-averaged geometric mean concentration of total phosphorus at five sites with annual geometric mean concentrations in the Rapid Creek Basin for the trend period (1989–2019).
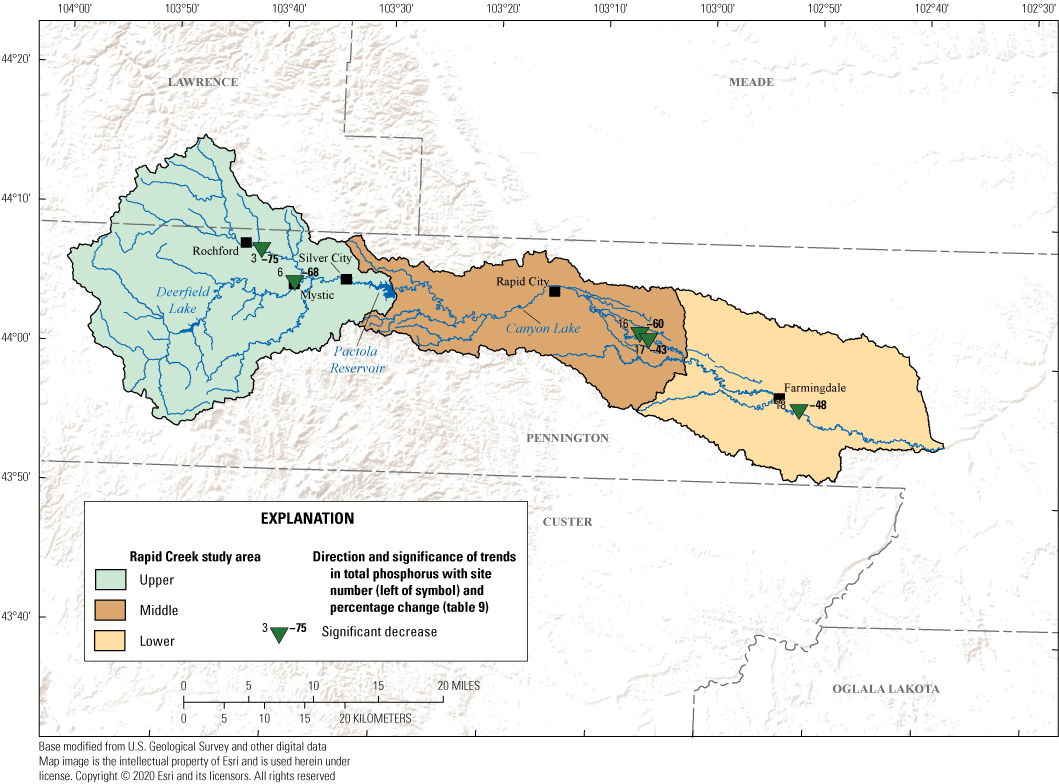
Direction and significance of trends in total phosphorus at 5 sites for each of the 3 periods analyzed for trends between 1989 and 2019 in the Rapid Creek Basin.
Table 9.
Summary of trend results for nutrients at selected sites in the Rapid Creek Basin between 1979 and 2019.[p-value, probability value; GMC, geometric mean concentration; WRF, water reclamation facility]
| Site location (fig. 1) | Rapid Creek Basin identifier | Site name | Trend model | Trend period | Step trend | p-value | Significance level | Annual flow-averaged GMC for first year in trend period | Annual flow-averaged GMC for last year in trend period | Change, in percent, from first to last yeara |
|---|---|---|---|---|---|---|---|---|---|---|
| 3 | Upper | Rapid Creek near Rochford, S. Dak. | One | 1989–2014 | No | 0 | Significant decrease | 0.03 | 0.01 | −75 |
| 6 | Upper | Castle Creek near Mystic, S. Dak. | One | 1989–2014 | No | 0 | Significant decrease | 0.03 | 0.01 | −68 |
| 16 | Middle | Rapid Creek above WRF near Rapid City, S. Dak. | One | 1989–2014 | No | 0.0001 | Significant decrease | 0.03 | 0.01 | −60 |
| 17 | Middle | Rapid Creek below WRF near Rapid City, S. Dak. | One | 1989–2014 | Yes | 0.0050 | Significant decrease | 0.84 | 0.49 | −43 |
| 18 | Lower | Rapid Creek near Farmingdale, S. Dak. | One | 1989–2014 | Yes | 0.0030 | Significant decrease | 0.62 | 0.32 | −48 |
| 17 | Middle | Rapid Creek below WRF near Rapid City, S. Dak. | One | 1999–2014 | No | 0.2926 | Nonsignificant increase | 0.42 | 0.46 | 8 |
| 18 | Lower | Rapid Creek near Farmingdale, S. Dak. | One | 1999–2014 | No | 0.0006 | Significant decrease | 0.28 | 0.17 | −40 |
| 17 | Middle | Rapid Creek below WRF near Rapid City, S. Dak. | One | 1999–2019 | No | 0.0005 | Significant decrease | 1.10 | 0.64 | −42 |
| 18 | Lower | Rapid Creek near Farmingdale, S. Dak. | One | 1999–2019 | No | 0 | Significant decrease | 1.09 | 0.64 | −41 |
Trends in dissolved phosphorus concentrations in the Rapid Creek Basin were analyzed at the two farthest downstream sites (17 and 18), and concentrations were unchanging or decreasing between 1999 and 2014 (figs. 20 and 21, table 9). Compared to total phosphorus, dissolved phosphorus concentrations at site 17 did not follow the same pattern. A nonsignificant increase in the dissolved phosphorus flow-averaged GMC indicated that different processes have affected the dissolved phosphorus flow-averaged GMC compared to total phosphorus. Total phosphorus will capture particulate phosphorus that can be transported with sediment, whereas dissolved phosphorus does not capture phosphorus in sediment, which could account for the differences. Site 18 had a significant decrease in the flow-averaged GMC of dissolved phosphorus and was like the trend in total phosphorus at this site (table 9). The annual GMC of dissolved phosphorus at site 17 had more flow-related variability compared to site 18, potentially because of WRF discharge, which could be a considerable part of the streamflow during periods of low flow conditions (fig. 20).
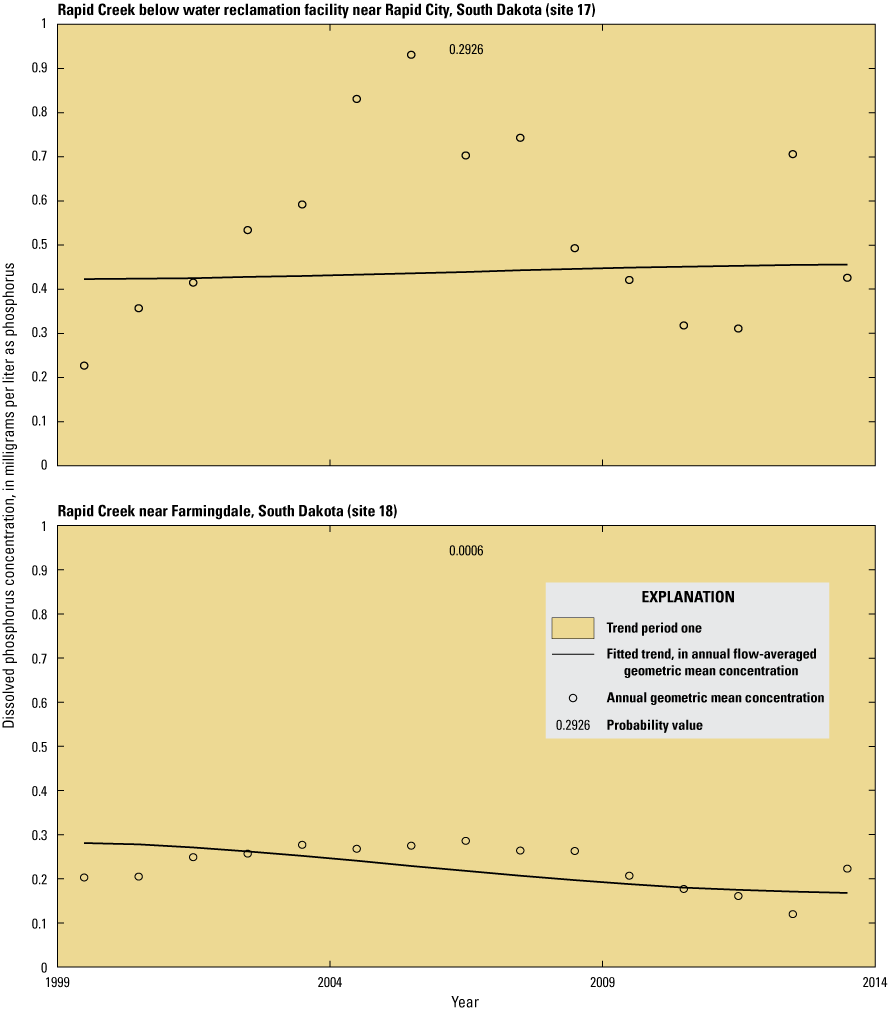
Fitted trends for dissolved phosphorus in annual flow-averaged geometric mean concentration of dissolved phosphorus at two sites with annual geometric mean concentrations in the Rapid Creek Basin for the trend period (1999–2014).
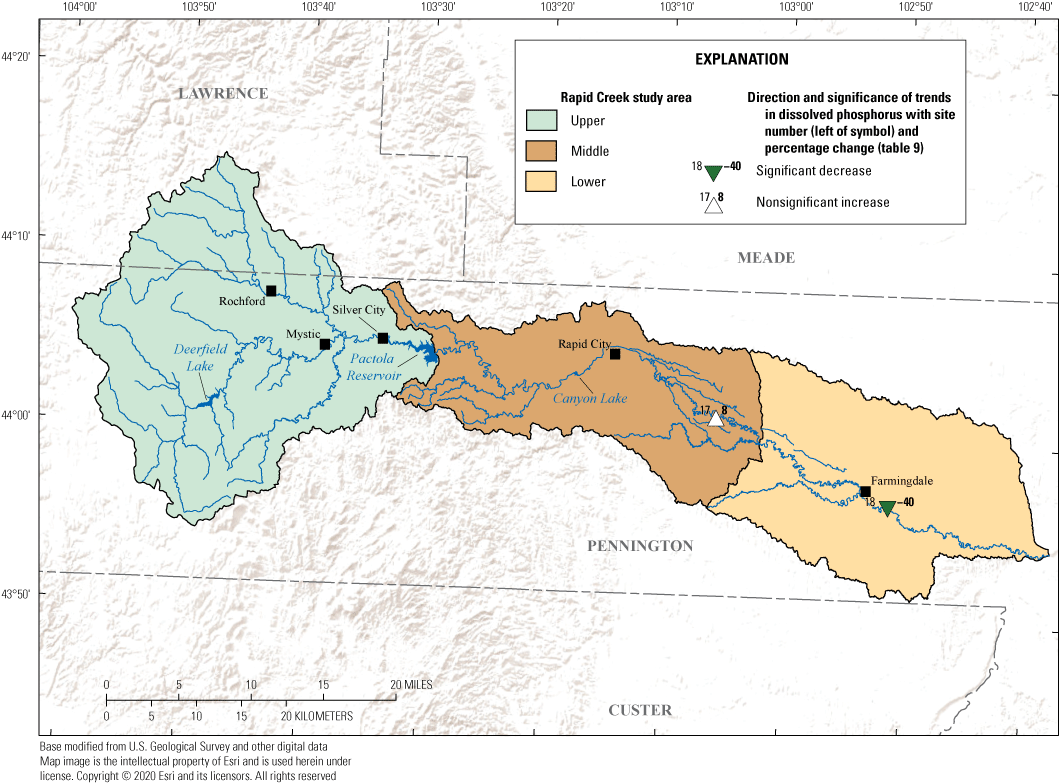
Direction and significance of trends in dissolved phosphorus at two sites for the period analyzed for trends between 1999 and 2014 in the Rapid Creek Basin.
Significant decreases in TKN concentrations were observed at both sites in the Rapid Creek Basin for the trend period of 1999–2019 (figs. 22 and 23, table 9). These trends in flow-averaged GMC of TKN follow a similar pattern observed in total and dissolved phosphorus. Sites 17 and 18 had similar decreases of 0.46 and 0.45 mg/L as nitrogen, respectively. The annual GMC of TKN at sites 17 and 18 indicate flow-related variability during the trend period with more variability in the early part of the trend period before 2009 and less in the later years of the trend period (fig. 22).
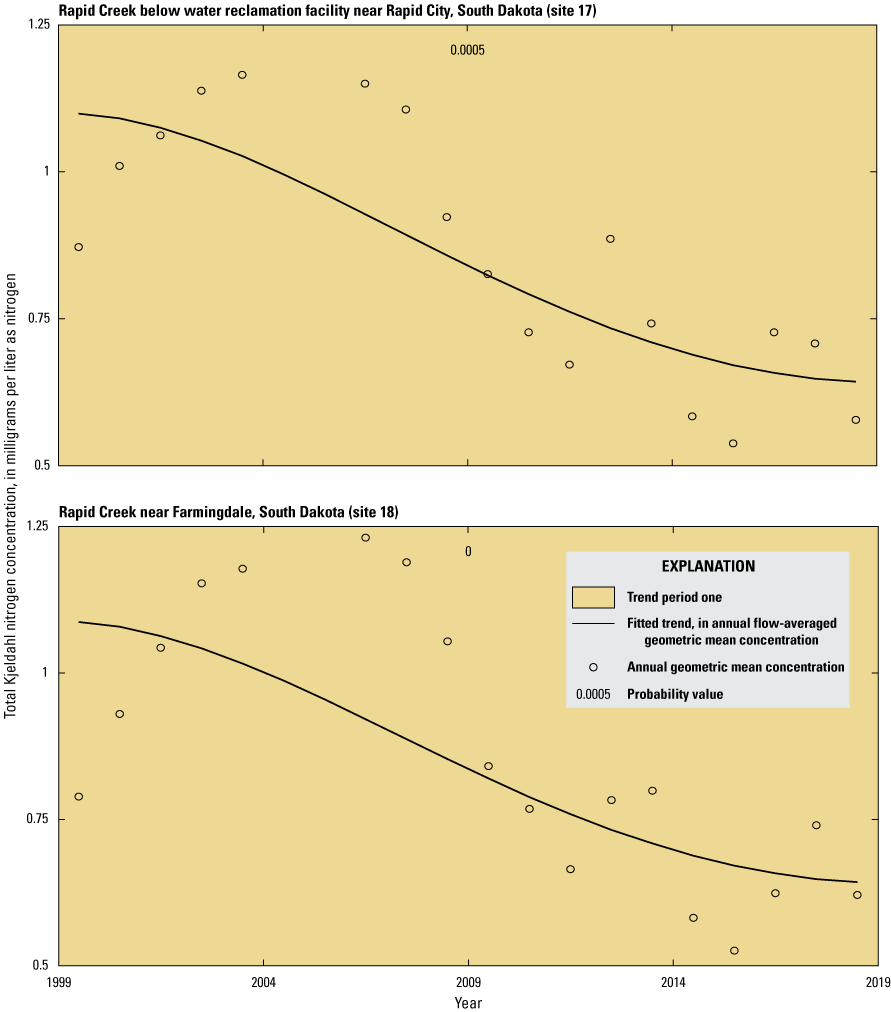
Fitted trends for total Kjeldahl nitrogen in annual flow-averaged geometric mean concentration of total Kjeldahl nitrogen at two sites with annual geometric mean concentrations in the Rapid Creek Basin for the trend period (1999–2019).
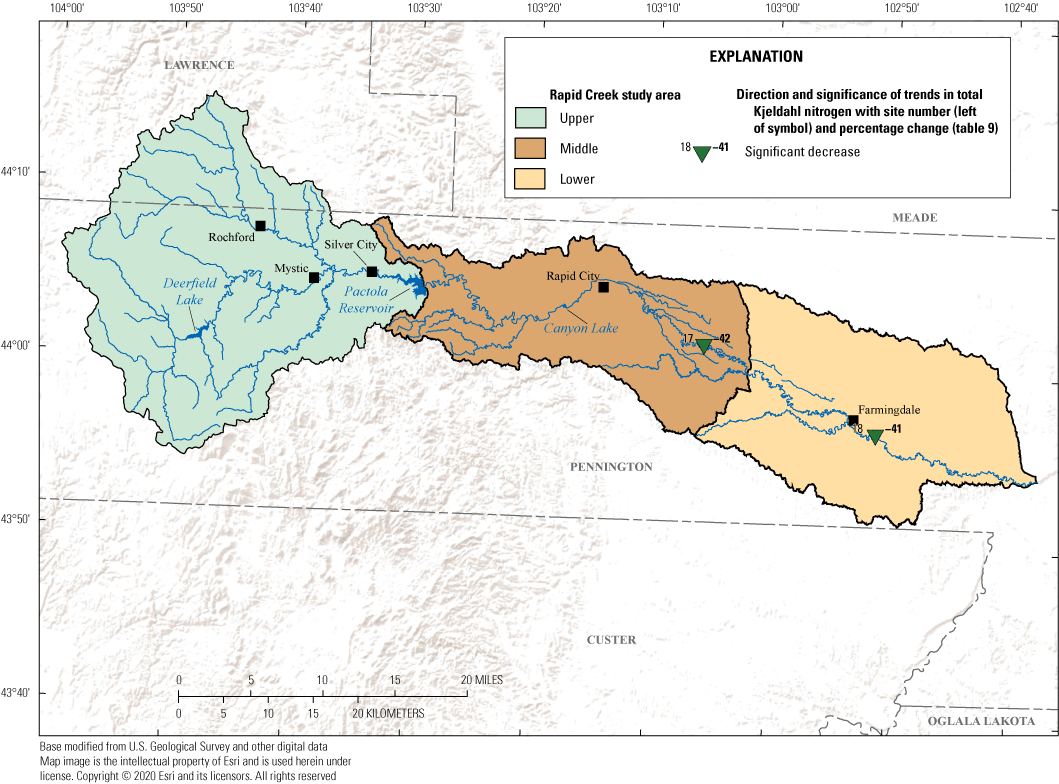
Direction and significance of trends in total Kjeldahl nitrogen at two sites for the period analyzed for trends between 1999 and 2019 in the Rapid Creek Basin.
Factors affecting nutrient concentrations included biological cycling by plants and microbes, livestock, stormwater runoff, and WRFs. No large-scale land-use changes or increase in livestock grazing land were observed between 1950 and 2010 (Cotillon, 2013), and the implementation of different conservation practices may have been a factor in the decreasing nutrient concentrations. Stormwater runoff from urban areas can negatively affect the nutrient concentrations, and the EPA regulations requiring the City of Rapid City to implement a stormwater management plan likely could have contributed to the decreasing nutrient concentrations (U.S. Environmental Protection Agency, 2000; City of Rapid City, 2009). Finally, continued improvements at the WRF over the 20- or 30-year trend periods have likely contributed to the decreasing trends observed in the nutrient concentrations (HDR, 2016).
Summary
A compilation of surface-water-quality data in the Rapid Creek Basin in South Dakota was completed to assess basic trends in the water quality of Rapid Creek. Spatial and temporal patterns in water quality were described for major ions, sediment, total suspended solids, nutrients, field measurements, bacteria, and select metals for the period of 1970–2020, and a water-quality trend analysis was completed for sites with enough data for selected constituents. Water-quality data at selected sites in the Rapid Creek Basin were obtained from the National Water Quality Monitoring Council Water Quality Portal for the period of 1970–2020, and available streamflow data for selected sites were obtained from the U.S. Geological Survey (USGS) National Water Information System database. Descriptive statistics were computed for all sites in the Rapid Creek Basin with at least 10 samples collected between 1970 and 2020 to describe the spatial variability of concentrations in the basin.
Generally, major ions had the highest median concentrations at sites in the lower basin (downstream from the city of Rapid City) compared to sites in the upper and middle basins. The highest median concentration of total dissolved solids (TDS) was 628 milligrams per liter (mg/L) at site 18 (Rapid Creek near Farmingdale), and the lowest median concentration was 187 mg/L at site 1 (North Fork Rapid Creek). Patterns in total suspended solids (TSS) are similar to major ions, where concentrations increase downstream and the highest concentrations are the farthest downstream. Median TSS concentrations upstream from Rapid City are less than 10 mg/L, and median concentrations increased to a maximum of 34 mg/L at site 18 downstream from Rapid City. For nutrients, median concentrations for all five constituents were generally low, and increased concentrations were only detected at the site downstream from the Rapid City Water Reclamation Facility (WRF) and farther downstream. For bacteria, Escherichia coli and fecal coliform concentrations were highest downstream from Rapid City, starting at site 15 (Rapid Creek below Hawthorn Ditch at Rapid City). Median Escherichia coli concentrations in the Rapid Creek Basin ranged from 4.7 most probable number per 100 milliliters (mpn/100 mL) at site 2 (Rhoads Fork near Rochford) to 173 mpn/100 mL at site 17 (Rapid Creek below the WRF near Rapid City). Four metals constituents were compiled; however, the understanding of metals conditions in the Rapid Creek Basin is limited by too few data across the basin.
Water-quality trends were analyzed for the trend period of 1979–2019. Trends were analyzed for TDS, specific conductance (SC), calcium, magnesium, TSS, dissolved phosphorus, total phosphorus, and total Kjeldahl nitrogen (TKN). A two- or three-period trend model was used for TDS, SC, and TSS analysis, and the analyses were broken into two or three monotonic trends using a combination of the early (1979–89), middle (1989–99), and late (1999–2019) periods. Concentrations for constituents are reported in the annual flow-averaged geometric mean concentration (GMC) as R–QWTREND removes the effects of streamflow on water-quality concentrations. Results for the trend analysis provide insight into temporal and spatial water-quality changes in the basin.
Trends in major ions and TDS concentrations in the Rapid Creek Basin were determined to be small (less than 15 percent) or mostly constant. Trends in TDS were evaluated at five sites with generally decreasing trends at sites upstream from Rapid City (sites 3, 6, and 11) and increasing trends at sites downstream from Rapid City (sites 17 and 18). Between 1979 and 2019, sites upstream from Rapid City had a decrease in the flow-averaged GMC of TDS and sites downstream from Rapid City had an increase in the flow-averaged GMC of TDS. The annual GMC for TDS indicates that TDS concentrations had less flow-related variability at sites 3, 6, and 11 in the upper part of the Rapid Creek Basin compared to sites 17 and 18, which had higher flow variability. Nonsignificant trends were detected for calcium and magnesium concentrations at selected sites in the Rapid Creek Basin between 1989 and 2019. Trends in SC values in the Rapid Creek Basin were mixed with alternating increasing and decreasing trends at many of the sites between 1979 and 2014. Upper basin trends in SC were mixed with trend direction alternating back and forth between periods. The six sites in the middle and lower basins evaluated for SC trends had generally increasing concentrations for the overall period and had differing trend directions among the three smaller periods. The annual GMC for SC follows the same general pattern as TDS, as expected, with flow-related variability less pronounced upstream and more evident downstream.
TSS concentrations were observed to be decreasing at the two sites analyzed for trends in the Rapid Creek Basin between 1979 and 2019. Step trends were used to correct for differences in data caused by nonenvironmental factors such as laboratory-analytical methods at the two sites analyzed in the basin. At site 17, samples analyzed using U.S. Environmental Protection Agency method 160.1 were determined to be biased high by about 35 percent, and a step trend was applied to account for the laboratory differences. At site 18, TSS results from South Dakota Department of Agriculture and Natural Resources that were identified as suspended were determined to be biased high by about 25 percent compared to TSS results from USGS and South Dakota Department of Agriculture and Natural Resources identified as not applicable (NA), and a significant step trend was applied. Trends in TSS concentrations were generally observed to be decreasing at the two sites between 1979 and 2019. Site 17 had significant decreases in flow-averaged GMC for TSS in the middle and late periods compared to site 18, which only had a significant decrease in the late period and had a nonsignificant increase in the middle period. The annual GMC seems to have more flow-related variability at site 18 compared to site 17. Site 17 likely has less flow-related variability because of the WRF discharge, which likely accounts for a substantial amount of the flow in this part of Rapid Creek during low flows. The decreases in TSS concentrations in the Rapid Creek Basin could be related to several processes such as the implementation of a stormwater management plan in Rapid City, improvements to the Rapid City WRF, and residual effects of the overall climatic regime.
Total phosphorus, dissolved phosphorus, and TKN were analyzed for trends in the Rapid Creek Basin. Trends in total phosphorus were observed to be significantly decreasing at all sites between 1989 and 2014. To account for the improvements to the WRF, two interval-based step trends in 1992 and 2003 were tested at sites 17 and 18. Both step trends indicated a significant decrease in total phosphorus when tested without a monotonic trend; however, when the monotonic trend was added, the step trends were smaller and nonsignificant but still indicated decreasing concentrations. Given that these are known improvements, the interval-based step trends were included in the final models, and although the magnitude of the decrease cannot be reliably determined, the analysis indicates that WRF improvements in 1992 and 2003 resulted in decreased total phosphorus concentrations at downstream sites. Each site had a significant decrease in total phosphorus concentrations ranging from 43- to 75-percent reductions. The large magnitude of the reductions is mainly due to small changes in the low nutrient concentrations in the Rapid Creek Basin. Each of the three sites upstream from the Rapid City WRF had low flow-averaged GMCs that decreased from about 0.03 to 0.01 mg/L. Trends in dissolved phosphorus concentrations in the Rapid Creek Basin were analyzed at the two farthest downstream sites (17 and 18), and concentrations were unchanging or decreasing between 1999 and 2014. Significant decreasing trends in TKN were observed at two sites in the lower Rapid Creek Basin for the trend period of 1999–2019. Both sites had similar decreases of 0.46 and 0.45 mg/L as nitrogen, respectively. Factors affecting nutrient concentrations included biological cycling by plants and microbes, livestock, stormwater runoff, and WRFs. Continued improvements at the WRF over the 20- or 30-year trend periods have likely contributed to the decreasing trends observed in the nutrient concentrations.
References Cited
Anderson, M.T., Driscoll, D.G., and Williamson, J.E., 1999, Ground-water and surface-water interactions along Rapid Creek near Rapid City, South Dakota: U.S. Geological Survey Water-Resources Investigations Report 98–4214, 99 p. [Also available at https://doi.org/10.3133/wri984214.]
Bayley, R.W., 1972, A preliminary report on the geology and gold deposits of the Rochford District, Black Hills, South Dakota: U.S. Geological Survey Bulletin 1332–A, 24 p. plus 4 plates. [Also available at https://doi.org/10.3133/b1332A.]
Bureau of Reclamation, 2021, Welcome to the HYDROMET data system: Bureau of Reclamation web page, accessed July 5, 2021, at https://www.usbr.gov/gp/hydromet/.
Carlson, C.G., Clay, D.E., Malo, D., Chang, J., Reese, C., Kerns, R., Kharel, T., Birru, G., and DeSutter, T., 2015, The management and identification of saline and sodic soils in the Northern Great Plains, chap. 32 of Clay, D.E., Carlson, C.G., Clay, S.A., and Byamukama, E., eds., iGrow Corn—Best management practices: Brookings, S. Dak., South Dakota State University, [variously paged]. [Also available at https://extension.sdstate.edu/sites/default/files/2019-09/S-0003-32-Corn.pdf.]
Carter, J.M., Driscoll, D.G., Williamson, J.E., and Lindquist, V.A., 2002, Atlas of water resources in the Black Hills area, South Dakota: U.S. Geological Survey Hydrologic Investigations Atlas HA–747, 120 p. [Also available at https://doi.org/10.3133/ha747.]
City of Rapid City, 2009, City of Rapid City stormwater quality manual: Rapid City, S. Dak., City of Rapid City, [variously paged], accessed October 1, 2021, at https://www.rcgov.org/departments/public-works/stormwater-division.html.
Cotillon, S., 2013, Impacts of land cover changes on ecosystem services delivery in the Black Hills ecoregion from 1950 to 2010: Brookings, S. Dak., South Dakota State University, master’s thesis, 163 p. [Also available at https://openprairie.sdstate.edu/etd/1145.]
Dewitz, J., and U.S. Geological Survey, 2021, National Land Cover Database (NLCD) 2019 products (ver. 2.0, June 2021): U.S. Geological Survey data release, accessed October 22, 2021, at https://doi.org/10.5066/P9KZCM54.
Driscoll, D.G., Carter, J.M., Williamson, J.E., and Putnam, L., 2002, Hydrology of the Black Hills area, South Dakota: U.S. Geological Survey Water-Resources Investigations Report 2002–4094, 150 p. [Also available at https://doi.org/10.3133/wri024094.]
Foreman, W.T., Williams, T.L., Furlong, E.T., Hemmerle, D.M., Stetson, S.J., Jha, V.K., Noriega, M.C., Decess, J.A., Reed-Parker, C., and Sandstrom, M.W., 2021, Comparison of detection limits estimated using single- and multi-concentration spike-based and blank-based procedures: Talanta, v. 228, art. 122139, 15 p., accessed February 24, 2022, at https://doi.org/10.1016/j.talanta.2021.122139.
Granato, G.E., DeSimone, L.A., Barbaro, J.R., and Jeznach, L.C., 2015, Methods for evaluating potential sources of chloride in surface waters and groundwaters of the conterminous United States: U.S. Geological Survey Open-File Report 2015–1080, 89 p., accessed February 24, 2022, at https://doi.org/10.3133/ofr20151080.
Gray, J.R., Glysson, G.D., Turcios, L.M., and Schwarz, G.E., 2000, Comparability of suspended-sediment concentration and total suspended solids data: U.S. Geological Survey Water-Resources Investigations Report 2000–4191, 14 p. [Also available at https://doi.org/10.3133/wri004191.]
HDR, 2016, Facility plan—Water Reclamation Facility: Rapid City, S. Dak., Rapid City Department of Public Works & Water Reclamation Facility, prepared by HDR, HDR project no. 222360, 369 p., accessed December 2021 at https://www.rcgov.org/index.php?option=com_docman&view=download&alias=3028-rapid-city-wrf-facility-plan-021616&category_slug=water-reclamation-divisio n&Itemid=149.
Helsel, D.R., Hirsch, R.M., Ryberg, K.R., Archfield, S.A., and Gilroy, E.J., 2020, Statistical methods in water resources: U.S. Geological Survey Techniques and Methods, book 4, chap. A3, 458 p. [Also available at https://doi.org/10.3133/tm4A3.] [Supersedes USGS Techniques of Water-Resources Investigations, book 4, chap. A3, version 1.1.]
Hem, J.D., 1985, Study and interpretation of the chemical characteristics of natural water (3rd ed.): U.S. Geological Survey Water-Supply Paper 2254, 263 p. [Also available at https://doi.org/10.3133/wsp2254.]
Hoffman, G.L., Fishman, M.J., and Garbarino, J.R., 1996, Methods of analysis by the U.S. Geological Survey National Water Quality Laboratory—In-bottle acid digestion of whole-water samples: U.S. Geological Survey Open-File Report 96–225, 28 p. [Also available at https://doi.org/10.3133/ofr96225.]
Homer, C.G., Dewitz, J.A., Yang, L., Jin, S., Danielson, P., Xian, G., Coulston, J., Herold, N.D., Wickham, J.D., and Megown, K., 2015, Completion of the 2011 National Land Cover Database for the conterminous United States—Representing a decade of land cover change information: Photogrammetric Engineering and Remote Sensing, v. 81, no. 5, p. 345–354, accessed August 2021 at https://www.ingentaconnect.com/content/asprs/pers/2015/00000081/00000005/art00002.
Homer, C.G., Huang, C., Yang, L., Wylie, B.K., and Coan, M.J., 2004, Development of a 2001 National Land Cover Database for the United States: Photogrammetric Engineering and Remote Sensing, v. 70, no. 7, p. 829–840. [Also available at https://doi.org/10.14358/PERS.70.7.829.]
Hoogestraat, G.K., 2015, Water-quality characteristics of stormwater runoff in Rapid City, South Dakota, 2008–14: U.S. Geological Survey Scientific Investigations Report 2015–5069, 27 p., accessed February 24, 2022, at https://doi.org/10.3133/sir20155069.
Hoogestraat, G.K., 2020, Stormwater quality of infrastructure elements in Rapid City, South Dakota, 2016–18: U.S. Geological Survey Scientific Investigations Report 2020–5004, 24 p., accessed February 24, 2022, at https://doi.org/10.3133/sir20205004.
Hortness, J.E., and Driscoll, D.G., 1998, Streamflow losses in the Black Hills of western South Dakota: U.S. Geological Survey Water-Resources Investigations Report 98–4116, 99 p. [Also available at https://doi.org/10.3133/wri984116.]
Kenner, S., and Smith, R., 2010, Fecal coliform bacteria total maximum daily load (TMDL) for Lower Rapid Creek, Pennington County, South Dakota: South Dakota Department of Agriculture & National Resources digital data, accessed December 3, 2021, at https://danr.sd.gov/Conservation/WatershedProtection/TMDL/docs/TableDocs/tmdl_rapidcreeklowerfecal.pdf.
Martin, J.E., Sawyer, J.F., Fahrenbach, M.D., Tomhave, D.W., and Schulz, L.D., 2004, Geologic map of South Dakota: South Dakota Geological Survey, Department of Environment and Natural Resources, 1 sheet. [Also available at http://www.sdgs.usd.edu/pubs/pdf/G-10.pdf.]
National Water Quality Monitoring Council, 2022, Water Quality Portal: National Water Quality Monitoring Council web page, accessed July 5, 2022, at https://www.waterqualitydata.us.
Nustad, R.A., and Vecchia, A.V., 2020, Water-quality trends for selected sites and constituents in the international Red River of the North Basin, Minnesota and North Dakota, United States, and Manitoba, Canada, 1970–2017: U.S. Geological Survey Scientific Investigations Report 2020–5079, 75 p., accessed February 24, 2022, at https://doi.org/10.3133/sir20205079.
Putnam, L.D., Hoogestraat, G.K., and Sawyer, J.F., 2008, Water-quality effects and characterization of indicators of onsite wastewater disposal systems in the east-central Black Hills area, South Dakota, 2006–08: U.S. Geological Survey Scientific Investigations Report 2008–5232, 115 p. [Also available at https://doi.org/10.3133/sir20085232.]
Redden, J.A., and DeWitt, E., 2008, Maps showing geology, structure, and geophysics of the central Black Hills, South Dakota: U.S. Geological Survey Scientific Investigations Map 2777, 44-p. pamphlet, 2 sheets. [Also available at https://doi.org/10.3133/sim2777.]
Schultz, L.G., Tourtelot, H.A., Gill, J.R., and Boerngen, J.G., 1980, Composition and properties of the Pierre Shale and equivalent rocks, northern Great Plains region: U.S. Geological Survey Professional Paper 1064–B, 114 p. [Also available at https://doi.org/10.3133/pp1064B.]
South Dakota Department of Agriculture and Natural Resources, 2021, Water quality standards in South Dakota: South Dakota Department of Agriculture and Natural Resources web page, accessed December 3, 2021, at https://danr.sd.gov/OfficeOfWater/SurfaceWaterQuality/waterqualitystandards/default.aspx.
South Dakota Department of Agriculture and Natural Resources, 2022, Water Quality Monitoring Network: South Dakota Department of Agriculture and Natural Resources web page, accessed January 2022 at https://danr.sd.gov/OfficeOfWater/SurfaceWaterQuality/waterqualitystandards/swqmonitoring.aspx.
Tatge, W.S., Nustad, R.A., and Galloway, J.M., 2022a, Evaluation of salinity and nutrient conditions in the Heart River Basin, North Dakota, 1970–2020: U.S. Geological Survey Scientific Investigations Report 2022–5013, 76 p., accessed May 5, 2022, at https://doi.org/10.3133/sir20225013.
Tatge, W.S., Nustad, R.A., and Hoogestraat, G.K., 2022b, Model scripts and water-quality data for trends in the Rapid Creek Basin, South Dakota, 1970–2020: U.S. Geological Survey data release, https://doi.org/10.5066/P9D8BSXR.
U.S. Census Bureau, 2021, Decennial census of population and housing by decades: U.S. Census Bureau web page, accessed July 5, 2021, at https://www.census.gov/programs-surveys/decennial-census/decade.html.
U.S. Environmental Protection Agency, 2000, Stormwater Phase II final rule—Small MS4 stormwater program overview: U.S. Environmental Protection Agency Fact Sheet 2.0, 3 p., accessed December 2021 at https://www.epa.gov/sites/default/files/2015-11/documents/fact2-0.pdf.
U.S. Environmental Protection Agency, 2022, Recreational water quality criteria and methods: U.S. Environmental Protection Agency web page, accessed April 2022 at https://www.epa.gov/wqc/recreational-water-quality-criteria-and-methods.
U.S. Geological Survey, 2022, USGS water data for the Nation: U.S. Geological Survey National Water Information System database, accessed July 31, 2022, at https://doi.org/10.5066/F7P55KJN.
Vecchia, A.V., 2000, Water-Quality Trend Analysis and Sampling Design for the Souris River, Saskatchewan, North Dakota, and Manitoba,: Water Resources Investigation 00-4019, 81 p. [Also available at https://doi.org/10.3133/wri004019.]
Vecchia, A.V., 2003, Water-quality trend analysis and sampling design for streams in North Dakota 1971–2000: U.S. Geological Survey Water-Resources Investigations Report 2003–4094, 73 p. [Also available at https://doi.org/10.3133/wri034094.]
Vecchia, A.V., 2005, Water-quality trend analysis and sampling design for streams in the Red River of the North Basin, Minnesota, North Dakota, and South Dakota, 1970–2001: U.S. Geological Survey Scientific Investigations Report 2005–5224, 54 p. [Also available at https://doi.org/10.3133/sir20055224.]
Vecchia, A.V., and Nustad, R.A., 2020, Time-series model, statistical methods, and software documentation for R–QWTREND––An R package for analyzing trends in stream-water quality: U.S. Geological Survey Open-File Report 2020–1014, 51 p. [Also available at https://doi.org/10.3133/ofr20201014.]
Williamson, J.E., and Carter, J.M., 2001, Water-quality characteristics in the Black Hills area, South Dakota: U.S. Geological Survey Water-Resources Investigations Report 2001–4194, 196 p. [Also available at https://doi.org/10.3133/wri20014194.]
Woodard, R., 2006, GF&P empties fish hatchery: Rapid City Journal, September 8, 2006, accessed January 21, 2022, at https://rapidcityjournal.com/news/local/gf-p-empties-fish-hatchery/article_b1095fe4-3e65-5390-a59a-b7af70b51081.html.
Conversion Factors
Datum
Vertical coordinate information is referenced to the North American Vertical Datum of 1988 (NAVD 88).
Horizontal coordinate information is referenced to North American Datum of 1983 (NAD 83).
Elevation, as used in this report, refers to distance above the vertical datum.
Supplemental Information
Specific conductance is given in microsiemens per centimeter at 25 degrees Celsius (µS/cm at 25 °C).
Concentrations of chemical constituents in water are given in either milligrams per liter (mg/L) or micrograms per liter (µg/L).
Bacteria are given in either colony forming units per 100 milliliters (cfu/100 mL) or most probable number per 100 milliliters (mpn/100 mL).
A water year is the period from October 1 to September 30 and is designated by the year in which it ends; for example, water year 2020 was from October 1, 2019, to September 30, 2020.
Abbreviations
E. coli
Escherichia coli
EPA
U.S. Environmental Protection Agency
GMC
geometric mean concentration
NWIS
National Water Information System
p
probability
SC
specific conductance
SD DANR
South Dakota Department of Agriculture and Natural Resources
SSC
suspended sediment concentration
TDS
total dissolved solids
TKN
total Kjeldahl nitrogen
TSS
total suspended solids
USGS
U.S. Geological Survey
WQP
Water Quality Portal
WRF
water reclamation facility
For more information about this publication, contact:
Director, USGS Dakota Water Science Center
821 East Interstate Avenue, Bismarck, ND 58503
1608 Mountain View Road, Rapid City, SD 57702
605–394–3200
For additional information, visit: https://www.usgs.gov/centers/dakota-water
Publishing support provided by the
Rolla Publishing Service Center
Disclaimers
Any use of trade, firm, or product names is for descriptive purposes only and does not imply endorsement by the U.S. Government.
Although this information product, for the most part, is in the public domain, it also may contain copyrighted materials as noted in the text. Permission to reproduce copyrighted items must be secured from the copyright owner.
Suggested Citation
Tatge, W.S., Hoogestraat, G.K., and Nustad, R.A., 2022, Water-quality data and trends in the Rapid Creek Basin, South Dakota, 1970–2020: U.S. Geological Survey Scientific Investigations Report 2022–5086, 67 p., https://doi.org/10.3133/sir20225086.
ISSN: 2328-0328 (online)
Study Area
| Publication type | Report |
|---|---|
| Publication Subtype | USGS Numbered Series |
| Title | Water-quality data and trends in the Rapid Creek Basin, South Dakota, 1970–2020 |
| Series title | Scientific Investigations Report |
| Series number | 2022-5086 |
| DOI | 10.3133/sir20225086 |
| Publication Date | August 22, 2022 |
| Year Published | 2022 |
| Language | English |
| Publisher | U.S. Geological Survey |
| Publisher location | Reston, VA |
| Contributing office(s) | Dakota Water Science Center |
| Description | Report: viii, 67 p.; Data Release; Dataset |
| Country | United States |
| State | South Dakota |
| Other Geospatial | Rapid Creek Basin |
| Online Only (Y/N) | Y |