

Verification of Irrigated Agricultural Land Acreage in 55 Counties in Florida, 2013–21
Links
- Document: Report (590 KB pdf) , HTML , XML
- Data Releases:
- USGS data release - GIS data and tables pertaining to the agricultural irrigated land-use inventory for Escambia, Santa Rosa, and Okaloosa Counties in Florida, 2016
- USGS data release - GIS data and tables associated with irrigated agricultural land use survey in Polk County, Florida, 2016
- USGS data release - GIS shapefile and related summary data describing irrigated agricultural land use in Collier County, Florida for the 2017 growing season
- USGS data release - GIS shapefile and related summary data describing irrigated agricultural land use in Glades County, Florida for the 2017 growing season
- USGS data release - GIS shapefile and related summary data describing irrigated agricultural land use in Highlands County, Florida for the 2017 growing season
- USGS data release - GIS shapefile and related summary data describing irrigated agricultural land use in Martin County, Florida for the 2017 growing season
- USGS data release - GIS shapefile and related summary data describing irrigated agricultural land use in Okeechobee County, Florida for the 2017 growing season
- USGS data release - GIS shapefile and related summary data describing irrigated agricultural land use in St Lucie County, Florida for the 2017 growing season
- USGS data release - GIS shapefile and related summary data describing irrigated agricultural land use in Charlotte County, Florida for the 2018 growing season
- USGS data release - GIS shapefile and related summary data describing irrigated agricultural land use in DeSoto County, Florida for the 2018 growing season
- USGS data release - GIS shapefile and related summary data describing irrigated agricultural land use in Hardee County, Florida for the 2018 growing season
- USGS data release - GIS shapefile and related summary data describing irrigated agricultural land use in Hillsborough County, Florida for the 2018 growing season
- USGS data release - GIS shapefile and related summary data describing irrigated agricultural land use in Lee County, Florida for the 2018 growing season
- USGS data release - GIS shapefile and related summary data describing irrigated agricultural land use in Manatee County, Florida for the 2018 growing season
- USGS data release - GIS shapefile and related summary data describing irrigated agricultural land use in Sarasota County, Florida for the 2018 growing season
- USGS data release - GIS shapefile and related summary data describing irrigated agricultural land-use in Citrus, Hernando, Pasco, and Sumter Counties, Florida for 2019
- USGS data release - GIS shapefile and related summary data describing irrigated agricultural land-use in Hendry and Palm Beach Counties, Florida for 2019
- USGS data release - GIS shapefile and related summary data describing irrigated agricultural land-use in Broward and Miami-Dade Counties, Florida for 2019–2021
- USGS data release - GIS shapefile and related summary data describing irrigated agricultural land use for Lake, Marion, and Orange Counties, Florida for 2020
- USGS data release - GIS shapefile and related summary data describing irrigated agricultural land use for the 15 counties entirely within the Northwest Florida Water Management District, Florida, 2021
- USGS data release - GIS shapefile and related summary data describing irrigated agricultural land use for the 14 counties fully or partially within the Suwannee River Water Management District Florida for 2020
- Download citation as: RIS | Dublin Core
Acknowledgments
The authors gratefully acknowledge the Florida Department of Agriculture and Consumer Services (FDACS), for participation and cooperation in this agricultural irrigation land-use project. The authors especially thank Yesenia Escribano, Angela Chelette, Kyle Ferris, and Bonnie Wolff Pelaez from the FDACS, Office of Agricultural Water Policy, and Matthew Albritton and Alicia Lawrence from the FDACS, Division of Plant Industry, along with many FDACS field personnel who helped identify the fields that could not be accessed during site visits. A special appreciation is extended to Daniel Dourte of The Balmoral Group for his assistance with identifying crops and reviewing field maps. In addition, appreciation is extended to the staff members of the Northwest Florida, South Florida, Southwest Florida, and the Suwannee River Water Management Districts for permit assistance and field guidance and the St. Johns River Water Management District for assistance with the geographic information system application.
Abstract
In 2012, the Florida Legislature mandated that the Florida Department of Agriculture and Consumer Services (FDACS), Office of Agricultural Water Policy, promote an agricultural water-conservation program that would include a cost-share program and best management practices and that would aid the five water management districts in the development of consistent agricultural water-supply planning, assisting the districts in projecting future agricultural water needs and promoting consistency in water-use estimates among the districts. Beginning in 2013, the FDACS created a series of agriculture and irrigated land-use maps for all Florida counties for the purpose of estimating current and forecasting future water demands. These maps, produced and updated periodically by The Balmoral Group, were based on baseline data from 2010 and have been updated with a combination of satellite images and land-use data from water management districts in subsequent years (2013–21) to help create a statewide database of irrigated agricultural lands. The purpose of this multiyear cooperative study between the U.S. Geological Survey and the FDACS is to provide (1) a detailed geospatial database of verified irrigated field locations with selected attributes as ArcGIS shapefiles and (2) aggregated acreage totals by crop type for all or parts of 55 of the 67 counties within Florida. Ten of the remaining 12 counties were fully mapped by the St. John’s River Water Management District in 2015; the other 2 counties were not mapped because they contained very little irrigated agricultural land. Irrigated agricultural fields identified on The Balmoral Group baseline maps for each of the 55 counties were either physically observed by U.S. Geological Survey or were verified through water management district’s consumptive water-use permit database. A select group of counties were chosen to be field verified each year, concluding with a total of 55 counties in Florida field verified between October 2013 and August 2021. The results provided from this multiyear study can help increase the accuracy of irrigation water-use estimates for counties in Florida.
Introduction
The agricultural sector in Florida depends heavily on the State’s water resources for irrigation. Between 1975 and 2010, withdrawals of freshwater for agricultural irrigation were the largest component of Florida’s water use (fig. 1). In 2015, freshwater withdrawals for public supply exceeded withdrawals for agricultural irrigation; estimated water withdrawals for agricultural irrigation in 2015 totaled 2,089 million gallons per day and accounted for 37 percent of the total freshwater withdrawals in Florida (Marella, 2020). The agriculture sector of Florida’s economy is expected to remain a substantial water user because the State’s subtropical climate fosters the cultivation and growth of multiple crops year-round and because of the demand for locally produced food for the State’s growing population (Mulkey and Clouser, 1990).
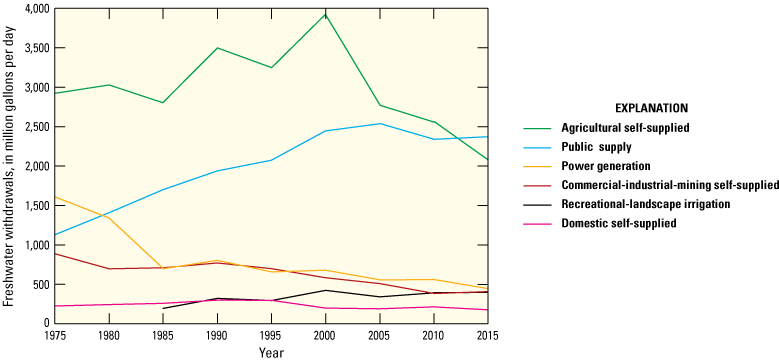
Historical freshwater withdrawals in Florida by selected water-use category, 1975–2015 (Marella, 2020).
Even though many agricultural irrigation users across Florida meter, record, and report their water usage to local water management districts (WMDs), this practice is not comprehensive statewide; therefore, most of the published statewide irrigation withdrawals are estimated. Estimates of water withdrawals for agricultural irrigation in most counties throughout Florida are computed as the irrigated acreage for individual crops multiplied by a crop-specific irrigation-requirement coefficient. The application rate is a calculated value commonly used to estimate the amount of water that must be applied to offset the evapotranspiration losses relative to rainfall required for optimum crop growth (Smajstrla and Zazueta, 1995) and usually includes the water needed to overcome irrigation system inefficiencies and system losses (U.S. Department of Agriculture, Soil Conservation Service, 1970, 1982). In many cases, the reported metered withdrawal volumes obtained from submitted irrigation pumpage records are used to help validate or modify the application rates calculated from various models used by the WMDs. The calculated application rates are multiplied by the acreage of selected irrigated crops to obtain the estimated volume of water used for irrigation by county. The acreage of irrigated crops is estimated from multiple data sources by each of the WMDs.
Several agencies, the U.S. Department of Agriculture (USDA), the Florida Department of Agriculture and Consumer Services (FDACS), and Florida Agricultural Statistics Service, compile acreage data for selected crops by county, which are often used by the WMDs to estimate agricultural irrigation-water withdrawals. Although crop-acreage data sources are consistent within each agency, they have limitations when being used to calculate water withdrawals. Some of these limitations are (1) data have temporal gaps, (2) county totals are missing or unavailable primarily because of privacy restrictions on published data at the county level, (3) irrigated and nonirrigated acreages are not differentiated for many listed crops, (4) information on growing multiple crops per field per year is often not available, (5) information on the irrigation systems used is not provided when reporting irrigated acreage totals, and (6) water source used for irrigation is not provided. The number of permitted acres is often incomplete, outdated, or inconsistent because permit information is only updated periodically; also, sometimes, the entire acreage of the permit is reported, not just the irrigated portion of the permit. In addition, these data sources do not provide spatial distribution of irrigated fields throughout individual counties.
Background
In 1998, the Northwest Florida Water Management District (NWFWMD), St. Johns River Water Management District (SJRWMD), South Florida Water Management District (SFWMD), Southwest Florida Water Management District (SWFWMD), and Suwannee River Water Management District (SRWMD) were tasked with preparing a detailed regional water-supply plan for areas or counties within their jurisdictions to determine whether existing sources of water were adequate for current and future water needs and supplies (Florida Department of Environmental Protection, 2013). Water needs and supplies were categorized as public supply, domestic self-supplied/small public supply, commercial/industrial/mining/institutional self-supplied, power generation, agricultural irrigation, and recreational irrigation (including golf courses). The primary objective of these water-supply plans was to project future water demands by water-use category and develop alternative water supplies to help meet the projected demands.
In 2012, the Florida Legislature mandated that the FDACS, Office of Agricultural Water Policy (OAWP), promote an agricultural water-conservation program that would include a cost-share program and best management practices and that would aid the WMDs in the development of consistent agricultural water-supply planning (Florida Senate, 2012). This OAWP program included assisting the WMDs in projecting future agricultural water needs by promoting consistency among the WMDs through development of improved and validated estimates of acreage of irrigated agricultural land and irrigation application rates. Under the direction of the OAWP, The Balmoral Group (https://www.balmoralgroup.us/) created a methodology and developed data sources which were used to produce a crop-specific and spatially distributed irrigation water-demand model to determine current and future water needs (The Balmoral Group, 2015).
Beginning in 2013, the FDACS created a series of agriculture and irrigated land-use maps for all Florida counties for the purpose of estimating current and forecasting future water demands. These maps, produced and updated periodically by The Balmoral Group, started with baseline data from 2010 (The Balmoral Group, 2015). The Balmoral Group used a combination of satellite images and current WMD land-use layers to create a statewide agriculture and irrigated land-use database, which includes the locations of irrigated fields and acreage totals by crop type.
Purpose and Scope
The purpose of this multiyear cooperative study between the U.S. Geological Survey (USGS) and the FDACS, OAWP, is to provide detailed geospatial data (ArcGIS shapefiles) and associated summary tables of irrigated agricultural field location and size, crop type, and irrigation information for agricultural fields for 55 selected counties. Data were field verified at various times for each county within Florida between October 2013 and August 2021. The maps and summary tables produced by this study can be used to validate the acreage totals reported in the Florida Statewide Agricultural Irrigation Demand (FSAID) Irrigated Lands Geodatabase (ILG) (https://www.fdacs.gov/Agriculture-Industry/Water/Agricultural-Water-Supply-Planning) produced by The Balmoral Group (The Balmoral Group, 2021). Fields identified as irrigated on the FSAID maps were verified by the USGS through either a field visit (or multiple visits) or through a review of the information provided within the WMD’s consumptive water-use permit (CUP). Such verification provides the FDACS an improved level of accuracy for estimating irrigated crop acreage and subsequent calculations of water demands. From the results of the USGS-verified maps, adjustments to the ILG will be made by The Balmoral Group for each county to assist the FDACS with updates to the next set of water-demand projections. This study focuses on verifying irrigated acreage by crop type and field location and does not quantify water-application rates or provide estimates of water use.
This report describes the methods and data sources used by the USGS to map, verify, and tabulate irrigated agricultural land acreage in selected counties within Florida between October 2013 and August 2021 (table 1; fig. 2). Osceola County (Marella and Dixon, 2014) was the first county to be verified and mapped through this cooperative study which detailed the crops irrigated within the county between October 2013 and April 2014. This was followed by field mapping and verification for 54 other counties (Marella and Dixon, 2015; Marella, Dixon, and Berry, 2016, 2017; Marella, Berry, and Dixon, 2017a, 2017b; Marella, Dixon, and Reich, 2018a, 2018b, 2018c, 2018d, 2018e, 2018f, 2019a, 2019b, 2019c, 2019d, 2019e, 2019f, 2019g; Marella, Dixon, and Christesson, 2020a, 2020b, 2021, 2022; Dixon and Christesson, 2022; Marella, Dixon, Christesson, and Pazmiño-Hernandez, 2022). In addition, all of Brevard, Clay, Duval, Flagler, Indian River, Nassau, Putnam, St. Johns, Seminole, and Volusia Counties and parts of Alachua, Baker, Lake, Marion, Okeechobee, Orange, and Osceola Counties were mapped and verified by the SJRWMD in 2015 ([2015 Agricultural Crop and Irrigation Survey], SJRWMD, unpublished data, 2016). At the time of publication, data were available by request from SJRWMD. Agricultural irrigation land use in all or parts of 65 of the 67 counties in Florida have been mapped and verified by either USGS or SJRWMD between 2013 and 2021 (fig. 2; table 1) with several of the counties being mapped and verified twice during this period. Only Monroe and Pinellas Counties were not verified during this 8-year period.
Table 1.
Verification of irrigated agricultural land for 65 counties in Florida, October 2013–August 2021.[—, no verification completed; USGS, U.S. Geological Survey; SJRWMD, St. Johns River Water Management District, ([2015 Agricultural Crop and Irrigation Survey], SJRWMD, unpublished data, 2016). At the time of publication, data were available by request from SJRWMD; Italic font indicates that only part of the county was verified]
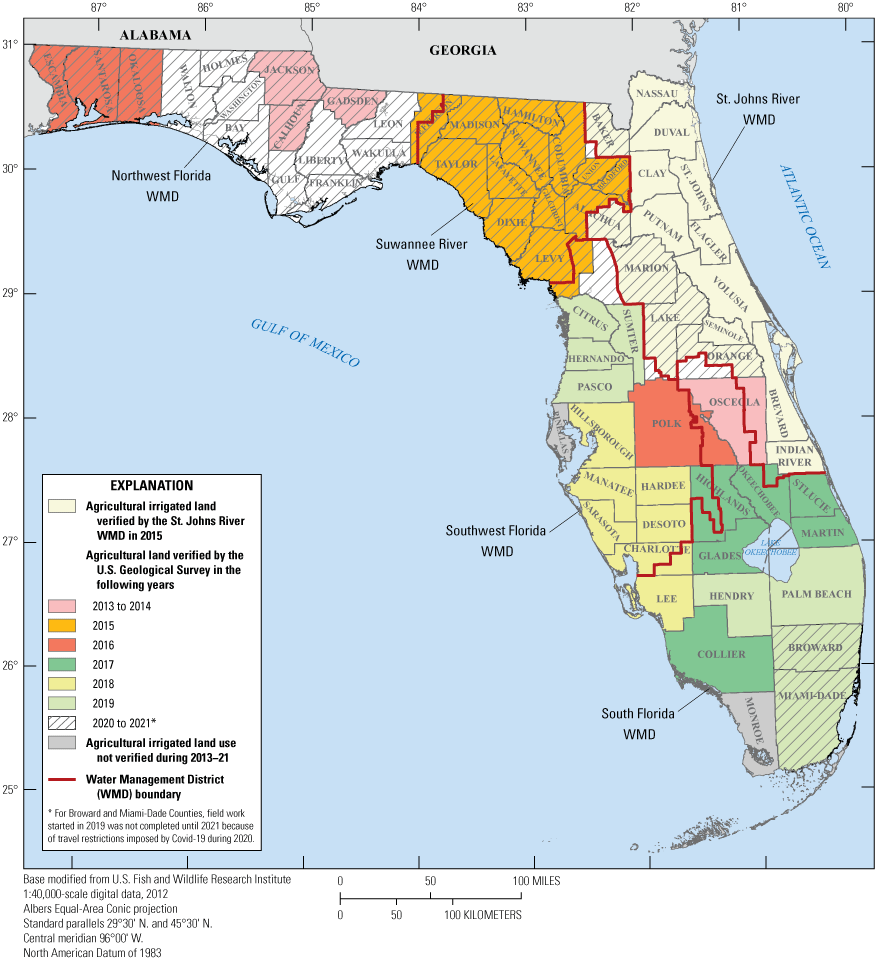
Water management districts and counties in Florida where irrigated agricultural land was verified, 2013–21.
The shapefiles and tabulated summaries of acreage presented in publications and data releases for counties listed in table 1 provide estimates of irrigated acreage by irrigation system and crop type for the year(s) they were inventoried. In addition to being used to validate irrigated acreage for the FDACS, the data compiled in this project will contribute to the USGS National Water-Use Science Project (https://www.usgs.gov/mission-areas/water-resources/science/national-water-use-science-project) for a better understanding of the accuracy of irrigated acreage published by other sources and to provide a better knowledge of the geographic distribution of irrigated acreage across counties or hydrologic basins.
Project Assumptions and Limitations
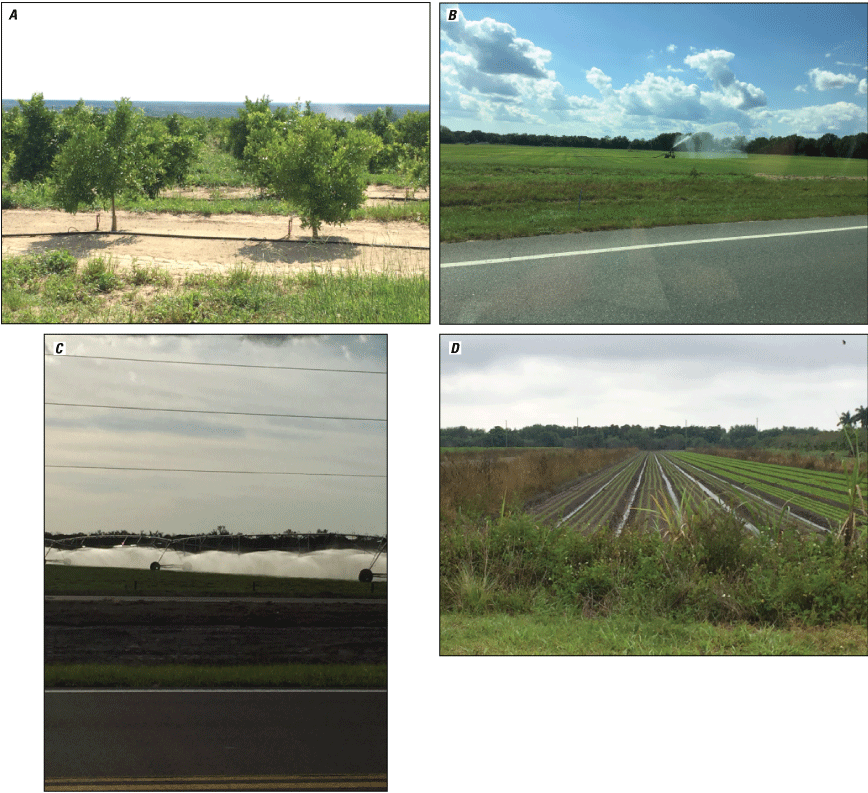
For the purpose of this study, it was assumed that if an irrigation system was visually observed on a field, the system would be in use at some point during that growing season. This assumption was necessary because only a small number of irrigation systems were observed in operation during field visits; therefore, the irrigation acreage totals tabulated may include some acreage not actually irrigated because not all irrigation systems observed may have been used during the year visited. In addition, some growers use portable irrigation systems (portable or traveling gun) or move irrigation systems (center pivots or linear move system) from one field to another. In those cases, unless the irrigation structures were visibly in use or were still connected to a pump at the time of the visit, the acres were not counted as irrigated; however, when a field was obviously irrigated (greener or taller than surrounding fields), but no irrigation system was observed, evidence of an irrigation system, such as wheel tracks through the field, was used along with the WMD CUP to count that acreage as irrigated. For Miami-Dade County, where portable high-volume irrigation guns are mounted on truck beds (fig. 3) and moved daily from field to field through the growing season, all acreage identified as a row crop was counted as irrigated.
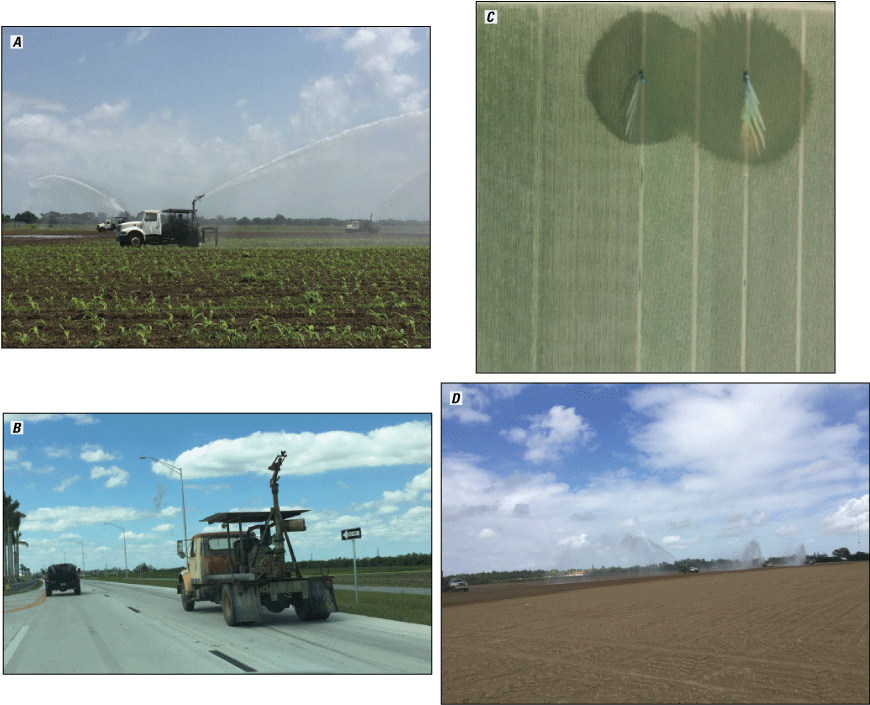
A, Portable high-volume irrigation guns in use in Miami-Dade County, Florida; B, portable high-volume irrigation gun in transit in Miami-Dade County, Florida; C, aerial view of portable high-volume irrigation guns in Miami-Dade County, Florida; and D, street view of portable high-volume irrigation guns wetting a recently planted field. (A, B, and D, by Richard L. Marella, U.S. Geological Survey; C, Image from Google Earth, December 17, 2017.)
During field-verification trips, specific attributes were noted for each irrigated field on a working base map: crop type (general and specific), irrigation system type, and water source. Water sources are groundwater, surface water, and (or) wastewater effluent (municipal or agricultural). Groundwater was assigned as the default water source for fields where a water source could not be verified through a visual observation or by the WMD CUP records. In some cases, both groundwater and surface water were used for irrigation, and these sources were identified through the WMD CUPs and labeled in the attribute table. These assumptions and other limitations were documented in the attribute tables.
Attribute data collected for each irrigated field included crop type, irrigation system type, and primary water source if the source could be confirmed in the field by observation from an adjacent road. The field verification in some counties included visits to fields during two growing seasons: spring/summer and fall/winter. If a field had a crop present during each of these two growing seasons it was considered “double cropping,” and the actual field acreage was recorded twice. Double cropping was most observed for row crops. In some cases, the second crop was a cover crop. Cover crops are typically not irrigated and therefore were not counted in the irrigated totals for these fields. All other crops that are not seasonally grown, such as citrus, blueberries, grapes, peaches, ornamentals (container nurseries and tree farms), sod, and sugarcane, were field verified throughout the calendar year.
Crop Types and Agricultural Categories
Crops and fields were assigned to one of six primary types or agricultural categories: row crops and vegetables, fruit crops (including orchards and berries), field crops (including grass, hay, and pasture), nursery and sod, all other irrigated land, and nonirrigated land. The specific crops within these six categories are detailed below and are also found in the most recent USDA Census of Agriculture (USDA, 2019) and the SJRWMD Crop Identification Field Guide (SJRWMD, 2015a):
-
1. “Row crops and vegetables” includes beans (bush, green, lima, pole, snap), beets, broccoli, brussels sprouts, cabbage (Chinese, head), cantaloupes, carrots, cauliflower, celery, collards, cucumbers and pickles, eggplant, endive, escarole, herbs, honeydew melons, kale, lettuce (head, leaf, romaine), mustard greens, okra, onions (dry, green), parsley, peas (black-eyed, Chinese, crowder, pole), peppers (bell, chili), potatoes, pumpkins, radishes, spinach, squash (summer, winter), sweet corn, sweet potatoes, tomatoes, turnips, turnip greens, watercress, watermelons, and all other vegetables listed in table 29 of the 2017 Census of Agriculture for Florida (USDA, 2019).
-
2. “Fruit crops” includes all citrus, apples, avocados, bananas, cherries, figs, grapes, mangos, papayas, passion fruit, peaches, pears, pecans, persimmons, plums, and all noncitrus fruit listed in table 31 of the 2017 Census of Agriculture for Florida (USDA, 2019). This category also includes blackberries, dewberries, blueberries (tame, wild), loganberries, raspberries, strawberries, and all other berries listed in table 33 of the 2017 Census of Agriculture for Florida (USDA, 2019).
-
3. “Field crops” includes specific crops of corn (grain, feed), cotton, peanuts, sorghum, soybeans, and sugarcane, along with tobacco, wheat (for grain), oats (for grain), proso millet, rice, rye (for grain), dry southern peas (cowpeas), silage crops listed as forage in tables 25 and 26, and grass (including seed and forage), hay, and pasture as listed in tables 10 and 31 of the 2017 Census of Agriculture for Florida (USDA, 2019).
-
4. “Nursery and sod” includes crops listed in table 34 of the 2017 Census of Agriculture for Florida (USDA, 2019) as acres in floriculture and bedding crops in the open and as square footage under glass, roof, or protection, along with all outdoor container nurseries, tree farms, and sod farms.
-
5. “All other irrigated land” includes acreage associated with aquaculture and irrigated areas associated with research facilities. Aquaculture includes acreage associated with ponds or contained areas (pools, tanks, and others) of water for aquaculture facilities for food (alligators, catfish, shellfish, shrimp, and others), recreation, restoration, conservation, or sport (tropical fish, fish hatcheries, turtle farms, and others). Research facilities include land associated with governmental or private research facilities that host multiple crops per field, often at various stages of growth, for the purposes of agriculturally based agronomy and other research efforts.
-
6. “Nonirrigated land” includes idle, fallow, abandoned fields, and fields that rely solely on rainfall, or agricultural practices such as cover crops. Fallow acreage includes fields that have no visible signs of an active crop but still have an irrigation system present (fig. 4). In most cases these fallow fields include pasture, citrus groves that have been plowed or cleared and not replanted, and vegetable fields that have not been planted during a specific growing season. Fallow fields (including idle fields) were identified as irrigated prior to 2019 and were included in the county irrigation totals. For 2019, 2020, and 2021, fallow fields (which now include idle fields) were removed from the irrigation totals. Abandoned fields include citrus (fig. 5) and noncitrus fruit groves, field and row crops, and nurseries that were observed as abandoned or inactive during field observation and most often were confirmed through an inactive WMD's CUP or through contact with the staff from the local FDACS field office or the local University of Florida, Institute of Food and Agricultural Science (IFAS) county extension offices. In the early years of field verification, abandoned fields were removed from the shapefile; however, beginning in 2018 abandoned fields were categorized as fallow unless evidence was seen to indicate a move out of agricultural production such as posted signs indicating that the land was for sale or under consideration for rezoning or if the CUP was closed.
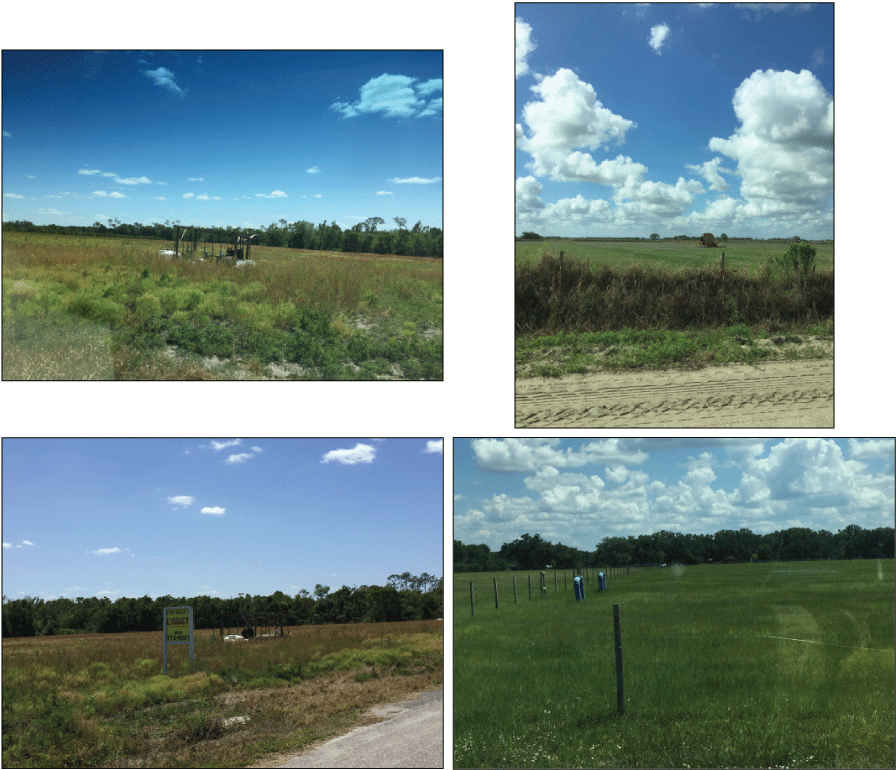
Fallow fields observed in Florida between 2013 and 2021. (Photographs by Richard L. Marella, U.S. Geological Survey.)
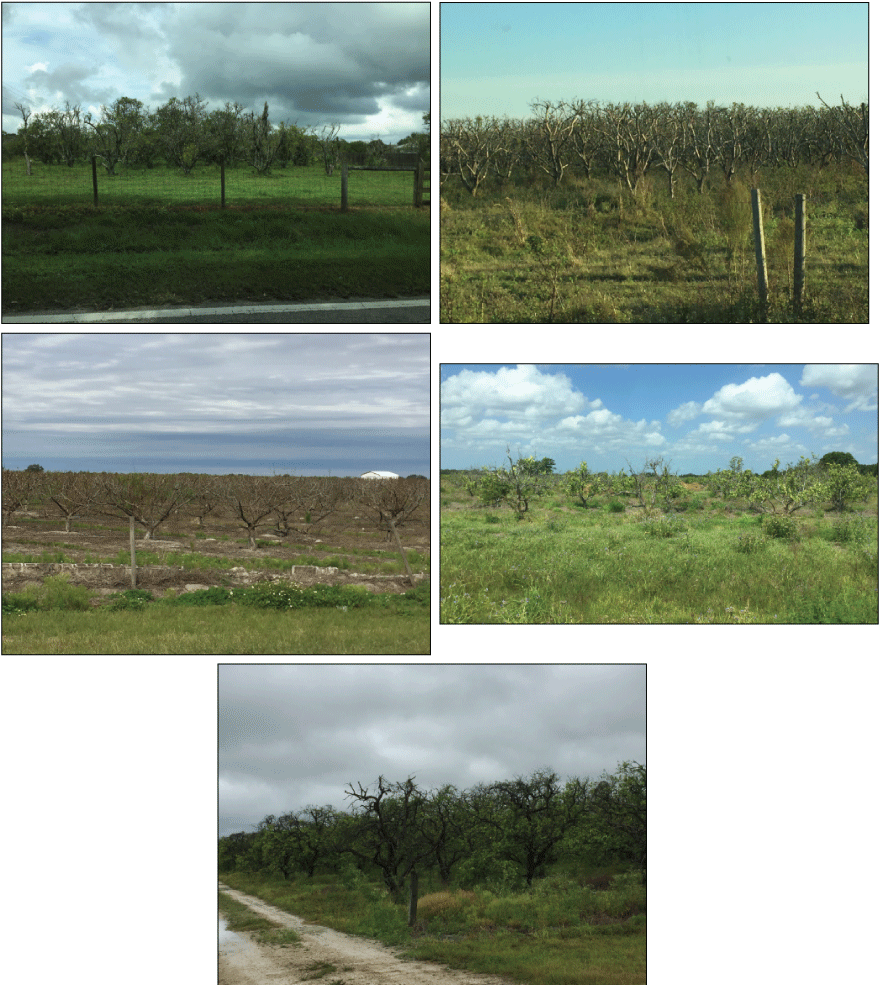
Abandoned citrus groves observed in Florida between 2013 and 2021. (Photographs by Richard L. Marella, U.S. Geological Survey.)
Irrigation Systems
Irrigation systems were assigned to one of three primary categories: micro-, sprinkler, and flood-seepage irrigation. The specific irrigation systems under these three categories are detailed below and are also defined by Izuno and Haman (1987), Smajstrla and others (1991), and the SJRWMD Irrigation System Identification Field Guide (SJRWMD, 2015b):
-
1. Microirrigation includes bubbler, drip, jet, spray, and subirrigation (for nurseries only) systems (fig. 6A).
-
2. Sprinkler irrigation includes center pivot, linear move, stationary gun, traveling gun (including high-volume irrigation guns mounted on the beds of trucks), permanent overhead, impact heads, and spray heads (figs. 6B and 6C).
-
3. Flood-seepage irrigation includes subsurface seepage (pipeline and enhanced), crown, continuous flood, and flow-through systems (primarily used for aquaculture) (fig. 6D).
Irrigation systems observed in Florida between 2013 and 2021: A, drip irrigation in Polk County, Florida; B, traveling gun irrigation in Palm Beach County, Florida; C, center pivot irrigation in Hardee County; and D, subsurface flood irrigation in Palm Beach County, Florida. (Photographs by Richard L. Marella, U.S. Geological Survey.)
Methodology
Several steps were used to verify maps and attribute tables for irrigated agriculture in each county. These steps have evolved from October 2013 when the first county map was started for Osceola County through August 2021 when counties were mapped for the NWFWMD. Methods were updated because of improved and more easily accessible aerial imagery and because of the increased use of portable computer devices in the field to input or check selected attribute data. Aerial imagery from sources such as Google Earth and Google Earth Street View have become readily available and are constantly updated. These images also provide an aerial view of areas that could not be seen from the roads and enable clearer definitions to the existing digitized field boundaries. The change from handwritten notes on paper maps to digital entry of notes on a cloud-based system began in 2018. The ArcGIS Collector application (https://www.esri.com/en-us/arcgis/products/collector-for-arcgis/overview), which can be used on a portable computer device, provided the ability to label field attributes directly while working in the field. This eliminated the need for paper maps and handwritten labels, and data no longer needed to be entered into the shapefile attribute tables once staff returned to the office. The ArcGIS Collector application displays maps of the digitized fields provided by FSAID and includes a direct link to the WMD CUP through ePermit portal, (NWFWMD, 2021; SJRWMD, 2021; SFWMD, 2021; SRWMD, 2021; SWFWMD, 2021), which allows verification of permit status while at the field location. Prior to 2019, revising the field boundaries or adding new fields had to be done in the office based on field notes. Upgrades to the ArcGIS Collector application enabled additions or changes to each polygon while in the field during the 2019 and 2020 surveys.
Crop descriptions and field tracking also changed over time as details or issues identified during field visits in the earlier years of the project often created the need to address how fields were labeled and tracked in the attribute tables. For example, a citrus grove that was observed as abandoned, possibly plowed, or cleared in the earlier years was either categorized as inactive or deleted from the irrigated coverage. However, these abandoned or cleared citrus groves needed to stay in the FSAID ILG because they could be replanted as citrus or moved into other agricultural production. Abandoned groves or cleared fields that were not in the process of being developed into other land use were eventually designated as fallow if the irrigation infrastructure was still present or the WMD’s CUP was still active, and they were designated as abandoned if no irrigation infrastructure was present or the WMD’s CUP was inactive. The ability to revise the labeling allowed for fields to be kept in the ILG if they had the possibility of being irrigated for agriculture in the future or removed from the ILG if the land-use category changed.
Several steps are required in the field-verification, digitizing, and approval process used to produce agricultural irrigated land-use maps, attribute tables, and county acreage totals. The five main steps, discussed in the following sections, are (1) preliminary map development and data compilation, (2) field verification, (3) crop, irrigation system, and water source delineation, (4) digitizing and attributing irrigated fields, and (5) resolving unidentified fields and missing information (fig. 7).
Preliminary Map Development and Data Compilation
The first step in the process was to create a preliminary base map for each county from data layers obtained from the ILG as part of the most recent FSAID layer at the time field work was being planned. These ILG maps provided a spatial representation of the location of irrigated land (by field) and an estimate of the crop type on each field by county. These ILG maps were created by The Balmoral Group from multiple land-use coverages and images which provided the most recently available irrigation land-use layers beginning with FSAID II in 2013–14 (The Balmoral Group, 2015) to the most recent FSAID VIII for 2019–20 (The Balmoral Group, 2021).
In addition to the FSAID ILG layer, several additional data sources and layers were added to create the working base map. These included point and polygon shapefiles of the most current agricultural irrigation CUPs from the WMDs, including the SFWMD’s Geospatial Open Data Portal (SFWMD, 2020), the SJRWMD’s Geospatial Open Data (SJRWMD, 2020), the SWFWMD’s Geospatial Open Data Portal (SWFWMD, 2020), and the NWFWMD and SRWMD permit property-boundaries. The locations of CUPs (for wells and surface-water intakes) and the permit property boundaries associated with each withdrawal point helped identify fields that may have been missed on the original FSAID map. Another data layer added to the working base map was obtained from the FDACS Division of Plant Industry, Citrus Health Response Program (CHRP). This data layer identified abandoned citrus groves in each county where trees were either already removed or were awaiting removal. Since 2011, CHRP has maintained a statewide database of abandoned citrus groves that have been confirmed by local FDACS staff in each county (FDACS, 2020). Abandoned groves documented with this layer were labeled and removed from the working base map; however, many of these abandoned groves were still checked during the field verification in case citrus was replanted or another irrigated crop was present. Once all data sources were compiled, the working base map was ready for use in the field-verification process.
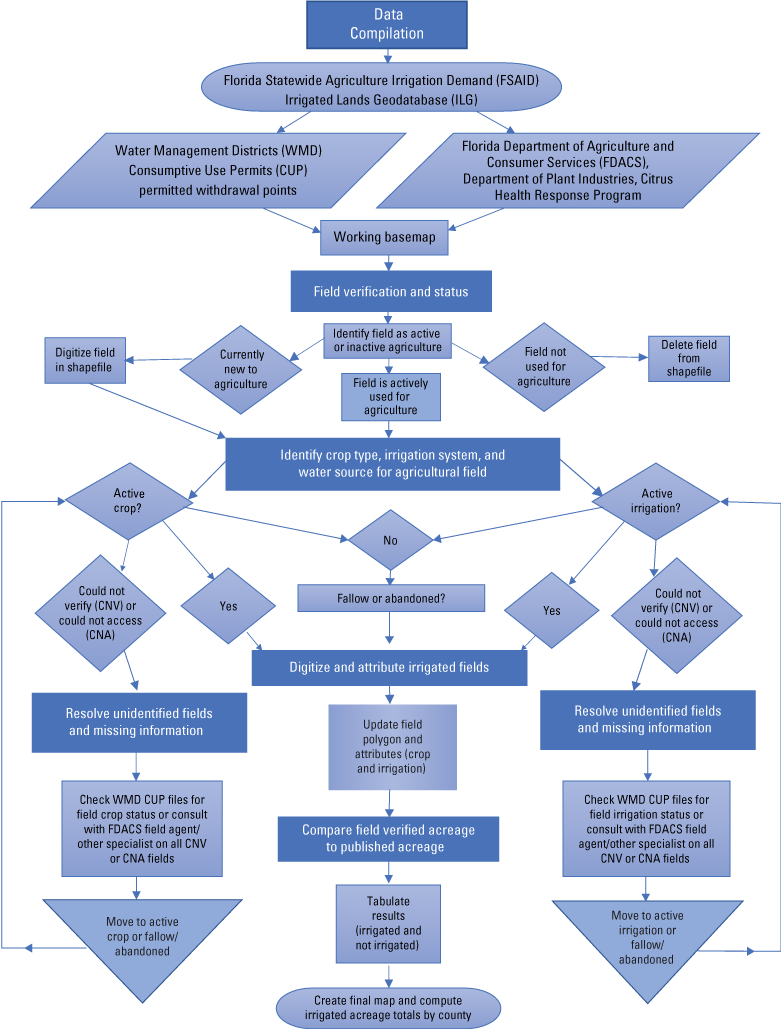
Flow chart detailing the methodology and validation process used to produce each irrigated agricultural land map, attribute table, and acreage totals for 65 counties in Florida between 2013 and 2021.
Field Verification
Field verification was conducted by using the working base map between 2013 and 2021 during various times of the year depending on the agricultural practices that typically occur in each county. In southern and central Florida, crops can be grown during winter months, and in many areas, multiple crops can be grown on the same field due to the warmer climate. In the counties within the SFWMD and the SWFWMD, field verification was primarily conducted between December and September. In northern Florida, the cooler winter temperatures shorten the primary growing season; therefore, in the counties within the SRWMD and the NWFWMD, field verification was conducted between April and December. In northern Florida, many fields still had two crops growing during the year.
Attempts were made to physically observe each field shown on the working base map as irrigated and each field with a CUP. Observations were made from a public road at least once during the field verification. In many counties, fields with row crops were visited two or three times during the calendar year because of the possibility of having multiple crops planted. Private property was only entered during field verification after receiving permission from the landowner, which was only done a few times throughout the entire multiyear project. During the initial visit to each field shown on the working base map, the field was identified as either active or inactive agriculture (fig. 7).
Active agriculture usually had the presence of a planted crop, evidence of a recent harvest, or signs of a future planting. If the field was actively in agriculture, it was then determined if it was irrigated, usually by the presence of an irrigation structure or system on the field, the presence of an irrigation pump, or record of a CUP shown on the working base map, which often confirmed that the field had the capability of being irrigated. The fields that could not be clearly identified as irrigated were labeled as “could not verify” (CNV). If the field could not be accessed or seen clearly from a public road, it was labeled as “could not access” (CNA). Once a field was determined to be active, several items were labeled on the base map for that field, including crop type (general or specific), irrigation system, and water source, if those could be determined from the road. In addition, the shape of field was compared to the one presented on the working base map, and notes about differences were made. The attribute table and shape of the polygons were adjusted when staff were back in the office.
Inactive agriculture usually included fields with no evidence of agricultural activity, such as fields that were unmaintained or overgrown with weeds, even though an irrigation system may have been present. In some cases, signs indicating that the property was for sale or was pending rezoning were present. Even though the field appeared to be inactive agriculture, the shape of the field was compared with the one on the working base map in case part of it was still active. The CUPs for most of these inactive fields were checked to see if the CUP was still active when staff returned to the office. If the CUP was still active, the field was labeled as fallow; if the CUP had expired or no evidence of permit activity was found (for example no new correspondence was seen in the permit file), the field was labeled as abandoned (fig. 7).
For citrus, most groves could be observed from public roads; however, it was not always clear if the grove was active or inactive at the time of the visit. Many of the reported pushed (the citrus trees have been removed from the ground) or vacant groves from the CHRP database had evidence of replanting or still had drip lines visible on the barren ground (usually an indication that the field was in the process of being replanted), and these groves were labeled as active citrus (fig. 8). In addition, if a mature grove looked like it was possibly inactive, but new trees had been planted within the grove, the grove was also labeled as active citrus. As a general rule, three factors were used to determine if a grove was active or inactive: (1) poor or no maintenance within the grove, including bark peeling off the tree trunks, no fruit on the trees, or no evidence of the grove being mowed, (2) livestock present within the grove, and (or) (3) the presence of a “for sale” or a “re-zoning” sign along the frontage of the grove (fig. 9). If a grove could not be determined as active or inactive during the site visit, the grove was labeled as CNV.
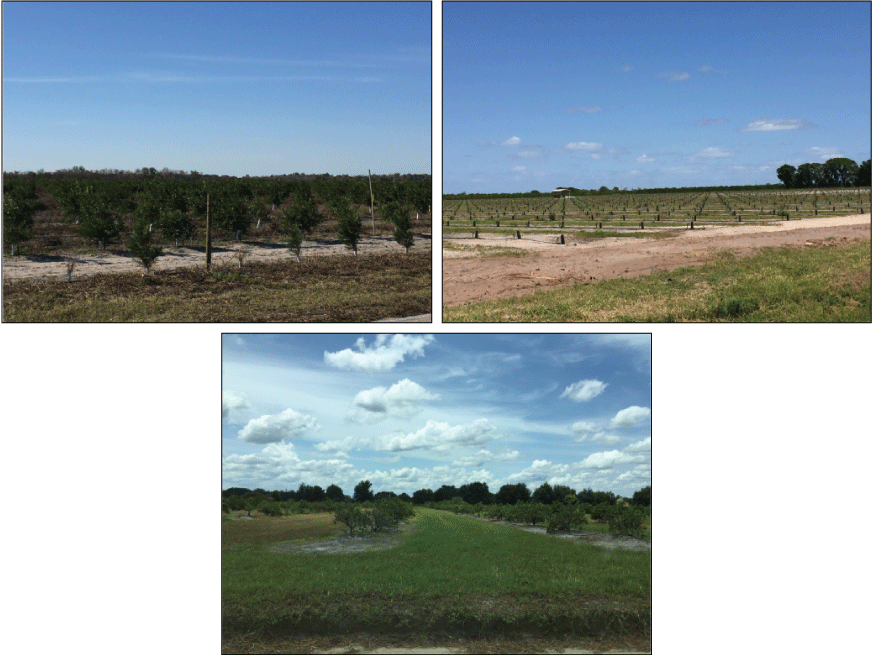
Active citrus groves in Florida between 2013 and 2021. (Photographs by Richard L. Marella, U.S. Geological Survey.)
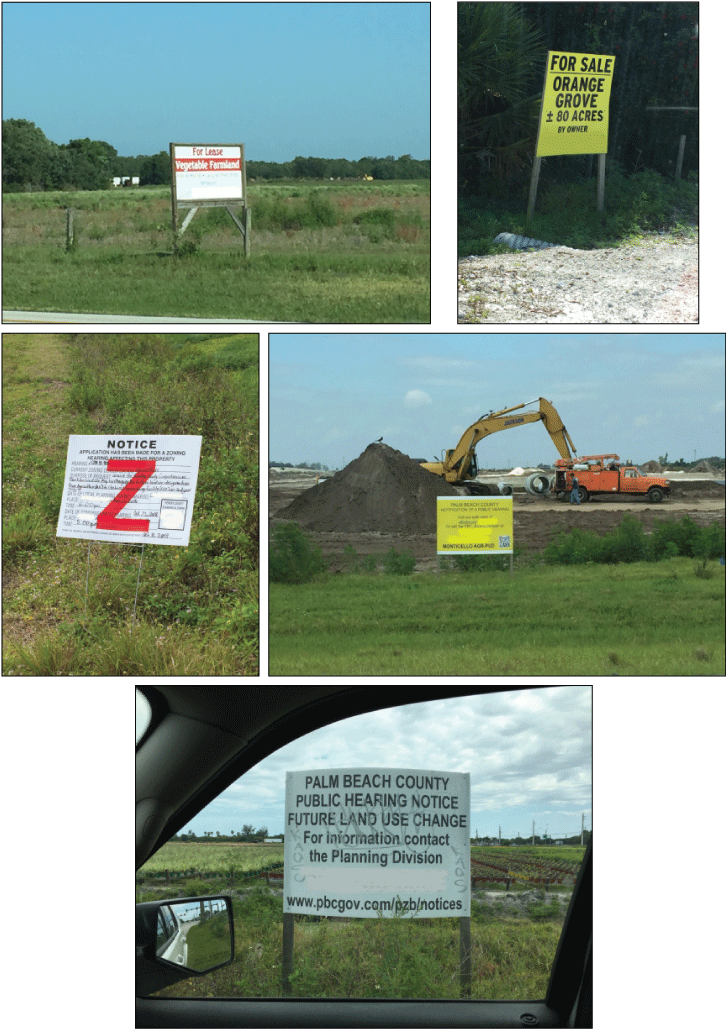
Agricultural irrigated fields in the process of changing ownership or land-use status observed in Florida between 2013 and 2021. (Photographs by Richard L. Marella, U.S. Geological Survey.)
Crop, Irrigation System, and Water Source Delineation
Crops were generalized and assigned to one of the following major categories: row crops and vegetables, fruit crops (including orchards and berries), field crops (including grass, hay, and pasture), nursery and sod, all other irrigated land, or nonirrigated land. In many cases the crop type was obvious (citrus and other fruit orchards, corn, nursery, sod, and sugarcane), but in some cases the crop could not be specifically identified at the time of the field visit. This was especially true for many row or field crops that were recently planted or harvested; these crops could not be seen clearly from the road because not enough of the vegetation was visible. Also, if the view of the field was obstructed by vegetation along the field edges or by ditches along the road, the specific crop type could not be clearly determined. In these cases, the fields were identified and labeled as a row or field crop, with no specific crop assigned; however, if a specific crop could be positively identified by using the SJRWMD field guide (SJRWMD, 2015a) or by other means, it would be labeled as such under the general listing of a vegetable. In several cases, a vegetable field may have been harvested by the time it was visited; however, evidence of field plastics, drip lines, portable hoses, or unpicked crops that were still present in or along the field edges helped determine that the field was actively irrigated during the current growing season, and in some cases, the specific crop could be identified.
The irrigation status of fields of grasses, including hay, pasture, and forage, was often the most difficult to determine. Hay, which includes grass grown for the purpose of cutting and bailing, would typically have a center pivot, linear move, or traveling gun present in the field or along the field’s edge if the field was irrigated. Pasture, which is defined as grass that is routinely maintained (mowed and relatively weed free), often had livestock on the fields, with no evidence of bailed or stored hay nearby. Usually, no evidence of an irrigation system was visible (especially if it was seepage irrigation), and in these cases, the WMD CUPs were used to confirm if irrigation occurred during the year of the field visit. In most cases, the permit holder had to submit records of water withdrawn on these fields, and in some cases, the fields had greener grass than that of neighboring fields, indicating possible irrigation. Forage grass was most often unmaintained (usually not mowed, often with weeds, or with multiple bare areas) or was recently planted as a cover crop after a field or vegetable crop was harvested. Many forage grass fields had livestock present or were used to receive dairy wastewater effluent through a center pivot, traveling, or permanent gun. In these cases, the fields were often located on a dairy farm, usually near a wastewater pond. If a grass field could not be accessed or if a crop could not be properly identified, the field was labeled as either CNA or CNV.
Once a field was determined as active and a crop was identified, an irrigation category was assigned for that field. The three categories are micro-, sprinkler, and flood-seepage irrigation; however, in most cases, a specific irrigation system was also assigned to the field in the attribute table. In addition, a small percentage of fields in several counties may have used a portable irrigation system such as a traveling gun (fig. 6B) or may have moved center pivots from one field to another. In these cases, when evidence of irrigation was seen (center pivot tire tracks or portable piping piled on the edge of a field), but no irrigation system was visible, the CUP associated with that field was checked. If pumpage was reported in the CUP, that field was labeled as irrigated. For Miami-Dade County, all planted row and field crops were assumed to be irrigated, either from a microirrigation system if black sheeting was observed or from a traveling gun that can easily be moved from field to field daily (fig. 3).
If a diesel or electric pump or a pump house structure could be seen from the road, that field would be labeled as having a groundwater source unless the pump was adjacent to or located along a canal or pond, which would indicate a surface-water source (fig. 10); however, the water source could not be clearly identified for most irrigated fields. For these fields, the WMD CUP was checked to confirm the water sources because these details were almost always provided within the permit application or staff report. Many fields were irrigated with groundwater and surface water, and these fields were assigned according to the percentages of use reported in the CUP. Municipal wastewater effluent was sometimes used as a source of water primarily for citrus irrigation (fig. 10C). At many dairy farms, the water being used to irrigate pasture grasses was sometimes observed as brown indicating the use of dairy effluent as the water source, however, these same fields could be irrigated with fresh water from ponds or wells at times. A list of agricultural irrigation fields using reclaimed water for irrigation purposes was obtained from the Florida Department of Environmental Protection (2020).
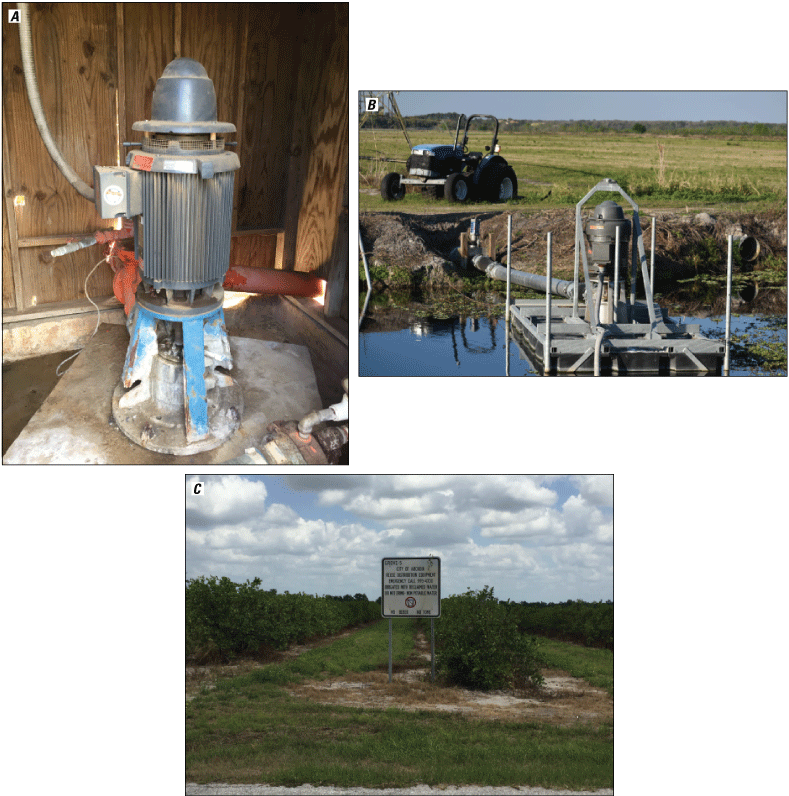
Various agricultural irrigation water sources observed in Florida between 2013 and 2021: A, groundwater well in Alachua County, Florida; B, surface-water intake from canal in Orange County, Florida; and C, reclaimed wastewater use in DeSoto County, Florida. (Photographs by Richard L. Marella, U.S. Geological Survey.)
Digitizing and Attributing Irrigated Field Boundaries
Field boundaries were reviewed during field verification, and modifications to field boundaries were noted or delineated on working base maps. The working base maps with associated field notes were then brought back to the office to be digitized so that each observed field could be delineated, corrected, and properly labeled within an ArcGIS shapefile. Fields were also noted as not irrigated or were deleted from the irrigated layer if no irrigation was present or if the field was no longer classified as agriculture. Fields not originally shown in the ILG were added to the shapefile if irrigation was present, and the boundaries were digitized based on the most recent Google Earth images. For earlier published maps (2014, 2015, and 2016) the World Imagery base map from Esri ArcGIS online was used to aid digitizing (Esri, 2020).
In some cases, boundaries for irrigated fields obtained from the original FSAID layer were outlined or re-digitized based on maps provided to the WMDs for CUP applications or by using the most recent Google Earth images. This digitizing task often increased the field and acreage accuracy because farm structures, roads, canals, ponds, tree lines, and other nonirrigated areas were removed from the original digitized fields (fig. 11). In addition, many fields only had an active crop on a portion of the field, even though the entire field had the infrastructure to be irrigated. In these cases, the entire irrigated field was digitized and labeled as irrigated because the inactive part of the field was either recently harvested, being prepared for planting, or possibly fallow for the current growing season (fig. 12).
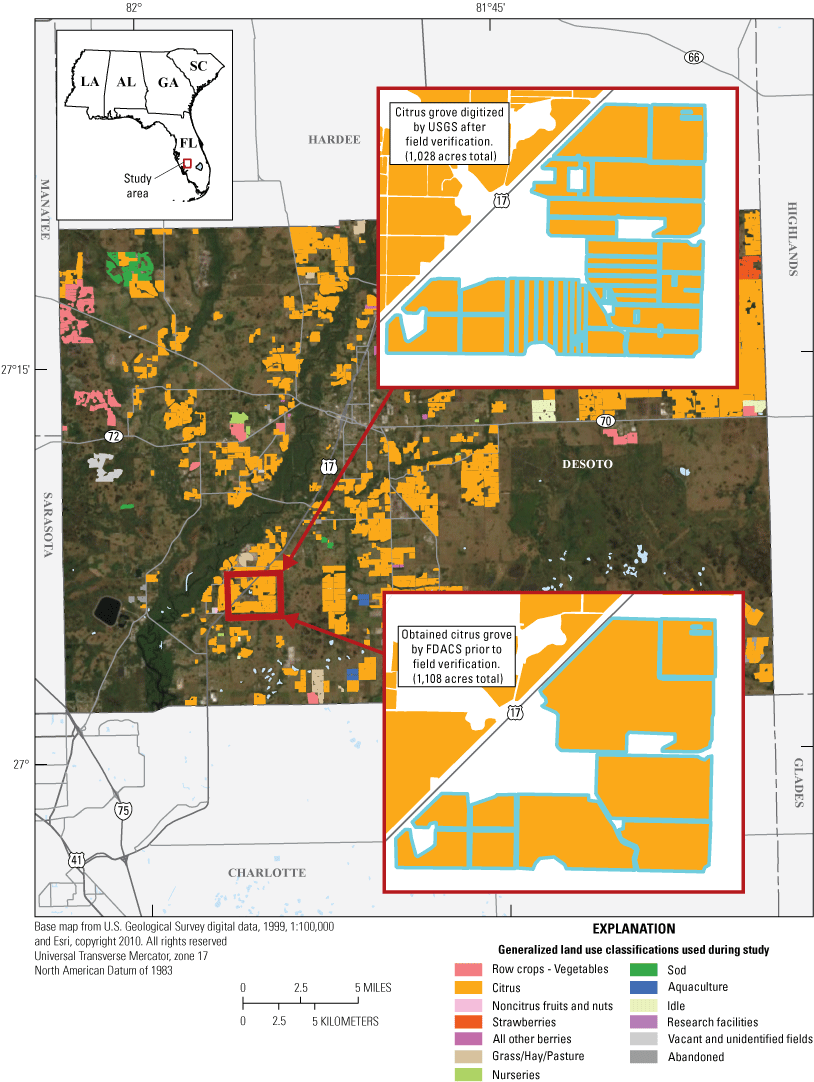
Example of detailed digitizing of a selected citrus grove in DeSoto County, Florida, during 2018.
For each field that was identified as irrigated, fallow, or abandoned, an entry was made in the attribute table in ArcGIS. These entries include the general crop type (row, fruit, field, or nursery and sod) and the specific crop type (if available), general irrigation system type (flood-seepage, micro-, or sprinkler irrigation) and the specific type (if available), primary and secondary water sources, Florida Land Use Classification System code, (Florida Department of Transportation Surveying and Mapping Office Geographic Mapping Section, 1999), date and time of field visit, source of information (field visit, CUP, FDACS field staff, or other), and any comments added from the field visit. Fallow and abandoned fields were listed in the attribute table; however, they were labeled as not irrigated for the year they were observed.
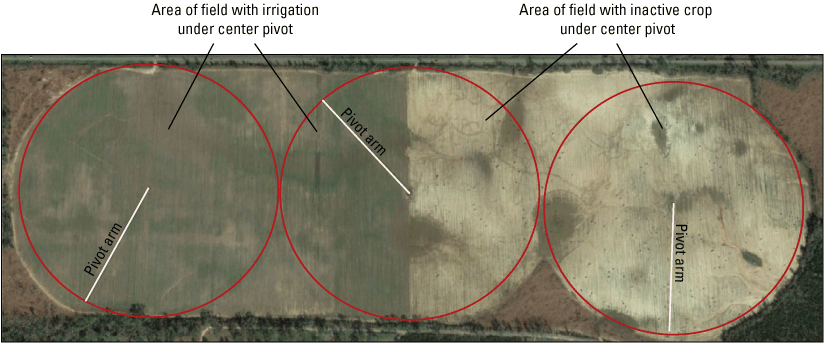
Active and inactive fields during January 2019 under three center pivots on a farm in Jackson County, Florida. (Image from Google Earth, January 6, 2019.)
Resolving Unidentified Fields and Missing Information
Several fields or groves that could not be viewed or were only partially observed during field visits from public roads were identified as CNA. In addition, if a crop could not be identified on an irrigated field or a citrus grove could not be determined as active or inactive, it was labeled as CNV. The acreage of fields assigned to the CNA and CNV categories in each county varied. For example, the combined acreage originally identified as CNA or CNV for Polk County in 2018 represented about 10 percent of the total acreage tabulated in the shapefile (Marella, Berry, and Dixon, 2017a). For each field labeled as CNA or CNV, two primary data sources were used to identify the status of each field, crop type, irrigation system, and water sources; if these two data sources did not provide a clear answer, the field was cross referenced with the most recent FSAID layer and if nothing was shown then it was removed from the attribute table. The first primary data source was the WMD CUP files which were accessed through each WMD’s ePermit portal (NWFWMD, 2021; SJRWMD, 2021; SFWMD, 2021; SRWMD, 2021; SWFWMD, 2021). Within each CUP, information for most fields labeled as CNA or CNV could be obtained from the individual permit applications, the permit staff report summaries, or recently submitted pumpage records. The second primary data source used to categorize or remove these fields was the local or regional FDACS field office or the IFAS county extension office; in many cases, personnel at these offices were able to answer or resolve most of the questions about unidentified fields. The data obtained from these sources were added to the attribute table for each of these fields that had been labeled as CNA or CNV if the field was active. but the field was removed from the attribute table if it was determined to be inactive. During 2013–17, these undetermined fields were labeled as CNA or CNV and were retained in the attribute table as irrigated acreage; however, beginning in 2018, these fields were labeled as fallow or abandoned and as not irrigated but remained in agriculture. Upon using these data sources for Polk County in 2018, the amount of acreage labeled as CNA and CNV was reduced from about 10 percent to about 5 percent.
Further Validation
Upon completion of the previously described verification and attribution processes, a preliminary shapefile, attribute table, and a spreadsheet summary table with irrigated acreage totals by crop type were created for each county in the study area. These shapefiles and county acreage summary spreadsheets were provided to The Balmoral Group and the FDACS for comparison with the most recent FSAID ILG field attributes and acreage totals. Generally, when a county’s acreage total differed by greater than 5 percent between what was listed in the ILG and the acreage calculated from the field verification, then the two shapefiles were compared to identify the differences. Major differences between the two agricultural irrigated land maps often resulted from the one of the following circumstances: (1) citrus that was either abandoned or replanted, (2) pasture that was originally designated as irrigated but was field or permit verified as not irrigated, (3) row or field crop fields that were not currently planted so they were moved out of the irrigated category and into the fallow or abandoned category, or (4) land that was originally designated in the ILG as irrigated but had a different land use, such as urban, mining, or energy production (solar panel fields), upon field verification. Once the differences between the ILG and the working base map were identified, corrections were made to the ILG or the working base map to reduce the difference in county acreage totals between the database and shapefile to about 5 percent or less. For a few selected counties, pasture irrigation from the ILG totals were not modified to reflect the field verification totals as large acreage of pasture irrigation was permitted and could be irrigated in any year other than the year the field verification occurred. After all changes were made to the working base map, attribute table, and irrigated crop tables, a final map for the study area and crop totals were produced.
Comparing Field-Verified Acreage Results and Published Acreage Totals
The primary purpose of this multiyear statewide agriculture irrigation land-use project was to verify irrigated acreage estimates and field locations developed by the FDACS. The primary method used to estimate agricultural water use in Florida is to multiply acreage irrigated for various fields by a crop-specific irrigation-requirement coefficient (Marella, 2020, and Smajstrla and Zazueta, 1995). Prior to this effort by the USGS, in cooperation with the FDACS, OAWP, to calculate irrigated acreage by county, other State and Federal agencies, such as the FDACS, and multiple USDA services, collected data and published acreage totals annually or on a cycle of years for the entire State or by county. These agencies used various methods to collect and tabulate acreage data. Statewide and county irrigated acreage totals published by these agencies were compared with the data in the ILG and the field-verified acreage totals produced by this multiyear project.
While it is difficult to directly compare the USGS estimates tabulated from the verified acreage totals compiled between 2013 and 2021 with totals published in the FDACS annual summaries (FDACS, 2017) and the USDA Census of Agriculture reports (U.S. Department of Commerce, 1984, 1989, 1994; USDA, 1999, 2004, 2009, 2014, 2019), field-verified results can be compared with some other published datasets for Florida. Overall, by combining the irrigated acreage for the 65 counties field verified by the USGS and the SJRWMD between 2013 and 2021, the total irrigated area for Florida was estimated to be 1,822,607 acres (table 2); note that this statewide total acreage is from data that spanned an 8-year period (fig. 2; table 1). Statewide irrigated acreage published by the USDA Census of Agriculture totaled 1,492,217 acres for 2012 and 1,519,379 acres for 2017 (USDA, 2014, 2019). Values published by other agencies are often lower than those compiled from this project because of differences in the timeframes of data collection and the methods used to compile or tabulate the data. Specifically, differences between the USGS-verified acreage totals and those published by the USDA in their Census of Agriculture may occur because (1) irrigated acreage for some specific crops increased or decreased substantially during the 5-year interval between census years due to production or economic changes; (2) the assumption that if an irrigation system was observed on a field or grove, it was used during the field-verification year, when in fact some land owners may not have used their irrigation systems during the growing period even if they had a crop in the field; or (3) the amount of irrigated acreage published by the USDA for selected crops may be underestimated or overestimated as a result of how information is obtained and formulated by the agency during census compilations. Because of these differences, a general comparison of USGS-verified acreage totals with the various published datasets from the USDA, FDACS, and USGS (5-year water-use compilations) does indicate a wide range of statewide total irrigated acreage values beginning in 1987 (fig. 13).
Table 2.
Agricultural irrigated acreage by major crop type for 65 counties in Florida verified between 2013 and 2021.[Major irrigation crop type (values represent the most recently published; ----, no data were collected, or acreages were not counted as irrigated; USDA, U.S. Department of Agriculture]
Acreage includes beans (bush, green, lima, pole, snap), beets, broccoli, brussels sprouts, cabbage (Chinese, head), cantaloupes, carrots, cauliflower, celery, collards, cucumbers (including pickles), eggplant, endive, escarole, herbs, honeydew melons, kale, lettuce (head, leaf, romaine), mustard greens, okra, onions (dry, green), parsley, peas (black-eyed, Chinese, crowder, pole), peppers (bell, chili), potatoes, pumpkins, radishes, spinach, squash (summer, winter), sweet corn, sweet potatoes, tomatoes, turnips, turnip greens, watercress, watermelons, and all other vegetables listed in table 29 of the 2017 Census of Agriculture (USDA, 2019).
Acreage includes all citrus, apples, avocados, bananas, cherries, figs, grapes, mangoes, papayas, passion fruit, peaches, pears, pecans, persimmons, plums, and all noncitrus fruit listed in table 31 of the 2017 Census of Agriculture (USDA, 2019).
Acreage includes strawberries as listed in table 33 of the 2017 Census of Agriculture (USDA, 2019).
Acreage includes blackberries, dewberries, blueberries (tame, wild), loganberries, raspberries, and all other berries listed in table 33 of the 2017 Census of Agriculture (USDA, 2019).
Acreage includes specific crops of corn (grain, feed), cotton, peanuts, sorghum, soybeans, and sugarcane, along with tobacco, wheat (for grain), oats (for grain), proso millet, rice, rye (for grain), dry southern peas (cowpeas), silage crops listed as forage in tables 25 and 26 of the 2017 Census of Agriculture (USDA, 2019).
Acreage includes pasture and other land under “Irrigated Land” listed in table 10 of the 2017 Census of Agriculture (USDA, 2019) and grass and grass seeds, hay, and forage listed in table 31 of the 2017 Census of Agriculture (USDA, 2019).
Acreage includes floriculture and bedding crops reported as acres in the open, and as square footage under glass, roof, or protection as listed in table 34 of the 2017 Census of Agriculture (USDA, 2019).
Acreage includes all outdoor container nurseries and tree farms and sod listed in table 34 of the 2017 Census of Agriculture (USDA, 2019).
Includes ponds or contained areas associated with all aquaculture facilities for food (alligators, catfish, shellfish, shrimp, others), recreation, restoration, conservation, or sport (tropical fish, fish hatcheries, turtle farms).
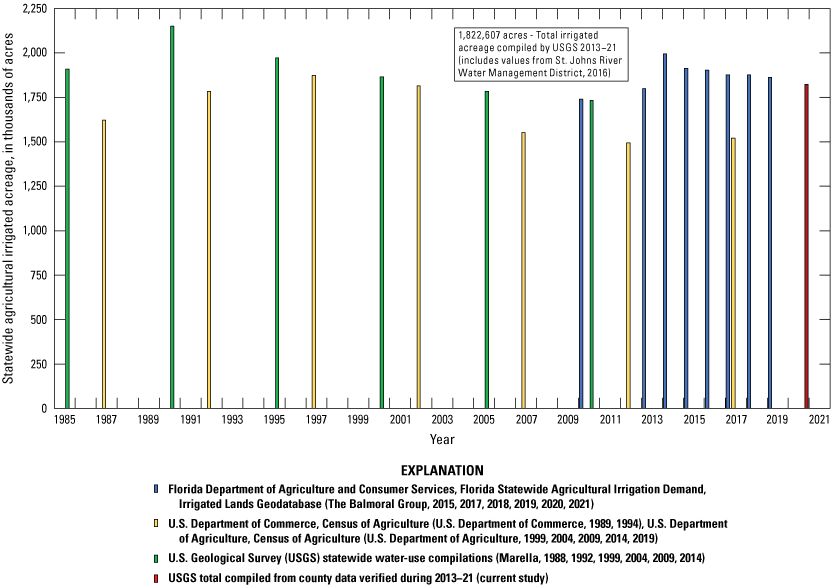
Total statewide agricultural irrigated acreage published or compiled for Florida from multiple sources between 1985 and 2021 (from U.S. Department of Commerce, 1984, 1989, and 1994; Marella, 1988, 1992, 1999, 2004, 2009, and 2014; U.S. Department of Agriculture, 1999, 2004, 2009, 2014, and 2019; and The Balmoral Group, 2015, 2017, 2018, 2019, 2020, and 2021).
When comparing data from different sources for individual counties, several factors need to be considered: (1) differences in timeframes of data collection, (2) differences in methods used for compiling or tabulating the data, and (3) overlap of growing seasons. The FDACS determined the order in which counties would be verified as the project moved forward. Beginning with Osceola County (Marella and Dixon, 2014; https://www.sjrwmd.com/data/gis/), the irrigated acreage total compiled by the USGS for the entire county for fall 2013 and spring 2014 (2013–14 column in table 3; 27,456 acres) were 6 percent lower (ratio of USGS to USDA value is 0.94 or 94 percent) for both years than those published by the USDA for 2012 (USDA, 2014; 29,153 acres) and 25 percent lower than those published by the USDA for 2017 (USDA, 2019; 36,496 acres). For Miami-Dade County, (Marella, Dixon, and Christesson, 2021), the irrigated acreage totals compiled by the USGS for 2019–21 (44,648 acres) were about 1 percent lower than those published by the USDA for 2012 (USDA, 2014; 45,236 acres) and about 21 percent higher than those published by USDA for 2017 (USDA, 2019; 36,801 acres) (table 3). Multiple counties have been field verified twice since this project started. All or part of the counties within the SRWMD (Alachua, Bradford, Columbia, Dixie, Gilchrist, Hamilton, Jefferson, Lafayette, Levy, Madison, Suwannee, Taylor, and Union) were mapped in 2015 and again in 2020 while the counties of Escambia, Calhoun, Gadsden, Jackson, Okaloosa, Santa Rosa in the NWFWMD were mapped in 2014 or 2016 and mapped again in 2021 along with the remaining district counties (Bay, Franklin, Gulf, Holmes, Leon, Liberty, Wakulla, Walton, and Washington) (table 3; fig. 2)
Table 3.
Agricultural irrigated acreage for all counties in Florida, 2012–21.[USDA, U.S. Department of Agriculture; ----, no data were collected; “D” indicates value was not provided due to privacy issues]
Compiled from data provided directly by the St. Johns River Water Management District (2016).
The largest numeric differences between the acreages reported in the USGS and the USDA databases for 2012 and 2017 were for Collier, DeSoto, and Highlands Counties (table 3); the smallest numeric differences were for Hillsborough and Suwannee Counties (table 3). Several factors contribute to the differences in individual county totals between the two datasets: (1) counties with dynamic changes in agriculture such as crop-acreage expansion or losses of acreage caused by urban development or crop decreases tend to have lower acreages in the USDA publications than those tabulated from the field verifications, (2) counties with large amounts of pasture, grasses, and hay irrigation reported to the USDA tend to have higher acreages in the USDA publications than those tabulated from field verifications. For example, in Polk County, the USDA reported 6,631 acres of irrigated pasture, grasses, or hay in 2012 (USDA, 2014), but the field verification resulted in only 26 acres of irrigated pasture, grasses, or hay in 2016 (Marella, Berry, and Dixon, 2017a). From the total 843,584 acres of field crops and grasses (table 2), about 15 percent of this category was for pasture, grasses, and hay.
Between the first field work completed for Osceola County in early 2014 to that completed in the NWFWMD in late 2021, changes in data sources and access to more recent aerial imagery changed. These changes increased the ability to access detailed permit data, cover more ground during field work, and see the most current land use from recent Google Earth images and Google Earth Street View during the multiyear project.
All or parts of 20 counties were field verified twice between 2013 and 2021, and the remaining 45 counties were only field verified once (35 by the USGS and 10 by the SJRWMD) between 2013 and 2021 (fig. 2). Many of the 20 counties verified twice had substantial increases in irrigated acreage, but changes in irrigated acreage are expected in many of the 45 remaining counties.
Summary
In 2012, the Florida Legislature mandated that the Florida Department of Agriculture and Consumer Services (FDACS), Office of Agricultural Water Policy (OAWP), promote an agricultural water-conservation program that would include a cost-share program and best management practices and that would aid the water management districts (WMDs) in the development of consistent agricultural water-supply planning. This OAWP program included assisting the WMDs in projecting future agricultural water needs by promoting consistency among the WMDs through development of improved and verified irrigated crop acreage and application rates. Beginning in 2013, the FDACS created a series of agriculture and irrigated land maps for all Florida counties for the purpose of estimating current and forecasting future water demands. These maps, produced and updated periodically by The Balmoral Group, started with baseline data from 2010, and a combination of satellite images and current WMD land-use layers were used to create a statewide agriculture and irrigated lands database.
The purpose of this multiyear cooperative study between the U.S. Geological Survey (USGS) and the FDACS, OAWP is to provide a detailed geospatial database of verified irrigated field locations with selected attributes, as ArcGIS shapefiles, and aggregated acreage totals by crop type for 55 selected counties in Florida between October 2013 and August 2021. Irrigated fields in each of the 55 counties were either physically observed from a public road where possible or verified through WMD consumptive water-use permits (CUPs). Selected data for each agricultural field were compiled in an ArcGIS shapefile attribute table for an active seasonal or annual crop. Attribute data collected for each field included crop type, irrigation system, and primary water source. Crops were generalized and assigned to one of six primary categories: row crops, fruit crops, field crops, nursery and sod, all other irrigated land, and nonirrigated land. Nonirrigated lands include fallow and abandoned fields or crops associated with agricultural practices such as cover crops. Irrigation systems were generalized and assigned to one of three primary categories: micro-, sprinkler, and flood-seepage irrigation. Water sources were groundwater, surface water, reclaimed water, or a combination of these.
The irrigated land-use maps created by the FDACS were used by the USGS as base maps during field verification. Each irrigated field shown on a base map was either physically observed or a CUP was checked; after field verification, modifications were made to the working base maps when needed. Once the acreage was totaled by crop type for each county from the working base map, that acreage was compared to the totals developed by FDACS. The FSAID and USGS verified database and shapefiles were compared, and when the differences in acreage were greater than 5 percent for a county, the data from the field verification were checked to see if new acreage should be added or if acreage on the FDACS base map should be changed to nonirrigated acreage. This was especially true when citrus fields were labeled as active on the FDACS base maps but were observed as abandoned during the field verifications. If obvious differences were observed between the base maps and the data collected during field verifications, then changes were made to the base map even if acreage differences were less than 5 percent.
While it is difficult to directly compare the USGS estimates tabulated from the verified acreage totals compiled between 2013 and 2021 with the acreage totals published in the FDACS annual summaries and the U.S. Department of Agriculture Census of Agriculture reports, the field-verified results can be compared with other published datasets for Florida. Because of differences in reporting years of data, the methods used to compile or tabulate such data, and the overlap of growing seasons, comparisons must be viewed with caution. Beginning with Osceola County, the values compiled by the USGS for the entire county (for fall 2013 and spring 2014) were 6 percent lower than those published by the USDA for 2012 and 25 percent lower than those for 2017. For the most recently verified county, Miami-Dade, the values compiled by the USGS for 2019–21 were about 1 percent lower than those published by the USDA for 2012 and about 21 percent higher than those for 2017. Several factors contribute to the differences in totals for individual counties between the two datasets: (1) counties with dynamic changes in agriculture such as crop-acreage expansion or losses of acreage caused by urban development or diseases tend to have lower acreages in the USDA publications than those tabulated from the field verifications, (2) counties with large amounts of pasture, grasses, and hay irrigation reported to the USDA tend to have higher acreages reported in the USDA publications than those tabulated from field verifications. For example, in Polk County, the USDA reported 6,631 acres of irrigated pasture, grasses, or hay in 2012, but the field verification resulted in only 26 acres of irrigated pasture, grasses, or hay in 2016.
The results provided from this multiyear study can help increase the accuracy of irrigation water-use estimates by validating irrigated acreage estimates made from aerial or satellite imagery for Florida. The shapefiles produced as a result of this study provide a detailed spatial summary of the irrigated acreage for 55 counties verified between 2013 and 2021, and the acreage totals by crop type for each county provide information that can be used for estimating and projecting water use.
References Cited
Balmoral Group, 2015, Florida statewide agricultural irrigation demand—Final report: Florida Department of Agriculture, prepared by The Balmoral Group, Winter Park, Fla., 77 p., accessed October 2015 at https://www.fdacs.gov/content/download/61727/file/FSAID_II_Final_Report_The_Balmoral_Group_20150701.pdf.
Balmoral Group, 2017, Florida statewide agricultural irrigation demand, estimated agricultural water demand, 2015–2040: Florida Department of Agriculture, prepared by The Balmoral Group, Winter Park, Fla., 34 p., accessed October 2017 at https://www.fdacs.gov/content/download/77715/file/FSAID_IV_Water_Use_Estimates_06.23.2017.pdf.
Balmoral Group, 2018, Florida statewide agricultural irrigation demand, 2016–2040, agricultural water demands: Florida Department of Agriculture, prepared by The Balmoral Group, Winter Park, Fla., 35 p., accessed October 2018 at https://www.fdacs.gov/content/download/81553/file/FSAID-V-Water-Use-Estimates-June-2018.pdf.
Balmoral Group, 2019, Florida statewide agricultural irrigation demand, estimated agricultural water demand, 2017–2040: Florida Department of Agriculture, prepared by The Balmoral Group, Winter Park, Fla., 34 p., accessed October 2019 at https://www.fdacs.gov/content/download/84471/file/FSAID-VI-Water-Use-Estimates-Final-Report.pdf.
Balmoral Group, 2020, Florida statewide agricultural irrigation demand, estimated agricultural water demand, 2018–2045: Florida Department of Agriculture, prepared by The Balmoral Group, Winter Park, Fla., 30 p., accessed October 2020 at https://www.fdacs.gov/content/download/92578/file/FSAID-VII-Water-Use-Estimates-Final-Report.pdf.
Balmoral Group, 2021, Florida Statewide Agricultural Irrigation Demand 2019–2045 Agricultural Water Demands: Florida Department of Agriculture, prepared by The Balmoral Group, Winter Park, Fla., 29 p., accessed October 2021 at https://www.fdacs.gov/content/download/99809/file/FSAID-VIII-Water-Use-Estimates-Final-Report.pdf.
Dixon, J.F., and Christesson, K.R., 2022, GIS shapefile and related summary data describing irrigated agricultural land use for the 15 counties entirely within the Northwest Florida Water Management District, Florida, 2021: U.S. Geological Survey data release, https://doi.org/10.5066/P9WXJPA4.
Esri, 2020, ArcGIS Online, World Imagery, accessed February 4, 2021, at https://www.arcgis.com/home/item.html?id=10df2279f9684e4a9f6a7f08febac2a9.
Florida Department of Agriculture and Consumer Services [FDACS], 2017, Florida agriculture by the numbers, 2016: Tallahassee, Fla., Division of Marketing and Development, FDACS–P–01304, 180 p. [Also available at https://www.nass.usda.gov/Statistics_by_State/Florida/Publications/Annual_Statistical_Bulletin/FL_Agriculture_Book/2016/Florida_Agriculture_by_the_Num bers_Brochure_2016.pdf.]
Florida Department of Agriculture and Consumer Services [FDACS], 2020, Citrus Health Response Program (CHRP), accessed between October 2013 and September 2021 at https://www.fdacs.gov/Agriculture-Industry/Pests-and-Diseases/Plant-Pests-and-Diseases/Citrus-Health-Response-Program.
Florida Department of Environmental Protection, 2013, Annual status report on regional water supply planning: Tallahassee, Fla., Florida Department of Environmental Protection, Office of Water Policy, 16 p., accessed December 1, 2014, at https://floridadep.gov/water-policy/water-policy/content/water-supply.
Florida Department of Environmental Protection, 2020, 2019 Reuse inventory, Appendix G, p. 132–134, accessed December 12, 2018, at https://floridadep.gov/sites/default/files/2019_Reuse_Inventory_Report.pdf.
Florida Department of Transportation Surveying and Mapping Office Geographic Mapping Section, 1999, Florida Land use, cover and forms classification system, accessed February 4, 2021, at https://www.fdot.gov/docs/default-source/geospatial/documentsandpubs/fluccmanual1999.pdf.
Florida Senate, 2012, 2012 Florida Statutes, Chapter 570, Section 085, accessed February 4, 2021, at https://www.flsenate.gov/Laws/Statutes/2012/Chapter570/All.
Izuno, F.T., and Haman, D.Z., 1987, Basic irrigation terminology: Gainesville, Fla., University of Florida, Institute of Food and Agricultural Sciences, Agricultural Engineering Fact Sheet AE–66, 5 p., February 4, 2021, at https://ufdcimages.uflib.ufl.edu/IR/00/00/45/16/00001/AE11500.pdf.
Marella, R.L., 1988, Water withdrawals, use, and trends in Florida, 1985: U.S. Geological Survey Water-Resources Investigations Report 88–4103, 43 p., accessed February 4, 2021, at https://doi.org/10.3133/wri884103.
Marella, R.L., 1992, Water withdrawals, use, and trends in Florida, 1990: U.S. Geological Survey Water-Resources Investigations Report 92–4140, 38 p., accessed February 4, 2021, at https://doi.org/10.3133/wri924140.
Marella, R.L., 1999, Water withdrawals, use, discharge, and trends in Florida, 1995: U.S. Geological Survey Water-Resources Investigations Report 99–4002, 90 p., accessed February 4, 2021, at https://doi.org/10.3133/wri994002.
Marella, R.L., 2004, Water withdrawals, use, discharge, and trends in Florida, 2000: U.S. Geological Survey Scientific Investigations Report 2004–5151, 136 p., accessed February 4, 2021, at https://doi.org/10.3133/sir20045151.
Marella, R.L., 2009, Water withdrawals, use, and trends in Florida, 2005: U.S. Geological Survey Scientific Investigations Report 2009–5125, 49 p., accessed February 4, 2021, at https://doi.org/10.3133/sir20095125.
Marella, R.L., 2014, Water withdrawals, use, and trends in Florida, 2010: U.S. Geological Survey Scientific Investigations Report 2014–5088, 59 p., accessed February 4, 2021, at https://doi.org/10.3133/sir20145088.
Marella, R.L., 2020, Water withdrawals, use, and trends in Florida, 2015: U.S. Geological Survey Scientific Investigations Report 2019–5147, 52 p., accessed February 4, 2021, at https://doi.org/10.3133/sir20195147.
Marella, R.L., Berry, D.R., and Dixon, J.F., 2017a, Agricultural irrigated land-use inventory for Polk County, Florida, 2016: U.S. Geological Survey Open-File Report 2017–1082, 14 p., accessed February 4, 2021, at https://doi.org/10.3133/ofr20171082.
Marella, R.L., Berry, D.R. and Dixon, J.F., 2017b, GIS data and tables associated with irrigated agricultural land use survey in Polk County, Florida, 2016: U.S. Geological Survey data release, https://doi.org/10.5066/F76W98BN.
Marella, R.L., and Dixon, J.F., 2014, Agricultural irrigated land-use inventory for Osceola County, Florida, October 2013–April 2014: U.S. Geological Survey Open-File Report 2014–1257, 8 p., accessed February 4, 2021, at https://doi.org/10.3133/ofr20141257.
Marella, R.L., and Dixon, J.F., 2015, Agricultural irrigated land-use inventory for Jackson, Calhoun, and Gadsden Counties in Florida, and Houston County in Alabama, 2014: U.S. Geological Survey Open-File Report 2015–1170, 14 p., accessed February 4, 2021, at https://doi.org/10.3133/ofr20151170.
Marella, R.L., Dixon, J.F., and Berry, D.R., 2016, Agricultural irrigated land-use inventory for the counties in the Suwannee River Water Management District in Florida, 2015: U.S. Geological Survey Open-File Report 2016–1111, 18 p., https://doi.org/10.3133/ofr20161111.
Marella, R.L., Dixon, J.F., and Berry, D.R., 2017, GIS data and tables pertaining to the agricultural irrigated land-use inventory for Escambia, Santa Rosa, and Okaloosa Counties in Florida, 2016: U.S. Geological Survey data release, https://doi.org/10.5066/F7BK19MR.
Marella, R.L., Dixon, J.F., and Christesson, K.R., 2020a, GIS shapefile and related summary data describing irrigated agricultural land-use in Citrus, Hernando, Pasco, and Sumter Counties, Florida for 2019: U.S. Geological Survey data release, https://doi.org/10.5066/P9B1LAX0.
Marella, R.L., Dixon, J.F., and Christesson, K.R., 2020b, GIS shapefile and related summary data describing irrigated agricultural land-use in Hendry and Palm Beach Counties, Florida for 2019: U.S. Geological Survey data release, https://doi.org/10.5066/P9OUNVOK.
Marella, R.L., Dixon, J.F., and Christesson, K.R., 2021, GIS shapefile and related summary data describing irrigated agricultural land-use in Broward and Miami-Dade Counties, Florida for 2019–2021: U.S. Geological Survey data release, https://doi.org/10.5066/P9GGUWNQ.
Marella, R.L., Dixon, J.F., and Christesson, K.R., 2022, GIS shapefile and related summary data describing irrigated agricultural land use for Lake, Marion, and Orange Counties, Florida for 2020: U.S. Geological Survey data release, https://doi.org/10.5066/P9MSL29L.
Marella, R.L., Dixon, J.F., Christesson, K.R., and Pazmiño-Hernandez, M., 2022, GIS shapefile and related summary data describing irrigated agricultural land use for the 14 counties fully or partially within the Suwannee River Water Management District Florida for 2020: U.S. Geological Survey data release, https://doi.org/10.5066/P99UO2S2.
Marella, R.L., Dixon, J.F., and Reich, J.F., 2018a, GIS shapefile and related summary data describing irrigated agricultural land use in Collier County, Florida for the 2017 growing season: U.S. Geological Survey data release, https://doi.org/10.5066/F77P8XBC.
Marella, R.L., Dixon, J.F., and Reich, J.F., 2018b, GIS shapefile and related summary data describing irrigated agricultural land use in Glades County, Florida for the 2017 growing season: U.S. Geological Survey data release, https://doi.org/10.5066/F73X85KK.
Marella, R.L., Dixon, J.F., and Reich, J.F., 2018c, GIS shapefile and related summary data describing irrigated agricultural land use in Highlands County, Florida for the 2017 growing season: U.S. Geological Survey data release, https://doi.org/10.5066/F7CF9P1N.
Marella, R.L., Dixon, J.F., and Reich, J.F., 2018d, GIS shapefile and related summary data describing irrigated agricultural land use in Martin County, Florida for the 2017 growing season: U.S. Geological Survey data release, https://doi.org/10.5066/F7057DV5.
Marella, R.L., Dixon, J.F., and Reich, J.F., 2018e, GIS shapefile and related summary data describing irrigated agricultural land use in Okeechobee County, Florida for the 2017 growing season: U.S. Geological Survey data release, https://doi.org/10.5066/F7VD6XCW.
Marella, R.L., Dixon, J.F., and Reich, J.F., 2018f, GIS shapefile and related summary data describing irrigated agricultural land use in St Lucie County, Florida for the 2017 growing season: U.S. Geological Survey data release, https://doi.org/10.5066/F7QN65P0.
Marella, R.L., Dixon, J.F., and Reich, J.F., 2019a, GIS shapefile and related summary data describing irrigated agricultural land use in Charlotte County, Florida for the 2018 growing season (ver. 1.1, May 2019): U.S. Geological Survey data release, https://doi.org/10.5066/P9KFRMKT.
Marella, R.L., Dixon, J.F., and Reich, J.F., 2019b, GIS shapefile and related summary data describing irrigated agricultural land use in DeSoto County, Florida for the 2018 growing season: U.S. Geological Survey data release, https://doi.org/10.5066/P9H830JB.
Marella, R.L., Dixon, J.F., and Reich, J.F., 2019c, GIS shapefile and related summary data describing irrigated agricultural land use in Hardee County, Florida for the 2018 growing season: U.S. Geological Survey data release, https://doi.org/10.5066/P9VDG4OT.
Marella, R.L., Dixon, J.F., and Reich, J.F., 2019d, GIS shapefile and related summary data describing irrigated agricultural land use in Hillsborough County, Florida for the 2018 growing season (ver. 1.1, May 2019): U.S. Geological Survey data release, https://doi.org/10.5066/P9ZNRQWV.
Marella, R.L., Dixon, J.F., and Reich, J.F., 2019e, GIS shapefile and related summary data describing irrigated agricultural land use in Lee County, Florida for the 2018 growing season (ver. 1.1, May 2019): U.S. Geological Survey data release, https://doi.org/10.5066/P94L8RNI.
Marella, R.L., Dixon, J.F., and Reich, J.F., 2019f, GIS shapefile and related summary data describing irrigated agricultural land use in Manatee County, Florida for the 2018 growing season: U.S. Geological Survey data release, https://doi.org/10.5066/P9UL4GY1.
Marella, R.L., Dixon, J.F., and Reich, J.F., 2019g, GIS shapefile and related summary data describing irrigated agricultural land use in Sarasota County, Florida for the 2018 growing season: U.S. Geological Survey data release, https://doi.org/10.5066/P9P8QPRP.
Northwest Florida Water Management District [NWFWMD], 2021, ePermit portal, accessed between October 2013 and June 2022 at https://permitting.sjrwmd.com/nwep/#/ep.
Smajstrla, A.G., and Zazueta, F.S., 1995, Estimating crop irrigation requirements for irrigation system design and consumptive use permitting: Gainesville, Fla., University of Florida, Agricultural and Biological Engineering Department, Document AE257, 4 p., accessed February 4, 2021, at https://itc.tamu.edu/files/2018/05/AE257.pdf.
South Florida Water Management District [SFWMD], 2020, SFWMD geospatial open data, accessed February 4, 2021, at https://geo-sfwmd.hub.arcgis.com/.
South Florida Water Management District [SFWMD], 2021, ePermitting, accessed between October 2013 and September 2021 at https://my.sfwmd.gov/ePermitting/PopulateLOVs.do?flag=1.
Southwest Florida Water Management District [SWFWMD], 2020, Southwest Florida Water Management District Geospatial Open Data Portal, accessed February 4, 2021, at https://data-swfwmd.opendata.arcgis.com/.
Southwest Florida Water Management District [SWFWMD], 2021, Water Management Information System, Water Use Permit Information, accessed between October 2013 and September 2021 at http://www18.swfwmd.state.fl.us/search/search/searchwupsimple.aspx.
St. Johns River Water Management District [SJRWMD], 2020, St. Johns River Water Management District (SJRWMD) Geospatial Open Data, accessed February 4, 2021, at https://data-floridaswater.opendata.arcgis.com/.
St. Johns River Water Management District [SJRWMD], 2021, ePermit portal, accessed between October 2013 and September 2021 at https://permitting.sjrwmd.com/ep/#/ep.
Suwannee River Water Management District [SRWMD], 2021, ePermit portal, accessed between October 2013 and September 2021 at https://permitting.sjrwmd.com/srep/#/ep.
U.S. Department of Agriculture [USDA], 1999, 1997 Census of Agriculture—Florida, State and county data: U.S. Department of Agriculture, National Agricultural Statistics Service, Geographic Area Series, v. 1, part 9 [AC97-A-9], 444 p., accessed February 4, 2021, at https://agcensus.library.cornell.edu/wp-content/uploads/1997-Florida-1997-01-full-2.pdf /.
U.S. Department of Agriculture [USDA], 2004, 2002 Census of Agriculture—Florida, State and county data: U.S. Department of Agriculture, National Agricultural Statistics Service, Geographic Area Series, v. 1, part 9 [AC-02-A-9], 485 p., accessed February 4, 2021, at https://agcensus.library.cornell.edu/wp-content/uploads/2002-Florida-01-full.pdf.
U.S. Department of Agriculture [USDA], 2009, 2007 Census of Agriculture—Florida, State and county data: U.S. Department of Agriculture, National Agricultural Statistics Service, Geographic Area Series, v. 1, part 9 [AC-07-A-9], 558 p., plus appendixes, accessed February 4, 2021, at https://agcensus.library.cornell.edu/wp-content/uploads/2007-Florida-flv1.pdf.
U.S. Department of Agriculture [USDA], 2014, 2012 Census of Agriculture—Florida, State and county data: U.S. Department of Agriculture, National Agricultural Statistics Service, Geographic Area Series, v. 1, part 9 [AC-12-A-9], 549 p., plus appendixes, accessed February 4, 2021, at https://agcensus.library.cornell.edu/wp-content/uploads/2012-Florida-flv1.pdf.
U.S. Department of Agriculture [USDA], 2019, 2017 Census of Agriculture—Florida, State and county data: U.S. Department of Agriculture, National Agricultural Statistics Service, Geographic Area Series, v. 1, part 9 [AC-17-A-9], 661 p., plus appendixes, accessed February 4, 2021, at https://www.nass.usda.gov/Publications/AgCensus/2017/Full_Report/Volume_1,_Chapter_1_State_Level/Florida/flv1.pdf.
U.S. Department of Agriculture, Soil Conservation Service, 1970, Irrigation water requirement (Blaney-Criddle revised): Washington, D.C., U.S. Department of Agriculture, Soil Conservation Service, Technical Release 21, 88 p., accessed February 4, 2021, at https://archive.org/details/CAT31345344/page/n1/mode/2up.
U.S. Department of Commerce, 1984, 1982 Census of Agriculture—Florida, State and county data: U.S. Department of Commerce, Bureau of the Census, Geographic Area Series, v. 1, part 9 [AC82-A-9], 355 p., plus appendixes, accessed February 4, 2021, at https://agcensus.library.cornell.edu/wp-content/uploads/1982-Florida-1982-01-full.pdf.
U.S. Department of Commerce, 1989, 1987 Census of Agriculture—Florida, State and county data: U.S. Department of Commerce, Bureau of the Census, Geographic Area Series, v. 1, part 9 [AC87-A-9], 390 p., plus appendixes, accessed February 4, 2021, at https://agcensus.library.cornell.edu/wp-content/uploads/1987-Florida-1987-01-full.pdf.
U.S. Department of Commerce, 1994, 1992 Census of Agriculture—Florida, State and county data: U.S. Department of Commerce, Bureau of the Census, Geographic Area Series, v. 1, part 9 [AC92-A-9], 439 p., accessed February 4, 2021, at https://agcensus.library.cornell.edu/census_parts/1992-florida/.
Conversion Factors
Inch/Pound to SI
Abbreviations
CHRP
Citrus Health Response Program (Florida Department of Agriculture and Consumer Services)
CNA
could not access
CNV
could not verify
CUP
consumptive water-use permit
FDACS
Florida Department of Agriculture and Consumer Services
FSAID
Florida Statewide Agricultural Irrigation Demand
IFAS
Institute of Food and Agricultural Science (University of Florida)
ILG
Irrigated Lands Geodatabase
NWFWMD
Northwest Florida Water Management District
OAWP
Office of Agricultural Water Policy (Florida Department of Agriculture and Consumer Services)
SFWMD
South Florida Water Management District
SJRWMD
St. Johns River Water Management District
SRWMD
Suwannee River Water Management District
SWFWMD
Southwest Florida Water Management District
USDA
U.S. Department of Agriculture
USGS
U.S. Geological Survey
WMD
water management district
For more information about this publication, contact
Director, Caribbean-Florida Water Science Center
U.S. Geological Survey
4446 Pet Lane, Suite 108
Lutz, FL 33559
For additional information, visit
https://www.usgs.gov/centers/car-fl-water
Publishing support provided by
Lafayette Publishing Service Center
Disclaimers
Any use of trade, firm, or product names is for descriptive purposes only and does not imply endorsement by the U.S. Government.
Although this information product, for the most part, is in the public domain, it also may contain copyrighted materials as noted in the text. Permission to reproduce copyrighted items must be secured from the copyright owner.
Suggested Citation
Marella, R.L., and Dixon, J.F., 2022, Verification of irrigated agricultural land acreage in 55 counties in Florida, 2013–21: U.S. Geological Survey Scientific Investigations Report 2022–5098, 31 p., https://doi.org/10.3133/sir20225098.
ISSN: 2328-0328 (online)
Study Area
| Publication type | Report |
|---|---|
| Publication Subtype | USGS Numbered Series |
| Title | Verification of irrigated agricultural land acreage in 55 counties in Florida, 2013–21 |
| Series title | Scientific Investigations Report |
| Series number | 2022-5098 |
| DOI | 10.3133/sir20225098 |
| Publication Date | November 30, 2022 |
| Year Published | 2022 |
| Language | English |
| Publisher | U.S. Geological Survey |
| Publisher location | Reston. VA |
| Contributing office(s) | Caribbean-Florida Water Science Center |
| Description | Report: viii, 31 p.; 21 Data Releases |
| Country | United States |
| State | Florida |
| Online Only (Y/N) | Y |