

Flood-Inundation Maps Created Using a Synthetic Rating Curve for a 10-Mile Reach of the Sabinal River and a 7-Mile Reach of the West Sabinal River Near Utopia, Texas, 2021
Links
- Document: Report (2.52 MB pdf) , HTML , XML
- Related Work: Fact Sheet 2023–3001 - Flood Warning Toolset for the Sabinal River Near Utopia, Texas
- Data Release: USGS data release - Geospatial and model dataset for flood-Inundation maps in a 10-mile reach of the Sabinal River and a 7-mile reach of the West Sabinal River near Utopia, Texas, 2021
- Version History: Version History (txt)
- NGMDB Index Page: National Geologic Map Database Index Page (html)
- Download citation as: RIS | Dublin Core
Acknowledgments
The author wishes to thank the Bandera County River Authority and Groundwater District and the Texas Water Development Board for their continued support of the operation and maintenance of the streamgages used for this study. Special thanks are also given to the Interagency Flood Risk Management team for their continued support of the Flood Decision Support Toolbox.
Abstract
In 2021, the U.S. Geological Survey (USGS), in cooperation with the Bandera County River Authority and Groundwater District and the Texas Water Development Board, studied floods to produce a library of flood-inundation maps for the Sabinal River near Utopia, Texas. Digital flood-inundation maps were created for a 10-mile reach of the Sabinal River from USGS streamgage 08197936 Sabinal River below Mill Creek near Vanderpool, Tex., at the upstream boundary of the study reach, to USGS streamgage 08197970 Sabinal River at Utopia, Tex. (hereinafter referred to as the “Utopia gage”), at the downstream boundary of the study reach, and for a 7-mile reach of the West Sabinal River. The flood-inundation maps depict estimates of the areal extent and depth of flooding corresponding to selected gage heights (the water-surface elevation at a streamgage, commonly referred to as “stage”) at the Utopia gage. Water-surface elevations were computed for the stream reach by means of a two-dimensional unsteady-state diffusion wave model with the U.S. Army Corps of Engineers Hydrologic Engineering Center River Analysis System program. A synthetic stage-discharge rating curve at the Utopia gage was developed using a regional regression equation to construct the model boundary condition inputs, and the upper bound of the stage-discharge relation was matched to a major flood event in July 2002. The hydraulic model was used to compute water-surface elevations for 35 stages at 0.5-foot (ft) increments referenced to the Utopia gage datum and ranging from 11 ft (near bankfull) to 28 ft (estimated peak stage during the July 2002 flood event). These flood-inundation maps, in conjunction with the real-time stage data from the Utopia gage, are intended to help guide the public in taking individual safety precautions and provide emergency management personnel with a tool to efficiently manage emergency flood operations and postflood recovery efforts.
Introduction
The town of Utopia is on the east bank of the Sabinal River in a flash-flood-prone area of central Texas along the Balcones Escarpment (Caran and Baker, 1986; Lee, 2016) (fig. 1). The Medina River flows through Bandera, Tex., in this same flash-flood-prone area (Choi and Engel, 2019). In 2019, as part of the flood-mitigation efforts for the region that includes Utopia and Bandera, the U.S. Geological Survey (USGS), in cooperation with the Bandera County River Authority and Groundwater District and the Texas Water Development Board, developed a flood-preparedness toolset for the Medina River near Bandera, which included expanding the existing network of USGS streamgages and creating a digital flood-inundation map library (Choi and Engel, 2019; Engel and Choi, 2019). It was recognized that a flood-preparedness toolset similar to the one developed for Bandera was needed for the residents and many visitors of Utopia. Historically, residents and visitors of Utopia have experienced several severe floods, including a major flood event in July 2002 that claimed 12 lives in central Texas (Slade and Patton, 2003), including 1 in Utopia (Cosgrove, 2002). Near Utopia, the computed peak discharge of the devasting 2002 flood was 108,000 cubic feet per second (ft3/s) 13 miles (mi) downstream from the study area at USGS streamgage 08198000 Sabinal River near Sabinal, Tex. (hereinafter referred to as the “Sabinal gage”) (U.S. Geological Survey, 2023b). The median daily discharge value at the Sabinal gage is 23 ft3/s (median of the daily mean discharge values from October 1, 1942, to July 19, 2021).
In 2021, the USGS, in cooperation with the Bandera County River Authority and Groundwater District and the Texas Water Development Board, developed a hydraulic model to produce a library of digital flood-inundation maps for a 10-mi reach of the Sabinal River and a 7-mi reach of the West Sabinal River near Utopia. Prior to this study, emergency responders in Bandera and Uvalde, Tex., and surrounding communities relied on several online information sources to make decisions on how to best alert the public and mitigate flood damages. These sources of information include the USGS National Water Information System (NWIS; https://waterdata.usgs.gov/nwis), the Flood Factor online tool (https://floodfactor.com/city/utopia-texas/4874576_fsid/flood), and the Uvalde County Contrail website (https://uvalde.onerain.com/). Data for the Sabinal gage, including historical gage heights (stages) and discharges, are available through the NWIS web interface and the National Water Dashboard (U.S. Geological Survey, 2022, 2023c). Gage height, which is the water-surface elevation above an arbitrary reference point referred to as the “datum” at a streamgage, is commonly referred to as “stage,” particularly in the context of flood-inundation studies. For example, a stream is described as being in flood stage when the stage exceeds a certain water-surface elevation (stage data are commonly converted to water-surface elevations referenced to the North American Vertical Datum of 1988 [NAVD 88]).
Although stage data from USGS streamgages are useful for residents living near a streamgage, these data are of little use to residents farther upstream or downstream because the water-surface elevation is not constant along the stream reach. At locations distant from the streamgage, it is difficult to convert the stage into water depth and estimate the areal extent of ongoing or possible flooding in response to large runoff events. One way to address these information gaps is to produce a library of digital flood-inundation maps that are referenced to the corresponding range of stages recorded at the streamgage. By referring to the appropriate map, emergency responders can discern indicators of the severity of flooding (such as depth of water and areal extent), identify roads that are or will soon be flooded, and make plans for notification or evacuation of residents. In addition, the visualization of flood inundation provides residents with additional tools to take appropriate precautions.
Purpose and Scope
The purpose of this report is to describe the development of a flood-inundation model and consequent digital maps for parts of Uvalde County and Bandera County near Utopia, adjacent to a 10-mi reach of the Sabinal River and a 7-mi reach of the West Sabinal River (fig. 1). As part of the study, a new USGS streamgage, 08197970 Sabinal River at Utopia, Tex. (hereinafter referred to as the “Utopia gage”), was installed (fig. 1, table 1). The maps were produced for flood levels referenced to the continuous stage data recorded at the Utopia gage. Thirty-five digital flood-inundation maps were generated at 0.5-foot (ft) increments ranging in stage from 11 to 28 ft. The 11-ft stage is approximately bankfull for the Sabinal River at Utopia. The maximum simulated stage of 28 ft corresponds to the approximate peak water-surface elevation observed during the July 2002 flood. The map library identifies areas likely to be flooded throughout a range of high-discharge conditions depending on the stage. Real-time continuous stage data for the Utopia gage can be used to select which flood-inundation map is of interest during a flood.
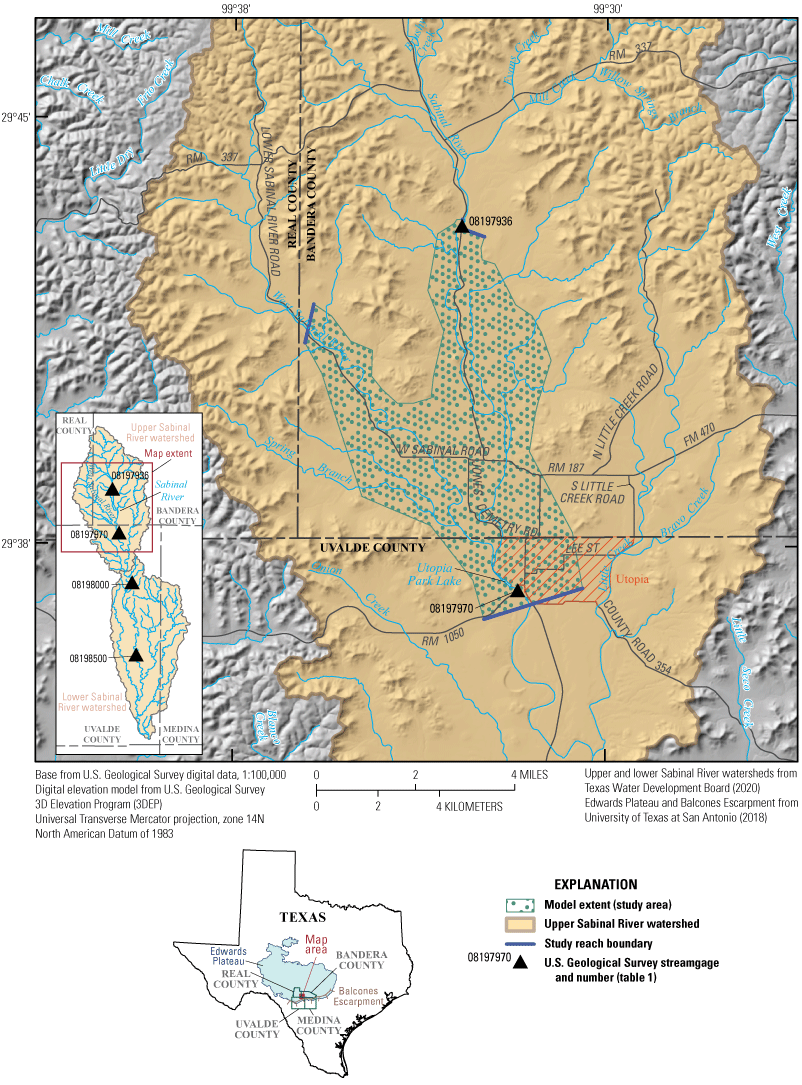
Location of the study reach on the Sabinal River and the West Sabinal River near Utopia, Texas, and locations of the nearest U.S. Geological Survey streamgages.
Table 1.
Information on the reference U.S. Geological Survey (USGS) streamgage 08197970 Sabinal River at Utopia, Texas, for the digital flood-inundation maps and nearby USGS streamgages on the Sabinal River, Bandera and Uvalde Counties, Tex.[Streamgage location is shown in figure 1. mi2, square mile; ft3/s, cubic foot per second; NAVD 88, North American Vertical Datum of 1988; ft, foot; Tex., Texas; --, not available. Data from U.S. Geological Survey, 2023c]
Water year is the 12-month period from October 1 of one year through September 30 of the following year and is designated by the calendar year in which it ends.
Gage-datum elevations are reproduced as published (U.S. Geological Survey, 2023c).
Study Area Description
Uvalde County and Bandera County (fig. 1) are in central Texas; in 2020, their respective populations were 24,564 and 20,851 (U.S. Census Bureau, 2020a, c). The town of Utopia is in Uvalde County along the Sabinal River, near the county line with Bandera County (fig. 1). The estimated population of Utopia is 225 (U.S. Census Bureau, 2020b). The area in and near Utopia is a popular recreation destination that draws a large number of visitors year round; camping along the Sabinal River and swimming in its clear spring-fed waters are popular activities (Cahalan, 2022). The study reach of the Sabinal River and the West Sabinal River is near the southeast terminus of the Edwards Plateau (Hill, 1901) (fig. 1), with landscapes composed typically of Juniperus ashei (Ashe juniper), Quercus spp. (oak), and Prosopis spp. (mesquite) over semiarid and rugged limestone terrain (Griffith and others, 2007). The area is located at the southeast tip of the region referred to locally as the “Texas Hill Country,” which is bounded by the Balcones Escarpment (fig. 1) and historically has been one of the most flood-prone regions of the United States (Slade and Patton, 2003). Large flood events can develop quickly as a result of complex meteorological conditions, including tropical storms and hurricanes that sweep inland across the area from the Gulf of Mexico and terrain-related effects of the Balcones Escarpment that cause rapid runoff (Caran and Baker, 1986; Nielsen and others, 2016). The upstream part of the watershed terrain is steep—ranging from about 6- to 8-percent slopes—with thin or underdeveloped topsoil, which makes the area conducive to high-magnitude flash flooding (Caran and Baker, 1986). The watershed slope used in the model for the study area is approximately 2–4 percent, with steeper slopes farther upstream in the headwaters. The drainage area is 55.8 square miles (mi2) at the upstream boundary of the study reach on the Sabinal River, which corresponds to USGS streamgage 08197936 Sabinal River below Mill Creek near Vanderpool, Tex. (hereinafter referred to as the “Vanderpool gage”) (fig. 1, table 1). The drainage area at the upstream boundary of the West Sabinal River is 19.6 mi2. The West Sabinal River flows into the Sabinal River in Utopia at the Utopia Park Lake 500 ft upstream from the Utopia gage; the streamgage is on the Ranch to Market Road 1050 bridge in the downstream part of the study reach (fig. 1). The drainage area at the Utopia gage is 130 mi2 (table 1). The Sabinal River generally flows south in the study area. The study area includes a 10-mi reach of the Sabinal River that flows from the Vanderpool gage through Utopia to 0.5 mi downstream from the Utopia gage, as well as a 7-mi reach of the West Sabinal River in the upper Sabinal River watershed (fig. 1).
Previous Studies
The study reach on the Sabinal River spans two counties: Bandera County at the upstream extent and Uvalde County at the downstream extent. Thus, there are two Federal Emergency Management Agency (FEMA) flood insurance studies (FISs) that are effective in the area. The FEMA FIS in effect at the time of model development for the Sabinal River in Bandera County was made effective on May 15, 2020 (Federal Emergency Management Agency, 2020). In the FIS, the analysis to determine flood elevations on the Sabinal River was dated back to 1988. Also, peak discharge values were not provided in the FIS for the Sabinal River in Bandera County because of a lack of large population centers within the county boundary. The FEMA FIS for Uvalde County, which was made effective on November 4, 2010, does not include the Sabinal River at all in the study area (Federal Emergency Management Agency, 2011).
Creation of Digital Flood-Inundation Map Library
In 2014, the Interagency Flood Risk Management (InFRM) initiative was sponsored by FEMA to allow Federal partners across FEMA Region 6—comprising the States of Arkansas, Louisiana, New Mexico, Oklahoma, and Texas—to work toward the mission of reducing long-term flood risk in the region (U.S. Geological Survey, 2015). The InFRM partners are four Federal agencies: FEMA, the U.S. Army Corps of Engineers (USACE), the USGS, and the National Weather Service. The InFRM initiative operates under the Integrated Water Resources Science and Services, which is a consortium of Federal agencies with complementary missions in water science, observation, management, and prediction (U.S. Geological Survey, 2021a). One of the focus areas of the InFRM initiative is flood-inundation mapping through the InFRM Flood Decision Support Toolbox (FDST) (U.S. Geological Survey, 2021b). The FDST is the online platform to display digital flood-inundation maps that are created by standardized procedures (U.S. Geological Survey, 2020a, b).
Tasks specific to the development of the flood-inundation maps for Utopia were as follows:
-
• install a new USGS streamgage (the Utopia gage) to provide real-time stage data at the location,
-
• collect bathymetric data in the stream channel,
-
• collect hydraulic-structure data for culverts within the footprint of the flood-inundation maps,
-
• estimate initial energy-loss factors (roughness coefficients) in the stream channel and floodplains by using available land cover data,
-
• determine the range of model stages at the Utopia gage and estimate discharge for this range of conditions by using a regionalized discharge estimation method presented by Asquith and others (2013),
-
• compute water-surface elevations for the range of conditions by using the USACE Hydrologic Engineering Center River Analysis System (HEC–RAS) computer program (U.S. Army Corps of Engineers, 2016a, b, c),
-
• produce estimated digital flood-inundation maps at various stages by using the geographic information system extension of the HEC–RAS computer program, RAS Mapper (U.S. Army Corps of Engineers, 2016a, b, c), and ArcGIS (Esri, 2022), and
-
• prepare flood-inundation maps as depth grids that provide the extent and the depth of floodwaters for display on the InFRM FDST flood-inundation mapping application (U.S. Geological Survey, 2021b).
Hydraulic Model
The 35 digital flood-inundation maps created in this study were computed by using HEC–RAS, version 5.0.7 (U.S. Army Corps of Engineers, 2016a, b, c). The HEC–RAS model is applicable to a wide range of scenarios, including regulated streams, natural (unregulated) streams, and constructed channels (U.S. Army Corps of Engineers, 2016c). The HEC–RAS model features one- and two-dimensional direct and iterative “solvers” to simulate water-surface elevations under steady-state (gradually varied) and unsteady-state (rapidly varied) flow conditions (U.S. Army Corps of Engineers, 2016c). For the study, a two-dimensional unsteady-state diffusion wave modeling approach was selected as the best method to model the inundation pattern in the floodplain area between the Sabinal River and the West Sabinal River. The diffusion wave equation was selected as the governing equation because of its faster computation capability and stability compared to the alternative shallow water equation (U.S. Army Corps of Engineers, 2016b).
Hydrologic Data
The study reach includes the Utopia gage, which serves as the reference gage for the digital flood-inundation map layers. The study reach extends upstream to the Vanderpool gage (fig. 1, table 1). The Utopia gage was installed for the study and has been in operation since January 15, 2020. The stage is measured continuously every 5 minutes at the Utopia gage, transmitted hourly to a satellite, and then made available on the internet through the USGS NWIS web interface and the National Water Dashboard (U.S. Geological Survey, 2022, 2023c). Continuous records of stage data from the Utopia gage can be converted to water-surface elevations referenced to NAVD 88 by adding 1,331.9 ft (table 1). Continuous records of discharge for the Utopia gage are not available as of the writing of this report (May 2022) because of the short monitoring period of the gage and persistent dry conditions since the gage was installed. After sufficient discrete discharge measurements have been made throughout the entire range of expected conditions, a stage-discharge relation (hereinafter referred to as a “rating curve”) will be developed and used to compute discharge.
The Vanderpool gage has been in operation since September 26, 2013. The stage at the Vanderpool gage is measured every 15 minutes. Stage data from the Vanderpool gage can be converted to water-surface elevations referenced to NAVD 88 by adding 1,520.01 ft (table 1). Continuous records of discharge for the Vanderpool gage are computed from a stage-discharge rating curve and are available on the internet through the USGS NWIS web interface and the National Water Dashboard (U.S. Geological Survey, 2022, 2023c). The upper bound of the rating curve range is at the stage 3.02 ft and the discharge 415 ft3/s (as of May 2022).
Synthetic Rating Curve
A stage-discharge rating curve shows a relation between the stage and the corresponding discharge in a channel cross section near a given streamgage. The relation is different for every cross section measured in a channel, as it is a function of geometry and time. The USGS makes routine and event-driven visits to streamgages to make discharge measurements, which are used to develop and adjust rating curves as changes in the stream may affect the relation between stage and discharge. The rating curve is a key element for reporting real-time discharge data for different stage values. It is also a key element for computational modeling because the roughness model parameters are adjusted to match the rating curve for accurate model calibration. Background information regarding how a stage-discharge rating curve is developed for a USGS streamgage can be found in Rantz and others (1982).
Few hydrologic data useful for characterizing flood conditions have been collected at the Utopia gage at the time of this study (2022) because of its short period of record (installed on January 15, 2020; U.S. Geological Survey, 2023a) and a lack of storm events since the gage was installed. The highest stage recorded at the gage at the time of this study (2022) was 5.34 ft (May 1, 2021, at 14:45 central daylight time), which is lower than the 11 ft (near bankfull) stage that was estimated in this study. Abnormally dry conditions have prevailed since the start of this flood study, and the 60th percentile of the 5-minute stage data from March 29, 2020, to December 30, 2021 (the entire approved dataset as of April 28, 2022), was zero flow. Given the lack of storm events, observed data at the gage were not adequate to develop a full range rating curve needed to accurately estimate discharge from the stage. As an alternative, a synthetic rating curve was developed to calibrate the model at higher flows.
A synthetic rating curve is a useful tool for determining discharge for a stream stage at a streamgage site, particularly across similar geographic regions. Asquith and others (2013) presented a statistical method to estimate discharge for ungaged sites by using the characteristics of the channel cross section and regional climate factors for many parts of Texas. A regression equation was developed between the discharge statistics and the watershed characteristics for a large group of streamgages within different regions of Texas, and a regionalized discharge equation was developed on the basis of 17,700 discharge measurements from a total of 424 USGS streamgages in Texas (Asquith and others, 2013). A generalized additive regression model was applied for the regression of the data. The regression equation developed by Asquith and others (2013) is depicted in equation 1:
wherelog
= base-10 logarithm,
Q
= discharge in cubic meters per second,
A
= cross-sectional flow area in square meters,
B
= top width of the channel cross section in meters,
Ω
= the OmegaEM parameter (Asquith and Roussel, 2009) representing a generalized terrain and climate of the location,
f5 and f6
smooth functions of the indicated predictor variables determined by the location of the site, and
P
= mean annual precipitation in millimeters.
The regression equation shown in equation 1 translates the cross-sectional geometry and the regional terrain and climate parameters into discharge. In the equation, the cross-section geometry parameters, A and B, are functions of water-surface elevation at the gage. The terrain and climate parameter Ω is 0.33 for the study area (interpolating from fig. 3 in Asquith and Roussel [2009]). The smooth function f5 parameter is zero (interpolating from fig. 5 in Asquith and others [2013]). The mean annual precipitation in Uvalde County during 1857–2019 is 23.22 inches (Ochoa, 2020) (equivalent to 590 millimeters [eq. 1]). Using the mean annual precipitation of Uvalde County, the smooth function f6 parameter is 0.025 (interpolating from fig. 6 in Asquith and others [2013]). Two parameters, parameters A and B, are calculated for each selected simulated stage value, and the resulting discharge values from the regression equation are used as model input. The resulting relation between stage and discharge is used as a synthetic stage-discharge rating curve.
There are two upstream model boundaries in the study reach: on the Sabinal River at the Vanderpool gage and on the West Sabinal River approximately 7 mi upstream from the confluence at the town of Utopia (fig. 1). The computed discharge values from the regression equation for the Utopia gage (eq. 1) were proportionately divided between the two stream reaches according to the drainage area. The total drainage area of Sabinal River at the Utopia gage is 130 mi2 (table 1). The contributing area of the Sabinal River is 85 mi2 (about 65 percent of the total drainage area), and the contributing area of the West Sabinal River is 45 mi2 (about 35 percent of the total drainage area), which were computed using ArcGIS (Esri, 2022). The estimated discharge values for corresponding stages at the Utopia gage were divided on the basis of the drainage areas of the Sabinal River and the West Sabinal River, respectively (table 2). The estimated discharges at the upstream boundary of the Sabinal River study reach ranged from 4,190 to 50,100 ft3/s, and the estimated discharges at the upstream boundary of the West Sabinal River study reach ranged from 2,220 to 26,500 ft3/s (table 2).
Table 2.
Estimated discharges at the upstream boundaries of the Sabinal River and the West Sabinal River study reaches that were used in the hydraulic model and corresponding stages and water-surface elevations at U.S. Geological Survey streamgage 08197970 Sabinal River at Utopia, Texas.[ft, foot; NAVD 88, North American Vertical Datum of 1988; ft3/s, cubic foot per second]
Topographic and Bathymetric Data
All topographic data used in this study are referenced vertically to NAVD 88 and horizontally to the North American Datum of 1983. Cross-section elevation data were obtained from a digital elevation model (DEM) that was derived from light detection and ranging (lidar) data that were collected through the USGS 3D Elevation Program (U.S. Geological Survey, 2017). The data collection period for the DEM was from February 12, 2018, through March 22, 2018, which was a period of low flow that facilitated the collection of cross-section elevation data. During the data collection period, the mean stage at the Vanderpool gage was 0.39 ft, and the mean discharge at the gage was 1.79 ft3/s. Data collection, postprocessing, and quality assurance of the lidar data used in the DEM were completed by Merrick-Surdex Joint Venture in 2018 (Merrick-Surdex Joint Venture, 2018). The lidar data have a horizontal resolution of 1 meter and a vertical accuracy of plus or minus 42.8 centimeters at a 95-percent confidence level for the open terrain land cover category (root mean square error [RMSE] of 17.5 centimeters [Merrick-Surdex Joint Venture, 2018]).
Supplemental data that were not contained in the lidar DEM were collected by a channel cross-section survey and by hydraulic-structure surveys of culverts, including the dimensions and material of the culverts and upstream and downstream invert elevations. The channel cross section for the submerged part of the channel at the Utopia gage was surveyed by USGS field crews on March 5, 2020, to represent the stream channel in the model. Cross-sectional depths were measured by wading at the survey location. A surveying level system was used to measure the elevation of the channel bottom at the surveyed channel cross section. The cross-section geometry was added to the lidar DEM for modeling and was also used to calculate the estimated discharge by using the regionalized method described in Asquith and others (2013). Additional channel cross-section surveys other than at the Utopia gage location were not performed because the lidar DEM was considered to be sufficient to represent the channel geometry. This judgment was made because the lidar data were collected during a period of low flow when the mean discharge (as measured at the nearest upstream streamgage) was only 1.79 ft3/s; only a small part of the channel was submerged and not accounted for in the lidar data.
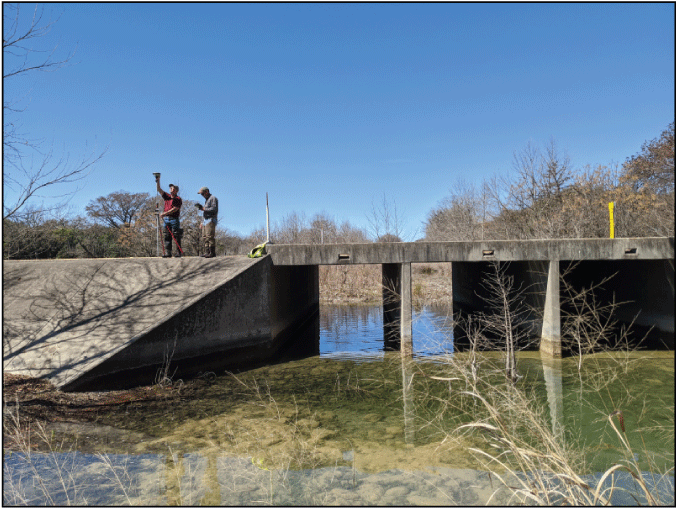
A hydraulic-structure survey of a culvert performed by U.S. Geological Survey (USGS) field crew at USGS streamgage 08197970 Sabinal River at Utopia, Texas, which is used for constructing the hydraulic model to create digital flood-inundation maps of the Sabinal River study area near Utopia, Tex. The view is toward the north from the right bank of the Sabinal River (photograph taken on March 5, 2020, by Namjeong Choi, U.S. Geological Survey).
Hydraulic Structures
Hydraulic structures can include features such as culverts, bridges, dams, and levees; culverts were the only type of hydraulic structures in the study area that needed to be surveyed. A total of 29 culverts were identified within the study area that might have the potential to affect water-surface elevations during floods along the stream. Nine of these 29 culverts were surveyed, including the culvert at the Ranch to Market Road 1050 bridge at the Utopia gage (fig. 1). The rest of the hydraulic structures were not surveyed because they either were on private property and not accessible or were weirs installed in the bed of the stream with known crest elevations. Hydraulic-structure geometry data were obtained from field surveys done on March 5, 2020, by USGS personnel using global navigation satellite systems with a real-time kinematic survey method (Rydlund and Densmore, 2012) (fig. 2). The survey results were used as input to the hydraulic model.
Energy-Loss Factors
Hydraulic analyses require the estimation of energy losses that result from frictional resistance exerted by a channel on flow. These energy losses are quantified by using the Manning’s roughness coefficient (Manning’s “n” value) (Chow, 1959). Initial Manning’s n values were selected on the basis of the 2016 National Land Cover Database dataset (Multi-Resolution Land Characteristics Consortium, 2016), as land cover data are often used to estimate surface roughness in hydraulic modeling (U.S. Army Corps of Engineers, 2022). The National Land Cover Database dataset is coordinated through the Multi-Resolution Land Characteristics Consortium, an interagency Federal Government collaboration. The land cover data that were used for the study area were from 30- by 30-meter grids (Multi-Resolution Land Characteristics Consortium, 2016).
The Sabinal River in the study area has a mixed bedrock and gravel channel bed (Mear, 1995). Vegetation has a large effect on the Manning’s n values used to characterize energy losses. Along the banks of the stream, Taxodium spp. (cypress trees) are common, and floodplains in the adjacent stream corridor consist of various types of vegetation, including grasses and trees such as Salix spp. (willow), Quercus spp. (oak), Ulmus spp. (elm), and Juniperus ashei (Ashe juniper) (Griffith and others, 2007). Farther from the stream, the floodplains are moderately sloped and dominated by shrubland and grassland interspersed with pastures and cultivated fields. The floodplains thus consist of mixed land use (table 3). The Manning’s n values were selected as the maximum values of the ranges of n values that are recommended by the USACE (table 2–1 in U.S. Army Corps of Engineers [2022]).
Table 3.
National Land Cover Database (Multi-Resolution Land Characteristics Consortium, 2016) land cover characteristics and Manning’s roughness coefficients (Manning’s n values) for the hydraulic model used to create digital flood-inundation maps of the Sabinal River study area near Utopia, Texas.[%, percent; --, not applicable]
The study area is composed of 30- by 30-meter land cover grid cells in total of 60,228. Percentages may not sum to 100 because of rounding.
Maximum values of the Manning's n value ranges are reproduced as published for various National Land Cover Database land cover types (U.S. Army Corps of Engineers, 2022).
Computation of Water-Surface Elevations
The HEC–RAS simulations for this study used the two-dimensional unsteady-state diffusion wave computation option. The input for the unsteady-state flow computation was 35 unsteady flow time series representing 35 different terminal discharges that correspond to 35 stages at the Utopia gage. In each time series, the discharge was gradually increased from zero to terminal discharge. The time series length, which corresponded with the model simulation time, was determined as 24 hours to achieve stable model solutions. The mean modeling grid size was 2,440 square meters, and the total number of grid cells was 22,200. The total area of the model domain is 54 square kilometers (the extent of the model domain is presented in fig. 1). The calculation time step was 30 seconds. The options of subcritical (tranquil) discharge and normal depth were selected for the downstream boundary conditions in the hydraulic model. The estimated mean slope of 0.0035 ft per foot (18.5 ft per mile) derived from the lidar DEM was assumed as a friction slope used for the normal depth boundary condition. The peak discharges that were used in the model are discussed in the “Hydrologic Data” section of this report.
The simulated water-surface elevations at the Utopia gage were compared to the water-surface elevations for given discharges from the synthetic rating curve (table 4); target water-surface elevations were determined from the synthetic rating curve. Differences between simulated water-surface elevations and target water-surface elevations for the 35 stages at the Utopia gage ranged from 2.2 to −0.7 ft with a median of 1.0 ft and an RMSE of 1.3 ft (table 4). A positive median value indicates that the model tends to overestimate water-surface elevations. Although the model was not calibrated to exactly reproduce observed data throughout the entire range, the model results agreed with the synthetic rating curve in an acceptable range to be qualified as a tier B model, given that the modeling guideline for the FDST maps suggests an RMSE no larger than 3 ft for a tier B model (U.S. Geological Survey, 2020a).
The maximum simulated stage, 28 ft, was chosen on the basis of the maximum observed water-surface elevation during a historical flood event on July 5, 2002, near the location of the Utopia gage. The 2002 flood was the largest peak discharge recorded at the Sabinal gage and at the downstream USGS streamgage 08198500 Sabinal River at Sabinal, Tex. (peak stage data accompanied with discharge has been collected since 1932 for both gages) (fig. 1, table 1). The water depth at the Utopia Community Park softball field near the Utopia gage was roughly estimated as 7 ft from a photograph that shows debris embedded in the backstop (fence) at the softball field (fig. 3). Based on the hydraulic modeling, the maximum observed water depth of 7 ft at the softball field matches the stage of 28 ft at the Utopia gage. From the synthetic rating curve, the corresponding peak discharge for the stage of 28 ft was 76,600 ft3/s at the Utopia gage (in table 2, estimated discharges at the upstream boundaries of the Sabinal River and the West Sabinal River at the stage of 28 ft sum to 76,600 ft3/s).
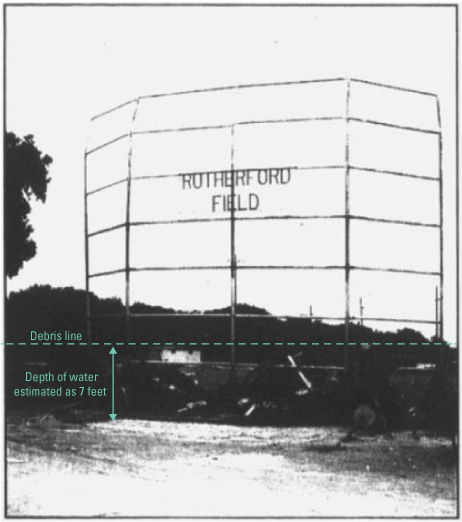
Postflood debris, estimated to be at a 7-foot height, of the July 5, 2002, flood at the Utopia Community Park softball field corresponding to a 28-foot gage height (stage) at U.S. Geological Survey streamgage 08197970 Sabinal River at Utopia, Texas. Photograph from Cosgrove (2002). Photograph copyright of Hondo Anvil Herald, used with permission.
Table 4.
Simulated water-surface elevations from the hydraulic model and target water-surface elevations from a synthetic rating curve at U.S. Geological Survey streamgage 08197970 Sabinal River at Utopia, Texas, for water-surface profiles ranging from near bankfull stage, 11 feet, to the highest estimated peak stage, 28 feet.[ft, foot; NAVD 88, North American Vertical Datum of 1988]
Water-surface profiles are 0.5-ft increments of stage, referenced to the gage datum of U.S. Geological Survey streamgage 08197970 Sabinal River at Utopia, Tex., which is 1,331.9 ft above NAVD 88.
Development of Flood-Inundation Maps
The flood-inundation maps were developed for the 10-mi main study reach of the Sabinal River from the Vanderpool gage to the Utopia gage and for an additional 7 mi of the West Sabinal River (fig. 1). The 35 simulated water-surface elevations (table 4) were combined with the DEM data to create the flood-inundation maps by using the RAS Mapper (U.S. Army Corps of Engineers, 2016a, b, c). The DEM data were derived from the lidar data described previously in the “Topographic and Bathymetric Data” section of this report and have an estimated vertical accuracy of plus or minus 42.8 centimeters.
Depth grids of the flood-inundation extents for each of the 35 water-surface profiles were modified, as required by the FDST standard, in ArcGIS (Esri, 2022) to ensure a hydraulically reasonable transition of the flood boundaries. Any inundated areas that were detached from the main channel of either stream were examined to identify subsurface connections with the main channel, such as through culverts under roadways. A total of nine culvert structures were surveyed and included in the model geometry, which prevented the inundation area from being detached from the main channel at each structure. Otherwise, the erroneously delineated parts of the flood-inundation extent were deleted. The final flood-inundation extents were then overlaid on a georeferenced topography map of the study area. One item of note concerning these depicted extents is that bridge surfaces are displayed as inundated regardless of the actual water-surface elevation in relation to the lowest structural chord of the bridge or the bridge deck. Estimates of water depth can be obtained from the depth grid data that are included with the presentation of the flood-inundation maps on the FDST application (U.S. Geological Survey, 2021b). A close-up excerpt of the flood-inundation map focused on the town of Utopia corresponding to the highest simulated stage, 28 ft, is presented in figure 4. Coverages for the full extent of the flood-inundation map for the study area are provided in the companion USGS data release (Choi, 2023).
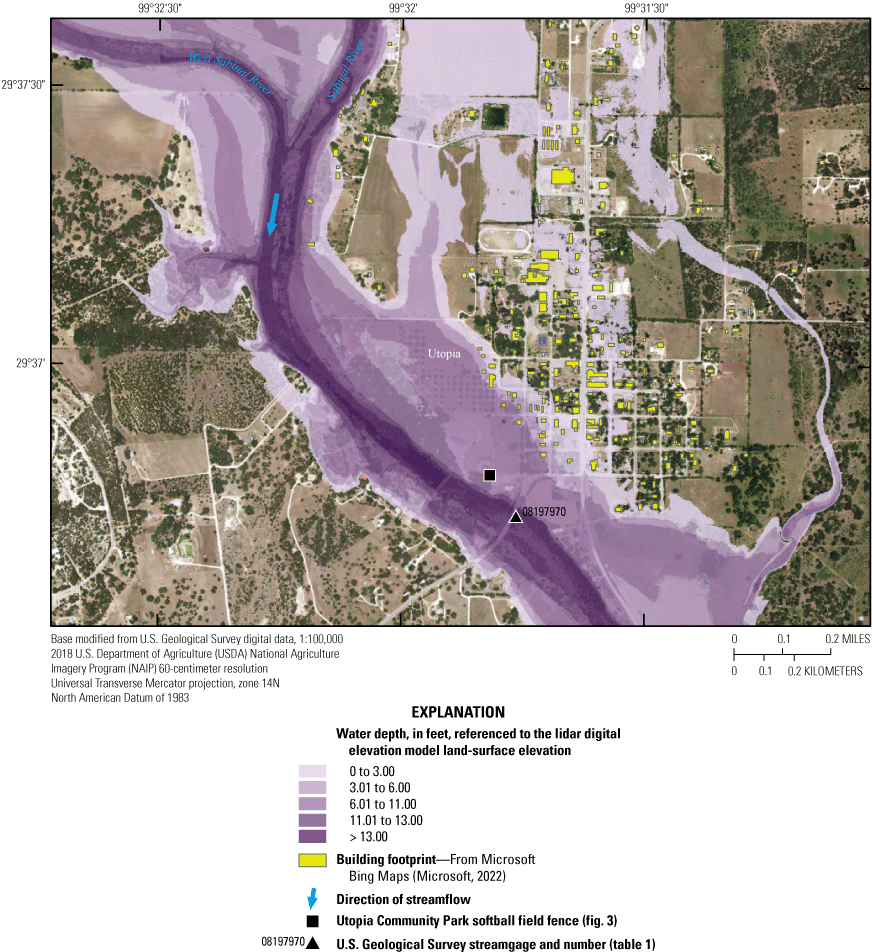
An excerpt from the flood-inundation map for the Sabinal River at Utopia, Texas, corresponding to the simulated water-surface elevation for a stage of 28 feet at U.S. Geological Survey streamgage 08197970 Sabinal River at Utopia, Tex.
Flood-Inundation Map Delivery
The depth grids of the flood-inundation extents and the HEC–RAS model input files are available in the companion USGS data release (Choi, 2023). The InFRM website (https://webapps.usgs.gov/infrm/) provides the flood-inundation map libraries and information for FEMA Region 6 to the public. The InFRM website links to the FDST application, which presents map libraries and provides detailed information on flood-inundation extents and stage values for the streamgages used in the model (https://webapps.usgs.gov/infrm/fdst/). Before and during a flood event, a user can select the Utopia gage on the map viewer to browse detailed information regarding the likely flood extent for different stage values, as well as real-time gage information.
The flood-inundation maps are displayed in sufficient detail (0.5-ft depth increments) such that preparations for flooding and decisions for emergency response can be performed efficiently. Depending on the flood magnitude, roadways are shown as shaded (inundated and likely impassable) or not shaded (dry and passable) to facilitate emergency planning and use. Bridges are shaded—that is, shown as inundated—regardless of the flood magnitude. The flood-inundation maps were developed for the 10-mi main study reach of the Sabinal River from the Vanderpool gage to the Utopia gage and for an additional 7 mi of the West Sabinal River. Any tributaries other than the West Sabinal River that contribute to the Sabinal River have not been simulated; thus, flood-inundation extents for tributaries are not available. Roadways crossing tributaries may not be shaded; however, this absence of shading does not necessarily mean that the roadway is dry and passable. If the area around a building is shaded, it does not mean that the structure is completely submerged but rather that land surfaces in the vicinity of the building are inundated. In these instances, the water depth (as indicated in the FDST by holding the cursor over an inundated area) near the building would be an estimate of the water depth inside the structure unless flood-proofing measures had been implemented.
Disclaimer for Flood-Inundation Maps
The flood-inundation maps should not be used for navigation, regulatory, permitting, or other legal purposes. The USGS provides these maps “as is” for a quick reference and emergency planning tool but assumes no legal liability or responsibility resulting from the use of this information.
Uncertainties and Limitations of Flood-Inundation Maps
Although the flood-inundation maps represent the estimated extents of inundated areas, some uncertainty is associated with these maps. The uncertainty of estimated flood-inundation extents is a result of many factors, including the accuracy of input floodplain elevation data, cross-sectional survey quality, and distance from the reference streamgage, among other things. The flood extents shown were estimated on the basis of stages (water-surface elevations) and discharges at the Utopia gage. The synthetic rating curve that was used to estimate discharge for simulated stream stages at the Utopia gage in this study is based on a regional regression equation using a specific range of site characteristics, as documented by Asquith and others (2013). There is greater uncertainty in the estimates of discharge derived from synthetic rating curves compared to the estimates of discharge derived from conventional rating curves. Water-surface elevations along the stream reaches were estimated by uncalibrated two-dimensional unsteady-state diffusion wave hydraulic modeling, assuming unobstructed flow and using discharges and hydrologic conditions anticipated at the USGS streamgage. The hydraulic model reflects the land cover characteristics and any culvert, bridge, dam, levee, or other hydraulic structures existing as of March 2020. Unique meteorological factors (timing and distribution of precipitation) may cause actual discharges along the study reach to vary from those estimated for a flood, which may lead to deviations in the water-surface elevations and inundation extents shown on the maps. Additional areas may be flooded as a result of unanticipated conditions such as changes in the streambed elevation or roughness, backwater into major tributaries along the main stem of the stream, or backwater from localized debris. The accuracy of the flood-inundation extents portrayed on these maps will vary with the accuracy of the DEM used to simulate the land surface. The simulated flood-inundation extents on the 10-mi reach of the Sabinal River and 7-mi reach of the West Sabinal River were referenced to a single streamgage at Utopia, and uncertainty in simulated flood-inundation extents decreases as the distance from the streamgage decreases.
Summary
In 2021, the U.S. Geological Survey (USGS), in cooperation with the Bandera County River Authority and Groundwater District and the Texas Water Development Board, created flood-inundation maps referenced to the local streamgage for the Sabinal River in a reach near Utopia, Texas. A library of 35 digital flood-inundation maps was developed using data collected at USGS streamgage 08197970 Sabinal River at Utopia, Tex. (hereinafter referred to as the “Utopia gage”). The flood-inundation maps cover a 10-mile reach of the Sabinal River from USGS streamgage 08197936 Sabinal River below Mill Creek near Vanderpool, Tex., to the Utopia gage, as well as a 7-mile reach of the West Sabinal River. The flood-inundation maps depict estimates of the areal extent and depth of flooding corresponding to selected gage heights (the water-surface elevation at a streamgage, commonly referred to as “stage”) at the Utopia gage.
The Utopia gage was installed for the study and records continuous stage, which is available on the internet through the USGS National Water Information System web interface and the National Water Dashboard. Continuous records of discharge for the Utopia gage are not available as of May 2022 because of the short monitoring period of the gage and persistent dry conditions since the gage installation. After sufficient discrete discharge measurements are made throughout the entire range of expected conditions, a stage-discharge rating curve will be developed and used to compute discharge. Because of the lack of a rating curve, a synthetic rating curve was developed using a regional regression method, which estimates discharge for ungaged sites by using the characteristics of a channel cross section at the streamgage and regional climate factors.
The flood-inundation maps were developed by a two-dimensional unsteady-state diffusion wave model using the U.S. Army Corps of Engineers Hydrologic Engineering Center River Analysis System program to compute water-surface elevations and delineate estimated flood-inundation areal extents and depths of flooding for selected stages. The model inputs include high-resolution digital elevation data, land cover data to estimate roughness parameters, field surveys of structures and a channel cross section, and discharge derived from the synthetic rating curve.
The model was used to compute water-surface elevations for 35 stages at 0.5-foot (ft) increments referenced to the Utopia gage datum and ranging from 11 ft (near bankfull) to 28 ft. The highest stage value that was mapped, 28 ft, was based on the estimated peak stage of the Sabinal River at Utopia during a major flood event on July 5, 2002. Differences between the synthetic rating curve and the model results for the 35 simulated stages at the Utopia gage were equal to or less than 2.2 ft with a root mean square error of 1.3 ft.
The simulated water-surface profiles were then combined with a geographic information system digital elevation model derived from light detection and ranging data to delineate estimated flood-inundation depth grids for each profile. These flood-inundation depth grids were overlaid on a georeferenced topography map of the study area. These flood-inundation maps are intended to help guide the public in taking individual safety precautions and provide emergency management personnel with a tool to efficiently manage emergency flood operations and postflood recovery efforts. Although the flood-inundation maps represent the estimated extents of inundated areas, some uncertainty is associated with these maps. Estimated flood-inundation extents inherently include uncertainty based on many factors, including the accuracy of input floodplain elevation data, cross-sectional survey quality, and distance from the reference streamgage, among other things. Further, there is greater uncertainty in the estimates of discharge derived from synthetic rating curves compared to the estimates of discharge derived from conventional rating curves.
References Cited
Asquith, W.H., Herrmann, G.R., and Cleveland, T.G., 2013, Generalized additive regression models of discharge and mean velocity associated with direct-runoff conditions in Texas—Utility of the U.S. Geological Survey discharge measurement database: Journal of Hydrologic Engineering, v. 18, no. 10, p. 1331–1348, accessed June 10, 2022, at https://doi.org/10.1061/(ASCE)HE.1943-5584.0000635.
Asquith, W.H., and Roussel, M.C., 2009, Regression equations for estimation of annual peak-streamflow frequency for undeveloped watersheds in Texas using an L-moment-based, PRESS-minimized, residual-adjusted approach: U.S. Geological Survey Scientific Investigations Report 2009–5087, 48 p., accessed June 10, 2022, at https://doi.org/10.3133/sir20095087.
Cahalan, R., 2022, Utopia, Texas, is accurately named—This serene Hill Country town boasts a treehouse hotel and an idyllic swimming hole: Texas Monthly, August 29, 2022, accessed January 5, 2023, at https://www.texasmonthly.com/travel/utopia-texas/.
Caran, S.C., and Baker, V.R., 1986, Flooding along the Balcones Escarpment, central Texas, in Abbott, P.L., and Woodruff, C.M., Jr., eds., The Balcones Escarpment—Geology, hydrology, ecology and social development in central Texas: Geological Society of America, p. 1–14, accessed April 29, 2022, at https://www.edwardsaquifer.org/wp-content/uploads/2019/02/1986_CaranBaker_BalconesEscarpmentFlooding-1.pdf.
Choi, N., 2023, Geospatial and model dataset for flood-inundation maps in a 10-mile reach of the Sabinal River and a 7-mile reach of the West Sabinal River near Utopia, Texas, 2021: U.S. Geological Survey data release, https://doi.org/10.5066/P9CIK9ZF.
Choi, N., and Engel, F.L., 2019, Flood-inundation maps for a 23-mile reach of the Medina River at Bandera, Texas, 2018: U.S. Geological Survey Scientific Investigations Report 2019–5067, 15 p., accessed June 15, 2022, at https://doi.org/10.3133/sir20195067.
Cosgrove, D., 2002, Sabinal River floods Utopia: Hondo Anvil Herald, v. 116, no. 28, ed. 1, p. 10, Thursday, July 11, 2002, accessed June 15, 2022, at https://texashistory.unt.edu/ark:/67531/metapth819676/m1/.
Engel, F.L., and Choi, N., 2019, Flood warning toolset for the Medina River in Bandera County, Texas: U.S. Geological Survey Fact Sheet 2019–3043, 2 p., accessed December 12, 2022, at https://doi.org/10.3133/fs20193043.
Esri, 2022, ArcGIS: Esri, Inc., website, accessed January 14, 2022, at https://www.esri.com/software/arcgis/.
Federal Emergency Management Agency, 2011, Flood insurance study, Uvalde County Texas, and incorporated areas; effective November 4, 2010: Washington, D.C., Federal Emergency Management Agency, 33 p., accessed January 10, 2022, at https://map1.msc.fema.gov/data/48/S/PDF/48463CV000A.pdf?LOC=7ead97631af062db6958bcac5b9cd665.
Federal Emergency Management Agency, 2020, Flood insurance study, Bandera County Texas, and incorporated areas; effective May 15, 2020: Washington, D.C., Federal Emergency Management Agency, 106 p., accessed January 10, 2022, at https://map1.msc.fema.gov/data/48/S/PDF/48019CV000B.pdf?LOC=8a76f6cf053914e9c36360b6558fdb83.
Griffith, G., Bryce, S., Omernik, J., and Rogers, A., 2007, Ecoregions of Texas—Project report to Texas Commission on Environmental Quality: Texas Commission on Environmental Quality, 125 p., accessed December 30, 2022, at http://ecologicalregions.info/htm/pubs/TXeco_Jan08_v8_Cmprsd.pdf.
Hill, R.T., 1901, Geography and geology of the Black and Grand Prairies, Texas with detailed descriptions of the Cretaceous formations and special reference to artesian waters—Twenty-first annual report of the United States Geological Survey to the Secretary of the Interior, 1899–1900, Part VII—Texas: Washington, D.C., U.S. Government Printing Office, 666 p., accessed December 30, 2022, at https://doi.org/10.26153/tsw/5099.
Lee, L., 2016, Do you live in flash flood alley? Experts explain the central Texas phenomenon and what residents should know: Texas Water Resources Institute, accessed February 11, 2022, at https://twri.tamu.edu/publications/txh2o/2016/fall-2016/do-you-live-in-flash-flood-alley/.
Mear, C.E., 1995, Quaternary geology of the upper Sabinal River Valley, Uvalde and Bandera Counties, Texas: Geoarchaeology: An International Journal, v. 10, no. 6, p. 457–480, accessed January 5, 2023, at https://doi.org/10.1002/gea.3340100604.
Merrick-Surdex Joint Venture, 2018, Acquisition, processing, and delivery of airborne lidar elevation data and orthoimagery for TX_Lower_CO_San_Bernard_2018_D18 Project: Merrick-Surdex Joint Venture lidar mapping report, accessed December 20, 2021, at https://prdtnm.s3.amazonaws.com/StagedProducts/Elevation/metadata/TX_Lower_CO_San_Bernard_2017_D18/TX_Lower_SanBernard_B6_2017/reports/140G0218F0071-T X_Lower_CO_San_Bernard_2017_D18-Lidar_Mapping_Report.pdf.
Microsoft, 2022, Bing Maps—Building footprints: Microsoft website, accessed June 15, 2022, at https://www.microsoft.com/en-us/maps/building-footprints.
Multi-Resolution Land Characteristics Consortium, 2016, National Land Cover Database viewer: Multi-Resolution Land Characteristics Consortium database, accessed June 15, 2022, at https://www.mrlc.gov/viewer/.
Nielsen, E.R., Schumacher, R.S., and Keclik, A.M., 2016, The effect of the Balcones Escarpment on three cases of extreme precipitation in central Texas: American Meteorological Society Monthly Weather Review, v. 144, no. 1, p. 119–138, accessed May 9, 2022, at https://doi.org/10.1175/MWR-D-15-0156.1.
Ochoa, R.E., 2020, Uvalde County: Texas State Historical Association, Handbook of Texas website, accessed April 29, 2022, at https://www.tshaonline.org/handbook/entries/uvalde-county.
Rantz, S.E., and others, 1982, Measurement of stage and discharge, v. 1 of Measurement and computation of streamflow: U.S. Geological Survey Water-Supply Paper 2175, 284 p., accessed June 6, 2022, at https://doi.org/10.3133/wsp2175.
Rydlund, P.H., Jr., and Densmore, B.K., 2012, Methods of practice and guidelines for using survey-grade global navigation satellite systems (GNSS) to establish vertical datum in the United States Geological Survey: U.S. Geological Survey Techniques and Methods, book 11, chap. D1, 102 p. [Also available at https://pubs.usgs.gov/tm/11d1/.]
Slade, R.M., Jr., and Patton, J.M., 2003, Major and catastrophic storms and floods in Texas—215 major and 41 catastrophic events from 1953 to September 1, 2002: U.S. Geological Survey Open-File Report 2003–193, [variously paged], accessed June 15, 2022, at https://doi.org/10.3133/ofr03193.
Texas Water Development Board, 2020, HUC10 watershed boundaries for Texas: Texas Water Development Board, Esri ArcGIS feature layers, accessed January 12, 2022, at https://www.arcgis.com/home/item.html?id=9dbea30281a04bbf859e7a135aa27b4b.
University of Texas at San Antonio, 2018, The natural environment of Bexar County: University of Texas at San Antonio, Esri ArcGIS Story Map, accessed January 12, 2022, at https://bexar.maps.arcgis.com/home/item.html?id=05f7e4f40be0419fa64de8ff6212e663.
U.S. Army Corps of Engineers, 2016a, HEC–RAS—River Analysis System—2D modeling user’s manual (ver. 5.0, February 2016): U.S. Army Corps of Engineers, 171 p., accessed December 20, 2021, at https://www.hec.usace.army.mil/software/hec-ras/documentation/HEC-RAS%205.0%202D%20Modeling%20Users%20Manual.pdf.
U.S. Army Corps of Engineers, 2016b, HEC–RAS—River Analysis System—Hydraulic reference manual (ver. 5.0, February 2016): U.S. Army Corps of Engineers, 547 p., accessed December 20, 2021, at https://www.hec.usace.army.mil/software/hec-ras/documentation/HEC-RAS%205.0%20Reference%20Manual.pdf.
U.S. Army Corps of Engineers, 2016c, HEC–RAS—River Analysis System—User’s manual (ver. 5.0, February 2016): U.S. Army Corps of Engineers, 962 p., accessed December 20, 2021, at https://www.hec.usace.army.mil/software/hec-ras/documentation/HEC-RAS%205.0%20Users%20Manual.pdf.
U.S. Army Corps of Engineers, 2022, HEC–RAS 2D user’s manual—Creating land cover, Manning’s n values, and % impervious layers: U.S. Army Corps of Engineers web page, accessed January 14, 2022, at https://www.hec.usace.army.mil/confluence/rasdocs/r2dum/latest/developing-a-terrain-model-and-geospatial-layers/creating-land-cover-mannings-n-values- and-impervious-layers.
U.S. Census Bureau, 2020a, 2020 Decennial Census—Total population in Bandera County, Texas: U.S. Census Bureau web page, accessed January 11, 2022, at https://data.census.gov/cedsci/all?g=0500000US48019.
U.S. Census Bureau, 2020b, 2020 Decennial Census—Total population in Utopia CDP, Texas: U.S. Census Bureau web page, accessed January 11, 2022, at https://data.census.gov/cedsci/all?g=1600000US4874576.
U.S. Census Bureau, 2020c, 2020 Decennial Census—Total population in Uvalde County, Texas: U.S. Census Bureau web page, accessed January 11, 2022, at https://data.census.gov/cedsci/all?g=0500000US48463.
U.S. Department of Agriculture, 2018, Texas NAIP imagery: U.S. Department of Agriculture web page, accessed February 10, 2023, at https://imagery.tnris.org/server/rest/services/NAIP/NAIP18_NCCIR_60cm/ImageServer.
U.S. Geological Survey, 2015, Interagency Flood Risk Management—Collaborating nationally. Empowering locally: U.S. Geological Survey web page, accessed December 20, 2021, at https://webapps.usgs.gov/infrm/.
U.S. Geological Survey, 2017, 1 meter digital elevation models (DEMs)–USGS National Map 3DEP downloadable data collection: U.S. Geological Survey database, accessed December 20, 2021, at https://www.sciencebase.gov/catalog/item/543e6b86e4b0fd76af69cf4c.
U.S. Geological Survey, 2020a, InFRM Flood Decision Support Toolbox—Executive summary and submittal guidance—InFRM Flood Decision Support Toolbox user guide: U.S. Geological Survey, 33 p., accessed May 3, 2022, at https://webapps.usgs.gov/infrm/pubs/FDST%20Map%20Submission%20Guidelines%20_vDec20.pdf.
U.S. Geological Survey, 2020b, InFRM Flood Decision Support Toolbox user guide: U.S. Geological Survey, 34 p., accessed May 3, 2022, at https://webapps.usgs.gov/infrm/pubs/FDST_UserGuide_vApr2020.pdf.
U.S. Geological Survey, 2021a, Integrated Water Resources Science and Services (IWRSS): U.S. Geological Survey web page, accessed January 14, 2022, at https://water.usgs.gov/osw/iwrss/.
U.S. Geological Survey, 2021b, Interagency Flood Risk Management—Flood Decision Support Toolbox: U.S. Geological Survey database, accessed December 20, 2021, at https://webapps.usgs.gov/infrm/fdst/.
U.S. Geological Survey, 2022, USGS National Water Dashboard: U.S. Geological Survey database, accessed May 3, 2022, at https://dashboard.waterdata.usgs.gov/.
U.S. Geological Survey, 2023a, USGS streamgage 08197970 Sabinal River at Utopia, Tex., in USGS water data for the Nation: U.S. Geological Survey National Water Information System database, accessed September 14, 2023, at https://doi.org/10.5066/F7P55KJN. [Site information directly accessible at https://waterdata.usgs.gov/nwis/inventory?agency_code=USGS&site_no=08197970.]
U.S. Geological Survey, 2023b, USGS streamgage 08198000 Sabinal River near Sabinal, Tex., in USGS water data for the Nation: U.S. Geological Survey National Water Information System database, accessed September 14, 2023, at https://doi.org/10.5066/F7P55KJN. [Site information directly accessible at https://waterdata.usgs.gov/nwis/inventory?agency_code=USGS&site_no=08198000.]
U.S. Geological Survey, 2023c, USGS water data for the Nation: U.S. Geological Survey National Water Information System database, accessed September 14, 2023, at https://doi.org/10.5066/F7P55KJN.
Conversion Factors
International System of Units to U.S. customary units
Datum
Vertical coordinate information is referenced to (1) stage, the height above an arbitrary datum established at a U.S. Geological Survey streamgage, and (2) elevation, the height above the North American Vertical Datum of 1988 (NAVD 88).
Horizontal coordinate information is referenced to the North American Datum of 1983 (NAD 83).
Abbreviations
DEM
digital elevation model
FDST
Flood Decision Support Toolbox
FEMA
Federal Emergency Management Agency
FIS
flood insurance study
HEC–RAS
Hydrologic Engineering Center River Analysis System
InFRM
Interagency Flood Risk Management
lidar
light detection and ranging
NAVD 88
North American Vertical Datum of 1988
NWIS
National Water Information System
RMSE
root mean square error
USACE
U.S. Army Corps of Engineers
USGS
U.S. Geological Survey
For more information about this publication, contact
Director, Oklahoma-Texas Water Science Center
U.S. Geological Survey
1505 Ferguson Lane
Austin, TX 78754–4501
For additional information, visit
https://www.usgs.gov/centers/ot-water
Publishing support provided by
Lafayette Publishing Service Center
Disclaimers
Any use of trade, firm, or product names is for descriptive purposes only and does not imply endorsement by the U.S. Government.
Although this information product, for the most part, is in the public domain, it also may contain copyrighted materials as noted in the text. Permission to reproduce copyrighted items must be secured from the copyright owner.
Suggested Citation
Choi, N., 2023, Flood-inundation maps created using a synthetic rating curve for a 10-mile reach of the Sabinal River and a 7-mile reach of the West Sabinal River near Utopia, Texas, 2021 (ver. 2.0, September 2023): U.S. Geological Survey Scientific Investigations Report 2023–5001, 18 p., https://doi.org/10.3133/sir20235001.
ISSN: 2328-0328 (online)
Study Area
| Publication type | Report |
|---|---|
| Publication Subtype | USGS Numbered Series |
| Title | Flood-inundation maps created using a synthetic rating curve for a 10-mile reach of the Sabinal River and a 7-mile reach of the West Sabinal River near Utopia, Texas, 2021 |
| Series title | Scientific Investigations Report |
| Series number | 2023-5001 |
| DOI | 10.3133/sir20235001 |
| Edition | Version 1.0: February 2023; Version 2.0: September 2023 |
| Publication Date | February 28, 2023 |
| Year Published | 2023 |
| Language | English |
| Publisher | U.S. Geological Survey |
| Publisher location | Reston, VA |
| Contributing office(s) | Oklahoma-Texas Water Science Center |
| Description | Report: viii, 18 p.; Data Release |
| Country | United States |
| State | Texas |
| City | Utopia |
| Online Only (Y/N) | Y |