Application of Surrogate Technology to Predict Real-Time Metallic-Contaminant Concentrations and Loads in the Clark Fork near Grant-Kohrs Ranch National Historic Site, Montana, Water Years 2019–20
Links
- Document: Report (8.46 MB pdf) , HTML , XML
- Dataset: USGS National Water Information System database —USGS water data for the Nation
- Data Release: USGS data release - Water quality and streamflow data for the Clark Fork near Grant-Kohrs Ranch National Historic Site in southwestern Montana, water years 2019–20
- Download citation as: RIS | Dublin Core
Acknowledgments
The authors would like to thank Jacque Lavelle, Jeff Johnson, and Billy Schweiger from the National Park Service for their support and insight during the collection of field data, data analysis, and report writing phases of the project. We would like to thank the Clark Fork Coalition, Montana Bureau of Mines and Geology, Montana Department of Environmental Quality, Montana Natural Resource Damage Program, Powell County Planning Department, and the U.S. Environmental Protection Agency for providing support letters during the proposal phase of the project.
Terry Heinert, Kent Dodge, DeAnn Dutton, Hannah Nilges, Chad Reese, Greg Clark, and Meryl Storb of the U.S. Geological Survey are acknowledged for assistance with data collection and report preparation. Sara Eldridge and Kathleen Conn are acknowledged for their technical reviews of the report.
Abstract
Grant-Kohrs Ranch National Historic Site (GRKO) in southwestern Montana commemorates the frontier cattle era and its formative role in shaping the culture and history of the Western United States. The ranch was designated a national historic landmark in 1960 and a unit of the National Park Service (NPS) by Congress in 1972. The GRKO is unique because of its proximity to large-scale extraction, milling, and smelting of gold, silver, copper, and lead ore from the 1860s to the 1980s in the Butte mining district. During this time, mining and milling wastes were discarded in the upper Clark Fork Basin, resulting in the deposition of large amounts of waste materials (tailings) enriched with metallic contaminants (including cadmium, copper, iron, lead, manganese, zinc, and the metalloid trace element arsenic) in soils and in nearby streams and floodplains. Denuded vegetation and fish kills attributed to large concentrations of heavy metals caused the U.S. Environmental Protection Agency to designate a 120-mile section of the Clark Fork River (hereafter referred to as the “Clark Fork”), including GRKO, to be included on the National Priority List for Superfund cleanup in 1989. In 2018, with oversight from the Montana Department of Environmental Quality, the NPS began remediation of 2.6 miles of the Clark Fork as it flows through GRKO property.
In 2019, the U.S. Geological Survey (USGS), in collaboration with the NPS, conducted a study using time-series data from backscatter signals from fixed-point turbidity and acoustic sensors with the intent to provide a high-resolution monitoring tool to estimate metallic-contaminant concentrations (MCCs) and loads during NPS remediation of the Clark Fork. Two monitoring sites at USGS streamgages on the Clark Fork on either side of GRKO property were instrumented with turbidity and acoustic sensors and surrogate relations were developed among time-series data and MCCs. The application of high-resolution surrogate data was used to infer contaminant source and fate and evaluate MCC values relative to aquatic-life standards. Using high-resolution surrogate data, it was determined that during spring runoff and storm-related runoff events, MCCs peaked at their highest values at streamflows markedly lower and prior to peak streamflow. Because MCCs peaked prior to streamflow peaks, it could be inferred that the source of MCCs originated from channel bed sediments in close spatial proximity to the monitoring site or from nearby streambanks and floodplains. High-resolution surrogate data revealed that copper concentrations in the Clark Fork exceeded chronic aquatic-life standards 90 percent of the time when streamflow exceeded 200 cubic feet per second (ft3/s) and exceeded acute aquatic-life standards 85 percent of the time when streamflow exceeded 260 ft3/s. These data helped support NPS management goals for evaluating variation in water quality during remediation of GRKO property, evaluating MCC values relative to aquatic-life standards, and quantifying benefits from Superfund remediation activities.
Introduction
The establishment of Grant-Kohrs Ranch in 1862–66 by stockgrower Johnny Grant and cattle baron Conrad Kohrs marked the beginning of a 120-year continuum of one of the largest open-range cattle operations in the Western United States (Grant-Kohrs Ranch, 2004). In 1864, gold was discovered in the Butte area and from 1864 to the 1980s, the Butte mining district in Montana—formerly known as the “Richest Hill on Earth”—was the epicenter of large-scale extraction, milling, and smelting of gold, silver, copper, and lead ore that brought immense economic wealth to the region (U.S. Environmental Protection Agency, 2004; Gammons and others, 2006). During this time, mining and milling wastes were discarded in the upper Clark Fork Basin, resulting in the deposition of large amounts of waste materials (tailings) enriched with metallic contaminants (including cadmium, copper, iron, lead, manganese, zinc, and the metalloid trace element arsenic) in soils and in nearby streams and floodplains (Andrews, 1987; Moore and Luoma, 1990; Gammons and others, 2006). Public water-supply contamination, denuded vegetation, and fish kills attributed to large concentrations of heavy metals derived from the tailings caused the U.S. Environmental Protection Agency (EPA) to designate a 120-mile section of the Clark Fork River (hereafter referred to as the “Clark Fork”), including Grant-Kohrs Ranch National Historic Site, as a Superfund site in 1989 (U.S. Environmental Protection Agency, 2004).
Grant-Kohrs Ranch National Historic Site (GRKO) celebrates the frontier cattle era and its formative role in shaping the culture and history of the Western United States. The ranch once served as headquarters to more than 10 million acres of feeding, water, and grazing rights that spanned Montana and parts of Utah, Idaho, Wyoming, Colorado, and Canada (Grant-Kohrs Ranch, 2014). In 2022, the GRKO encompassed 1,618 acres in southwestern Montana adjacent to the town of Deer Lodge and was designated a national historic landmark in 1960 and a unit of the National Park Service (NPS) by Congress in 1972 (Grant-Kohrs Ranch, 2004). The GRKO is unique because of its geographical setting in the upper Clark Fork Basin and its proximity to large-scale extraction, milling, and smelting of gold, silver, copper, and lead ore from the 1860s to the 1980s in the Butte mining district. The GRKO has the distinction of being the only NPS unit to be included on the National Priority List for Superfund cleanup (U.S. Environmental Protection Agency, 2004; Grant-Kohrs Ranch, 2006). In 2018, with oversight from the EPA and the Montana Department of Environmental Quality (MDEQ), the NPS began remediation of 2.6 miles of the Clark Fork as it flows through GRKO property in an area with extensive floodplain and streambank deposits of contaminated mining wastes (U.S. Environmental Protection Agency, 2004; Research Specialist, Inc., 2020; Jeff Johnson, National Park Service, Grant-Kohrs Ranch, oral cummun., various dates).
The U.S. Geological Survey (USGS) monitors, conducts research, and provides information on a wide range of water resources including streamflow, groundwater, water quality, and water use and availability. Water-quality data, including streamflow data, are available online to the public in the USGS National Water Information System database (U.S. Geological Survey, 2023).Water-quality data collection by the USGS, in cooperation with the EPA, began during 1985–88 in the upper Clark Fork Basin with the establishment of a small long-term monitoring network (LTMN) that expanded through time from 8 sites (4 on the main-stem Clark Fork and 4 in major tributaries) to 22 and continued to present (2022). The legacy of the USGS LTMN in the Clark Fork is described in detail by Lambing (1991, 1998), Sando and others (2014), and Sando and Vecchia (2016).
Superfund remediation to deal with the mining contamination is a pre-eminent resource issue in GRKO because of its geographic setting in the upper Clark Fork Basin. NPS policies require park management to maintain, rehabilitate, and perpetuate the inherent integrity of aquatic resources within NPS units (National Park Service, 2006; Schweiger and others, 2014). Because of the site’s inclusion on the National Priority List for Superfund cleanup, many of the day-to-day and long-term management decisions at GRKO regarding fisheries, water quality, surface-water quantity, and riparian composition and function are pressing matters related to the mining and smelting operations in Butte and Anaconda, Mont., in the headwaters of the Clark Fork (U.S. Environmental Protection Agency, 2004; National Park Service, 2006).
Two USGS streamgages on either side of the GRKO provide a valuable framework for USGS monitoring of the Clark Fork during NPS remediation activities (fig. 1): Clark Fork at Deer Lodge, Mont. (streamgage 12324200; 1 mile upstream from the GRKO; hereafter referred to as “Clark Fork at Deer Lodge”) and Clark Fork above Little Blackfoot River near Garrison, Mont. (streamgage 12324400; about 12 miles downstream from the GRKO; hereafter referred to as “Clark Fork near Garrison”). Historically, the two sampling sites have had the highest frequency of exceedance of water-quality standards for concentrations of trace elements (hereafter referred to as “metallic-contaminant concentrations [MCCs]”) of any of the sites in the Clark Fork USGS LTMN (Sando and Vecchia, 2016; Montana Department of Environmental Quality, 2019).
Although the LTMN provides water-quality and streamflow data to evaluate large-scale effects of remediation activities in the upper Clark Fork Basin, the LTMN does not provide the high-resolution data needed to understand how GRKO remediation activities affect water quality in the Clark Fork. To overcome limitations inherent with discrete point samples, surrogate data, which replicate MCCs, were developed from well-defined linear relations and produced at a high-resolution temporal scale following methods and techniques described by Montgomery and others (2007), Stubblefield and others (2007), Rasmussen and others (2009), Lee and Ziegler (2010), Joiner and others (2014), and Landers and others (2016). This report describes the application of surrogate data from fixed-point turbidimeters (Rasmussen and others, 2009), acoustics sensors (Topping and others, 2004; Landers and others, 2016), and streamflow to provide accurate, real-time measures of MCCs in the Clark Fork as it flows through GRKO property. Continuous real-time streams of data showing spikes and declines in MCCs, measured at a high-resolution temporal scale, may be linked with remediation actions such as excavation of contaminated soils, streambank restoration activities, and re-vegetation of riparian and denuded regions of GRKO property. Other factors affecting metallic-contaminant discharge into the Clark Fork, such as irrigation operations in the Deer Lodge Valley along with precipitation event occurrence, intensity, and duration may also be linked to MCC response and potentially differentiated from remediation activities.
Purpose and Scope
The primary purposes of this study and subsequent report are to (1) provide a high-resolution monitoring tool for the GRKO to estimate MCCs and metallic-contaminant loads (MCLs) during Superfund remediation activities on the Clark Fork, and (2) develop the monitoring tool by establishing relations among turbidity and acoustic surrogate data with MCCs. This report presents results of relating surrogate data with MCCs and describes how suspended sediment was the primary mechanism for the transport of metallic contaminants in the Clark Fork as it flows through GRKO property. Regression results and various data-related factors that affect regression results are discussed, and background information on mining and remediation activities in the upper Clark Fork Basin is provided. Results of this study may assist resource managers in evaluating the benefits of using surrogate relations in linear models to predict real-time concentrations of metallic contaminants and loads during remediation activities; however, it is beyond the scope of this report to provide detailed explanations of the effects of GRKO remediation activities on water quality during ongoing remediation implementation phases.
Description of Study Area
The Clark Fork Basin drains extensive portions of western Montana and northern Idaho within the larger Columbia River Basin. The main stem of the Clark Fork begins at the confluence of Silver Bow and Warm Springs Creeks near Warm Springs, Mont., and flows 485 miles through Montana and Idaho where it enters the Columbia River (not shown on figure). The study area is in the upper Clark Fork Basin in southwestern Montana and begins at the Clark Fork at Deer Lodge streamgage and extends downstream to the Clark Fork near Garrison streamgage (fig. 1; table 1). Grant-Kohrs Ranch is about 1 mile downstream from the Clark Fork at Deer Lodge streamgage in the upper Clark Fork Basin adjacent to the town of Deer Lodge.
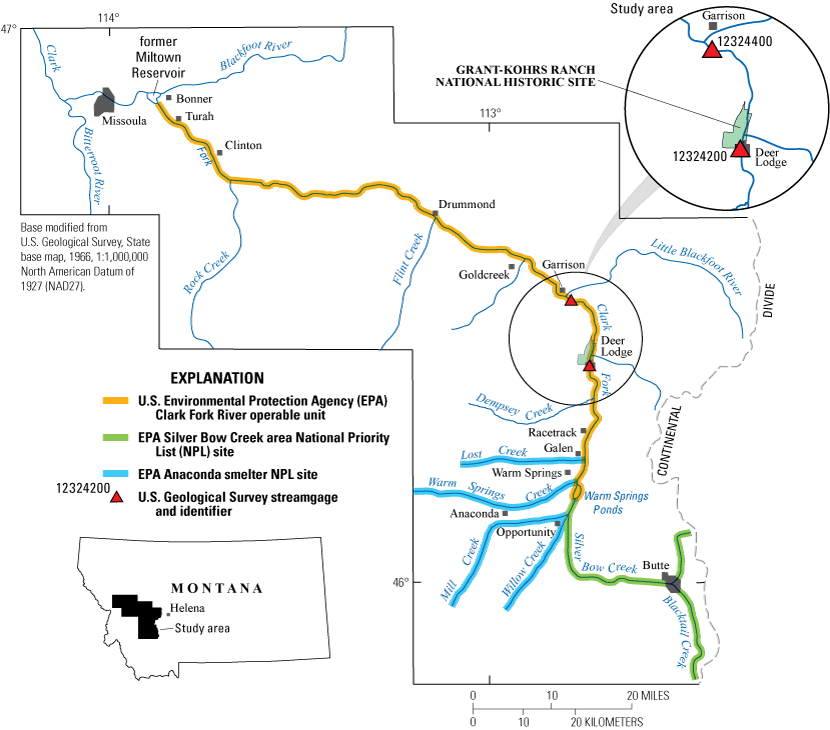
Location of the study area, Grant-Kohrs Ranch National Historic Site, U.S. Geological Survey streamgages, and National Priority List Superfund operable units in the upper Clark Fork Basin, Montana.
Table 1.
Information for Clark Fork at Deer Lodge (U.S. Geological Survey streamgage 12324200; U.S. Geological Survey, 2021a) and Clark Fork above Little Blackfoot River near Garrison (U.S. Geological Survey streamgage 12324400; U.S. Geological Survey, 2021b) study sites upstream and downstream, respectively, from Grant-Kohrs Ranch National Historic Site in the upper Clark Fork Basin, Montana (U.S. Geological Survey, 2023).[ft3/s, cubic feet per second; °, degree; ‘, minute; ‘’, second; N, north; W, west]
| USGS site identification number (fig. 1) |
USGS site name | Abbreviated site name |
Latitude | Longitude | Drainage area (square miles) |
Period of water-quality data collection |
Range of annual sampling frequency (samples per year) |
Range of streamflows at which samples were collected (ft3/s) |
|---|---|---|---|---|---|---|---|---|
| 12324200 | Clark Fork at Deer Lodge, Montana | Clark Fork at Deer Lodge | 46° 23' 51.54”N | 112° 44' 33.14”W | 995 | October 2018–October 2020 | 10–12 | 166–1,120 |
| 12324400 | Clark Fork above Little Blackfoot River near Garrison, Montana |
Clark Fork near Garrison | 46° 30' 39.28”N | 112° 47' 22.87”W | 1,139 | October 2018–October 2020 | 11–13 | 161–1,410 |
Hydrographic and Hydrologic Characteristics
From its beginning, the Clark Fork flows for about 21 miles to the upper boundary of the study area at the town of Deer Lodge. Within the larger Clark Fork Basin (fig. 1), the study area includes a 16-mile reach of the Clark Fork between Clark Fork at Deer Lodge and Clark Fork near Garrison. In the reach of the Clark Fork downstream from the confluence of Silver Bow Creek and Warm Springs Creek to Deer Lodge, there are abundant floodplain tailings from mining wastes that were generated near Butte and Anaconda, Mont. (Smith and others, 1998). In this reach, the Clark Fork Basin valley is wide (about 5 miles across; hereafter referred to as the “Deer Lodge Valley”) and the Clark Fork main-stem channel is highly meandering (Lambing, 1998). An important minor tributary that enters the Clark Fork in this reach is Lost Creek. The Lost Creek drainage basin has an area of about 65 square miles (mi2) and was affected by deposition of contaminants in emissions from smelting activities of the Anaconda Mining Company Smelter (Hooper and others, 2002). Clark Fork at Deer Lodge has a drainage area of 995 mi2 and mean annual streamflow (water years 1979–2020; water year is the 12-month period from October 1 through September 30 and is designated by the year in which it ends) of 267 cubic feet per second (ft3/s; U.S. Geological Survey, 2021a). Between Deer Lodge and Garrison, Mont., for 12 miles below GRKO to Clark Fork near Garrison, floodplain tailings are present to a similar extent as in the valley upstream from Deer Lodge (Smith and others, 1998). Clark Fork near Garrison has a drainage area of 1,139 mi2 and mean annual streamflow (water years 2010–20) of 350 ft3/s (U.S. Geological Survey, 2021b). Hydrographic and hydrologic characteristics of the upper Clark Fork and main tributaries in the upper Clark Fork Basin above the study area are described in detail by Lambing (1991) and Sando and others (2014).
Physiographic, Climatic, and Geologic Characteristics
The upper Clark Fork Basin lies west of the Continental Divide in southwestern Montana and is within the Rocky Mountains physiographic province, which is characterized by rugged mountains and intermontane valleys (Woods and others, 2002). Upstream from the town of Deer Lodge (fig. 1; from Galen to Deer Lodge), the topography is dominated by a broad valley that is bordered by high, dissected terraces that rise 200 to 1,000 feet (ft) above the river (Woods and others, 2002). The north-trending valley is bordered on the east by mountains along the Continental Divide and on the west by the Flint Creek Range (Lambing, 1991). Highest elevations range from about 8,600 ft along the Continental Divide to about 10,000 ft in the Flint Creek Range. Near the town of Garrison, the downstream boundary of the study area, the Clark Fork turns northwesterly and flows through a narrow valley that is typically less than (<) 1 mile wide and is bordered by mountains having elevations <7,500 ft.
The climate of the study area varies from semiarid in the Deer Lodge Valley to humid alpine in the mountains. More than 70 percent of the annual precipitation in the valley falls between April and September, with May and June being the wettest months. Areally weighted mean annual precipitation in the study area (1980–2010 30-year normal; PRISM Climate Group, 2021) is about 12 to 15 inches. About one-half of annual precipitation falls during May through July, whereas winter typically is the driest season (Nimick, 1993). In the mountains, mean annual precipitation, which includes both rainfall and snow, varies from about 20 to 60 inches depending on elevation (1980–2010 30-year normal; PRISM Climate Group, 2021), generally as snow from December through April, although rainfall can be considerable in May and June. Average temperatures in the Deer Lodge Valley range from 20 degrees Fahrenheit (°F) in January to 63 °F in July (1980–2010 30-year normal; PRISM Climate Group, 2021).
Geology of the upper Clark Fork Basin consists of Cretaceous to Tertiary granite and Tertiary volcanic rocks along the Continental Divide east of Deer Lodge, whereas the Deer Lodge Valley is underlain by Upper Cretaceous and Tertiary sediments as much as 5,500 ft thick (Alden, 1953). The high valley terraces formed on Tertiary sediments in the Deer Lodge Valley are remnants of an erosional surface created during late Pliocene or early Pleistocene time (Alden, 1953). Quaternary alluvium, typically found near all streams, is normally fine to coarse grained and thin in the smaller tributaries. Quaternary alluvium ranges in thickness from about 25 ft in the Deer Lodge Valley to 300 ft in the narrow valley upstream from the confluence with Rock Creek (Alden, 1953; fig. 1). Geology of the Deer Lodge Valley and upper Clark Fork Basin is described in detail by Alden (1953), Konizeski and others (1968), Nimick (1993), and Gammons and others (2006).
Overview of Mining and Remediation Activities
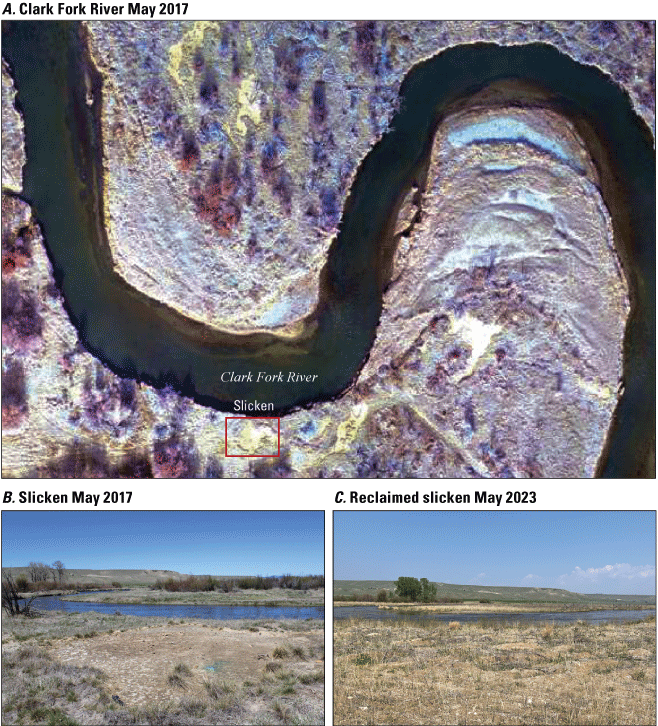
From 1864 to the 1980s, the Butte mining district—formerly known as the “Richest Hill on Earth”—was the epicenter of large-scale extraction; milling; and smelting of gold, silver, copper, and lead ore that brought immense economic wealth to the region (U.S. Environmental Protection Agency, 2004; Gammons and others, 2006). During this period, mining and milling wastes were discarded in the upper Clark Fork Basin (in excess of 100 million tons) resulting in the deposition of large amounts of waste materials enriched with metallic contaminants (including cadmium, copper, iron, lead, manganese, zinc, and the metalloid trace element arsenic) in soils and in nearby streams and floodplains (Andrews, 1987; Moore and Luoma, 1990; Gammons and others, 2006). Large floods in the late 1800s and early 1900s transported enormous volumes of contaminants downstream and resulted in widespread deposition of contaminated sediments in the Clark Fork floodplain and streambanks in the Deer Lodge Valley, damaging terrestrial and aquatic habitat. Long-term flood-irrigation operations in the Deer Lodge Valley further contributed to widespread contamination in the Clark Fork floodplain (Smith and others, 1998) by diverting Clark Fork water with metallic-laden suspended sediments and applying it to the land surface. Exposed tailings, referred to as “slickens,” with low pH and high amounts of metals, caused a phytotoxic condition resulting in denuded areas of vegetation in the floodplain throughout the upper Clark Fork Basin (U.S. Environmental Protection Agency, 2004).
Public water-supply contamination, denuded vegetation, and fish kills attributed to large concentrations of heavy metals derived from the tailings caused the EPA to designate the mine-impacted areas as a Superfund site in 1989. Now the largest contiguous Superfund site in the United States, remediation efforts have included substantial cleanup in the Butte area and removal of the Milltown Dam near Missoula to mitigate some of the most severe contamination (U.S. Environmental Protection Agency, 2004). In 1989 the United States sued Atlantic Richfield Company for reimbursement of costs associated with the Superfund cleanup (U.S. Environmental Protection Agency, 2004). In 2004, the EPA released a Record of Decision (ROD) for the Clark Fork River operable unit (CFROU). The ROD identified a 120-mile section of the Clark Fork as a distinct Superfund operable unit (U.S. Environmental Protection Agency, 2004). The CFROU extends from the Silver Bow Creek and Warm Springs Creek confluence to the former Milltown Reservoir site at the Clark Fork and Blackfoot River confluence (fig. 1). The CFROU consists of surface water, streambed sediments, tailings, impacted soils, groundwater, aquatic resources, terrestrial resources, irrigation ditches, and related sediment deposition and contaminated property within and adjacent to the historic floodplain of the Clark Fork (Montana Department of Environmental Quality, 2015). The ROD designated the Clark Fork River Riparian Evaluation System (CFR RipES), a vegetative survey developed for the CFROU, as an important tool to determine if remediation actions satisfy standards established in the ROD (U.S. Environmental Protection Agency, 2004; Montana Department of Environmental Quality, 2015). A Consent Decree, negotiated with Atlantic Richfield Company as the principle responsible party and all government stakeholders, was signed and filed with the courts in August 2008 (Montana Department of Environmental Quality, 2015; Natural Resources Damage Program, 2023). The Consent Decree assigned performance of the remediation of the CFROU to MDEQ with oversight by the EPA. The ROD designated that the remediation would occur from the beginning of the CFROU downstream to Garrison, Mont. (fig. 1). The ROD contained a prescriptive approach that used an ocular method for identification and delineation of contaminated soils within the 100-year floodplain and indicated that exposed tailings or severely affected soils and vegetation would be removed, and the excavated area revegetated, with the limited exception of severely affected areas that are 400 square feet or less and less than approximately 2 ft deep. In most instances, the ROD remedy was for affected areas to be treated in place using lime addition, soil mixing, and re-vegetation. Contaminated soils that were removed would be disposed of in Opportunity Ponds (not shown in fig. 1, located north of the community of Opportunity, Mont., and northeast of the city of Anaconda). Based on results from the CFR RipES method for mapping of floodplain tailings and soils in 2006–07, the MDEQ determined that the CFR RipES did not reliably capture the depth of contamination of the floodplain soils and was not an effective tool to meet remediation objectives. Therefore, MDEQ developed a remedial design that included “significant differences” from the original ROD remedy (Montana Department of Environmental Quality, 2015). A notable exception to the ROD’s remedial approach was to switch from an ocular approach to identify affected areas to using x-ray fluorescence and lab analyses of depth-integrated soil samples to determine the depth of contamination. This change markedly expanded remediation of affected areas to entail the removal, rather than in-place treatment, of buried tailings in contaminated soils greater than 2 ft in depth (Montana Department of Environmental Quality, 2014, 2015).
Remediation activities upstream from GRKO on Silver Bow Creek between Butte and Anaconda have resulted in substantial (greater than 60 percent) reductions in MCCs at Silver Bow Creek streamgage sampling sites (Sando and others, 2014; Sando and Vecchia, 2016). However, the substantial reductions in Silver Bow Creek have not been translated to the downstream reaches of the Clark Fork, largely because of the mobilization of contaminated sediments as the Clark Fork meanders through the Deer Lodge Valley where there still are extensive unremediated floodplain and tailings deposits (Sando and Vecchia, 2016). More recently (2011 to present), Federal Superfund activities have focused remediation activities from Galen to Deer Lodge. The EPA, in collaboration with MDEQ, subdivided the reach between Galen and Deer Lodge into 17 distinct phases for remediation that encompass approximately 1- to 2-mile sections of the Clark Fork and its adjacent floodplain (Research Specialist, Inc., 2020). Remediation of GRKO property is designated phases 15, 16, and a portion of 17 and consists of a 2.6-mile river length and an accompanying floodplain area of approximately 100 acres (Research Specialist, Inc., 2020). Remediation activities in GRKO began in November 2018 with the planned excavation and removal of 400,000 cubic yards of contaminated soils within the park boundaries to be followed by landscaping/topsoil addition and re-vegetation of the excavated soils (Research Specialist, Inc., 2020). Removal of contaminated soils was completed in November 2020 with the removal of 320,000 cubic yards of soil. Re-vegetation in affected areas was completed in concert with clean soil replacements. An example of contaminated soils at GRKO before and after remediation in the Clark Fork floodplain are shown in figure 2. Placements of an additional 2,500 plants at GRKO was scheduled for spring 2022 (Jeff Johnson, National Park Service, Grant-Kohrs Ranch, oral commun., December 17, 2021).
Remediation of contaminated soils at Work Area G at the Clark Fork at Grant-Kohrs Ranch National Historic Site, Montana. A, Before remediation (October 2016). B, After remediation (March 2023) (Photographs courtesy of Jeff Johnson, National Park Service, Grant-Kohrs Ranch National Historic Site).
Data Collection, Surrogate Data, and Analytical Methods
The USGS collects water samples at 22 sites at established USGS streamgages in the upper Clark Fork Basin to monitor streamflow, MCCs, nutrients, major ions, and suspended sediment as part of the Clark Fork USGS LTMN (Sando and others, 2014; Dodge and Hornberger, 2015; Cleasby and others, 2019; Clark and others, 2020). The current study leveraged the ongoing LTMN effort by collecting an additional nine samples during water years 2019–20 at Clark Fork at Deer Lodge and Clark Fork near Garrison (USGS streamgages 12324200 and 12324400, respectively; fig. 3; U.S. Geological Survey, 2021a, 2021b). The additional samples were collected using the same data-collection protocols and sampling equipment of the LTMN (Clark and others, 2021) with the intent to obtain adequate numbers of samples for the computation of time-series metallic-contaminant and suspended-sediment concentrations (SSCs) and loads.
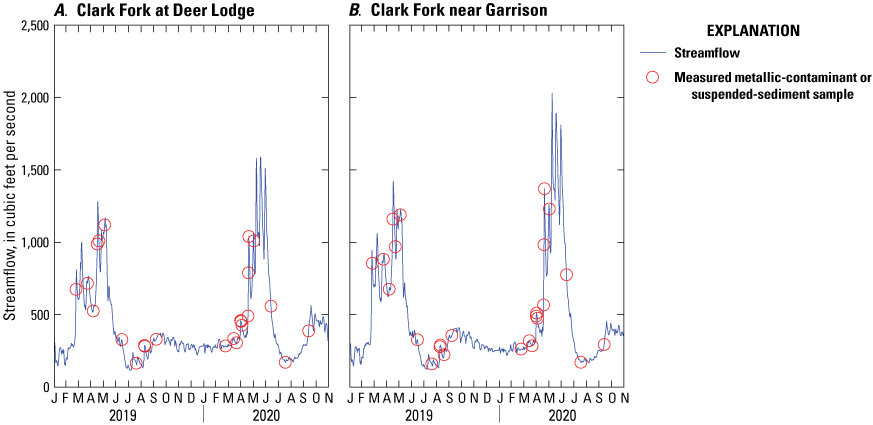
Streamflows at which metallic-contaminant and suspended-sediment samples were collected on the Clark Fork, water years 2019–20 (U.S. Geological Survey, 2023). A, Clark Fork at Deer Lodge, Montana (U.S. Geological Survey streamgage 12324200; U.S. Geological Survey, 2021a). B, Clark Fork above Little Blackfoot River near Garrison, Mont. (U.S. Geological Survey streamgage 12324400; U.S. Geological Survey, 2021b).
Water samples were collected from vertical transits throughout the entire stream depth at multiple locations across the stream by using standard USGS depth- and width-integration methods (EWDI) (Edwards and Glysson, 1999; U.S. Geological Survey, variously dated). EWDI methods provide a vertically and laterally discharge-weighted composite sample that represents the entire flow passing through the cross section of a stream (Dodge and Hornberger, 2015; Clark and others, 2020). Samples were collected with isokinetic depth-integrating water-quality samplers (Davis and Federal Interagency Sedimentation Project, 2005) constructed of plastic or coated with a nonmetallic rubber-coating paint and equipped with polytetrafluoroethylene nozzles. Sample filtration and preservation were completed according to procedures described by Ward and Harr (1990), Horowitz and others (1994), and U.S. Geological Survey (variously dated). Subsamples of the composite water samples were analyzed at the USGS National Water Quality Laboratory (NWQL; National Water Quality Laboratory, 2023) in Denver, Colorado, for filtered (0.45-micrometer pore size) and unfiltered-recoverable concentrations of metallic contaminants (table 2) by using methods described by Garbarino and Struzeski (1998) and Garbarino and others (2006).
Table 2.
Properties, constituents, and associated information relating to laboratory and study reporting levels (National Water Quality Laboratory, 2023).[ft3/s, cubic feet per second; NA, not applicable; µs/cm, microsiemen per centimeter; mg/L, milligram per liter; CaCO3, calcium carbonate; µg/L, microgram per liter]
Water samples for analysis of SSCs were collected from multiple vertical transits concurrently with water-quality samples according to methods described by Edwards and Glysson (1999). Water samples were analyzed for SSCs and the percentage of suspended-sediment mass finer than 0.062-millimeter diameter (silt size and smaller) by the USGS Wyoming-Montana Water Science Center Sediment Laboratory in Helena, Mont., according to methods described by Guy (1969) and Dodge and Lambing (2006). Water-quality data, SSC, streamflow, time-series turbidity and laser in situ scattering and transmissometry acoustic backscatter signal (LISST–ABS) data are available in the USGS National Water Information System (U.S. Geological Survey, 2021a, 2021b). Water-quality samples collected by USGS during the study along with computed time-series metallic-contaminant data and metadata are contained in a USGS data release (Ellison, 2023).
Surrogate Data
The close association among SSCs and MCCs is well documented (Ongley and others, 1981; Allan, 1979), and this association has been observed in the Clark Fork (Sando and others, 2014; Sando and Vecchia, 2016). Prediction of MCCs based on surrogate relations relies on the assumption that sediment in suspension in the Clark Fork is the primary mechanism for the transport of metallic contaminants. The link between suspended sediment and MCCs is dependent on the physical and chemical characteristics of suspended sediment, such as grain size, surface area, and cation exchange capacity, all of which affect the degree to which sediment collects and concentrates metallic contaminants (Allan, 1979; Ongley and others, 1981; Horowitz, 1985). Studies indicate a systematic increase in the content of MCCs with decreasing suspended-sediment particle size and increasing surface area (Horowitz, 1985; Douglas and others, 1993). In the Clark Fork, samples previously collected at Clark Fork at Deer Lodge and Clark Fork near Garrison indicated that fine sized sediments (<0.0625 millimeter) were the dominant sediment size in suspension, constituting 74 and 76 percent, respectively, of collected samples (Dodge and others, 2018). Because fine-sized sediments are the dominant sediment size in the Clark Fork, it is likely that MCCs associated with suspended sediment (particulate phase) in the water column are orders of magnitude higher as compared to the dissolved phase (Horowitz, 1985).
Continuous water-quality monitoring using surrogate data from fixed-point turbidimeters and acoustic velocity meters for estimating SSCs has a proven record of success (Topping and others, 2004; Wagner and others, 2006; Rasmussen and others, 2009; Landers, 2012; Wood and Teasdale, 2013; Groten and others, 2016; Landers and others, 2016). The application of relations among backscatter signals from turbidity and hydroacoustic sensors with SSCs is expanded in this study for use as surrogates to improve estimates of MCCs as compared to using the periodic discrete sampling of the LTMN. For this study, a turbidimeter (Observator Analite NEP5000), measuring formazin nephelometric units and an acoustic sensor (Sequoia Inc. LISST–ABS), measuring uncalibrated SSCs, in milligrams per liter, were installed at each site on the streambank at Clark Fork at Deer Lodge and suspended from the bridge deck at Clark Fork near Garrison below the water surface. The sensors were programmed to transfer measured data using serial data interface (SDI–12) at 1,200 baud communication protocol to a 12-volt battery powered Sutron SatLink3 datalogger at each of the monitoring sites. Data from the turbidity and hydroacoustic sensors were recorded at 15-minute intervals and sent by way of satellite transmission hourly to the USGS office in Helena.
Analytical Methods
MCCs, turbidity, acoustics, SSCs, and discrete measurements of streamflow were analyzed to obtain summary statistics, simple linear regression (SLR), multiple linear regression (MLR), and Wilcoxon rank-sum and Welch’s two-sample t-tests using the R statistical environment (R Development Core Team, 2011; De Cicco and others, 2021; Venables and others, 2022). Summary statistics included the minimum, maximum, mean, median, total number of samples, 25th and 75th percentiles, and ratios of median filtered to median unfiltered-recoverable MCCs. The key elements for computing MCC time-series data from discrete SSC, turbidity, and acoustic data are the type and goodness-of-fit of the regression model used in the calculation. Stepwise regression analysis and model diagnostics were used to determine which models were best at predicting MCCs using turbidity, acoustics, and streamflow as explanatory variables. Nash-Sutcliffe Efficiency values (Nash and Sutcliffe, 1970) and model biases (McCuen and others, 2006) were calculated to determine models’ goodness-of-fit. R–QWTREND (Vecchia and Nustad, 2020) was used to calculate unfiltered flow-adjusted total-recoverable MCCs to normalize concentrations prior to making comparison tests (Wilcoxon rank-sum and Welch’s two-sample t tests) between USGS and NPS water-quality samples.
Estimated Turbidity Values
Throughout the period of record, instream turbidity was periodically missing or deleted from the data record for various reasons, so estimates to fill these gaps were computed by interpolation or by using data from existing records at the study sites. Erroneous values can be recorded because of environmental conditions (for example, debris caught on sensor; sensor is buried or becomes fouled), sensor malfunction (for example, wiper becomes dislodged or parks over the optical window), or power interruption (for example, loose connection). At both study sites, the sensors were removed during the winter months (November to March) to prevent ice damage to the sensor. In 2019, at the Clark Fork at Deer Lodge, turbidity data from March 6–8 and 10–11; May 20 and 21; June 24–July 2; July 4–9, 12–22, and 23–25; August 14–16; and September 2–3 were removed because of sensor fouling. In 2020, there is a data gap on June 8 from 13:45 to 15:30 when a malfunction caused the data to not be recorded. Data gaps occurred during September when turbidity values fell below the minimum threshold of 0.5 formazin nephelometric unit (FNU) during low streamflow. In 2019 at Clark Fork near Garrison, data from March 15 through 29 were removed because of erratic sensor readings. A period from April 24 to 29 was removed owing to erratic sensor readings attributed to placement of the deployment tubes. Data gaps between May 13 from 13:00 to 15:45 and May 29 from 10:15 to 12:30, June 5 from 15:00 to 18:15, June 10 from 07:15 to 09:30, June 14 from 15:45 to 18:00, June 29–July 1, and July 2 from 10:00 to 13:00 were from when turbidity data were removed because of erratic readings from debris fouling from the spring runoff season. Data were removed because of fouling by algae on the following dates: July 17–18 and 25–30; August 6 from 17:30 to 20:15 and 28–30; and October 12 from 15:00 to 18:30. On November 2–3, 9–12, and 14–15, data were removed because of erratic readings caused by floating ice and anchor ice. In 2020, on March 20, 24, 25; and March 28–April 3, turbidity data were removed because of erratic sensor readings. Small data gaps occurred between May 29 and June 1 when extreme low values were removed. Data were removed from August 1 to 12 and from August 14 through the end of the period of record because of extreme low or high turbidity values.
Missing turbidity values at Clark Fork near Garrison in 2019 from March 15 to 29 were estimated by developing relations from turbidity records using 13 matched pairs at Clark Fork at Deer Lodge and Clark Fork near Garrison. For most missing or deleted values, turbidity was estimated by interpolation using the fillMissing function in the R statistical environment (R Development Core Team, 2011; Lorenz, 2015), and checked using direct interpolation. For the beginning and end of the period of record, turbidity values were estimated using existing turbidity and streamflow measurements from the same period (Dodge and Hornberger, 2015; Dodge and others, 2018). Variation in turbidity was compared with streamflow to discount the possibility of substantially higher or lower turbidity from effects of variation in streamflow. Turbidity values at the beginning and end of the monitoring season were estimated in March and October, respectively, when streamflow is typically at its lowest and accounts for <5 percent of the annual sediment loads (Dodge and Hornberger, 2015; Dodge and others, 2018; Cleasby and others, 2019).
Regression Analysis
A stepwise regression approach was used to develop statistical models to predict MCCs based on instantaneous streamflow, turbidity, and acoustics. Stepwise regression alternates between adding and removing variables in the model and testing each variable for significance. If a variable is added to the model and tests significant, and then later tests as insignificant after an additional variable is added, the variable is eliminated from inclusion in the model. In comparing models, a combination of coefficient of determination (R2), Pearson’s r, p-values, and the Prediction Error Sum of Squares (PRESS) statistic (Helsel and others, 2020) was used to determine the best model. The PRESS statistic is a validation-type estimator of error that uses deleted residuals to provide an estimate of the prediction error. Lower values of the PRESS statistic indicate the regression equation produces less error when making new predictions (Helsel and others, 2020).
Simple linear regression (SLR) uses a single explanatory variable, whereas MLR uses two or more explanatory variables to determine which model is best at predicting MCCs. The statistical significance of each model was evaluated based on a p-value <0.05, whereas the R2 (Helsel and others, 2020) was used to assess the linear association between the response and explanatory variable(s) and to assess how well the model was able to accurately predict outcomes of the response variable. For regression models to produce a useable model, the explanatory and response variables are assumed to be related linearly, the variance of the residuals is assumed to be constant (homoscedastic), and the residuals are assumed to be distributed normally (Helsel and others, 2020). These assumptions usually are violated by measured water data, so the data are transformed to logarithmic values to satisfy these assumptions. Natural logarithmic (ln) transformation has been determined to be effective in normalizing residuals for many water-quality measures and streamflow (Helsel and others, 2020). A consequence of transformation of the response variable(s)—in this case MCCs and SSCs—is an introduction of bias (usually negative), which must be accounted for when computing values in their original units (Miller, 1951; Koch and Smillie, 1986). The bias is present because regression estimates are the mean of y given x in log units, and retransformation of these estimates is not equal to the mean of y given x in linear space. To correct for this retransformation bias, Duan (1983) introduced a nonparametric bias-correction factor (BCF) equation called the “smearing” estimator:
whereBCF
is the bias correction factor;
n
is the number of samples;
exp
is Euler’s number (Aghaeiboorkheili and Kawagle, 2022), which is approximately 2.71828; and
ei
is the difference between each measured and modeled value, in lognormal units.
Regression-computed MCCs and SSCs are corrected for bias by multiplying the retransformed value by the BCF. For this study, SLR models were determined to provide the best model for predicting MCCs and SSCs. Measures of correlation (Pearson’s r) and p-values were examined to evaluate the applicability of the model (Helsel and others, 2020). The SLR model predicts values of a response variable based on one explanatory variable:
whereyi
is the ith observation of the response variable;
β0
is the y-intercept;
β1
is the coefficient assigned to the explanatory variable;
χ1
is the ith observation of the explanatory variable;
εi
is the random error or residual for the ith observation; and
n
is the sample size.
For this study, SLR models were based on ln-transformed data:
whereMCCi
is the ith metallic-contaminant concentration (or suspended-sediment concentration), in micrograms per liter (metallic-contaminant concentration) or milligrams per liter (suspended-sediment concentration);
β0
is the y-intercept;
β1
is the coefficient determined for the explanatory variable; and
n
is the sample size.
The ln-transformed SLR model (eq. 4) was retransformed and corrected for bias with a BCF:
whereMCCi
is the ith metallic-contaminant concentration (or suspended-sediment concentration), in micrograms per liter (metallic-contaminant concentration) or milligrams per liter (suspended-sediment concentration);
exp
is Euler’s number (Aghaeiboorkheili and Kawagle, 2022), which is approximately 2.71828;
χi
is the ith observation of the explanatory variable;
β0
is the y-intercept;
β1
is the coefficient determined for the explanatory variable;
BCF
is Duan’s bias-correction factor, as described in equation 1 above; and
n
is the sample size.
Nash-Sutcliffe Efficiency Values
Nash-Sutcliffe Efficiency (NSE) values (Nash and Sutcliffe, 1970) were used to evaluate the effectiveness of predictive models to approximate measured MCCs and SSCs. The NSE value was calculated using the measured values of the sampled data, modeled values, and the mean of the measured values according to the following equation:
whereNSE
is the Nash-Sutcliffe Efficiency value;
n
is the number of observations used;
X0,i
is the measured (observed) value for each observation i;
Xm,i
is the modeled value for each observation i; and
Xmean
is the mean of the measured values.
The NSE values can range from negative infinity to 1. An NSE value of 1 indicates that the model matches the observed values exactly, an NSE value of 0 indicates that the model is predicting values that are no better than the mean of the measured values, and negative values of NSE indicate that the mean of the measured values is better than the model at approximating individual measured values. In general, models are considered predictive if the NSE value is greater than 0.20 (Jenkins, 2015).
Model Bias
Potential sources of systematic and random errors were evaluated when developing models according to McCuen and others (2006). Systematic errors introduce biases in the data, whereas random errors may be associated with unusually high or low values (sample outliers). Positive systematic biases cause models to overestimate measured values, and negative systematic biases cause models to underestimate measured values. Biases were estimated using the mean error, where the error is the difference between the modeled and measured values. Model bias (ē) has the same units as the sampled data and was computed using the following equation:
whereē
is model bias in the same units as the sampled data;
n
is the sample size;
Ŷi
is the modeled value; and
Yi
is the measured value.
Model bias was reported as relative bias (Rb), which is the ratio of the bias to the mean of the measured values and was computed using the following equation:
whereRb
is relative bias, in percent;
ē
is model bias, in the same units as the sampled data; and
ȳ
is the mean value of the measured values.
A relative bias greater than 5 percent is considered substantial (McCuen and others, 2006). Relative biases were computed to assess how model biases affected the ability of the model to approximate measured values. In contrast, outliers represent random errors and might result from mistakes associated with data collection or natural anomalies that do not match the rest of the collected data. In this study, 2 samples out of 52 MCC and SSC samples collected on September 19 and 24, 2019, at Clark Fork near Garrison were identified as outliers and excluded during development of SLR models because of an unusually high percentage of sand in the sample.
Flow Adjusted Concentrations
Flow adjusted concentrations (FACs) for unfiltered total-recoverable MCCs and SSCs were calculated using R–QWTREND (Vecchia and Nustad, 2020) to normalize MCCs prior to doing comparison tests between USGS and NPS water-quality samples. QWTREND software was developed by USGS for analyzing trends in stream-water quality. The R–QWTREND package is a collection of functions written in R (Vecchia and Nustad, 2020) and uses a parametric time-series model to express logarithmically transformed constituent concentration in terms of flow-related variability, trend, and serially correlated model errors. Flow-related variability captures natural variability in concentration based on concurrent and antecedent streamflow. Maximum likelihood estimation was used to estimate model parameters and determine the best-fit trend model (Vecchia and Nustad, 2020). For this study, USGS and NPS water-quality sample data were analyzed concomitant in R–QWTREND and discerned using a remarks code for the singular purpose of calculating FACs. Best-fit trend models were developed in R–QWTREND encompassing a 10-year period (2011–20). Trend analysis models were delineated into three models: no-trend, 1 trend (2011–20), and 2 trends (2011–16 and 2016–20). Although best-fit trend models were developed, trend analysis results are not presented in this report because trend analysis of water quality in the Clark Fork (Sando and others, 2014; Sando and Vecchia, 2016) is bound to a separate statutory agreement between the USGS and EPA. FACs derived from R–QWTREND were computed using the no-trend model to provide consistency among results.
Comparison Tests
The NPS collects water samples on GRKO property to assess stream ecological integrity on the Clark Fork as part of the Rocky Mountain Inventory & Monitoring Network to develop and provide scientific information on the status and long-term trends of park ecosystems (Schweiger and others, 2014; Rocky Mountain Inventory & Monitoring Network, 2023). The NPS is interested in the differences between USGS depth- and width-integrated EWDI water samples of unfiltered total-recoverable metallic contaminants and NPS grab samples (single-point submerged bottle sample) using MDEQ sampling protocols (Billy Schweiger, National Park Service, oral commun., various dates; Schweiger and others, 2014; Makarowski, 2019).
To determine differences between USGS and NPS water-quality samples, a nonparametric Wilcoxon rank-sum test (Helsel and others, 2020) was used. The Wilcoxon rank-sum test compares the median value of the differences between MCCs to zero. A required assumption was that positive and negative differences are symmetric around zero. If the assumption was true, untransformed values were used for the test. If the differences were not symmetric around zero, the values were transformed to achieve symmetry prior to the test. If the median value of the differences was not close to zero and demonstrated a symmetric distribution around a nonzero median, then the two parameters were considered to be from different populations (Helsel and others, 2020). In addition to the Wilcoxon rank-sum test, Welch’s two-sample t-test (Helsel and others, 2020) was used to further substantiate the results of the comparison tests. Percent difference (Ellison and others, 2014; Groten and Johnson, 2018) was used to describe the magnitude of the difference between water-quality samples collected by USGS at Clark Fork at Deer Lodge and water-quality samples collected by NPS at GRKO (approximately 1 mile downstream from the USGS streamgage). The percent difference equation is applied when comparing two constituent values, where one of the values, in this case USGS width- and depth-integrated MCC samples, is assumed to be the value that is more accurate, or “correct,” value, attributed to more rigorous EWDI data collection methods as compared to grab sampling (Ellison and others, 2014; Groten and Johnson, 2018):
whereQuality Assurance
A detailed description of quality-assurance procedures (with associated references) and quality-assurance data for each water year (2019–20) of data collection are presented in the annual data reports for the Clark Fork LTMN (Clark and others, 2021, 2022). The quality of the data was evaluated using quality-control samples that were sampled and analyzed concurrently with primary environmental samples. Quality-control samples consist of replicates, spikes, and blanks that provide quantitative information on the precision and bias of the overall field and laboratory processes (Lambing and others, 1994).
Prior to regression analyses and comparison tests, the following were reviewed to ensure data quality: (1) analytical results as compared with associated quality-assurance sample results, (2) analytical results as compared with results from previously collected samples at the site, (3) filtered as compared with unfiltered-recoverable concentrations, (4) unfiltered-recoverable concentrations as compared with SSCs (including percent fines), and (5) concentrations of MCCs and SSCs as compared with streamflow conditions. During the review, no difference was determined between filtered and unfiltered-recoverable concentrations for iron at Clark Fork at Deer Lodge and Clark Fork near Garrison on May 14, May 19, and June 2, 2020, which is inconsistent with previous work (Dodge and Hornberger, 2015; Cleasby and others, 2019; Clark and others, 2020, 2021, 2022) showing an order of magnitude difference between filtered and unfiltered iron. Because of these unusual results, a laboratory request was submitted to the NWQL to re-analyze these samples. Re-analysis of these samples by the laboratory resolved the problem, and the samples were used in the development of the regression models and comparison tests. There were two environmental samples collected at Clark Fork near Garrison on September 19 and 24, 2019, that indicated high influence attributed to elevated MCCs and SSCs. Closer inspection of the samples indicated relatively low fines composition (41 and 13 percent fines corresponding to 59 and 87 percent sands composition, respectively). Transport of high percentages of sand at low streamflows is unsupported by sedimentological theory (Rasmussen and others, 2009) and contradictory to samples collected previously at this streamgage (percent fines for other samples collected at Clark Fork near Garrison had a mean of 70 percent). These samples were categorized as artifacts likely caused by sampling error (inadvertent scooping of sand-size bed material into the suspended-sediment sampler) and were removed from the dataset.
Streamflow and Water-Quality Characteristics for Water Years 2019–20
Statistically summarizing streamflow and water-quality characteristics of the sampling sites is useful for generally describing water quality and providing comparative information for interpreting relations among surrogate data and MCCs and SSCs. Data are summarized for water years 2019–20, which is a summary period that represents water-quality conditions during remediation activities at GRKO.
General Streamflow Characteristics for Water Years 2019–20
To aid in interpreting water-quality characteristics of the sampling sites, graphical and statistical summaries of continuous streamflow data are presented in figure 4 and table 3. The continuous streamflow data are available in the USGS National Water Information System (U.S. Geological Survey, 2021a, 2021b). In general, streamflow conditions during water years 2019–20 were higher than period-of-record (POR) streamflows. Mean annual streamflow for Clark Fork at Deer Lodge for water years 2019–20 was about 2 times higher than POR (1979–2020) mean annual streamflow (table 3). The POR for streamflow at Clark Fork near Garrison was shorter (2010–20) than at Clark Fork at Deer Lodge because the streamgage was not established until 2009. Mean annual streamflow for Clark Fork near Garrison for water years 2019–20 was 59 percent higher than the POR mean annual streamflow (table 3). The mean annual streamflow for Clark Fork at Deer Lodge and Clark Fork near Garrison for water years 2019–20 was 540 and 558 ft3/s, respectively (table 3). There are no major tributaries that enter the Clark Fork within the study reach to account for the difference in streamflow between the study sites; however, there are numerous ephemeral gulches and groundwater inflow that add small discharges into the main-stem channel that likely account for the difference in mean annual streamflow. There was no difference in median annual streamflow between the two sites (461 ft3/s; table 3). The larger mean value compared to the median indicated that the distribution was right (positive) skewed, which is typical of streamflow and water-quality data when there are episodic elevated streamflows causing the mean value to be higher than the median (Helsel and others, 2020).
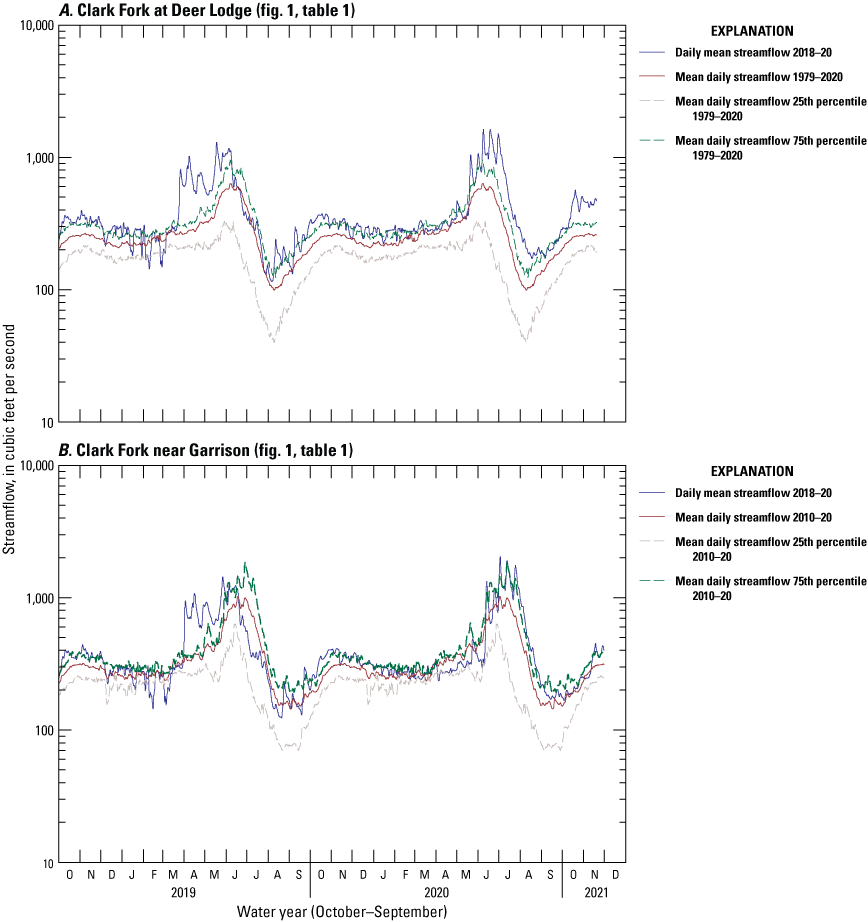
Daily mean and mean daily streamflows near Grant-Kohrs Ranch National Historic Site in the upper Clark Fork Basin, Montana, water years 2019–20. A, Clark Fork at Deer Lodge, Montana (U.S. Geological Survey streamgage 12324200; U.S. Geological Survey, 2021a). B, Clark Fork above Little Blackfoot River near Garrison, Montana (U.S. Geological Survey streamgage 12324400; U.S. Geological Survey, 2021b).
Table 3.
Statistical summaries of continuous streamflow data at Clark Fork at Deer Lodge, Montana (U.S. Geological Survey streamgage 12324200; U.S. Geological Survey, 2021a) and Clark Fork above Little Blackfoot River near Garrison, Mont. (U.S. Geological Survey streamgage 12324400; U.S. Geological Survey, 2021b) in the upper Clark Fork Basin, Montana.[Water year is the 12-month period from October 1 through September 30 and is designated by the year in which it ends. USGS, U.S. Geological Survey; POR, period of record]
| USGS site number (fig. 1; table 1) |
Abbreviated site name (table 1) |
Drainage area (square miles) |
Analysis period, in water years (number of years) | Statistical summaries of daily mean streamflow (2019–20) and mean daily streamflow (1979–2020; 2010–20) (cubic feet per second) |
|||||
|---|---|---|---|---|---|---|---|---|---|
| Minimum | 25th percentile | Median | Mean1 | 75th percentile | Maximum | ||||
| 12324200 | Clark Fork at Deer Lodge | 995 | 2019–20 (2) | 163 | 324 | 461 | 540 | 711 | 1,130 |
| POR: 1979–2020 (42) | 22 | 214 | 243 | 267 | 280 | 2,390 | |||
| 12324400 | Clark Fork near Garrison | 1,139 | 2019–20 (2) | 159 | 289 | 461 | 558 | 837 | 1,370 |
| POR: 2010–20 (11) | 55 | 249 | 287 | 350 | 369 | 2,560 | |||
Water-Quality Characteristics for Water Years 2019–20
Statistical summaries of water-quality data (water years 2019–20) for the two sampling sites are based on unadjusted MCCs (the observed concentrations before flow adjustment; table 4). Flow adjustment, as described in the “Flow Adjusted Concentrations” section, is relevant when interpreting differences in contaminant concentrations between USGS and NPS water-quality samples that are strongly dependent on streamflow conditions. However, flow adjustment is not relevant for statistically summarizing the observed water-quality data during water years 2019–20.
Table 4.
Statistical summaries of water-quality data collected at Clark Fork at Deer Lodge, Montana (U.S. Geological Survey streamgage 12324200; U.S. Geological Survey, 2021a) and Clark Fork above Little Blackfoot River near Garrison, Mont. (U.S. Geological Survey streamgage 12324400; U.S. Geological Survey, 2021b) in the upper Clark Fork Basin, Montana, water years 2019–20.[Water year is the 12-month period from October 1 through September 30 and is designated by the year in which it ends. ft3/s, cubic foot per second; µS/cm, microsiemen per centimeter at 25 degrees Celsius; mg/L, milligram per liter; CaCO3, calcium carbonate; µg/L, microgram per liter; NA, not applicable to non trace element constituent]
Ratios of median filtered to unfiltered-recoverable MCCs reported in table 4 provide general information on the predominant phase (that is, dissolved or particulate) of metallic contaminants in transport. Values of aquatic-life standards (Montana Department of Environmental Quality, 2019; based on median hardness for each site for water years 2019–20) for cadmium, copper, lead, and zinc are presented in table 5. Those values were used for plotting the standards relative to the statistical distributions of selected MCCs. The arsenic human-health standard is 10 micrograms per liter (μg/L; Montana Department of Environmental Quality, 2019). Percentages of samples (water years 2019–20) with unadjusted unfiltered-recoverable concentrations exceeding water-quality standards for each site are presented in table 6. The exceedance percentages for the hardness-based aquatic-life standards for cadmium, copper, lead, and zinc in table 6 were based on comparison of MCCs of each individual sample with the aquatic-life standards that were calculated using the hardness for each individual sample.
Table 5.
Aquatic-life standards (based on median hardness for water years 2019–20) at Clark Fork at Deer Lodge, Montana (U.S. Geological Survey streamgage 12324200; U.S. Geological Survey, 2021a) and Clark Fork above Little Blackfoot River near Garrison, Mont. (U.S. Geological Survey streamgage 12324400; U.S. Geological Survey, 2021b) in the upper Clark Fork Basin, Montana, water years 2019–20 (Montana Department of Environmental Quality, 2019).| Abbreviated sampling site name (table 1) |
Median hardness for water years 2019–20, (mg/L as CaCO3) |
Aquatic-life standards (Montana Department of Environmental Quality, 2019) (micrograms per liter) |
|||||||
|---|---|---|---|---|---|---|---|---|---|
| Cadmium | Copper | Lead | Zinc | ||||||
| Acute | Chronic | Acute | Chronic | Acute | Chronic | Acute | Chronic | ||
| Clark Fork at Deer Lodge | 189 | 3.54 | 1.31 | 25.5 | 16.1 | 183.6 | 7.15 | 205 | 205 |
| Clark Fork near Garrison | 196 | 3.67 | 1.35 | 26.4 | 16.6 | 192.3 | 7.49 | 212 | 212 |
Table 6.
Percentages of samples collected with unadjusted unfiltered-recoverable metallic-contaminant concentrations exceeding water-quality standards at Clark Fork at Deer Lodge, Montana (U.S. Geological Survey streamgage 12324200; U.S. Geological Survey, 2021a) and Clark Fork above Little Blackfoot River near Garrison, Mont. (U.S. Geological Survey streamgage 12324400; U.S. Geological Survey, 2021b) in the upper Clark Fork Basin, Montana, water years 2019–20.| Abbreviated sampling site name (table 1) |
Percentage of samples exceeding indicated standard | ||||||||
|---|---|---|---|---|---|---|---|---|---|
| Arsenic human- health standard1 |
Cadmium | Copper | Lead | Zinc | |||||
| Acute | Chronic | Acute | Chronic | Acute | Chronic | Acute | Chronic | ||
| Clark Fork at Deer Lodge | 96 | 0 | 0 | 68 | 92 | 0 | 56 | 8 | 8 |
| Clark Fork near Garrison | 96 | 0 | 7 | 70 | 85 | 0 | 52 | 7 | 7 |
Arsenic human-health standard is 10 micrograms per liter (Montana Department of Environmental Quality, 2019)
Statistical distributions of water-quality characteristics of the sampling sites are shown in figure 5 using boxplots of selected example constituents (unadjusted concentrations of arsenic, copper, lead, and suspended sediment). The boxplots provide an overview of important water-quality characteristics in the upper Clark Fork Basin. Copper is presented because it exceeded aquatic-life standards more frequently and with greater relative magnitude than other metallic contaminants. Arsenic and copper are constituents of concern with respect to potential toxicity issues, but they exhibit different geochemical characteristics. Spatial and temporal variability in copper concentrations in the upper Clark Fork Basin shows similar patterns as other metallic contaminants that adsorb to particulates in water (Sando and others, 2014); therefore, copper was considered to be representative of those other metallic contaminants. In contrast, arsenic in the upper Clark Fork Basin primarily existed in the dissolved phase (table 4) and did not exhibit the same variability as other metallic contaminants (Sando and others, 2014). Lead is presented because it is toxic and, unlike copper and arsenic, there is a substantial difference between acute and chronic aquatic-life standards (table 5; Montana Department of Environmental Quality, 2019). Suspended sediment provides information on transport of particulate materials, which is a factor that can strongly affect transport of metallic contaminants.
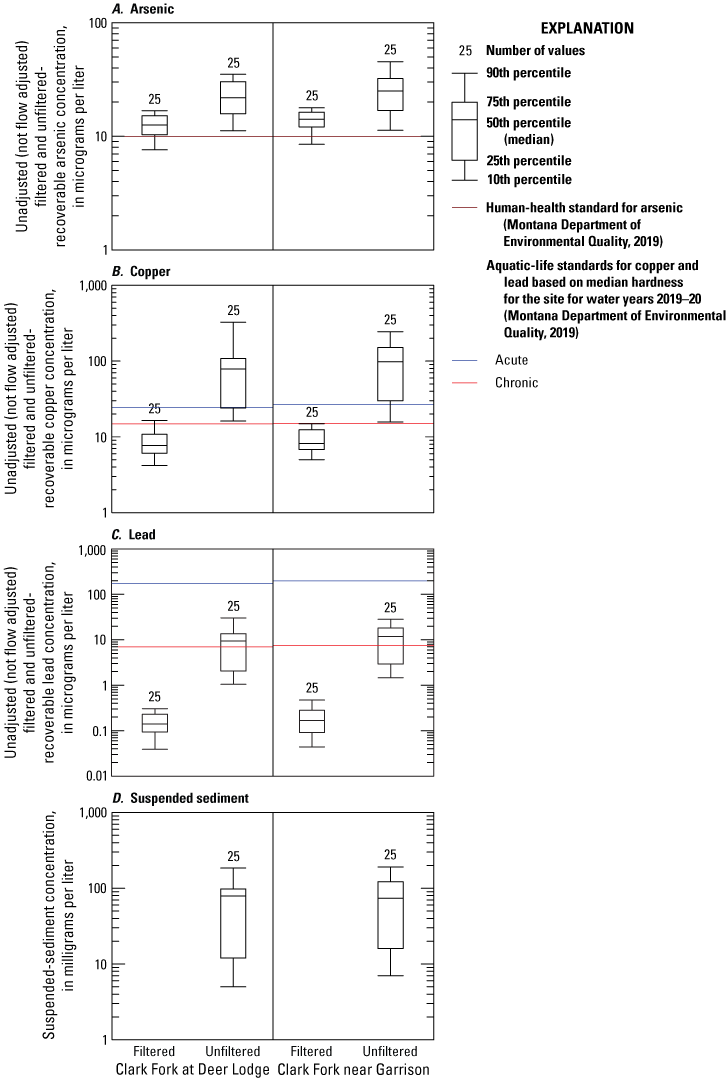
Statistical distributions of selected constituents at Clark Fork at Deer Lodge, Montana (U.S. Geological Survey streamgage 12324200; U.S. Geological Survey, 2021a) and Clark Fork above Little Blackfoot River near Garrison, Mont. (U.S. Geological Survey streamgage 12324400; U.S. Geological Survey, 2021b), in the upper Clark Fork Basin, water years 2019–20. A, Arsenic. B, Copper. C, Lead. D, Suspended sediment.
Small increases were observed in median concentrations of unfiltered-recoverable MCCs downstream at Clark Fork near Garrison in water years 2019–20. There was a corresponding small decrease in the median concentration of suspended sediment (table 4) between the two sampling sites, which is notable and might indicate deposition of suspended sediment in the reach during receding streamflow or that floodplains and streambanks, which are primary sources of contaminants to the main-stem channel (Smith and others, 1998), were becoming less erodible.
It is expected that water quality in the Clark Fork will improve as planned remediation work replaces contaminated soils with clean soils in the floodplains above Clark Fork at Deer Lodge and on GRKO property. Remediation of the Clark Fork floodplain and streambanks downstream between GRKO property and Clark Fork near Garrison is in the planning stage and may result in measurable improvements in water quality in the study reach. Ultimately, it is hoped that strides to improve water quality in the Clark Fork will enable MDEQ to remove the Clark Fork from the EPA’s 303(d) impaired waters list (Montana Department of Environmental Quality, 2021).
During water years 2019–20, exceedances of water-quality standards (table 6) followed similar patterns reported by Sando and Vecchia (2016). The acute aquatic-life standard for copper was exceeded in 68 percent of samples at Clark Fork at Deer Lodge and 70 percent of the samples at Clark Fork near Garrison, whereas the chronic aquatic-life standard for copper was exceeded in 92 percent of samples at Clark Fork at Deer Lodge and 85 percent of the samples at Clark Fork near Garrison. For arsenic, the human-health standard of 10 µg/L was exceeded in 96 percent of the samples for both sites. For lead, the chronic aquatic-life standard was exceeded at Clark Fork at Deer Lodge and Clark Fork near Garrison in 56 and 52 percent of samples, respectively (table 6).
Adequacy of Model-Calibration Datasets
An adequate model-calibration dataset for developing regression models relating water quality and explanatory variables consists of a suitable number of water-quality samples and concurrent turbidity, acoustics, and streamflow measurements collected throughout the observed range of hydrologic conditions for the POR (Rasmussen and others, 2009). For this study, samples collected during water years 2019–20 were distributed over the range of fixed-point turbidity, acoustics, and streamflow measurements, with emphasis placed on medium and high periods of streamflow (figs. 3, 6, and 7).
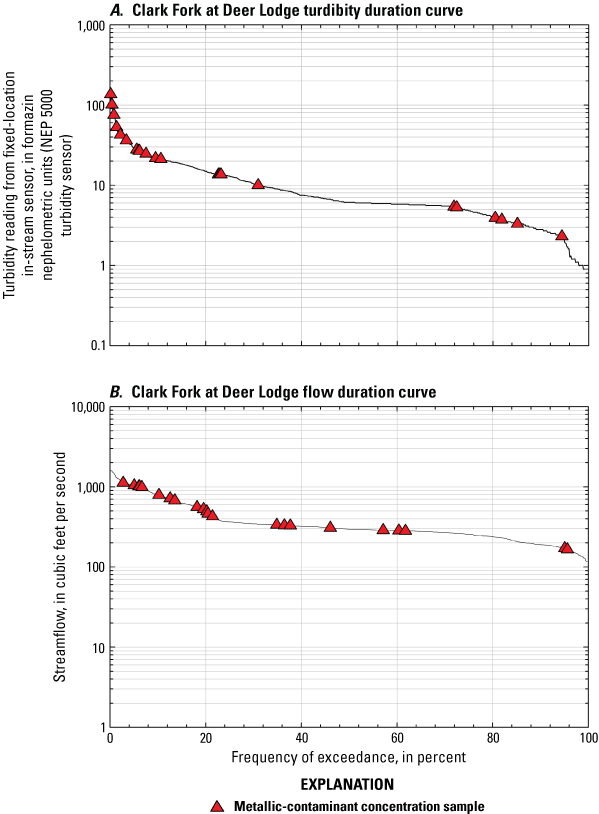
Duration curves at Clark Fork at Deer Lodge, Montana (U.S. Geological Survey streamgage 12324200; U.S. Geological Survey, 2021a) and corresponding points along the curve where metallic-contaminant concentration samples were collected for water years 2019–20. A, Turbidity. B, Streamflow.
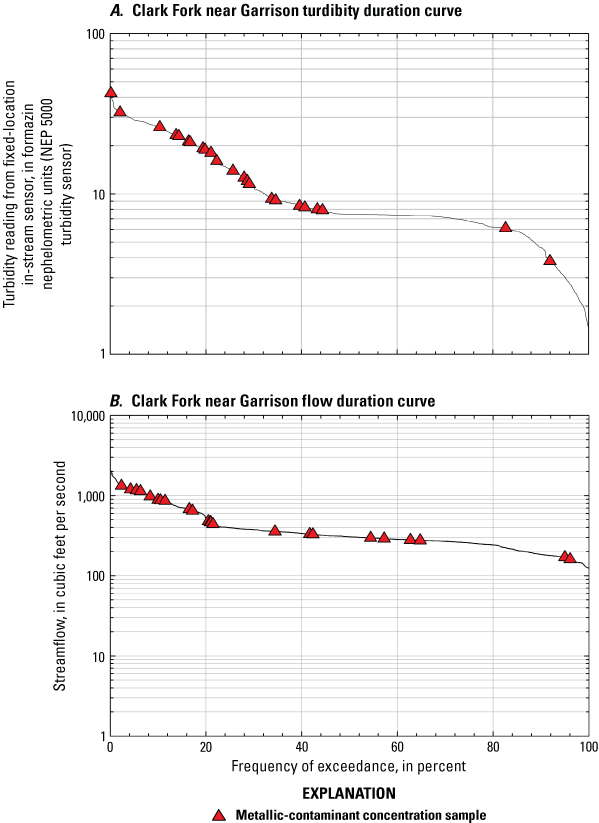
Duration curves at Clark Fork above Little Blackfoot River near Garrison, Montana (U.S. Geological Survey streamgage 12324400; U.S. Geological Survey, 2021b) and corresponding points along the curve where metallic-contaminant concentration samples were collected for water years 2019–20. A, Turbidity. B, Streamflow.
During the record-working phase of the study for turbidity and LISST–ABS acoustic time-series data, it was determined that the LISST–ABS sensors had excessive drift (−20 to 30 percent). Because the LISST–ABS was a recently developed, research-grade sensor, instrument acceptance criteria had not been established by the USGS Hydrologic Instrumentation Facility at the time of the study. Therefore, monitor operation and record computation were applied to LISST–ABS sensors and associated data following procedures established for turbidity sensors regarding calibration criteria and maximum allowable limits for sensor fouling and drift as described in Wagner and others (2006) and Anderson (2004). Because of excessive drift, and to adhere to guidelines in Wagner and others (2006), it was determined that LISST–ABS data would not be used in the development of time-series models and that turbidity would be the primary explanatory variable, with streamflow to a lesser extent, used to predict MCCs and SSCs. Even though LISST–ABS data were not used in time-series models, the relations between corrected LISST–ABS data and MCCs are presented in this report.
Serial correlation typically is present when data are collected in close temporal proximity, causing the regression assumption of data independence to be violated. This violation happens if multiple discrete samples of the same type are collected during the rising and falling of a storm-related runoff event. Serial correlation between data points used in a regression model causes inefficiencies in the estimates of the regression coefficients and might cause substantial underestimation of the variance in the model (Helsel and others, 2020). One method for assessing serial correlation is to check for independence among residuals during development of the regression model. A statistic to assess serial correlation of the residuals is the Durbin-Watson statistic (Durbin and Watson, 1950), as shown in the following equation:
whered
is the Durbin-Watson statistic;
n
is the sample size;
ei
is the ith residual;
ei−1
is the ith–1 residual; and
is the ith residual squared.
According to Durbin and Watson (1950), the value of d always lies between 0 and 4. A small value of d (for example, d < 2) is an indication of positive serial correlation. To test for positive serial correlation at a chosen significance level α, the Durbin-Watson statistic d, is compared to a critical value dL (Durbin and Watson, 1950). The null hypothesis that the residuals are independent is rejected in favor of serial correlation when d<dL. The value of dL depends on the size of the dataset, the number of explanatory variables, and α (Helsel and others, 2020). Little or no serial correlation was detected in the residuals when using the Durbin-Watson statistic (d>dL in 30 of 32 SLR models) for Clark Fork at Deer Lodge and Clark Fork near Garrison and using turbidity and acoustics as explanatory variables in SLR analysis.
Duration curves, which are cumulative frequency curves that show the percent of time that specified time-series data (for example, turbidity and streamflow) are equaled or exceeded, can be used to check the distribution of MCC and SSC samples across the period of record. For this study, daily turbidity and streamflow values were sorted largest to smallest to construct turbidity and streamflow duration curves using time-series data from fixed-point sensors. Exceedance probabilities were calculated for each turbidity and streamflow value using Weibull’s plotting position (Weibull, 1951; Helsel and others, 2020). Ideally, turbidity and streamflow associated with MCCs and SSCs samples span the ranges of the time-series turbidity and streamflow values. The turbidity duration curves presented in figures 6 and 7 were developed using daily turbidity and streamflow values from fixed-point sensors for water years 2019–20. The turbidity and streamflow values associated with MCC samples were plotted along the duration curve.
Relations among Streamflow, Turbidity, Acoustics, Suspended-Sediment Concentrations, and Metallic-Contaminant Concentrations
Understanding the association between SSCs and MCCs is important because riverine transport of contaminants is dominated by suspended sediment in the water column, and in most cases, the concentration of metallic contaminants in suspended sediment is far greater than the concentration of contaminants dissolved in the water column (Horowitz, 1985).
Variations in streamflow provide important information for the timing and changes in suspended-sediment transport and traditionally have been used to develop SSC prediction models. Streamflow, turbidity, and acoustic signals inherently are related because each can be used as a predictor of SSCs in streams. Although the association between suspended sediment and streamflow has been used in the prediction of SSCs, the advancement of in-stream fixed-point turbidity and acoustic sensors and the development of SSC-turbidity and SSC-acoustic surrogate relations (Rasmussen and others, 2009; Landers and others, 2016) offer an opportunity to improve understanding of suspended-sediment transport, fate, and source. In general, higher streamflow transports larger amounts of sediment and associated MCCs. In Montana, streamflow typically is highest in the spring because of melting of the winter snowpack. Streamflow usually diminishes following spring runoff and alternately increases and decreases in response to storm events through the rest of the year. Streamflow tends to drop gradually during the summer, with low flow reached in late July or August.
Relations between Suspended-Sediment Concentrations and Streamflow, Turbidity, and Acoustics
For both sampling sites, SLR models were developed using natural log transformed data for SSCs, streamflow, turbidity, and acoustics to assess the relations between these parameters. Goodness-of-fit indicators, such as R2, NSEs, and model biases, were calculated to assess the strength of the models.
Although streamflow has traditionally been used as the primary explanatory variable for SSCs, it is not always directly related to SSCs, and the relation between the two is known to vary extensively (Guy, 1970; Tornes, 1986; Tornes and others, 1997; Blanchard and others, 2011). According to Knighton (1998), this variation happens largely because the dominant control on suspended sediment is the rate of supply, which is affected by myriad factors, including sediment availability, season, watershed size, and source location within the watershed. Considerable variation in SSCs might be attributed to the result of a hysteresis effect with streamflow. Clockwise hysteresis (higher sediment concentration on the rising limb of the hydrograph) is common in small watersheds because sediment sources are closer to the stream channel. Counterclockwise hysteresis might be present in large watersheds where upstream sources continue to supply the bulk of the load after the streamflow peak (Knighton, 1998). Seasonal differences contribute to the variation in SSCs because sediment transport typically is greater in the spring during snowmelt runoff. The availability of sediment at its sources also affects how SSCs vary with streamflow at a particular location. Because of these and other factors, the variation and range of SSCs during any runoff event may differ from concentrations during other periods, even though streamflow may be identical or similar (Porterfield, 1972).
There is a proven record of success for using turbidity and acoustic backscatter in linear regression analysis to predict SSCs (Uhrich and Bragg, 2003; Topping and others, 2004; Rasmussen and others, 2009; Wall and others, 2006; Gray and Gartner, 2009; Landers, 2012; Wood and Teasdale, 2013; Groten and others, 2016). Turbidity and acoustic backscatter signals from fixed-point sensors are not a direct measure of suspended particles in water but are measures of the scattering and absorbing effect such particles have on light (turbidimeters) and sound waves (acoustics). These properties yield superior results when developing SSC regression models compared to streamflow, which relies on energy generated from streamflow to provide a measure of SSCs (Rasmussen and others, 2009; Landers and others, 2016). Turbidity and acoustics used as explanatory variables in regression analysis likely will produce more reliable SSC time-series models with smaller uncertainty values than a sediment-transport curve using streamflow as the explanatory variable (Rasmussen and others, 2009). These models can be used to compute continuous SSC values and loads using data within the measurement range of the turbidity and acoustic meter (Rasmussen and others, 2009; Landers and others, 2016).
Sequoia Scientific’s LISST–ABS, used in this study, is a submersible fixed-point acoustic sensor designed specifically for measuring SSCs (Sequoia Scientific, 2016). In concept, the advantages of an acoustic backscatter sensor over optical turbidity sensors are less sensitivity to grain size, less susceptibility to fouling, and a larger working range in concentration (Snazelle, 2017). The LISST–ABS expands the measurement range of turbidimeters, which generally are limited to measuring 5,000–6,000 FNUs, to measurements of SSCs as much as 30,000 milligrams per liter. The LISST–ABS is easier to install compared to typical acoustic velocity meters and uses simplified reporting units (milligrams per liter); hence, data reduction requirements are minimized. Initial laboratory testing of the LISST–ABS by Snazelle (2017) was promising, and field evaluation by Manaster and others (2020) determined strong relations between LISST–ABS data and physically collected SSCs at 10 USGS streamgages, with Pearson’s r values ranging from 0.718 to 0.956. The tandem application of acoustics and optics has the potential to overcome previously unresolved issues related to variability in sensor response to heterogenous particle sizes and poor relations between SSCs and streamflow attributed to pulse-driven large streamflow events.
The relations between SSCs and streamflow and turbidity, and LISST–ABS for each sampling site are shown in figures 8–10. Results of the SLR analysis between SSC and streamflow, turbidity, and acoustics presented in table 7 provide a quantitative description of the plots shown in figures 8–10. Best-fit regression lines, which represent the relations between SSCs, and streamflow, turbidity, and acoustics, can be used to evaluate how SSCs respond to changes in streamflow, turbidity, and acoustic backscatter.
The relation between SSCs and streamflow was statistically significant (p-value<0.01) for both sites. For Clark Fork at Deer Lodge, the adjusted R2 value was 0.52 and for Clark Fork near Garrison, the adjusted R2 value was 0.48. The relation between SSCs and turbidity and acoustic backscatter was statistically significant (p-value<0.01) for both sites, with each site’s adjusted R2 values being higher than the SSC-streamflow relation (table 7). For Clark Fork at Deer Lodge, the adjusted R2 value for the SSC-turbidity SLR model was 0.95 and the SSC-LISST–ABS SLR model was 0.96. For Clark Fork near Garrison, the adjusted R2 value for the SSC-turbidity SLR model was 0.97, and the adjusted R2 for the SSC-LISST–ABS SLR model was 0.98. The NSE values indicated that streamflow was not a good predictor of SSCs at Clark Fork at Deer Lodge and only a marginal predictor of SSCs at Clark Fork near Garrison, with NSE values of −0.01 and 0.33, respectively. In contrast, NSE values indicated that turbidity and acoustics were strong predictors of SSCs at both sites with NSE values of 0.92 and 0.97 at Clark Fork at Deer Lodge, respectively, and 0.97 at Clark Fork near Garrison, respectively. Model biases ranged from −9.7 percent using turbidity as a predictor of SSCs at Clark Fork at Deer Lodge to 52.6 percent using streamflow as a predictor of SSCs at Clark Fork at Deer Lodge (table 7).
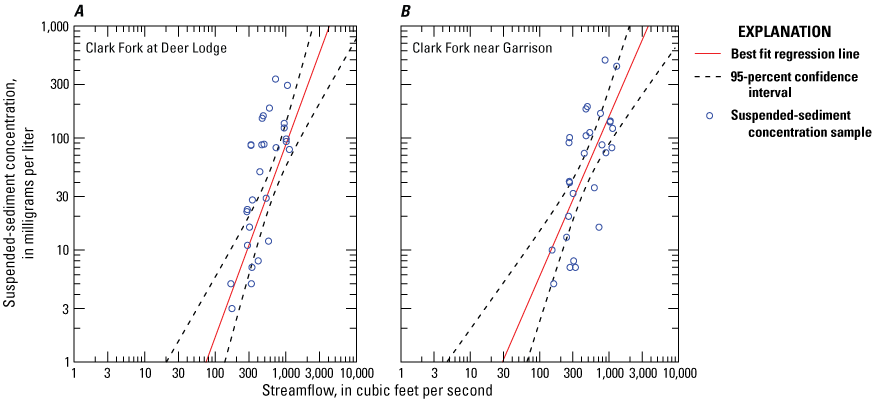
Relations between suspended-sediment concentrations and streamflow in the upper Clark Fork Basin, Montana, for water years 2019–20. A, Clark Fork at Deer Lodge, Montana (U.S. Geological Survey streamgage 12324200; U.S. Geological Survey, 2021a). B, Clark Fork above Little Blackfoot River near Garrison, Mont. (U.S. Geological Survey streamgage 12324400; U.S. Geological Survey, 2021b).
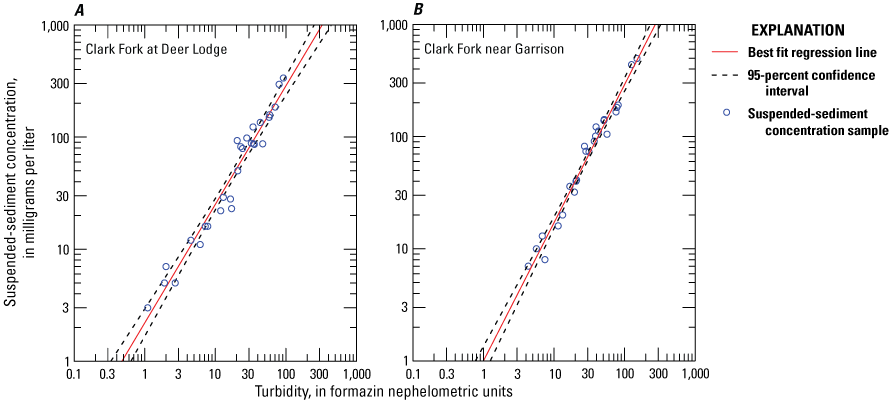
Relations between suspended-sediment concentrations and turbidity in the upper Clark Fork Basin, Montana, for water years 2019–20. A, Clark Fork at Deer Lodge, Montana (U.S. Geological Survey streamgage 12324200; U.S. Geological Survey, 2021a). B, Clark Fork above Little Blackfoot River near Garrison, Mont. (U.S. Geological Survey streamgage 12324400; U.S. Geological Survey, 2021b).
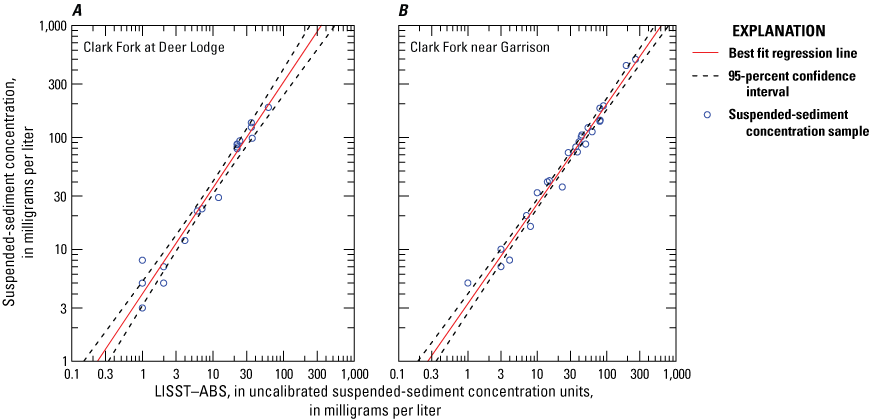
Relations between suspended-sediment concentrations and LISST–ABS uncalibrated suspended-sediment concentrations in the upper Clark Fork Basin, Montana, for water years 2019–20. A, Clark Fork at Deer Lodge, Montana (U.S. Geological Survey streamgage 12324200; U.S. Geological Survey, 2021a). B, Clark Fork above Little Blackfoot River near Garrison, Mont. (U.S. Geological Survey streamgage 12324400; U.S. Geological Survey, 2021b).
Table 7.
Simple linear regression coefficients, confidence intervals, residual standard errors, Nash-Sutcliffe efficiencies (Nash and Sutcliffe, 1970), and model biases using streamflow, turbidity, and LISST–ABS (acoustics) as explanatory variables for suspended-sediment concentrations (SSCs) at Clark Fork at Deer Lodge, Montana (U.S. Geological Survey streamgage 12324200; U.S. Geological Survey, 2021a) and Clark Fork above Little Blackfoot River near Garrison, Mont. (U.S. Geological Survey streamgage 12324400; U.S. Geological Survey, 2021b), in the upper Clark Fork Basin, Montana, water years 2019–20.[b0, regression coefficient for the intercept; %, percent; b1, regression coefficient for the slope; p-value, calculated probability; RSE, residual standard error; R2, coefficient of determination; BCF, bias correction factor; NSE, Nash-Sutcliffe efficiency (Nash and Sutcliffe, 1970); n, total number of samples; SSC, suspended-sediment concentration; exp, Euler's number (Aghaeiboorkheili and Kawagle, 2022), approximately 2.71828; Q, streamflow; <, less than; T, turbidity; LISST–ABS, uncalibrated suspended-sediment concentration, in milligrams per liter]
Relations between Metallic-Contaminant Concentrations and Suspended-Sediment Concentrations
Summarizing the relations between metallic contaminants and suspended sediments at the sampling sites is useful for describing suspended-sediment effects on MCCs relevant for interpreting relations among turbidity and LISST–ABS surrogate data with MCCs. The correlation between metallic contaminants and suspended sediments lies in the innate properties of sediment-trace element chemistry. The main mechanisms for the retention of MCCs on suspended-sediment particles (that is, adsorption) are the collaborative effects of grain size, surface area, surface charge, and cation exchange capacity. Adsorption is defined as the consolidation of atoms, ions, or molecules on the surface of an independent substrate (Horowitz and others, 1994), and differs from absorption, which involves penetration of a constituent into the body, or inner structure, of another material. One of the most important factors that affect the capacity for suspended sediment to control and retain MCCs is grain size, such that there is a strong positive correlation between decreasing grain size and increasing contaminant concentrations (Jenne and others, 1980; Hart, 1982; Horowitz, 1985; Horowitz and Elrick, 1987). Fine-grained sediments, because of their large surface areas, provide the main sites for the collection and transport of MCCs. In addition to grain size, cation exchange capacity and surface charge (metallic contaminants have a positive charge, whereas sediment particles have a negative surface charge) are key to the tendency of suspended sediment to retain metallic contaminants. For the Clark Fork, suspended sediment has a high capacity to retain metallic contaminants. For both sampling sites, MCC–SSC relations (figs. 11, 12) and SLR models (table 8) indicate exceptionally strong relations between concentrations of unfiltered total-recoverable metallic-contaminant concentrations and suspended sediment.
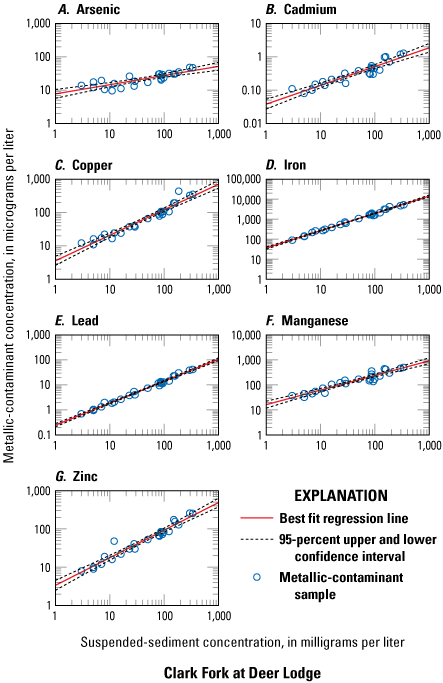
Relations among metallic-contaminant concentrations and suspended-sediment concentrations at Clark Fork at Deer Lodge, Montana (U.S. Geological Survey streamgage 12324200; U.S. Geological Survey, 2021a) in the upper Clark Fork Basin, Montana, for water years 2019–20. A, Arsenic. B, Cadmium. C, Copper. D, Iron. E, Lead. F, Manganese. G, Zinc.
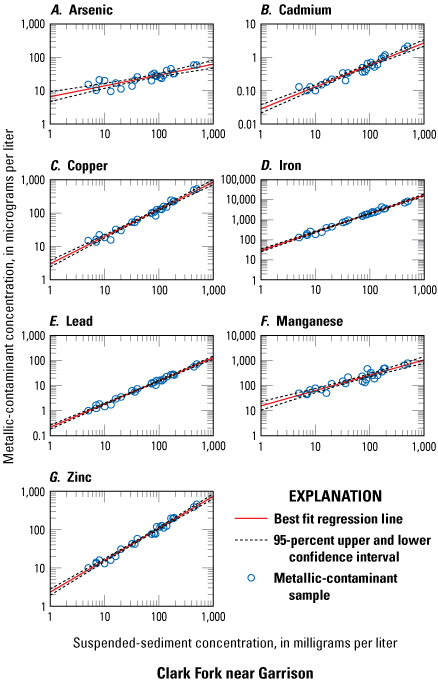
Relations among metallic-contaminant concentrations and suspended-sediment concentrations at Clark Fork above Little Blackfoot River near Garrison, Montana (U.S. Geological Survey streamgage 12324400; U.S. Geological Survey, 2021b), in the upper Clark Fork Basin, Montana, for water years 2019–20. A, Arsenic. B, Cadmium. C, Copper. D, Iron. E, Lead. F, Manganese. G, Zinc.
Table 8.
Regression coefficients, confidence intervals, residual standard errors, Nash-Sutcliffe efficiencies (Nash and Sutcliffe 1970), and model biases using suspended-sediment concentration as the explanatory variable for metallic-contaminant concentrations at Clark Fork at Deer Lodge, Montana (U.S. Geological Survey streamgage 12324200; U.S. Geological Survey, 2021a) and Clark Fork above Little Blackfoot River near Garrison, Mont. (U.S. Geological Survey streamgage 12324400; U.S. Geological Survey, 2021b), in the upper Clark Fork Basin, water years 2019–20.[b0, regression coefficient for the intercept; %, percent; b1, regression coefficient for the slope; p-value, calculated probability; RSE, residual standard error; R2, coefficient of determination; BCF, bias correction factor; NSE, Nash-Sutcliffe efficiency (Nash and Sutcliffe, 1970); n, total number of samples; MCC, metallic-contaminant concentration; exp, Euler's number (Aghaeiboorkheili and Kawagle, 2022), approximately 2.71828; SSC, suspended-sediment concentration; <, less than]
For the Clark Fork at Deer Lodge, R2 values for MCC–SSC SLR models ranged from 0.88 for cadmium to 0.99 for iron and lead and ranged from 0.88 for manganese to 0.99 for iron and lead at Clark Fork near Garrison. For SLR models, R2 values equaled or exceeded 0.90 in 10 of 12 models (table 8). Arsenic had an R2 value of 0.69 at Clark Fork at Deer Lodge and 0.73 at Clark Fork near Garrison. Arsenic, which is generally more soluble than metallic contaminants in the upper Clark Fork Basin, is present predominantly in the dissolved phase in the upper Clark Fork Basin (table 4), which is likely the cause, in part, of the weaker relation with SSCs compared to metallic contaminants. Arsenic has been widely dispersed in the upper Clark Fork Basin from deposition of flue dust and smelter emissions with resultant large-scale soil and groundwater contamination (U.S. Environmental Protection Agency, 2010). These factors result in high arsenic concentrations that exceed human-health standards in 96 percent of the samples (fig. 5; table 6) collected in stream channels for a large range of streamflow conditions.
NSE values followed similar patterns as R2 values (table 8), indicating that suspended sediment is a strong predictor of MCCs. NSEs ranged from 0.78 for copper at Clark Fork at Deer Lodge to 0.99 for lead at Clark Fork near Garrison. For unfiltered total-recoverable metallic contaminants, NSE values for 8 out of 12 models exceeded 0.90, whereas NSE values for the metalloid trace element arsenic averaged 0.79 for both sites. Model biases indicated little or no bias in the SLR models for MCCs, ranging from −5.3 percent for copper to 0 percent bias for lead at Clark Fork at Deer Lodge. For all SLR models, model biases were <5 percent for 12 out of 14 models.
Relations between Metallic-Contaminant Concentrations and Turbidity and Acoustics Surrogate Data
This section of the report presents results for one of the primary objectives of the study—to develop relations among turbidity and acoustics surrogate data with MCCs and the metalloid trace element arsenic. The relations between MCCs and turbidity and acoustics surrogate data are shown in figures 13–16 and presented in table 9. Given the link between MCCs and suspended sediment (figs. 11, 12; table 8) and strong relations between SSCs with fixed-point turbidity and acoustics backscatter (figs. 9, 10; table 7), developing MCC-turbidity and MCC-acoustics regression models is the next step in predicting time-series MCCs and MCLs. As described in the “Adequacy of the Model-Calibration Datasets” section, turbidity was the primary explanatory variable for time-series models. Although drift in LISST–ABS sensors was corrected for use in development of regression models, drift in water-quality sensors that exceeds plus or minus 5 percent of calibration standards is prohibitive for use in time-series models to compute continuous MCCs and SSCs (Wilde and Radtke, 2005; Wagner and others, 2006). Once SLR models are developed, continuous MCCs can be used for a variety of purposes, including a means to describe variability in MCC conditions, evaluate MCC values relative to aquatic-life standards and GRKO management goals, compare MCC and MCL characteristics between sampling sites, and to detect changes and trends in water quality attributed to remediation of the Clark Fork. Although streamflow was determined to be a significant explanatory variable for MCCs and SSCs, it explained less variability in the SLR models when compared to either turbidity or acoustics and did not contribute significantly to justifying its use in a more complex MLR model. Therefore, turbidity in an SLR model was used for reliable computations of MCCs and SSCs.
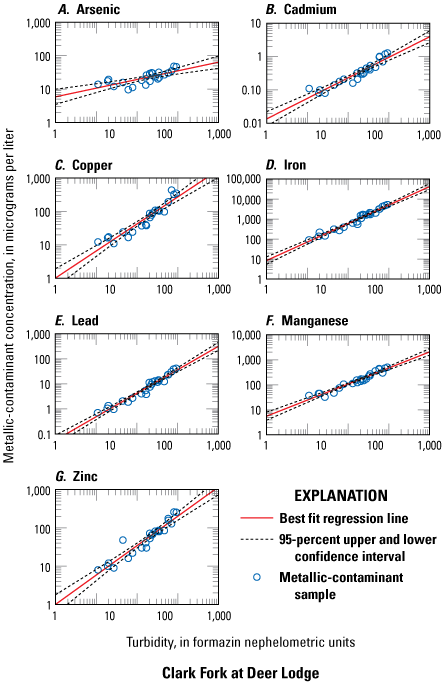
Relations among metallic-contaminant concentrations and turbidity at Clark Fork at Deer Lodge, Montana (U.S. Geological Survey streamgage 12324200; U.S. Geological Survey 2021a), in the upper Clark Fork Basin, Montana, for water years 2019–20. A, Arsenic. B, Cadmium. C, Copper. D, Iron. E, Lead. F, Manganese. G, Zinc.
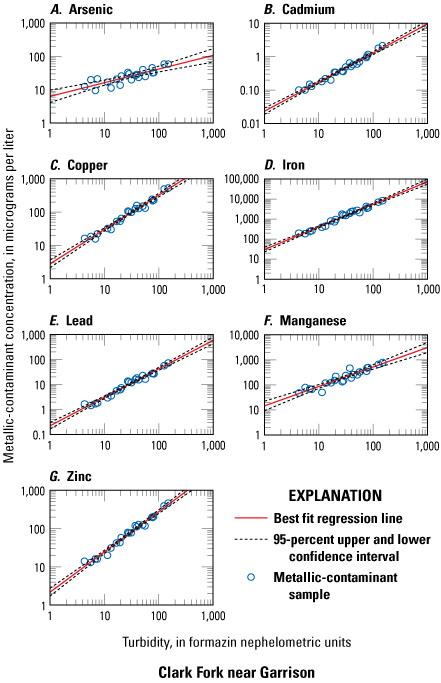
Relations among metallic-contaminant concentrations and turbidity at Clark Fork above Little Blackfoot River near Garrison, Montana (U.S. Geological Survey streamgage 12324400; U.S. Geological Survey, 2021b), in the upper Clark Fork Basin, Montana, for water years 2019–20. A, Arsenic. B, Cadmium. C, Copper. D, Iron. E, Lead. F, Manganese. G, Zinc.
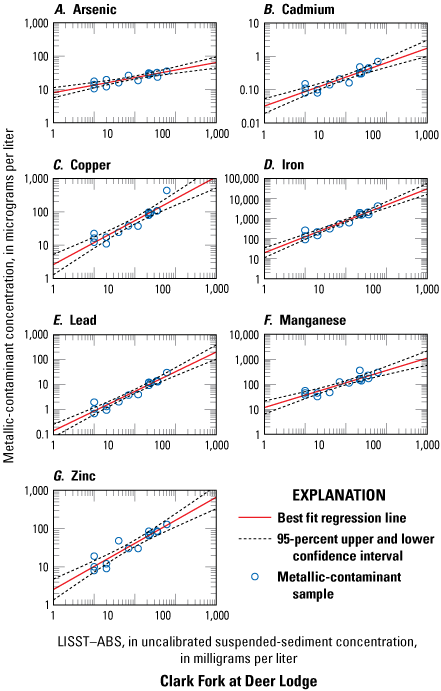
Relations among metallic-contaminant concentrations and LISST–ABS at Clark Fork at Deer Lodge, Montana (U.S. Geological Survey streamgage 12324200; U.S. Geological Survey, 2021a), in the upper Clark Fork Basin, Montana, for water years 2019–20. A, Arsenic. B, Cadmium. C, Copper. D, Iron. E, Lead. F, Manganese. G, Zinc.
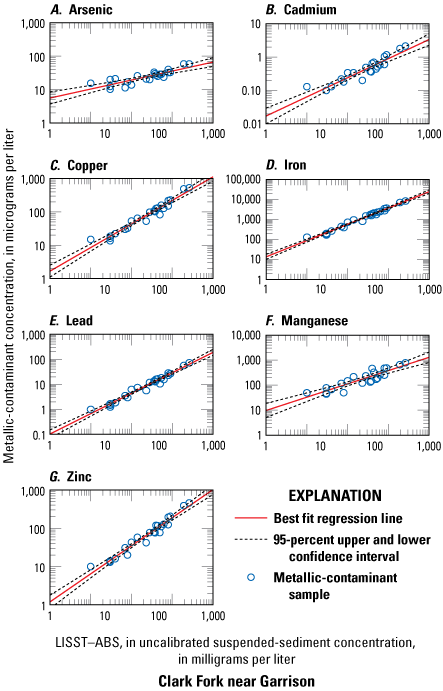
Relations among metallic-contaminant concentrations and LISST–ABS at Clark Fork above Little Blackfoot River near Garrison, Montana (U.S. Geological Survey streamgage 12324400; U.S. Geological Survey, 2021b), in the upper Clark Fork Basin, Montana, for water years 2019–20. A, Arsenic. B, Cadmium. C, Copper. D, Iron. E, Lead. F, Manganese. G, Zinc.
Table 9.
Regression coefficients, confidence intervals, residual standard errors, Nash-Sutcliffe efficiencies (Nash and Sutcliffe, 1970), and model biases using turbidity and LISST–ABS as explanatory variables for metallic-contaminant concentrations at Clark Fork at Deer Lodge, Montana (U.S. Geological Survey streamgage 12324200; U.S. Geological Survey, 2021a), and Clark Fork above Little Blackfoot River near Garrison, Mont. (U.S. Geological Survey streamgage 12324400; U.S. Geological Survey, 2021b), in the upper Clark Fork Basin, Montana, water years 2019–20.[b0, regression coefficient for the intercept; %, percent; b1, regression coefficient for the slope; p-value, calculated probability; RSE, residual standard error; R2, coefficient of determination; BCF, bias correction factor; NSE, Nash-Sutcliffe efficiency (Nash and Sutcliffe, 1970); n, total number of samples; MCC, metallic-contaminant concentration; exp, Euler's number (Aghaeiboorkheili and Kawagle, 2022), approximately 2.71828; LISST–ABS, uncalibrated suspended-sediment concentration, in milligrams per liter; <, less than]
Using turbidity as the sole explanatory variable for MCCs, R2 values for SLR models ranged from 0.89 for cadmium to 0.96 for iron and lead at Clark Fork at Deer Lodge and ranged from 0.89 for manganese to 0.98 for cadmium, iron, and zinc at Clark Fork near Garrison (table 9). For SLR models, R2 values exceeded 0.90 in 9 of 12 models. Arsenic had an R2 value of 0.55 at Clark Fork at Deer Lodge and 0.69 at Clark Fork near Garrison.
Goodness-of-fit computations for NSE values and model biases using turbidity as the sole explanatory variable for MCCs followed similar patterns as R2 values, indicating that turbidity was a strong predictor of MCCs at both sites (table 9). NSEs ranged from 0.84 for cadmium at Clark Fork at Deer Lodge to 0.98 for zinc at Clark Fork near Garrison. For SLR models, NSE values for 9 out of 12 models exceeded 0.90, whereas NSE values for arsenic averaged 0.70 for both sites. Little or no bias in SLR models was indicated because model biases ranged from −8 percent for copper to a minimum of 0.2 percent for zinc at Clark Fork at Deer Lodge. Model bias for arsenic was 0.2 percent for Clark Fork at Deer Lodge and 0.1 percent for Clark Fork near Garrison. For all SLR models, model biases were <5 percent for 13 out of 14 models.
Using LISST–ABS acoustics data as the explanatory variable for MCCs, R2 values for SLR models at Clark Fork at Deer Lodge ranged from 0.83 for manganese to 0.93 for iron and ranged from 0.80 for manganese to 0.98 for iron at Clark Fork near Garrison. For SLR models, R2 values exceeded 0.90 in 6 of 12 models (table 9). Arsenic had an R2 value of 0.74 at Clark Fork at Deer Lodge and 0.71 at Clark Fork near Garrison.
Goodness-of-fit computations for NSE values and model biases using LISST–ABS acoustics data as the sole explanatory variable for MCCs followed similar patterns as R2 values (table 9), indicating that LISST–ABS acoustics data was a good predictor of MCCs at both sites. NSEs ranged from 0.59 for copper at Clark Fork at Deer Lodge to 0.99 for iron at Clark Fork near Garrison. For SLR models, NSE values exceeded 0.90 in 7 out of 12 models, whereas NSE values for arsenic averaged 0.76 for both sites. Model biases indicated little or no bias in SLR models for MCCs and arsenic, ranging from −7.2 percent for copper at Clark Fork at Deer Lodge to a minimum of −0.1 percent bias for lead at Clark Fork near Garrison. Model biases for arsenic was −4.2 percent for Clark Fork at Deer Lodge and −1.4 percent for Clark Fork near Garrison. For all SLR models, model biases were <5 percent for 13 out of 14 models.
The regression models selected to compute MCC and SSC time-series at the Clark Fork at Deer Lodge and Clark Fork near Garrison, are the MCC-turbidity and SSC-turbidity simple linear regression models. Comparisons among MLR models indicated that the addition of streamflow as an explanatory variable in the model, although significant, only marginally improved prediction of MCCs and SSCs but was not sufficient as to justify its inclusion.
Computation of Time-Series Records for Metallic-Contaminant and Suspended-Sediment Concentrations
Continuous real-time streams of MCCs and SSCs at the study sites, measured at high-resolution temporal scale, may provide insight in MCC response during periods of high and low streamflow that can then be linked to known timing and types of specific remediation actions such as excavation of contaminated soils, streambank restoration activities, and re-vegetation of riparian and denuded regions on GRKO property. Other factors affecting MCC discharge into the Clark Fork, such as snowmelt runoff, irrigation operations in the Deer Lodge Valley along with episodic storm event occurrence, intensity, and duration, may be linked to MCCs and SSCs response and potentially discerned from remediation activities. The application of surrogate data from fixed-point turbidity sensors to compute MCCs and SSCs may inform State and Federal agencies and GRKO resource managers regarding magnitude and timing of MCCs in relation to streamflow peaks; MCC values relative to aquatic-life standards; and information on MCC transport, source, and fate previously unavailable.
Natural logarithmic (ln)-transformed SLR models were retransformed, expressed as a power function, and corrected for bias to compute time-series instantaneous and daily MCCs and SSCs (eq. 4; table 9). For these data, there were no computed values extrapolated beyond the upper range of turbidity as the explanatory variable. Although there were periods of missing turbidity measurements, there were a large number (60,751) of instantaneous values computed for MCCs and SSCs as a consequence of the 15-minute data collection interval. To simplify viewing of the graphical time-series, interpreting the data, and computing loads, daily mean values in addition to instantaneous values were computed and used for computing MCCs and SSCs. Daily mean MCCs and SSCs for the Clark Fork at Deer Lodge and Clark Fork near Garrison are presented in figures 17 and 18 for arsenic, copper, lead, and SSC for water years 2019–20 along with acute and chronic aquatic-life standards. Copper as a representative contaminant, along with associated streamflow at both sites to show time-series copper response during periods of elevated streamflow for water years 2019–20, is shown in figures 19 and 20.
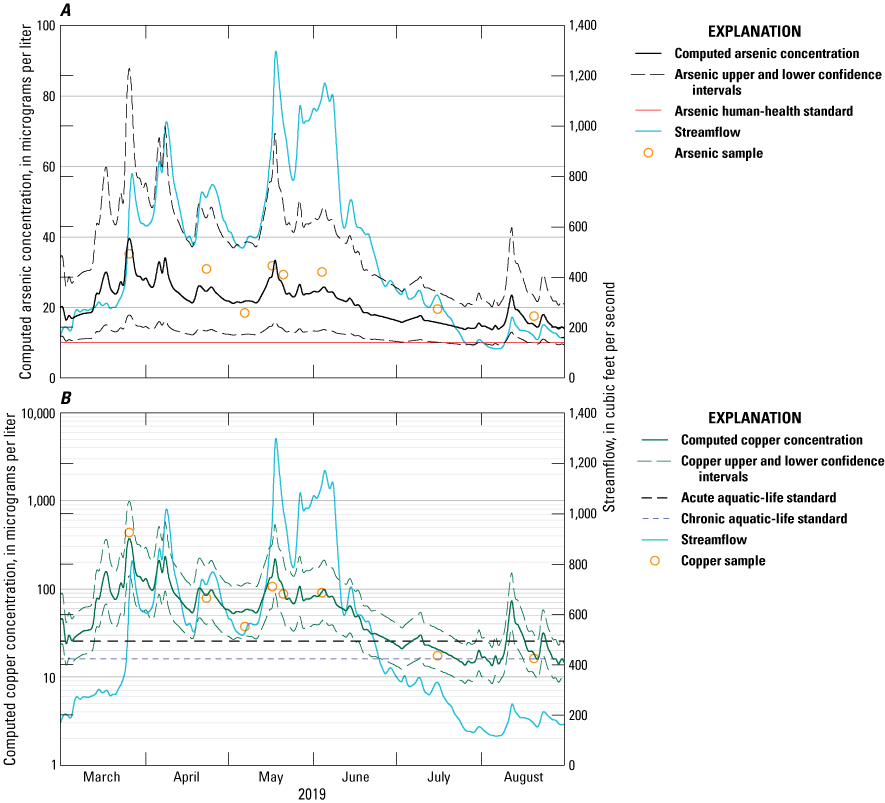
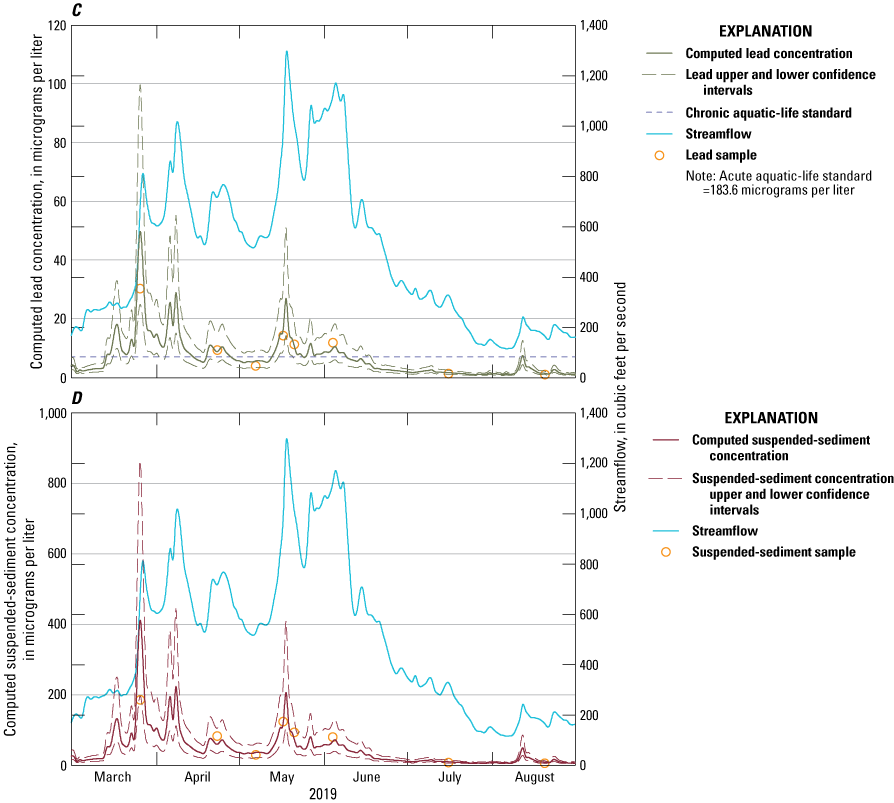
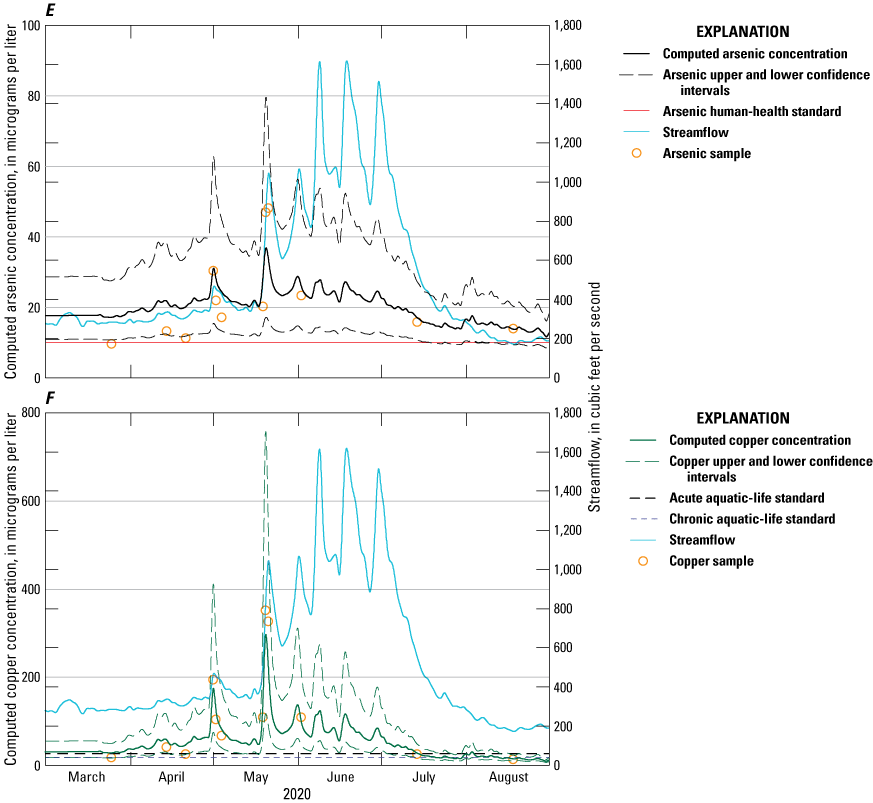
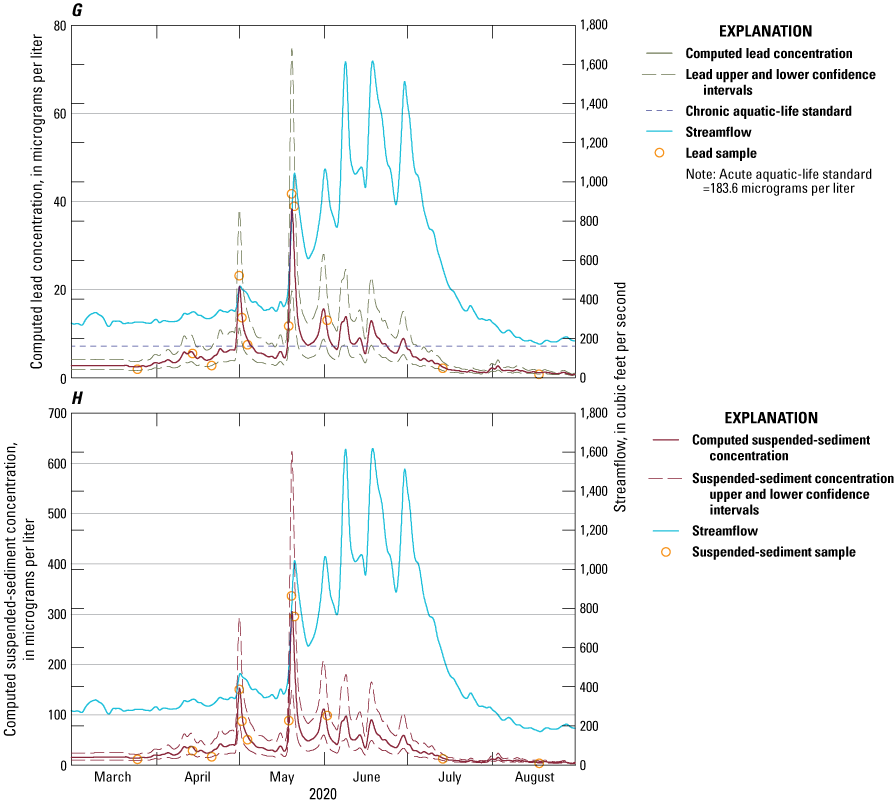
Streamflow and computed daily mean arsenic, copper, lead, and suspended-sediment concentrations from March 1 through August 31 for water years 2019–20 at Clark Fork at Deer Lodge, Montana (U.S. Geological Survey streamgage 12324200; U.S. Geological Survey, 2021a), in the upper Clark Fork Basin. A, Arsenic, water year (WY) 2019. B, Copper, WY 2019. C, Lead, WY 2019. D, Suspended-sediment concentration, WY 2019. E, Arsenic, WY 2020. F, Copper, WY 2020. G, Lead, WY 2020. H, Suspended-sediment concentration, WY 2020.
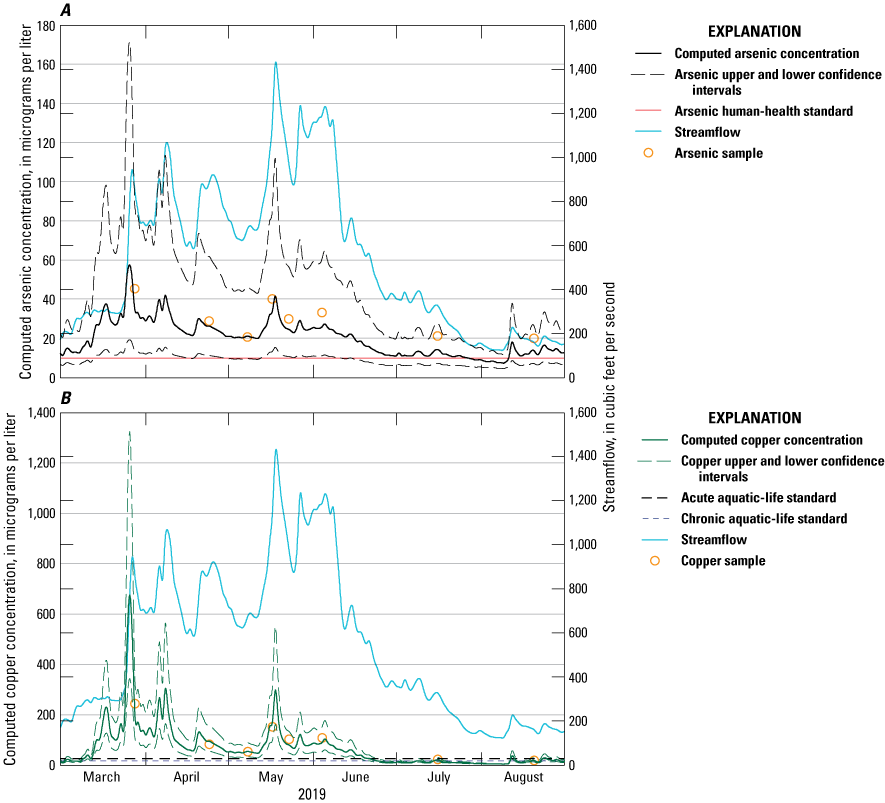
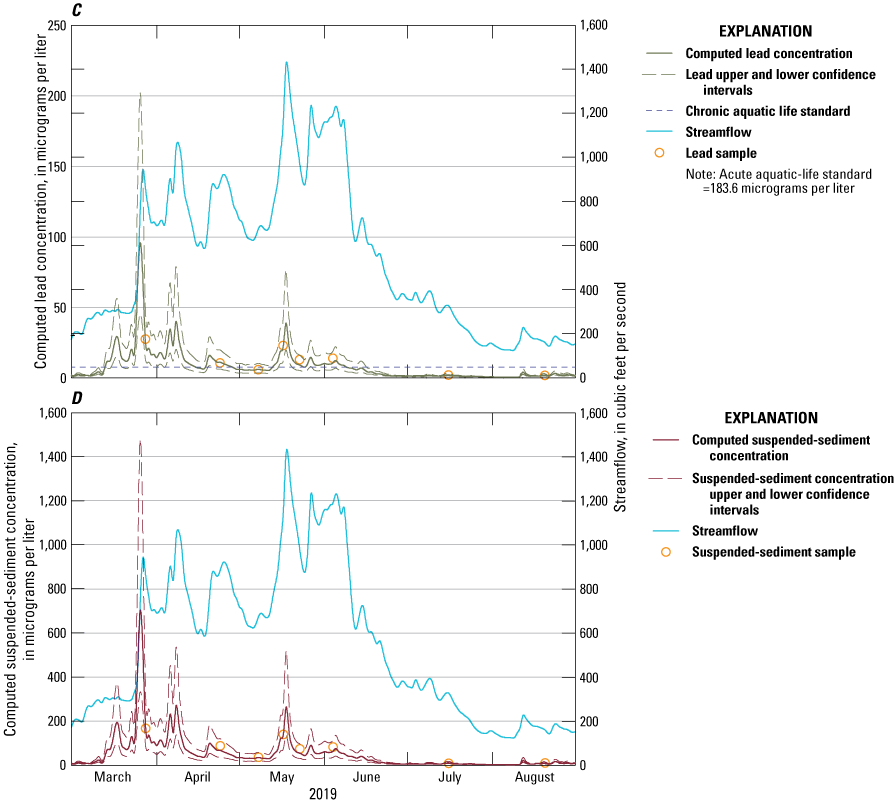
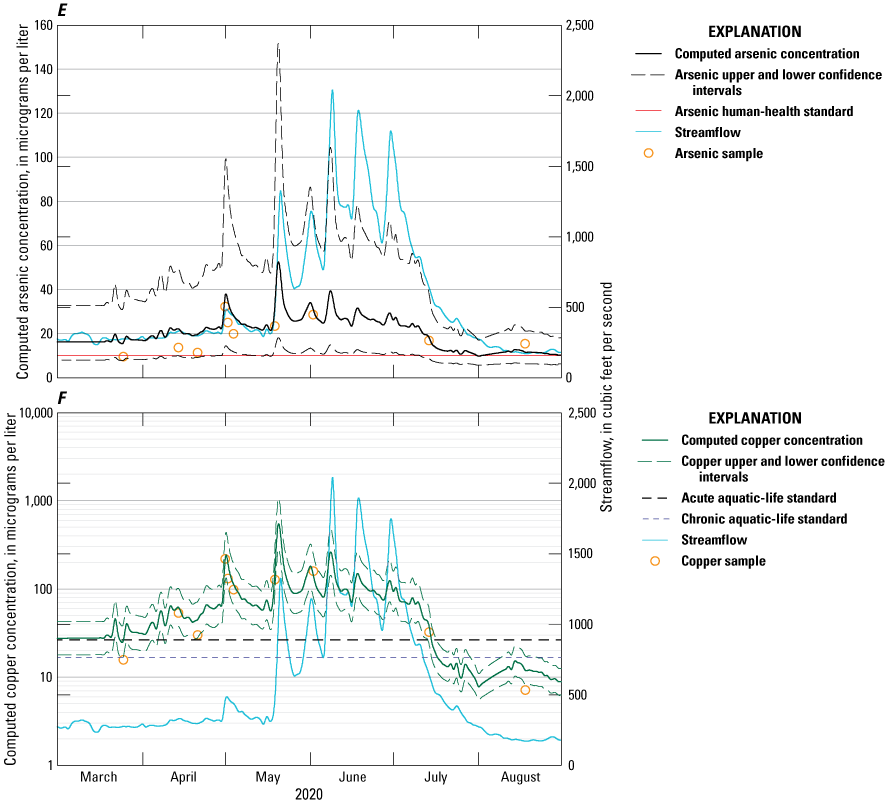
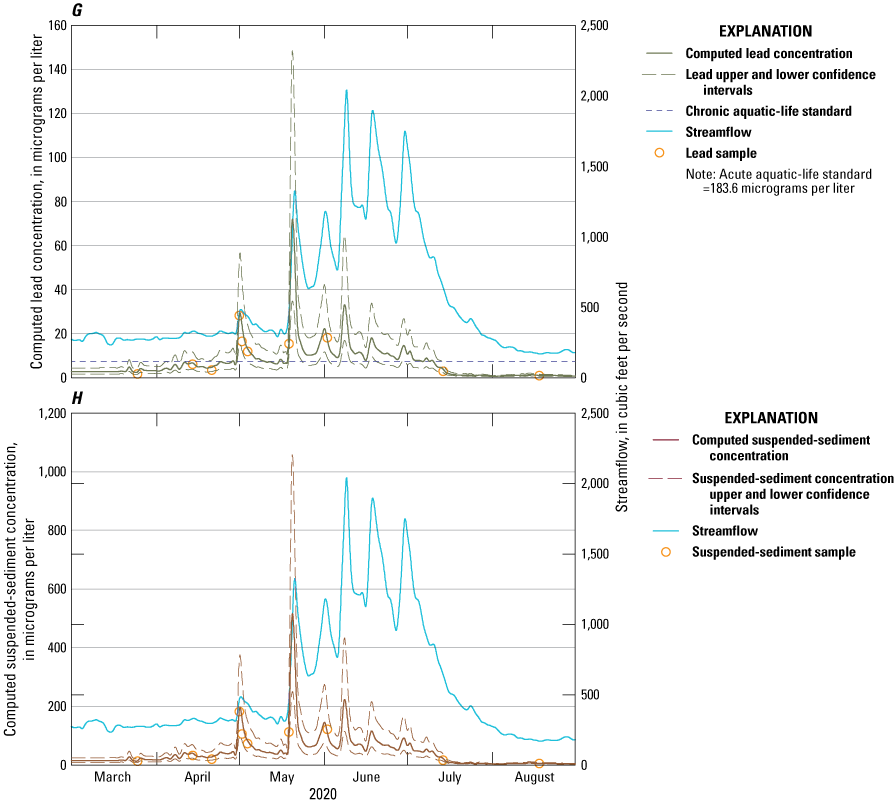
Streamflow and computed daily mean arsenic, copper, lead, and suspended-sediment concentrations from March 1 through August 31 for water years 2019–20 at Clark Fork above Little Blackfoot River near Garrison, Montana (U.S. Geological Survey streamgage 12324400; U.S. Geological Survey, 2021b), in the upper Clark Fork Basin. A, Arsenic, water year (WY) 2019. B, Copper, WY 2019. C, Lead, WY 2019. D, Suspended-sediment concentration, WY 2019. E, Arsenic, WY 2020. F, Copper, WY 2020. G, Lead, WY 2020. H, Suspended-sediment concentration, WY 2020.
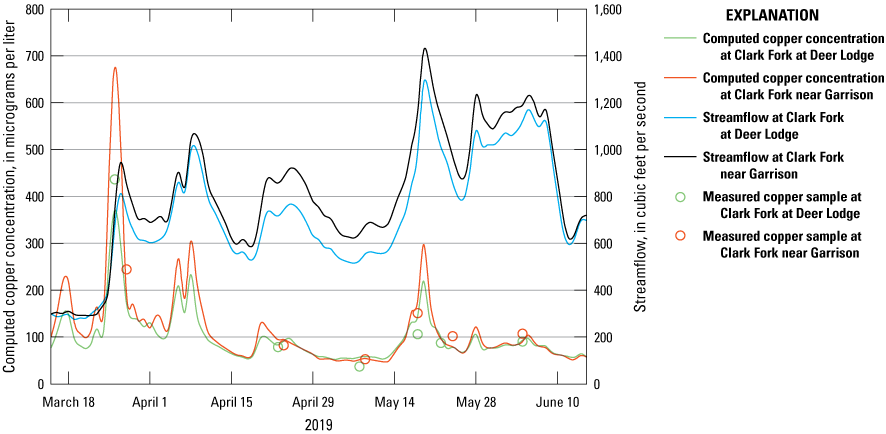
Streamflow and computed daily mean copper concentrations from March 15 through June 15 for water year 2019 at Clark Fork at Deer Lodge, Montana (U.S. Geological Survey streamgage 12324200; U.S. Geological Survey, 2021a), and Clark Fork above Little Blackfoot River near Garrison, Mont. (U.S. Geological Survey streamgage 12324400; U.S. Geological Survey, 2021b), in the upper Clark Fork Basin.
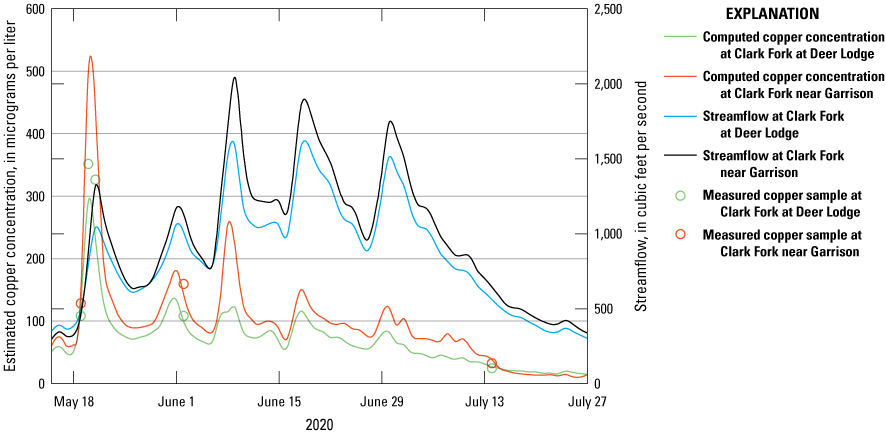
Streamflow and computed daily mean copper concentrations from May 15 through July 27 for water year 2020 at Clark Fork at Deer Lodge, Montana (U.S. Geological Survey streamgage 12324200; U.S. Geological Survey, 2021a), and Clark Fork above Little Blackfoot River near Garrison, Mont. (U.S. Geological Survey streamgage 12324400; U.S. Geological Survey, 2021b), in the upper Clark Fork Basin.
There were four notable streamflow events in 2019 and five notable streamflow events in 2020, including initial snowmelt freshet, that provide valuable insight on MCC characteristics. Time-series instantaneous and daily mean copper concentrations, along with corresponding streamflow peaks for selected streamflow events, are presented in table 10.
Table 10.
Dates, times, instantaneous, and corresponding daily mean values of selected peak copper concentrations and corresponding peak streamflows at Clark Fork at Deer Lodge, Montana (U.S. Geological Survey streamgage 12324200; U.S. Geological Survey, 2021a) and Clark Fork above Little Blackfoot River near Garrison, Mont. (U.S. Geological Survey streamgage 12324400; U.S. Geological Survey, 2021b), in the upper Clark Fork Basin, Montana, water years 2019–20.[M, month; DD, day; YYYY, year; µg/L, microgram per liter; %, percent; ft3/s, cubic feet per second]
| Abbreviated sampling site name (table 1) |
Copper peak concentrations | Streamflow peaks | ||||||||
|---|---|---|---|---|---|---|---|---|---|---|
| Date (M/DD/YYYY) |
Time | Calculated instantaneous (µg/L) |
Lower 95% confidence interval (µg/L) |
Upper 95% confidence interval (µg/L) |
Daily mean (µg/L) |
Date (M/DD/YYYY) |
Time | Instantaneous (ft3/s) |
Daily mean (ft3/s) |
|
| Clark Fork at Deer Lodge | 3/25/2019 | 18:45 | 607 | 201 | 1,632 | 267 | 3/27/2019 | 0:30 | 930 | 812 |
| Clark Fork near Garrison | 3/25/2019 | 18:45 | 1,251 | 599 | 2,539 | 448 | 3/27/2019 | 3:30 | 1,060 | 944 |
| Clark Fork at Deer Lodge | 4/6/2019 | 8:15 | 278 | 103 | 664 | 208 | 4/6/2019 | 6:15 | 956 | 861 |
| Clark Fork near Garrison | 4/6/2019 | 15:45 | 339 | 179 | 624 | 267 | 4/6/2019 | 4:30 | 958 | 902 |
| Clark Fork at Deer Lodge | 4/8/2019 | 14:45 | 362 | 129 | 900 | 233 | 4/8/2019 | 14:45 | 1,120 | 988 |
| Clark Fork near Garrison | 4/8/2019 | 21:00 | 530 | 271 | 1,009 | 303 | 4/8/2019 | 19:30 | 1,130 | 1,030 |
| Clark Fork at Deer Lodge | 5/18/2019 | 5:45 | 254 | 96 | 599 | 219 | 5/18/2019 | 16:45 | 1,320 | 1,280 |
| Clark Fork near Garrison | 5/18/2019 | 11:15 | 346 | 182 | 637 | 298 | 5/18/2019 | 16:45 | 1,460 | 1,420 |
| Clark Fork at Deer Lodge | 5/20/2020 | 22:00 | 410 | 144 | 1,039 | 292 | 5/21/2020 | 4:30 | 1,070 | 1,040 |
| Clark Fork near Garrison | 5/21/2020 | 1:45 | 737 | 367 | 1,438 | 436 | 5/21/2020 | 7:45 | 1,420 | 1,320 |
| Clark Fork at Deer Lodge | 6/1/2020 | 5:30 | 148 | 61 | 322 | 134 | 6/1/2020 | 12:30 | 1,110 | 1,060 |
| Clark Fork near Garrison | 6/1/2020 | 7:30 | 206 | 113 | 366 | 181 | 6/1/2020 | 18:30 | 1,290 | 1,170 |
| Clark Fork at Deer Lodge | 6/8/2020 | 16:30 | 226 | 87 | 524 | 115 | 6/9/2020 | 1:00 | 1,760 | 1,510 |
| Clark Fork near Garrison | 6/9/2020 | 2:00 | 321 | 170 | 588 | 219 | 6/9/2020 | 9:15 | 2,100 | 2,040 |
| Clark Fork at Deer Lodge | 6/18/2020 | 0:15 | 132 | 55 | 281 | 116 | 6/18/2020 | 23:30 | 1,700 | 1,580 |
| Clark Fork near Garrison | 6/17/2020 | 21:15 | 196 | 96 | 301 | 111 | 6/19/2020 | 1:15 | 1,930 | 1,850 |
| Clark Fork at Deer Lodge | 6/30/2020 | 1:15 | 109 | 47 | 226 | 82 | 6/30/2020 | 13:45 | 1,560 | 1,510 |
| Clark Fork near Garrison | 6/30/2020 | 3:00 | 166 | 75 | 226 | 122 | 6/30/2020 | 14:00 | 1,830 | 1,740 |
Timing of peak copper concentrations were compared to streamflow peaks and ascending and descending limbs of the hydrograph during annual snowmelt and episodic runoff events. The dominant control on magnitude and timing of MCCs was availability of suspended sediment and delivery of sediment to the Clark Fork main-stem channel. Climate and weather characteristics, such as snowpack; rain-on-snow conditions; and variation in ambient temperature affecting the timing, intensity, and duration of snowmelt runoff, exert primary control on delivery of sediment (Guy, 1970; Knighton, 1998) and associated MCCs to the Clark Fork. Other weather characteristics, such as storm approach to the watershed, localization, intensity, and duration, affect the timing and peak of MCCs and SSCs in relation to streamflow peaks (Knighton, 1998). MCC and SSC peaks that occurred prior to peaks in streamflow likely were from sediment sources close to the monitoring site (for example, erodible streambanks or denuded/sparsely vegetated floodplains), or from aggraded sediment stored in the channel bed during low streamflow conditions (Guy 1970; Knighton, 1998). MCC and SSC peaks that occurred after streamflow peaks might be linked to myriad combinations of weather conditions or sediment availability in the watershed where upstream sources might supply the bulk of the load after the streamflow has peaked (Knighton, 1998).
During the initial snowmelt freshet in 2019, copper concentration peaked at its highest value of 607 µg/L on March 25, approximately 28 hours prior to the streamflow peak of 930 ft3/s on March 27 at Clark Fork at Deer Lodge (table 10). During this same period at Clark Fork near Garrison, copper concentration peaked at 1,251 µg/L approximately 32 hours prior to the streamflow peak of 1,060 ft3/s. Copper concentrations peaked at streamflows markedly lower and prior to peak streamflow for the initial snowmelt freshet of 2019 (figs. 17B, 18B, 19; table 10). Other notable streamflow peaks in 2019 occurred on April 6, April 8, and May 18. For the runoff event on April 6, copper (278 µg/L) peaked 2 hours after the streamflow peak (956 ft3/s) at Clark Fork at Deer Lodge, whereas copper (339 µg/L) peaked 11 hours after the streamflow peak (958 ft3/s) at Clark Fork near Garrison. The highest streamflow for 2019 at Clark Fork at Deer Lodge and Clark Fork near Garrison occurred on May 18 with peak streamflows of 1,320 and 1,460 ft3/s with corresponding copper concentrations of 254 and 346 µg/L, respectively. For May 18, copper concentrations peaked 11 and 5 hours before the streamflow peaks, respectively.
For 2020, the initial snowmelt freshet began in May, substantially later than snowmelt runoff in water year 2019 (figs. 3, 19, 20; table 10). For the initial snowmelt freshet in water year 2020, copper concentration peaked at 410 µg/L on May 20, approximately 6.5 hours prior to the streamflow peak of 1,070 ft3/s on May 21 at Clark Fork at Deer Lodge (table 10). During this same period, copper concentration peaked at 737 µg/L, 6 hours prior to the streamflow peak of 1,420 ft3/s at Clark Fork near Garrison. Similar to 2019, copper concentrations peaked during streamflows notably lower and prior to maximum streamflow for the initial snowmelt freshet. For 2020, peak streamflows for the year at Clark Fork at Deer Lodge and Clark Fork near Garrison were on June 8 and 9 with streamflows of 1,760 and 2,100 ft3/s with corresponding copper concentrations of 226 and 321 µg/L, respectively. Other notable streamflow peaks in 2020 were on June 1, 17, and 30. For each of the other runoff events in 2020, copper concentrations peaked prior to the streamflow peak, ranging from 7 to 23 hours before the streamflow peak at Clark Fork at Deer Lodge and ranging from 6 to 28 hours prior to the streamflow peak at Clark Fork near Garrison. Because copper peaked prior to the streamflow peaks except for April 6 and 9, 2019, it was inferred the source of copper was stored in channel bed sediments in close spatial proximity to the monitoring site or from nearby streambanks and floodplains, as opposed to sources higher in the drainage basin.
High-resolution time-series data revealed that copper concentrations at the Clark Fork at Deer Lodge exceeded chronic aquatic-life standards (16.1 µg/L; table 5) 90 percent of the time for streamflows that exceeded 200 ft3/s (fig. 17B, F) and exceeded acute aquatic-life standards (25.5 µg/L; table 5) 85 percent of the time when streamflow exceeded 260 ft3/s (fig. 17B, F). For Clark Fork near Garrison, copper concentrations exceeded chronic aquatic-life standards (16.6 µg/L; table 5) 85 percent of the time when streamflow exceeded 250 ft3/s (fig. 18B, F) and exceeded acute aquatic-life standards (26.4 µg/L; table 5) 50 percent of the time when streamflow exceeded 280 ft3/s (fig. 18B, F). Although copper concentrations at Clark Fork near Garrison exceeded copper concentrations at Clark Fork at Deer Lodge, copper concentrations at Clark Fork near Garrison dropped below concentrations at Clark Fork at Deer Lodge during low streamflow conditions, indicating that copper adsorbed on suspended fine-sized particles at Clark Fork near Garrison were settling out of suspension at a proportionately higher rate than Clark Fork at Deer Lodge during base-flow conditions.
MCCs during initial snowmelt freshet indicated higher response rates to elevated streamflow at Clark Fork near Garrison when compared to Clark Fork at Deer Lodge. In 2019, peak copper concentration during snowmelt freshet at Clark Fork near Garrison was 1.7 times higher than the peak concentration at Clark Fork at Deer Lodge compared to an average of 1.3 times higher during three other notable streamflow events (figs. 19, 20; table 10). In 2020, peak copper concentration during snowmelt freshet at Clark Fork near Garrison was 1.5 times higher than the peak concentration at Clark Fork at Deer Lodge compared to an average of 1.4 times higher during four other notable streamflow events. Differences in MCCs response between the two monitoring sites also might be discerned during low flow conditions, during periods between ice-out conditions, and prior to snowmelt freshet. Using high-resolution time-series data, subtle variation in the response of copper during gradual increases in streamflow is shown in figure 21.
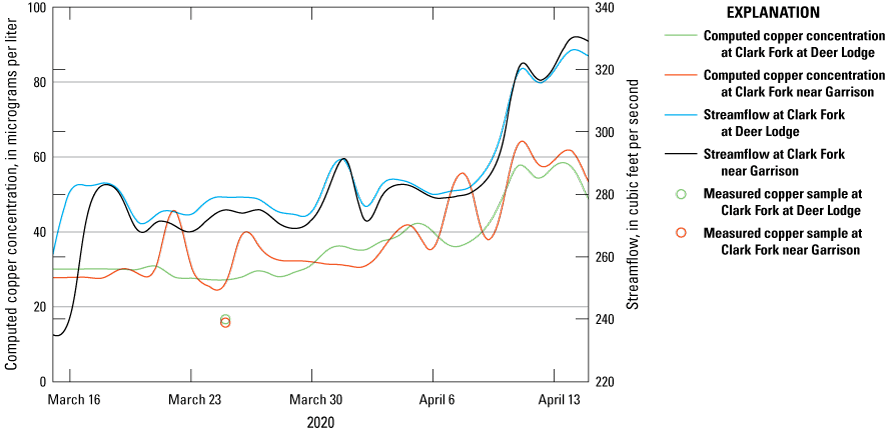
Streamflow and computed daily mean copper concentrations during March 15 through April 15 for water year 2020 at Clark Fork at Deer Lodge, Montana (U.S. Geological Survey streamgage 12324200; U.S. Geological Survey, 2021a) and Clark Fork above Little Blackfoot River near Garrison, Mont. (U.S. Geological Survey streamgage 12324400; U.S. Geological Survey, 2021b), in the upper Clark Fork Basin.
During GRKO’s superfund remediation activities from fall 2018 through fall 2020, the MDEQ required the construction contractor to monitor turbidity in the Clark Fork main-stem channel above and below GRKO property during excavation and replacement of contaminated soils and re-vegetation of the affected work areas. MDEQ established a requirement that turbidity not exceed 10 nephelometric turbidity units between concurrent readings at the above and below monitoring locations to minimize adverse effects to the Clark Fork during remediation of the streambanks and floodplains (Jeff Johnson, NPS, Grant-Kohrs Ranch National Historic Site, December 17, 2021, oral commun.). Jeff Johnson, the GRKO superfund remediation manager, indicated the turbidity objective was satisfied during the construction period. These results were corroborated through inspection of 15-minute and daily mean time-series data (Ellison, 2023) as no visible spikes or increasing trends in computed MCCs downstream at Clark Fork near Garrison were discerned independent from MCCs response linked to variations in streamflow during the construction period.
Metallic-Contaminant and Suspended-Sediment Loads and Yields
The R–LOADEST statistical package (Cohn and others, 1989; Runkel and others, 2004; R Development Core Team, 2011; Runkel and De Cicco, 2017) was used to compute annual and daily MCLs and suspended-sediment loads (SSLs) along with 95-percent prediction intervals based on measured data from collected samples. R–LOADEST applies linear regression with one or more explanatory variables for calculating daily and annual loads. R–LOADEST transforms (lntransformation) explanatory variables during model development and accounts for bias by introducing a bias correction factor (Duan, 1983). R–LOADEST provides users the option of introducing an additional explanatory variable during model development to incorporate daily mean surrogate data collected from fixed-point water-quality sensors such as specific conductivity or turbidimeters (Runkel and others, 2004). R–LOADEST accounts for multicollinearity by applying a method that centers explanatory variables (Cohn and others, 1992; Runkel and others, 2004). For this study, two options available within R–LOADEST were used to calculate daily and annual loads: (1) model 4 (streamflow and two seasonal terms as explanatory variables), and (2) application 5 (streamflow, turbidity and two seasonal terms as explanatory variables). R–LOADEST model 4 is presented to substantiate the benefits of incorporating surrogate data in the load model and is not presumed for use as an alternative model given that it inherently yields lower R-squared values and has a wider range in prediction intervals as compared to time-series and application 5 models. R–LOADEST loads calculated from model 4 and application 5 were compared to time-series computed loads (eq. 10) to evaluate the applicability of time-series computed loads for calculating daily and annual MCLs and SSLs.
Using time-series data, daily and annual MCLs and SSLs were calculated from computed daily mean MCCs and SSCs and streamflow for each site using the following equation (Porterfield, 1972):
whereMCLi
is the ith computed metallic-contaminant (or suspended-sediment) load, in tons per day;
MCCi
is the computed metallic-contaminant concentration, in micrograms per liter, or suspended-sediment concentration, in milligrams per liter, for the ith value;
Qi
is the streamflow for the ith value, in cubic feet per second; and
c
is a constant, 0.0000027, for converting units of micrograms per liter to tons per day, or 0.0027, for converting units of milligrams per liter to tons per day.
For time-series loads, daily loads at each site were summed for each water year to obtain annual MCLs and SSLs. Uncertainty estimates (that is, root mean squared error) for time-series data using summed MCLs and SSLs calculated from retransformed MCCs and SSCs from SLR models with transformed response variables can be computed using methods described in Gilroy and others (1990). For this study, prediction intervals for daily and annual R–LOADEST and time-series loads were calculated to provide a measure of the uncertainty in load calculations. Prediction intervals quantify a range of values from which load calculations are expected to exist and are a function of the standard error of the residuals; thus, prediction intervals are informative to evaluate the accuracy of the model. Prediction intervals differ from confidence intervals in that they provide a measure of the unexplained variability for individual load calculations, whereas confidence intervals provide a measure of the uncertainty associated with the variable estimates (that is, intercept and slope). Information on R–LOADEST regression models is included in table 11 and annual MCLs and SSLs are presented in table 12. Selected daily MCLs and SSLs are shown in figures 22 and 23.
Table 11.
R–LOADEST regression coefficients for models used to compute metallic-contaminant and suspended-sediment loads at Clark Fork at Deer Lodge, Montana (U.S. Geological Survey streamgage 12324200; U.S. Geological Survey, 2021a) and Clark Fork above Little Blackfoot River near Garrison, Mont. (U.S. Geological Survey streamgage 12324400; U.S. Geological Survey, 2021b), in the upper Clark Fork Basin, water years 2019–20.[ln, natural log; Q, streamflow; DECTIME, decimal time; sin, sine; cos, cosine; R2; coefficient of determination; p-value, calculated probability; USGS, U.S. Geological Survey; NA, not applicable; <, less than]
R–LOADEST model 4 for all models (Runkel and others, 2004).
R–LOADEST application 5: User-Defined Model with an Additional Variable (Runkel and others, 2004).
Table 12.
R–LOADEST and time-series turbidity surrogate load comparisons at Clark Fork at Deer Lodge, Montana (U.S. Geological Survey streamgage 12324200; U.S. Geological Survey, 2021a), and Clark Fork above Little Blackfoot River near Garrison, Mont. (U.S. Geological Survey streamgage 12324400; U.S. Geological Survey, 2021b), in the upper Clark Fork Basin, Montana, water years 2019–20.[tons/year; tons per year; lb/mi2, pounds per square mile; tons/mi2, tons per square mile; USGS, U.S. Geological Survey]
R–LOADEST model 4 for all models (Runkel and others, 2004).
R–LOADEST application 5: user-defined model with an additional variable (Runkel and others, 2004).
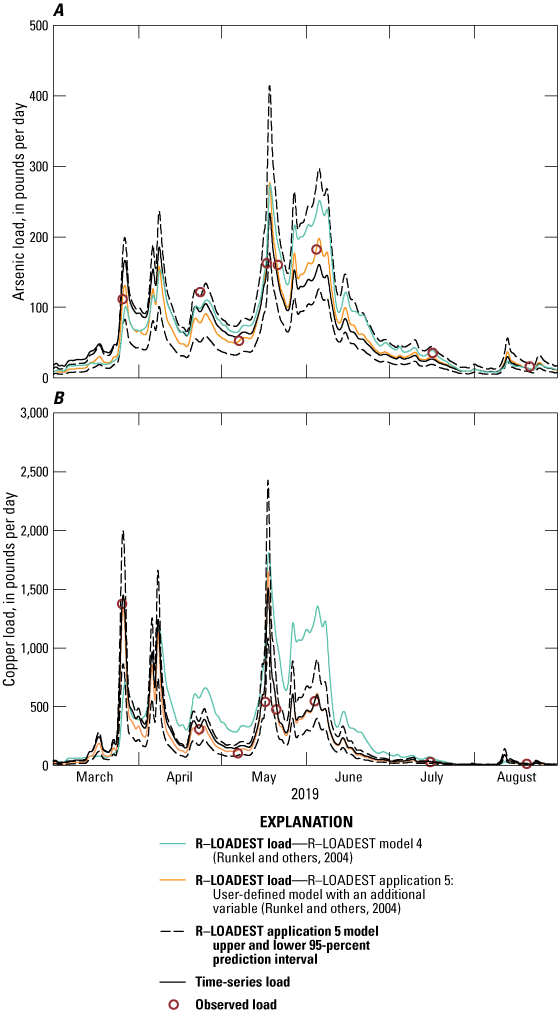
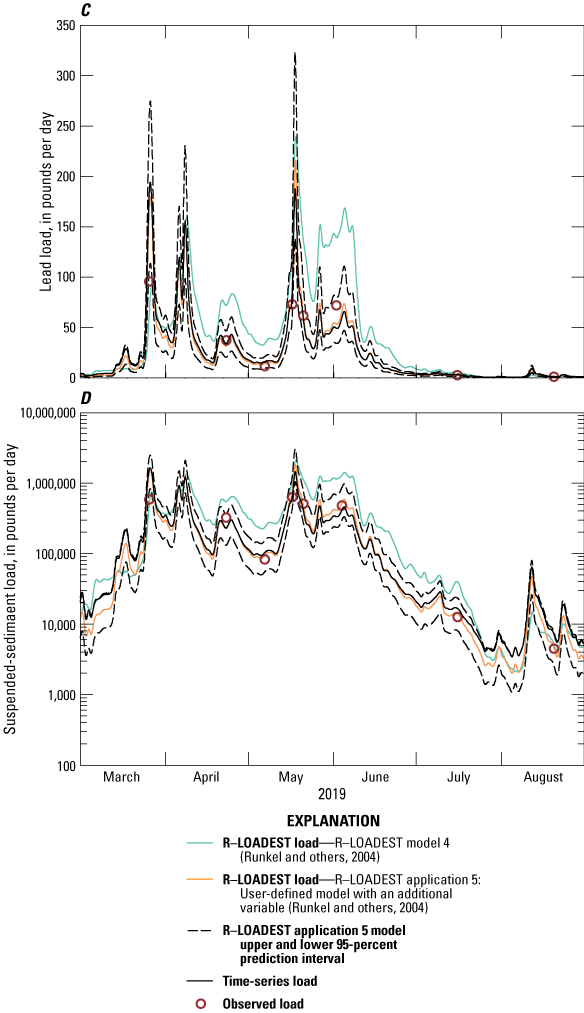
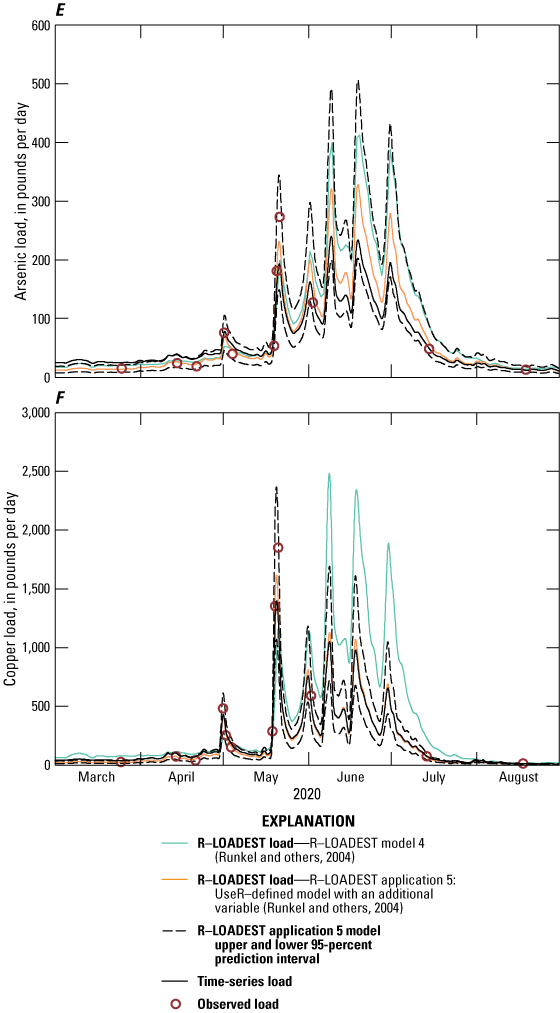
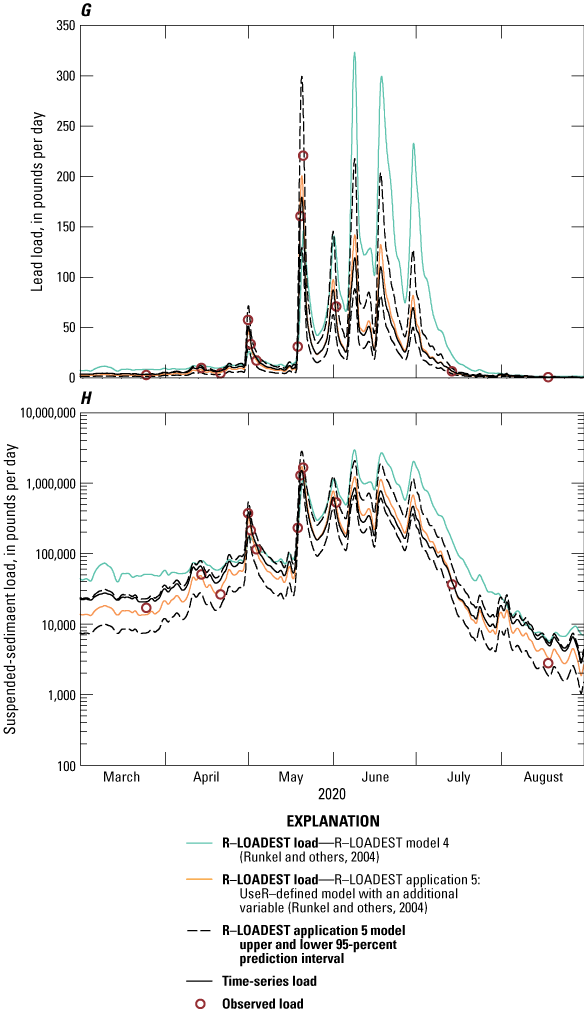
Computed daily arsenic, copper, lead, and suspended-sediment loads, from March 1 through August 31 for water years 2019–20 at Clark Fork at Deer Lodge, Montana (U.S. Geological Survey streamgage 12324200; U.S. Geological Survey, 2021a), in the upper Clark Fork Basin. A, Arsenic, water year (WY) 2019. B, Copper, WY 2019. C, Lead, WY 2019. D, Suspended-sediment concentration, WY 2019. E, Arsenic, WY 2020. F, Copper, WY 2020. G, Lead, WY 2020. H, Suspended-sediment concentration, WY 2020.
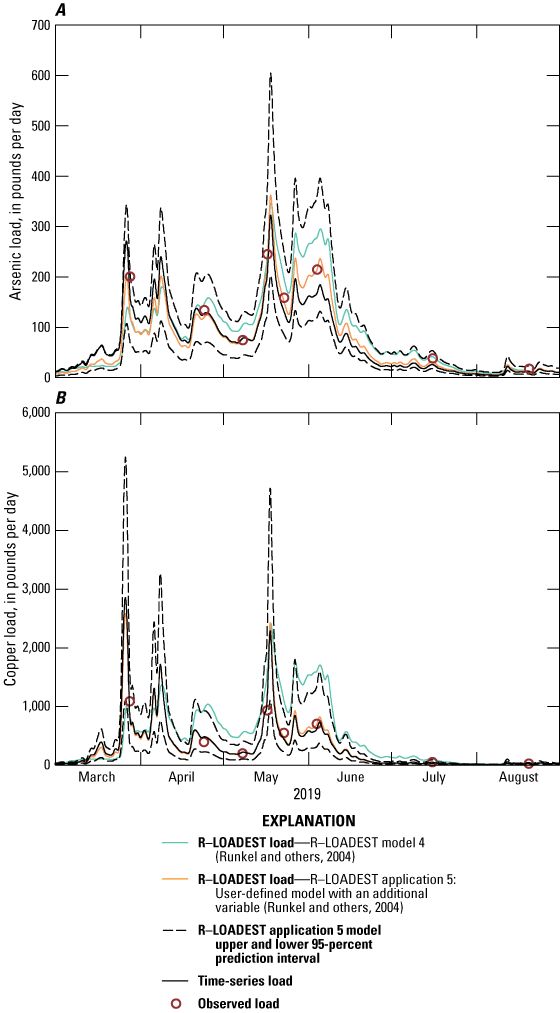
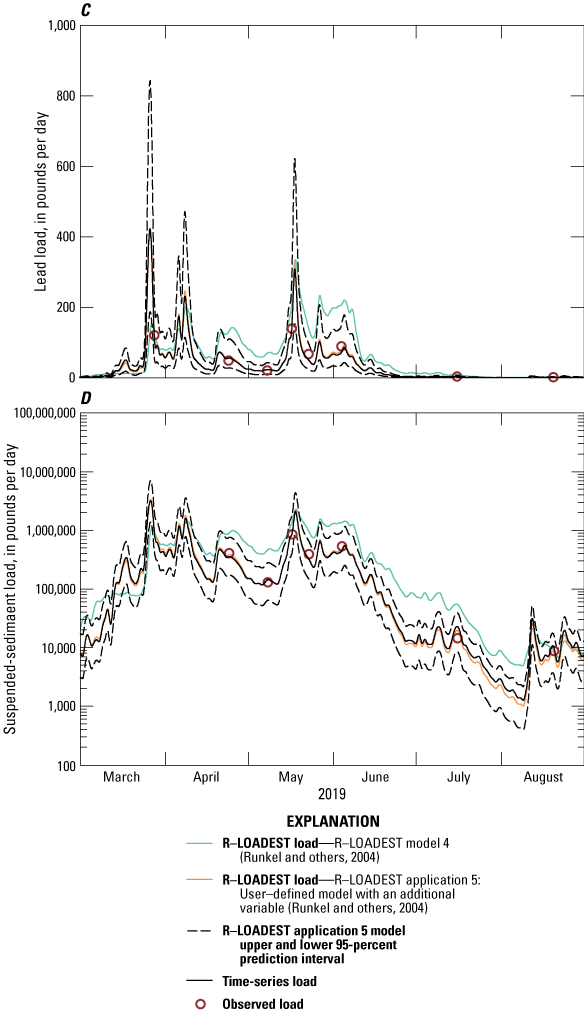
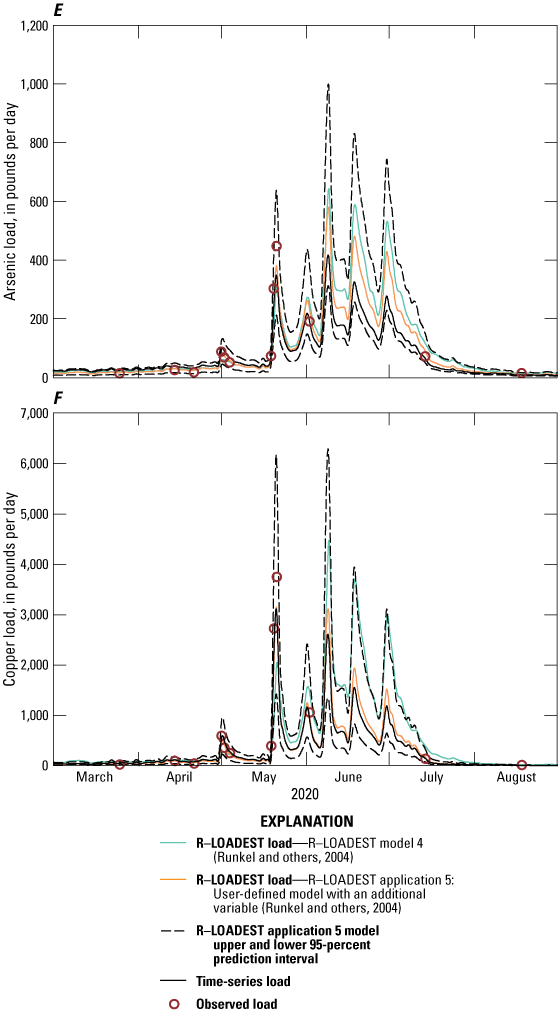
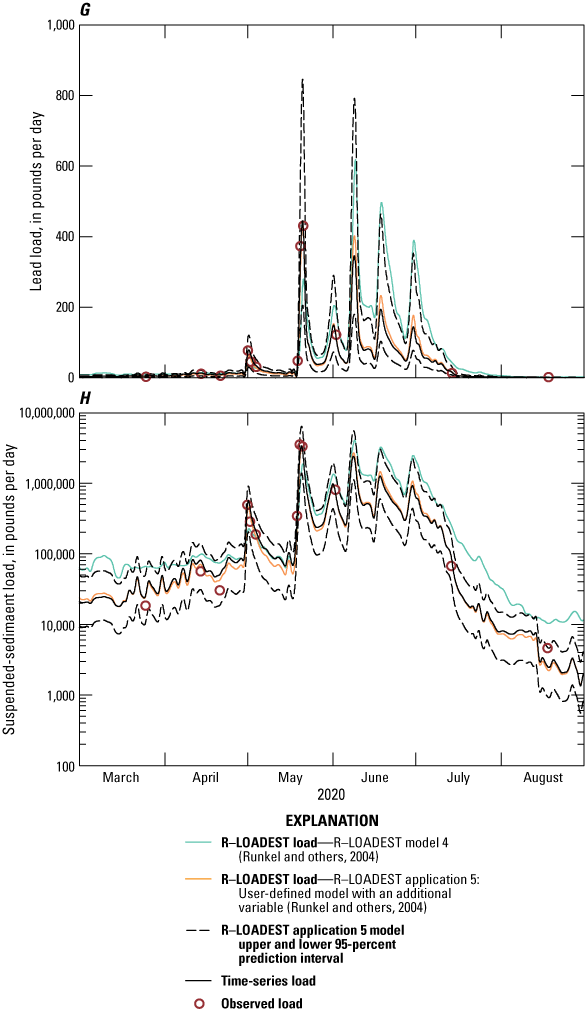
Computed daily mean arsenic, copper, lead, and suspended-sediment loads, from March 1 through August 31 for water years 2019–20 at Clark Fork above Little Blackfoot River near Garrison, Montana (U.S. Geological Survey streamgage 12324400; U.S. Geological Survey, 2021b), in the upper Clark Fork Basin. A, Arsenic, water year (WY) 2019. B, Copper, WY 2019. C, Lead, WY 2019. D, Suspended-sediment concentration, WY 2019. E, Arsenic, WY 2020. F, Copper, WY 2020. G, Lead, WY 2020. H, Suspended-sediment concentration, WY 2020.
In previous water-quality trend studies on the Clark Fork, Sando and others (2014) and Sando and Vecchia (2016) indicated that MCCs were trending downward for all sites in the Clark Fork LTMN. Results of this study indicated that inputs of metallic contaminants, although trending downward, continue to remain elevated above aquatic-life standards. Given this, results from annual load estimates indicated an increase in loading for all metallic contaminants between Clark Fork at Deer Lodge and Clark Fork near Garrison (table 12). Direct comparison of MCLs and SSLs between sites is not meaningful unless they can be normalized to account for variation in streamflow and watershed basin characteristics. Metallic-contaminant yields were determined by dividing total annual load by the drainage area as an alternative to gain insight on relative site yield and are included in table 12.
Annual arsenic loads from times-series models at Clark Fork at Deer Lodge and Clark Fork near Garrison were 7.9 and 8.6 tons per year, respectively, in 2019, and 7.6 and 8.8 tons per year in 2020, respectively, indicating an increase in arsenic load downstream (table 12). In contrast, arsenic yields at the two sites were 15.9 and 15.2 pounds per square mile (lbs/mi2) in 2019 and 15.3 and 15.5 lbs/mi2, respectively, in 2020, indicating nearly identical yields for arsenic at both sites. Copper had annual loads in 2019 of 24 and 29.9 tons per year at Clark Fork at Deer Lodge and Clark Fork near Garrison, respectively in 2019, and loads of 19.7 and 29.6 tons per year in 2020, respectively, with corresponding yields of 48.2 and 52.4 lbs/mi2, respectively, in 2019, and 39.6 and 52.1 lbs/mi2 in 2020, respectively, indicating an increase in copper yield along the downstream gradient between the two sites. For suspended sediment, time-series annual loads in 2019 were 17,830 and 23,218 tons per year, respectively, and 13,568 and 22,622 tons per year in 2020, respectively, at Clark Fork at Deer Lodge and Clark Fork near Garrison, with corresponding yields of 17.9 and 20.4 tons per square mile (tons/mi2), respectively, in 2019, and 13.6 and 19.9 tons/mi2, respectively, in 2020, indicating an increase in yield along the stream gradient between the two sites. Other constituents indicated similar patterns for annual loads and yields.
Comparisons of Load Calculations
For Clark Fork at Deer Lodge, R–LOADEST MCLs and SSLs, application 5 models for water years 2019 and 2020, had smaller ranges in 95-percent prediction intervals for all eight constituents compared to time-series and R–LOADEST model 4 models, although it is notable that 95-percent prediction intervals for time-series models were substantially smaller in range than prediction intervals from R–LOADEST model 4 models (table 12). Annual and daily loads from time-series and R–LOADEST application 5 models fell within the range of the 95-percent prediction intervals of each model and were not considered to be significantly different (table 12; figs. 22, 23). In contrast, R–LOADEST annual loads from model 4 were outside the upper range of 95-percent prediction intervals for copper, iron, lead, and suspended sediment at Clark Fork at Deer Lodge for water years 2019–20 compared to R–LOADEST application 5 loads. The wider range in 95-percent prediction intervals for loads calculated using model 4 were, in part, attributed to its application of streamflow as the sole explanatory variable. R–LOADEST loads using model 4 had notably smaller R2 values when compared to models developed from application 5, which used streamflow and turbidity as explanatory variables (table 11), and time-series models (table 9), which used turbidity as the sole explanatory variable.
For Clark Fork near Garrison, time-series model MCLs and SSLs for water years 2019–20 indicated smaller ranges in 95-percent prediction intervals for 7 out of 8 constituents (magnesium is exception) compared to R–LOADEST application 5 and model 4 loads. Annual and daily loads from time-series and R–LOADEST application 5 models fell within the range of the 95-percent prediction intervals of each model and were not considered to be significantly different (table 12; figs. 22, 23). For Clark Fork at Deer Lodge, R–LOADEST model 4 annual loads were within the 95-percent prediction intervals of time-series loads in 2019; but exceeded the upper 95-percent prediction interval for R–LOADEST application 5 annual loads for copper, iron, lead, and suspended sediment. For Clark Fork near Garrison, R–LOADEST model 4 annual loads fell within the range of 95-percent intervals for time-series and R–LOADEST application 5 loads in 2019 and 2020, with the exception of copper and lead in 2020, which exceeded the upper 95-percent prediction interval for time-series annual loads. Daily loads for copper, lead, and suspended sediment from R–LOADEST model 4 exceeded or were near the upper 95-percent prediction interval for R–LOADEST application 5 loads for water years 2019–20 (figs. 22, 23).
Comparison between NPS and USGS Water-Quality Samples
Accurate measurements of metallic contaminants are important for evaluating trends in water quality, evaluating MCC values relative to aquatic-life standards, and quantifying benefits from Superfund remediation activities at GRKO. NPS personnel collect water-quality samples using grab sampling (Billy Schweiger, National Park Service, oral commun., various dates; Schweiger and others, 2014; Makarowski, 201956) and contract various labs for sample analysis, whereas USGS personnel collect samples using EWDI techniques and use the USGS NWQL for sample analysis (National Water Quality Laboratory, 2023). The period of record used in this analysis was 2010–19 to provide adequate numbers of samples to satisfy the central limit theorem. The intent of this analysis was to inform NPS resource managers regarding possible bias in sample results. It is beyond the scope of this report to attribute differences between NPS and USGS sample results to differences in field data collection methods or differences in laboratory analytical methods. There were no matched-pair comparisons between NPS and USGS samples because prior to the current study (2019–20), the USGS and NPS did not concurrently collect water-quality samples. Water-quality samples collected by the NPS Rocky Mountain Inventory & Monitoring Network (Rocky Mountain Inventory & Monitoring Network, 2023) and the USGS LTMN used in this analysis included arsenic, cadmium, copper, iron, lead, manganese, and zinc.
Comparisons of NPS and USGS samples are not meaningful unless the results are adjusted to account for variations in streamflow (FACs) and effects of climate. The intent of flow adjustment is to identify and remove streamflow-related variability (including hysteresis) in MCCs from NPS and USGS samples independent from effects of climatic variability. R–QWTREND trends analysis software (Vecchia and Nustad, 2020) was used to calculate unfiltered total-recoverable FACs for NPS and USGS samples prior to applying statistical tests to NPS and USGS data. Water-quality samples for this analysis follow patterns described by Sando and others (2014), where unadjusted concentrations tend to be higher during high streamflow conditions than during low-streamflow conditions. R–QWTREND FACs tend to be smaller than their corresponding unadjusted concentrations during higher streamflow and tend to be larger than their associated unadjusted concentrations during lower streamflow. R–QWTREND provides users the option of specifying time periods for trend analysis and recommends the user include a “no-trend or null model” as a reference for identifying the best model among user-defined time periods. For this study, the no-trend model was used to compute FACs for metallic contaminants to provide consistency among results. A remarks code (remxx = c(“NPSVL”)) was included as an argument in the R–QWTREND function “runQWmodel” to discern NPS water-quality samples from USGS samples.
Wilcoxon rank-sum and Welch’s two-sample t-tests were applied to ln-transformed data (Helsel and others, 2020). During the period of record, NPS and USGS data did not have an equal number of samples, with NPS samples ranging from 15 to 32 samples and USGS samples ranging from 75 to 79 samples for each MCC. Under ideal conditions of homogeneous, well-mixed streamflow, there would be no differences between NPS and USGS water-quality samples results attributed to field data collection techniques. Use of identical laboratory analytical methods for USGS and NPS collected samples also would be expected to produce little or no differences in results. This is not the case for typical water-quality field sampling and laboratory analysis, and it is expected that differences in field data collection methods and variations in laboratory analytical methods would likely yield some measure of bias. Gray and others (2000) determined that differences in laboratory analytical methods for SSC aliquot samples, which analyze a subsample of the whole sample, underestimated SSCs when compared to whole-sample laboratory analysis. Groten and Johnson (2018) determined that grab sampling for suspended sediment (total-suspended solids) and laboratory aliquot analysis were biased low compared to EWDI sampling and whole-sample laboratory analysis for SSCs. Their study indicated that differences in field data collection methods accounted for significant differences between EWDI and grab sampling methods ranging from 13 and 41 percent in SSCs, whereas laboratory analysis for whole sample analysis as compared to aliquot sample analysis indicated that aliquot sample analysis underestimated SSCs, ranging from 19 to 32 percent (Groten and Johnson, 2018).
Results of comparison tests between median NPS and USGS unfiltered total-recoverable flow-adjusted MCCs are presented in table 13 and illustrated in figure 24. Means and medians of unadjusted concentrations are included in table 13 for examination of raw differences between unadjusted and adjusted concentrations.
Table 13.
Comparison of unfiltered total-recoverable flow-adjusted metallic-contaminant concentration samples collected by U.S. Geological Survey at Clark Fork at Deer Lodge, Montana (U.S. Geological Survey streamgage 12324200; U.S. Geological Survey, 2021a) and samples collected by National Park Service at Clark Fork at Grant-Kohrs Ranch National Historic Site, Mont. (Rocky Mountain Inventory & Monitoring Network, 2023), in the upper Clark Fork Basin, Montana, for years 2010–19.[µg/L, microgram per liter; p-value, probability value; NPS, National Park Service; USGS, U.S. Geological Survey]
Wilcoxon rank-sum test with continuity correction (Helsel and others, 2020).
Welch's two-sample t-test (Helsel and others, 2020).
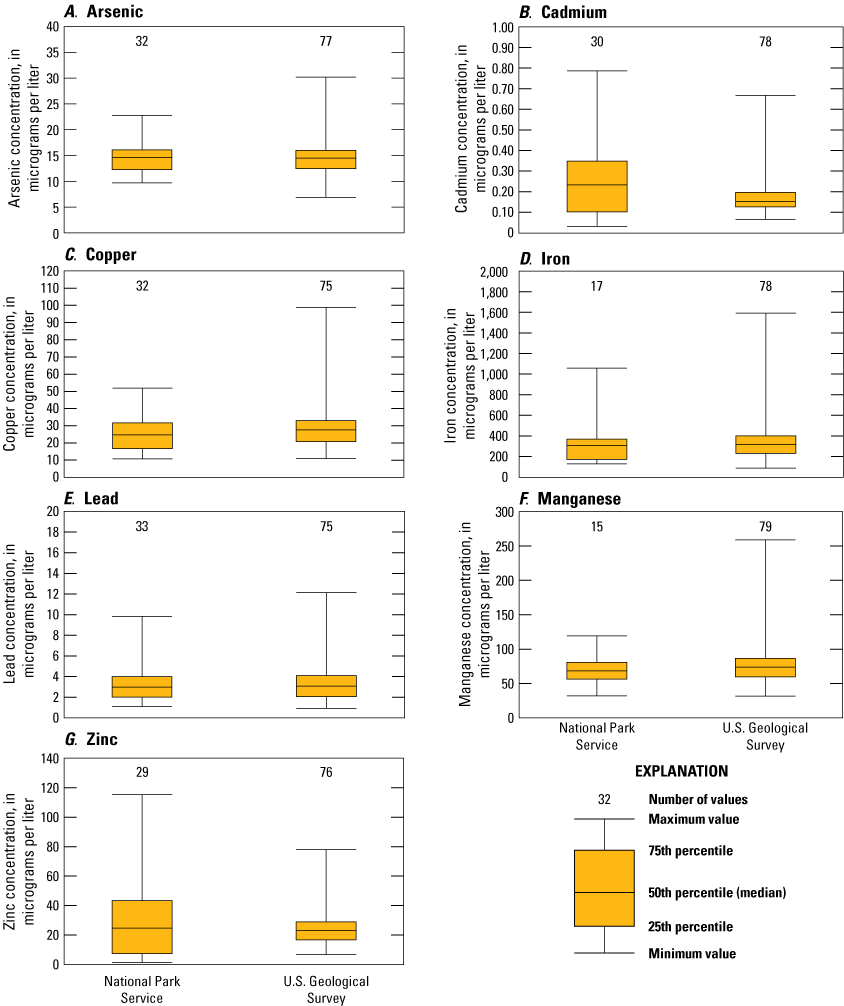
Boxplots of unfiltered total-recoverable flow-adjusted metallic-contaminant concentrations for water-quality samples collected by the U.S. Geological Survey at Clark Fork at Deer Lodge (U.S. Geological Survey streamgage 12324200; U.S. Geological Survey, 2021a) and samples collected by National Park Service at Grant-Kohrs Ranch National Historic Site, Mont. (Rocky Mountain Inventory & Monitoring Network, 2023), in upper Clark Fork Basin, Montana, for years 2010–19. A, Arsenic. B, Cadmium. C, Copper. D, Iron. E, Lead. F, Manganese. G, Zinc.
Comparisons between NPS and USGS water-quality samples, after adjustment for effects of variation in streamflow, indicated small differences in median values for 6 out of 7 MCCs, with MCCs in USGS samples slightly larger than in NPS samples for 5 of the 7 metallic contaminants. Cadmium and zinc are exceptions with NPS sample median values being larger when compared to USGS samples. The median value of zinc samples (n=29) collected by NPS was not significantly larger than USGS samples (n=76), whereas the NPS median value of cadmium samples (n=30) collected by NPS was significantly larger than USGS (n=79) median value (table 13) at the 0.05 significance level. Although arsenic, copper, iron, lead, and manganese indicated total-recoverable flow-adjusted median values from USGS samples were slightly larger than NPS sample median values, Wilcoxon rank-sum and Welch’s two-sample t-test did not indicate that the differences were statistically significant at the 0.05 significance level. For this study, USGS samples were assumed to be the reference value for the purpose of computing percent differences, which is attributed to more rigorous EWDI data collection methods as compared to grab sampling. Given that cadmium is the exception, differences in NPS and USGS field sampling and laboratory analytical methods did not translate to significant differences in sample results or produce negative bias in NPS FACs. For arsenic, copper, iron, lead, and manganese, percent differences between NPS and USGS samples ranged from 2.2 to 10.5 percent, with USGS samples having larger, but not significantly different, median values. For zinc, NPS and USGS flow-adjusted median value was virtually the same (24.7 compared to 23.0 µg/L, respectively), whereas NPS median cadmium was significantly larger than USGS median value using the Wilcoxon rank-sum test, but not significantly different using Welch’s two-sample t-test (p-value=0.047 and 0.2812, respectively; table 13), with NPS cadmium median value 55 percent larger than the USGS median. Lack of significant differences between NPS and USGS water-quality samples may in part be an artifact of the homogeneity and well-mixed conditions represented at the sampling sites. The Clark Fork is a relatively small river with comparatively low concentrations of sediment in suspension dominated by fine-size particles, which is the primary transport mechanism for MCCs. Further investigation regarding the cause of the difference between the NPS unfiltered total-recoverable flow-adjusted cadmium and the USGS median cadmium is beyond the scope of this report.
Summary
Simple linear regression (SLR) models were developed to provide the best model for predicting metallic-contaminant concentrations (MCCs) and suspended-sediment concentrations (SSCs) at two U.S. Geological Survey (USGS) streamgages on the Clark Fork River (hereafter referred to as “the Clark Fork”) on either side of Grant-Kohrs Ranch National Historic Site (GRKO) near Deer Lodge, Montana: Clark Fork at Deer Lodge, Mont. (streamgage 12324200; hereafter referred to as “Clark Fork at Deer Lodge”) and Clark Fork above Little Blackfoot River near Garrison, Mont. (streamgage 12324400; hereafter referred to as “Clark Fork near Garrison”). A stepwise regression approach was used to develop statistical models to predict MCCs and SSCs based on instantaneous values of streamflow, turbidity, and acoustic data. Discrete water-quality samples collected in water years 2019–20 were distributed over the range of fixed-point turbidity, acoustics, and streamflow measurements, with emphasis placed on medium and high streamflow periods. Although streamflow was determined to be a significant explanatory variable for MCCs and SSCs, it explained less variability in the SLR models compared to turbidity and acoustics (LISST–ABS) and did not contribute significantly to justifying its use in a more complex multiple linear regression model. The LISST–ABS acoustic sensors had excessive drift, did not meet USGS calibration criteria and maximum allowable limits for sensor drift, and could not be used in the development of time-series models. Therefore, turbidity in an SLR model was used for reliable computations of time-series MCCs and SSCs. Nash-Sutcliffe Efficiency (NSE) values were used to evaluate the effectiveness of predictive models to approximate measured MCCs and SSCs, and model bias was calculated as an additional check on model accuracy.
Using turbidity as the sole explanatory variable, coefficient of determination (R2) values for SLR predictive models ranged from 0.89 for cadmium to 0.96 for iron and lead at Clark Fork at Deer Lodge and ranged from 0.89 for manganese to 0.98 for cadmium, iron, and zinc at Clark Fork near Garrison. For SLR models, R2 values exceeded 0.90 in 9 of 12 models. The metalloid trace element arsenic had an R2 value of 0.55 at Clark Fork at Deer Lodge and 0.69 at Clark Fork near Garrison. Goodness-of-fit computations for NSE values and model biases followed similar patterns as R2 values, indicating that turbidity was a strong predictor of MCCs at both sites. NSEs ranged from 0.84 for cadmium at Clark Fork at Deer Lodge to 0.98 for zinc at Clark Fork near Garrison. NSE values for 9 out of 12 models exceeded 0.90, whereas NSE values for arsenic averaged 0.70 for both sites. A check of statistical models for biases indicated little or no bias in SLR models for MCCs and the metalloid trace element arsenic, ranging from −7.2 percent for copper at Clark Fork at Deer Lodge to −0.1 percent bias for lead at Clark Fork near Garrison. Model bias for arsenic was −4.2 percent for Clark Fork at Deer Lodge and −1.4 percent for Clark Fork near Garrison. For all SLR models, model biases were less than 5 percent for 13 out of 14 models.
Time-series instantaneous and daily MCCs and SSCs were calculated using log-transformed SLR models. There were no computed values extrapolated beyond the upper range of turbidity as the explanatory variable. Although there were periods of missing turbidity measurements, there were a large number (60,751) of instantaneous values computed for MCCs and SSCs from the 15-minute data collection interval. To simplify viewing of the graphical time-series, interpreting the data, and computing loads, daily mean values in addition to instantaneous values were computed and used for computing MCCs and SSCs.
The application of high-resolution time-series data provided insight on MCC transport, magnitude, and was used to infer contaminant source and fate. For example, using copper as a representative contaminant, it was determined that during initial snowmelt runoff freshet in 2019, copper concentration peaked at its highest value at streamflows markedly lower and prior to peak streamflow at Clark Fork at Deer Lodge and Clark Fork near Garrison. During initial snowmelt freshet, MCCs indicated higher response rates to elevated streamflow at Clark Fork near Garrison when compared to Clark Fork at Deer Lodge. In 2019, peak copper concentration during snowmelt freshet at Clark Fork near Garrison was 1.7 times higher than the peak concentration at Clark Fork at Deer Lodge. In 2020, peak copper concentration during snowmelt freshet at Clark Fork near Garrison was 1.5 times higher than the peak concentration at Clark Fork at Deer Lodge.
High-resolution time-series data revealed that copper concentrations at the Clark Fork at Deer Lodge exceeded chronic aquatic-life standards (16.1 micrograms per liter [µg/L]) 90 percent of the time for streamflow that exceeded 200 cubic feet per second (ft3/s) and exceeded acute aquatic-life standards (25.5 µg/L) 85 percent of the time when streamflow exceeded 260 ft3/s. For Clark Fork near Garrison, copper concentrations exceeded chronic aquatic-life standards (16.6 µg/L) 85 percent of the time when streamflow exceeded 250 ft3/s and exceeded acute aquatic-life standards (26.4 µg/L) 50 percent of the time when streamflow exceeded 280 ft3/s.
The R–LOADEST statistical package was used to compute annual and daily metallic-contaminant loads (MCLs) and suspended-sediment loads (SSLs) along with 95-percent prediction intervals. R–LOADEST calculated loads were compared to time-series computed loads to evaluate the applicability of time-series data for calculating daily and annual MCLs and SSLs. Prediction intervals were calculated to provide a measure of the uncertainty in load calculations. As an alternative to gain insight on relative site yield, metallic-contaminant yields were determined by dividing total annual load by the drainage area of the monitoring site.
Results from annual load estimates indicated an increase in loading for all metallic contaminants between Clark Fork at Deer Lodge and Clark Fork near Garrison. Annual arsenic loads from times-series models at Clark Fork at Deer Lodge and Clark Fork near Garrison were 7.90 and 8.65 tons per year, respectively, in 2019, and 7.61 and 8.80 tons per year in 2020, respectively, indicating an increase in arsenic load downstream. In contrast, arsenic yield at the two sites was 15.9 and 15.2 pounds per square mile (lbs/mi2) in 2019 and 15.3 and 15.5 lbs/mi2, respectively, at both sites in 2020, indicating nearly identical yields for arsenic at both sites. Copper had annual loads in 2019 of 24 and 29.9 tons per year at Clark Fork at Deer Lodge and Clark Fork near Garrison, respectively in 2019, and had loads of 19.7 and 29.6 tons per year in 2020, respectively, with corresponding yields of 48.2 and 52.4 lbs/mi2, respectively, in 2019, and 39.6 and 52.1 lbs/mi2 in 2020, respectively, indicating an increase in copper yield along the downstream gradient between the two sites. For suspended sediment, time-series annual loads in 2019 were 17,830 and 23,218 tons per year, respectively, and 13,568 and 22,622 tons per year in 2020, respectively, at Clark Fork at Deer Lodge and Clark Fork near Garrison, with corresponding yields of 17.9 and 20.4 tons per square mile, respectively, in 2019, and 13.6 and 19.9 tons per square mile, respectively, in 2020, indicating an increase in yield along the downstream gradient between the two sites. Other constituents indicated similar patterns for annual loads and yields.
R–QWTREND trend analysis software was used to calculate unfiltered total-recoverable flow-adjusted concentrations for National Park Service (NPS) and USGS water-quality samples prior to applying statistical tests to NPS and USGS data. Wilcoxon rank-sum and Welch’s two-sample t-test were applied to natural log transformed data. Comparisons between NPS and USGS water-quality samples, after adjustment for effects of variation in streamflow, indicated small differences in values for 6 out of 7 MCCs, with USGS median values slightly larger in 5 of 7 NPS samples. Cadmium and zinc are exceptions with NPS sample median values larger when compared to USGS samples. Wilcoxon rank-sum and Welch’s two-sample t-test did not indicate the small differences in 6 of 7 median values between NPS and USGS water-quality samples (cadmium is an exception) were statistically significant at the 0.05 significance level. USGS samples were assumed to be the reference value for the purpose of computing percent differences, which was attributed to more rigorous equal-width depth integrating data collection methods as compared to grab sampling; however, differences between NPS and USGS field sampling and laboratory analytical methods did not translate to significant differences in sample results or indicate negative bias in NPS water-quality samples.
References Cited
Aghaeiboorkheili, M., and Kawagle, J., 2022, The History of the derivation of Euler’s Number: Zeitschrift für Angewandte Mathematik und Physik, v. 10, p. 2780–2795, accessed February 2023 at https://www.scirp.org/journal/paperinformation.aspx?paperid=120075.
Alden, W.C., 1953, Physiography and glacial geology of western Montana and adjacent areas: U.S. Geological Survey Professional Paper 231, 200 p. [Also available at https://doi.org/10.3133/pp231.]
Allan, R.J., 1979, Sediment-related fluvial transmission of contaminants—Some advances by 1979: Inland waters directorate western and northern region Regina, Saskatchewan, Scientific Series no. 107, 24 p., accessed April 2021 at https://publications.gc.ca/site/eng/9.851897/publication.html.
Anderson, C.W., 2004, Turbidity (version 2.0): U.S. Geological Survey Techniques of Water-Resources Investigations, book 9, chap. A6, section 6.7, 64 p., accessed April 2021 at https://doi.org/10.3133/twri09A6.7.
Blanchard, R.A., Ellison, C.A., Galloway, J.M., and Evans, D.A., 2011, Sediment concentrations, loads, and particle-size distributions in the Red River of the North and selected tributaries near Fargo, North Dakota, during the 2010 spring high-flow event: U.S. Geological Survey Scientific Investigations Report 2011–5064, 27 p., accessed August 2021 at https://doi.org/10.3133/sir20115064.
Clark, G.D., Hornberger, M.I., Cleasby, T.E., Heinert, T.L., and Turner, M.A., 2020, Water-quality, bed-sediment, and invertebrate tissue trace-element concentrations for tributaries in the Clark Fork Basin, Montana, October 2017–September 2018: U.S. Geological Survey Open-File Report 2020–1067, 16 p., accessed June 2021 at https://doi.org/10.3133/ofr20201067.
Clark, G.D., Hornberger, M.I., Hepler, E.J., Cleasby, T.E., and Heinert, T.L., 2021, Water-quality, bed-sediment, and invertebrate tissue trace-element concentrations for tributaries in the Clark Fork Basin, Montana, October 2018–September 2019: U.S. Geological Survey Open-File Report 2020–1067, 16 p., accessed June 2021 at https://doi.org/10.3133/ofr20211027.
Clark, G.D.., Hornberger, M.I., Hepler, E.J., and Heinert, T.L., 2022, Water-quality, bed-sediment, and invertebrate tissue trace-element concentrations for tributaries in the Clark Fork Basin, Montana, October 2019–September 2020: U.S. Geological Survey Open-File Report 2020–1067, 16 p., accessed June 2022 at https://doi.org/10.3133/ofr20221090.
Cleasby, T.E., Hornberger, M.I., Heinert, T.L., and Turner, M.A., 2019, Water-quality, bed-sediment, and biological data (October 2016–September 2017) and statistical summaries of data for streams in the Clark Fork Basin, Montana: U.S. Geological Survey Open-File Report 2019–1060, 110 p., accessed December 2021 at https://doi.org/10.3133/ofr20191060.
Cohn, T.A., Delong, L.L., Gilroy, E.J., Hirsch, R.M., and Wells, D.K., 1989, Estimating constituent loads: Water Resources Research, v. 25, no. 5, p. 937–942, accessed February 2022 at https://doi.org/10.1029/WR025i005p00937.
Cohn, T.A., Caulder, D.L., Gilroy, E.J., Zynjuk, L.D., and Summers, R.M., 1992, The validity of a simple statistical model for estimating fluvial constituent loads—An empirical study involving nutrient loads entering Chesapeake Bay: Water Resources Research, v. 28, no. 9, p. 2353–2363. accessed February 2022 at https://doi.org/10.1029/92WR01008.
Davis, B.E., and Federal Interagency Sedimentation Project, 2005, A guide to the proper selection and use of federally approved sediment and water-quality samplers: U.S. Geological Survey Open-File Report 2005–1087, 20 p., accessed July 2021 at https://doi.org/10.3133/ofr20051087.
De Cicco, L.A., Hirsch, R.M., Lorenz, D., Watkins, W.D., 2021, dataRetrieval—R packages for discovering and retrieving water data available from Federal hydrologic web services: U.S. Geological Survey repository, accessed April 2022 at https://doi.org/10.5066/P9X4L3GE.
Dodge, K.A., and Lambing, J.H., 2006, Quality-assurance plan for the analysis of suspended sediment by the U.S. Geological Survey in Montana: U.S. Geological Survey Open-File Report 2006–1242, 25 p., accessed August 2021 at https://doi.org/10.3133/ofr20061242.
Dodge, K.A., and Hornberger, M.I., 2015, Water-quality, bed-sediment, and biological data (October 2013 through September 2014) and statistical summaries of data for streams in the Clark Fork Basin, Montana: U.S. Geological Survey Open-File Report 2015–1223, 125 p., accessed December 2021 at https://doi.org/10.3133/ofr20151223.
Dodge, K.A., Hornberger, M.I., and Turner, M.A., 2018, Water-quality, bed-sediment, and biological data (October 2015 through September 2016) and statistical summaries of data for streams in the Clark Fork Basin, Montana: U.S. Geological Survey Open-File Report 2017–1136, 118 p., accessed August 2021 at https://doi.org/10.3133/ofr20171136.
Douglas, G.B., Beckett, R., and Hart, B.T., 1993, Fractionation and concentration of suspended particulate matter in natural waters: Hydrological Processes, v. 7, no. 2, p. 177–191. [Also available at https://doi.org/10.1002/hyp.3360070208.]
Duan, N., 1983, Smearing estimate—A nonparametric retransformation method: Journal of the American Statistical Association, v. 78, no. 383, p. 605–610, accessed March 2022 at https://doi.org/10.1080/01621459.1983.10478017.
Edwards, T.K., and Glysson, G.D., 1999, Field methods for measurement of fluvial sediment: U.S. Geological Survey Techniques of Water-Resources Investigations, book 3, chap. C2, 89 p., accessed October 2018 at https://doi.org/10.3133/twri03C2.
Ellison, C.A., Savage, B.E., and Johnson, G.D., 2014, Suspended-sediment concentrations, loads, total suspended solids, turbidity, and particle-size fractions for selected rivers in Minnesota, 2007 through 2011: U.S. Geological Survey Scientific Investigations Report 2013–5205, 43 p. [Also available at https://doi.org/10.3133/sir20135205.]
Ellison, C.A., 2023, Water quality and streamflow data for the Clark Fork near Grant-Kohrs Ranch National Historic Site in southwestern Montana, water years 2019–20: U.S. Geological Survey data release, accessed March 2023 at https://doi.org/10.5066/P9330BXM.
Gammons, C.H., Metesh, J.J., and Duaime, T.E., 2006, An overview of the mining history and geology of Butte, Montana: Mine Water and the Environment, v. 25, no. 2, p. 70–75, accessed November 2021 at https://doi.org/10.1007/s10230-006-0113-7.
Garbarino, J.R., Kanagy, L.K., and Cree, M.E., 2006, Determination of elements in natural-water, biota, sediment, and soil samples using collision/reaction cell inductively coupled plasma-mass spectrometry: U.S. Geological Survey Techniques and Methods, book 5, chap. B1, 88 p., accessed July 2021 at https://doi.org/10.3133/tm5B1.
Garbarino, J.R., and Struzeski, T.M., 1998, Methods of analysis by the U.S. Geological Survey National Water Quality Laboratory—Determination of elements in whole-water digests using inductively coupled plasma-optical emission spectrometry and inductively coupled plasma-mass spectrometry: U.S. Geological Survey Open-File Report 98–165, 101 p., accessed July 2021 at https://doi.org/10.3133/ofr98165.
Gilroy, E.J., Hirsch, R.M., and Cohn, T.A., 1990, Mean square error of regression-based constituent transport estimates: Water Resources Research, v. 26, no. 9, p. 2069–2077. [Also available at https://doi.org/10.1029/WR026i009p02069.]
Grant-Kohrs Ranch, 2004, Cultural landscape report, Part 1. Landscape history, existing conditions, and analysis and evaluation: National Park Service, 493 p., accessed November 2021 at https://www.nps.gov/grko_clr_1.
Grant-Kohrs Ranch, 2006, Real ranch or not—Natural resources management, chap. 7 of Ranchers to rangers—An administrative history of Grant-Kohrs Ranch national historic site: accessed November 2020 at http://www.npshistory.com/publications/grko/adhi/chap7.htm.
Grant-Kohrs Ranch, 2014, Foundation document—Grant-Kohrs Ranch national historic site: National Park Service, 54 p., accessed November 2020 at https://www.nps.gov/grko/getinvolved/upload/Foundation-Document-2014_Accessible2.pdf.
Gray, J.R., Glysson, G.D., Turcios, L.M., and Schwarz, G.E., 2000, Comparability of suspended-sediment concentration and total suspended solids data: U.S. Geological Survey Water-Resources Investigations Report 00–4191, 14 p., accessed April 2022 at https://pubs.usgs.gov/wri/wri004191/.
Gray, J.R., and Gartner, J.W., 2009, Technological advances in suspended-sediment surrogate monitoring: Water Resources Research, v. 45, no. 4, W00D29, accessed December 2020 at https://doi.org/10.1029/2008WR007063.
Groten, J.T., Ellison, C.A., and Hendrickson, J.S., 2016, Suspended-sediment concentrations, bedload, particle sizes, surrogate measurements, and annual sediment loads for selected sites in the lower Minnesota River Basin, water years 2011 through 2016: U.S. Geological Survey Scientific Investigations Report 2016–5174, 29 p., accessed September 2021 at https://doi.org/10.3133/sir20165174.
Groten, J.T., and Johnson, G.D., 2018, Comparability of river suspended-sediment sampling and laboratory analysis methods: U.S. Geological Survey Scientific Investigations Report 2018–5023, 23 p., accessed June 2021 at https://doi.org/10.3133/sir20185023.
Guy, H.P., 1969, Laboratory theory and methods for sediment analysis: U.S. Geological Survey Techniques of Water-Resources Investigations, book 5, chap. C1, 58 p., accessed August 2021 at https://doi.org/10.3133/twri05C1.
Guy, H.P., 1970, Fluvial sediment concepts: U.S. Geological Survey Techniques of Water-Resources Investigations, book 3, chap. C1, 55 p., accessed March 2021 at https://pubs.usgs.gov/twri/twri3-c1/.
Hart, B.T., 1982, Uptake of trace metals by sediments and suspended particulates—A review: Hydrobiologia, v. 91, no. 1, p. 299–313. [Also available at https://doi.org/10.1007/BF02391947.]
Helsel, D.R., Hirsch, R.M., Ryberg, K.R., Archfield, S.A., and Gilroy, E.J., 2020, Statistical methods in water resources: U.S. Geological Survey Techniques and Methods, book 4, chap. A3, 458 p., accessed May 2022 at https://doi.org/10.3133/tm4A3. [Supersedes USGS Techniques of Water-Resources Investigations, book 4, chap. A3, version 1.1]
Hooper, M.J., Cobb, G.P., and McMurry, S.T., 2002, Wildlife biomonitoring at the Anaconda Smelter site, Deer Lodge County, Montana: Final Report of the Institute of Environmental and Human Health, Texas Tech University, 380 p., accessed April 2021 at https://www.fws.gov/montanafieldoffice/Environmental_Contaminants/ABR/ABR_Final_Report.pdf.
Horowitz, A.J., 1985, A primer on trace metal-sediment chemistry: U.S. Geological Survey Water-Supply Paper, v. 2277, 67 p. [Also available at https://doi.org/10.3133/wsp2277.]
Horowitz, A.J., and Elrick, K., 1987, The relation of stream sediment surface area, grain size, and composition to trace element chemistry: Applied Geochemistry, v. 2, no. 4, p. 437–451. [Also available at https://doi.org/10.1016/0883-2927(87)90027-8.]
Horowitz, A.J., Demas, C.R., Fitzgerald, K.K., Miller, T.L., and Rickert, D.A., 1994, U.S. Geological Survey protocol for the collection and processing of surface-water samples for the subsequent determination of inorganic constituents in filtered water: U.S. Geological Survey Open-File Report 94–539, 57 p., accessed July 2021 at https://doi.org/10.3133/ofr94539.
Jenkins, E.P., 2015, Predicting suspended sediment in Illinois rivers using dimensionless rating curves: Illinois, Graduate College of the University of Illinois at Urbana-Champaign, Ph.D. dissertation, 268 p., accessed March 2022 at http://hdl.handle.net/2142/88014.
Joiner, J.K., Aulenbach, B.T., and Landers, M.N., 2014, Watershed characteristics and water-quality trends and loads in 12 watersheds in Gwinnett County, Georgia: U.S. Geological Survey Scientific Investigations Report 2014–5141, 79 p., accessed February 20, 2023, at https://pubs.er.usgs.gov/publication/sir20145141.
Koch, R.W., and Smillie, G.M., 1986, Bias in hydrologic prediction using log-transformed regression models: Journal of the American Water Resources Association, v. 22, no. 5, p. 717–723, accessed March 2022 at https://doi.org/10.1111/j.1752-1688.1986.tb00744.x.
Lambing, J.H., 1991, Water-quality and transport characteristics of suspended sediment and trace elements in streamflow of the Upper Clark Fork Basin from Galen to Missoula, Montana, 1985–90: U.S. Geological Survey Water-Resources Investigations Report 91–4139, 73 p., accessed April 2021 at https://doi.org/10.3133/wri914139.
Lambing, J.H., Hornberger, M.I., Axtmann, E.V., and Pope, D.A., 1994, Water-quality, bed-sediment, and biological data (October 1992 through September 1993) and statistical summaries of water-quality data (March 1985 through September 1993) for streams in the upper Clark Fork Basin, Montana: U.S. Geological Survey Open-File report 94–375, 85 p., accessed November 2021 at https://doi.org/10.3133/ofr94375.
Lambing, J.H., 1998, Estimated 1996-97 and long-term average annual loads for suspended sediment and selected trace metals in streamflow of the Upper Clark Fork Basin from Warm Springs to Missoula, Montana: U.S. Geological Survey Water-Resources Investigations Report 98–4137, 35 p., accessed November 2021 at https://pubs.usgs.gov/wri/1998/4137/report.pdf.
Landers, M.N., 2012, Fluvial suspended sediment characteristics by high-resolution, surrogate metrics of turbidity, laser-diffraction, acoustic backscatter, and acoustic attenuation: Georgia Institute of Technology, Dissertation, 236 p., accessed August 2021 at http://hdl.handle.net/1853/43747.
Landers, M.N., Straub, T.D., Wood, M.S., and Domanski, M.M., 2016, Sediment acoustic index method for computing continuous suspended-sediment concentrations: U.S. Geological Survey Techniques and Methods, book 3, chap. C5, 63 p., accessed September 2021 at https://doi.org/10.3133/tm3C5.
Lee, C.J., and Ziegler, A.C., 2010, Effects of urbanization, construction activity, management practices, and impoundments on suspended-sediment transport in Johnson County, northeast Kansas, February 2006 through November 2008: U.S. Geological Survey Scientific Investigations Report 2010–5128, 54 p., accessed February 2023 at https://pubs.usgs.gov/sir/2010/5128/.
Makarowski, K., 2019, Standard operating procedure for sample collection for chemistry analysis: water, sediment, and biological tissue. WQDWQPBFM-02, Version 1.0 Helena, MT: Montana Department of Environmental Quality, Water Quality Planning Bureau, 50 p., accessed November 2022 at https://deq.mt.gov/water/Programs/Monitoring.
Manaster, A.E., Straub, T.D., Wood, M.S., Bell, J.M., Dombroski, D.E., and Curran, C.A., 2020, Field evaluation of the Sequoia Scientific LISST-ABS acoustic backscatter sediment sensor: U.S. Geological Survey Open-File Report 2020–1096, 26 p., accessed May 2021 at https://doi.org/10.3133/ofr20201096.
Montana Department of Environmental Quality, 2015, Explanation of significant differences: Montana Department of Environmental Quality, Remediation Division, 38 p., accessed December 2021 at https://media.dojmt.gov/wp-content/uploads/CFROU-ESD-2015.pdf.
Montana Department of Environmental Quality, 2019, DEQ-7 Montana numeric water quality standards: Helena, Montana, Water Quality Planning Bureau, Water Quality Standards Section, 80 p., accessed November 2021 at https://deq.mt.gov/files/Water/WQPB/Standards/PDF/DEQ7/DEQ-7.pdf.
Montana Department of Environmental Quality, 2021, Montana 2020 final water quality integrated report: Helena, Montana, Water Quality Planning Bureau, Water Quality Division, 86 p., accessed May 2022 at https://deq.mt.gov/files/Water/WQPB/CWAIC/Reports/IRs/2020/MT_2020_IR_Final.pdf.
Montgomery, J.L., Harmon, T., Kaiser, W., Sanderson, A., Haas, C.N., Hooper, R., Minsker, B., Schnoor, J., Clescery, N.L., Graham, W., and Brazonik, P., 2007, The WATERS Network—An integrated Environmental Observatory Network for Water Research: Environmental Science & Technology, v. 41, no. 19, p. 6642–6647, accessed February 2023 at https://pubs.acs.org/doi/10.1021/es072618f.
Moore, J.N., and Luoma, S.N., 1990, Hazardous wastes from large-scale metal extraction—A case study: Environmental Science & Technology, v. 24, no. 9, p. 1278–1285. [Also available at https://doi.org/10.1021/es00079a001.]
Nash, J.E., and Sutcliffe, J.V., 1970, River flow forecasting through conceptual models part 1––A discussion of principles: Journal of Hydrology, v. 10, no. 3282–3290. [Also available at https://doi.org/10.1016/0022-1694(70)90255-6.]
National Park Service, 2006, Management policies 2006: U.S. Department of the Interior, National Park Service, 168 p., accessed October 2018 at https://www.nps.gov/policy/MP2006.pdf.
National Water Quality Laboratory, 2023, Analytical services: U.S. Geological Survey National Water Quality Laboratory, accessed February 2023 at https://www.usgs.gov/labs/national-water-quality-laboratory.
Natural Resources Damage Program, 2023, Consent decrees, major NRD settlements in Montana, Upper Clark Fork River Basin: Montana v. ARCO Settlements, accessed February 2023 at https://dojmt.gov/lands/sites/consent-decrees/#:~:text=A%20consent%20decree%20involving%20the,Blackfoot%20Rivers%20at%20the%20site.
Ongley, E.D., Bynoe, M.E., and Percival, J.B., 1981, Physical and geochemical characteristics of suspended solids, Wilton Creek, Ontario: Canadian Journal of Earth Sciences, v. 18, no. 8, p. 1365–1379, accessed August 2021 at https://doi.org/10.1139/e81-126.
Porterfield, G., 1972, Computation of fluvial-sediment discharge: U.S. Geological Survey Techniques of Water-Resources Investigations, book 3, chap. C3, 65 p. accessed December 2020 at https://pubs.usgs.gov/twri/twri3-c3/.
PRISM Climate Group, 2021, PRISM products matrix: accessed November 2021 at http://www.prism.oregonstate.edu/products/matrix.phtml?vartype=ppt&view=data.
R Development Core Team, 2011, R installation and administration: Version 2.14.1, 2011-12-22, accessed October 2021 at http://streaming.stat.iastate.edu/CRAN/doc/manuals/R-admin.pdf.
Research Specialist, Inc., 2020, Monitoring Report for 2019 Clark Fork River Operable Unit: Research Specialist, Inc., 815 East Front Street, Suite 3, Missoula, MT 59802, 276 p., accessed September 2021 at https://deq.mt.gov/cleanupandrec/Programs/superfundfed.
Rocky Mountain Inventory & Monitoring Network, 2023, Taking the Pulse of the Parks, accessed February 2023 at https://www.nps.gov/im/romn/index.htm.
Sando, S.K., and Vecchia, A.V., 2016, Water-quality trends and constituent-transport analysis for selected sampling sites in the Milltown Reservoir/Clark Fork River Superfund Site in the Upper Clark Fork Basin, Montana, water years 1996–2015: U.S. Geological Survey Scientific Investigations Report 2016–5100, 82 p., accessed June 2021 at https://doi.org/10.3133/sir20165100.
Schweiger, E.W., O’Gan, L., Shorrock, D., and Britten, M., 2014, Stream ecological integrity at Grant-Kohrs Ranch National Historic Site—Rocky Mountain Inventory & Monitoring Network 2008-2010 stream monitoring report: Fort Collins, Colorado, National Park Service, Natural Resource Technical Report NPS/ ROMN/NRTR—2014/881, accessed June 2021 at http://www.nature.nps.gov/publications/nrpm/.
Sequoia Scientific, 2016, How the LISST-ABS works: accessed November 2021 at https://www.sequoiasci.com/article/how-the-lisst-abs-works/.
Smith, J.D., Lambing, J.H., Nimick, D.A., Parrett, C., Ramey, M., and Schafer, W., 1998, Geomorphology, flood-plain tailings, and metal transport in the Upper Clark Fork Valley, Montana: U.S. Geological Survey Water-Resources Investigations Report 98–4170, 56 p., accessed April 2021 at https://doi.org/10.3133/wri984170.
Snazelle, T.T., 2017, Laboratory evaluation of the Sequoia Scientific LISST-ABS acoustic backscatter sediment sensor: U.S. Geological Survey Open-File report 2017–1154, 21 p., accessed June 2018 at https://doi.org/10.3133/ofr20171154.
Stubblefield, A.P., Reuter, J.E., Dallgren, R.A., and Goldman, C.R., 2007, Use of turbidimeters to characterize suspended sediment and phosphorus fluxes in the Lake Tahoe basin, California, USA: Hydrological Processes, v. 21, no. 3, p. 281–291, accessed February 2023 at https://doi.org/10.1002/hyp.6234.
Tornes, L.H., 1986, Suspended sediment in Minnesota streams: U.S. Geological Survey Water-Resources Investigations Report 85–4312, 33 p., accessed March 2021 at https://pubs.er.usgs.gov/publication/wri854312.
Tornes, L.H., Brigham, M.E., and Lorenz, D.L., 1997, Nutrients, suspended sediment, and pesticides in streams in the Red River of the North Basin, Minnesota, North Dakota, and South Dakota, 1993–95: U.S. Geological Survey Water-Resources Investigations Report 97–4053, 77 p., accessed March 2021 at https://doi.org/10.3133/wri974053.
Topping, D.J., Melis, T.S., Rubin, D.M., and Wright, S.A., 2004, High-resolution monitoring of suspended-sediment concentration and grain size in the Colorado River in Grand Canyon using a laser acoustic system—Proceedings of the Ninth International Symposium on River Sedimentation, October 18−21, 2004: Yichang, China, Tsinghua University Press, p. 2507–2514., accessed August 2021 at http://www.irtces.org/old/irtces/report/9isrs/E_isrs06.htm#4.
Uhrich, M.A., and Bragg, H.M., 2003, Monitoring in-stream turbidity to estimate continuous suspended-sediment loads and yields and clay-water volumes in the upper North Santiam River basin, Oregon, 1998–2000: U.S. Geological Survey Water-Resources Investigation Report 2003–4098, 43 p. [Also available at https://pubs.usgs.gov/wri/WRI03-4098/pdf/wri034098.pdf.]
U.S. Environmental Protection Agency, 2004, Record of decision, Clark Fork River Operable Unit of the Milltown Reservoir/Clark Fork River Superfund Site: Helena, Montana, U.S. Environmental Protection Agency, Region 8, accessed June 2021 at http://www2.epa.gov/sites/production/files/documents/Pt2DecisionSummary.pdf.
U.S. Geological Survey, 2021a, USGS 12324200 Clark Fork at Deer Lodge MT, in USGS water data for the Nation: U.S. Geological Survey National Water Information System database, accessed April 2021 at https://doi.org/10.5066/F7P55KJN. [Site information directly accessible at https://waterdata.usgs.gov/mt/nwis/inventory/?site_no=12324200&agency_cd=USGS&.]
U.S. Geological Survey, 2021b, USGS 12324400 Clark Fork ab Little Blackfoot R nr Garrison MT, in USGS water data for the Nation: U.S. Geological Survey National Water Information System database, accessed April 2021 at https://doi.org/10.5066/F7P55KJN. [Site information directly accessible at https://waterdata.usgs.gov/mt/nwis/inventory/?site_no=12324400&agency_cd=USGS&.]
U.S. Geological Survey, 2023, USGS water data for the Nation: U.S. Geological Survey National Water Information System database, accessed February 2023 at https://doi.org/10.5066/F7P55KJN.
U.S. Geological Survey, variously dated, National field manual for the collection of water-quality data: U.S. Geological Survey Techniques of Water-Resources Investigations, book 9, chaps. A4–A5, [variously paged]. accessed July 2021 at https://pubs.water.usgs.gov/twri9A. [Chapters originally were published from 1997–1999; updates and revisions are ongoing and are summarized at https://water.usgs.gov/owq/FieldManual/mastererrata.html.]
Vecchia, A.V., and Nustad, R.A., 2020, Time-series model, statistical methods, and software documentation for R-QWTREND—An R package for analyzing trends in stream-water quality: U.S. Geological Survey Open-File Report 2020–1014, 51 p., accessed January 2022 at https://doi.org/10.3133/ofr20201014.
Venables, W.N., Smith, D.M., and the R Core Team, 2022, An Introduction to R, notes on R—A Programming environment for data analysis and graphics: Version 4.2.0 (2022-04-22), accessed May 2022 at https://cran.r-project.org/manuals.html.
Wagner, R.J., Boulger, R.W., Jr., Oblinger, C.J., and Smith, B.A., 2006, Guidelines and standard procedures for continuous water-quality monitors—Station operation, record computation, and data reporting: U.S. Geological Survey Techniques and Methods, book 1, chap. D3, 51 p., plus 8 attachments, accessed October 2018 at https://pubs.water.usgs.gov/tm1d3.
Wall, G.R., Nystrom, E.A., and Litten, S., 2006, Use of an ADCP to compute suspended-sediment discharge in the tidal Hudson River, New York: U.S. Geological Survey Scientific Investigations Report 2006−5055, accessed December 2020 at https://doi.org/10.3133/sir20065055.
Ward, J.R., and Harr, C.A., eds., 1990, Methods for collection and processing of surface-water and bed-material samples for physical and chemical analyses: U.S. Geological Survey Open-File Report 90–140, 71 p., accessed July 2021 at https://doi.org/10.3133/ofr90140.
Weibull, W., 1951, A statistical distribution function of wide applicability, American Society of Mechanical Engineers, September 1951, p. 293–297. [Also available at http://web.cecs.pdx.edu/~cgshirl/Documents/Weibull-ASME-Paper-1951.pdf.]
Wilde, F.D., and Radtke, D.B., 2005, General information and guidelines: U.S. Geological Survey Techniques of Water-Resources Investigations, book 9, chap. A6, section 6.0, 36 p., accessed November 2021 at https://pubs.water.usgs.gov/twri9A6/.
Wood, M.S., and Teasdale, G.N., 2013, Use of surrogate technologies to estimate suspended sediment in the Clearwater River, Idaho, and Snake River, Washington, 2008–10: U.S. Geological Survey Scientific Investigations Report 2013−5052, 30 p., accessed May 2021 at https://pubs.usgs.gov/sir/2013/5052/.
Woods, A.J., Omernik, J.M., Nesser, J.A., Shelden, J., Comstock, J.A., and Azevedo, S.H., 2002, Ecoregions of Montana (2d ed.): U.S. Environmental Protection Agency, Western Ecology Division, accessed November 2021 at https://www.epa.gov/wed/pages/ecoregions/mt_eco.htm.
Conversion Factors
U.S. customary units to International System of Units
Temperature in degrees Fahrenheit (°F) may be converted to degrees Celsius (°C) as follows:
°C = (°F – 32) / 1.8.
Datum
Vertical coordinate information is referenced to the North American Vertical Datum of 1988 (NAVD 88).
Horizontal coordinate information is referenced to the North American Datum of 1983 (NAD 83) or the North American Datum of 1927 (NAD 27).
Altitude, as used in this report, refers to distance above the vertical datum.
Supplemental Information
Concentrations of chemical constituents in water are given in either milligrams per liter (mg/L) or micrograms per liter (µg/L).
Abbreviations
<
less than
BCF
bias-correction factor
CFROU
Clark Fork River operable unit
CFR RipES
Clark Fork River Riparian Evaluation System
Clark Fork
Clark Fork River
EPA
U.S. Environmental Protection Agency
EWDI
equal-width depth integration
FAC
flow-adjusted concentration
FNU
formazin nephelometric unit
GRKO
Grant-Kohrs Ranch National Historic Site
LISST–ABS
laser in situ scattering and transmissometry-acoustic backscatter signal
ln
natural logarithm
LTMN
long-term monitoring network
MCC
metallic-contaminant concentration
MCL
metallic-contaminant load
MDEQ
Montana Department of Environmental Quality
MLR
multiple linear regression
NPS
National Park Service
NSE
Nash-Sutcliffe Efficiency
NWQL
National Water Quality Laboratory
POR
period of record
PRESS
prediction error sum of squares
R2
coefficient of determination
ROD
record of decision
SDI
serial data interface
SLR
simple linear regression
SSC
suspended-sediment concentration
SSL
suspended-sediment load
USGS
U.S. Geological Survey
For more information about this publication, contact:
Director, USGS Wyoming-Montana Water Science Center
3162 Bozeman Avenue
Helena, MT 59601
406–457–5900
For additional information, visit: https://www.usgs.gov/centers/wy-mt-water/
Publishing support provided by the
Rolla Publishing Service Center
Disclaimers
Any use of trade, firm, or product names is for descriptive purposes only and does not imply endorsement by the U.S. Government.
Although this information product, for the most part, is in the public domain, it also may contain copyrighted materials as noted in the text. Permission to reproduce copyrighted items must be secured from the copyright owner.
Suggested Citation
Ellison, C.A., Sando, S.K., and Cleasby, T.E., 2023, Application of surrogate technology to predict real-time metallic-contaminant concentrations and loads in the Clark Fork near Grant-Kohrs Ranch National Historic Site, Montana, water years 2019–20: U.S. Geological Survey Scientific Investigations Report 2023–5021, 70 p., https://doi.org/10.3133/sir20235021.
ISSN: 2328-0328 (online)
Study Area
| Publication type | Report |
|---|---|
| Publication Subtype | USGS Numbered Series |
| Title | Application of surrogate technology to predict real-time metallic-contaminant concentrations and loads in the Clark Fork near Grant-Kohrs Ranch National Historic Site, Montana, water years 2019–20 |
| Series title | Scientific Investigations Report |
| Series number | 2023-5021 |
| DOI | 10.3133/sir20235021 |
| Publication Date | June 22, 2023 |
| Year Published | 2023 |
| Language | English |
| Publisher | U.S. Geological Survey |
| Publisher location | Reston, VA |
| Contributing office(s) | Wyoming-Montana Water Science Center |
| Description | Report: x, 70 p.; Data Release; Dataset |
| Country | United States |
| State | Montana |
| Other Geospatial | Clark Fork, Grant-Kohrs Ranch National Historic Site |
| Online Only (Y/N) | Y |


