

Public-Supply Water Use in 2010 and Projections of Use in 2020 and 2030, Tennessee
Links
- Document: Report (3.12 MB pdf) , HTML , XML
- Data Release: USGS data release - Public-supply water use in 2010 and projections of use to 2030 by county and grand division in Tennessee
- NGMDB Index Page: National Geologic Map Database Index Page (html)
- Download citation as: RIS | Dublin Core
Abstract
Future water use was projected for public-water systems in Tennessee. Water-use information was compiled for Tennessee for 2010, and projections were made to 2020 and 2030. The water-use models were based on two primary datasets: baseline water-use information for 2010 for Tennessee and projected population in Tennessee.
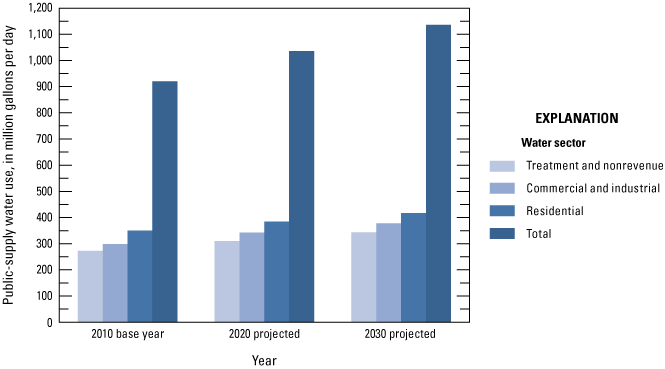
Population and water withdrawals in Tennessee are expected to increase through 2030. Because population served is projected to increase by about 1 million people during 2010 to 2030, the supply of finished water to meet demand in Tennessee is projected to increase from 921 to 1,137 million gallons per day, or 23 percent. The residential, commercial, and industrial water use, and treatment and nonrevenue water sectors of public supply are about 37, 32, and 30 percent, respectively, of the total water demand in Tennessee during 2010, 2020, and 2030.
In West Tennessee, public-supply water use is 26, 26, and 24 percent of the total water demand in Tennessee during 2010, 2020, and 2030, respectively. From 2010 to 2030, public-supply water use in West Tennessee is projected to increase 13 percent. In Middle Tennessee, public-supply water use is 38, 39, and 41 percent of the total water demand in Tennessee during 2010, 2020, and 2030, respectively. From 2010 to 2030, public-supply water use in Middle Tennessee is projected to increase 33 percent. In East Tennessee, public-supply water use is 36, 36, and 35 percent of the total water demand in Tennessee during 2010, 2020, and 2030, respectively. From 2010 to 2030, public-supply water use in East Tennessee is projected to increase 21 percent.
Introduction
Understanding and projecting how much water is needed for various uses is central to water-resource planning and public decision making. Meeting this basic need requires accurate estimates of water withdrawals and use and an understanding of how factors driving water use are likely to change in the future. Although such projections are subject to a variety of contingencies, ranging from natural disasters to economic booms or disruptions, the projections provide a basis for planners to evaluate the adequacy of water resources to meet future needs. During 2009 through 2013, the Tennessee Regional Water-Supply Planning Technical Working Group, consisting of Federal, State, and local government agencies and nonprofit groups in Tennessee, established a general framework of methods and information to support collaborative water-supply planning among interdependent water systems at a regional scale. As part of the effort, the U.S. Geological Survey, in cooperation with the Tennessee Department of Environment and Conservation, Division of Water Resources (TDEC–DWR), evaluated current water-use information and produced estimates of future water use in Tennessee.
The goal of water-supply planning is to ensure that future sources of water are sufficient to meet public demand during a proposed planning period. In this context, the term “demand” is often used interchangeably with “use,” though the two terms are not strictly equivalent. The use of water by a community at any point in time may be seen in economic terms as the expression of an inherent demand for water at a prevailing price. The curve of demand as a function of price may shift upward over time with expanding populations and economies. Water use will increase with demand, but use may also slide up or down along a demand curve in response to changing price (McAfee and Johnson, 2006).
Water-supply planning, by its nature, acts to affect the price of water in ways that may alter usage by ensuring adequate supply, improving efficiencies, expanding infrastructure, or changing pricing schedules. Any of these actions may affect water use and thereby bias assumptions concerning the nature and costs of future demand. For example, past restrictions in water availability (including conservation practices) might depress reported water use, which in turn could lead to underestimating demand at current or future prices. Likewise, an increase in water-supply costs in the future may act to reduce usage.
Other important issues concerning water use were identified by the Tennessee Regional Water-Supply Planning Technical Working Group. These issues include the need for an integrated infrastructure for water-use information among Federal, State, and local levels of government; a consistent definition for regional water-use boundaries; clear definitions and consistent methods for accurately estimating functions of water use (such as population served, nonrevenue water, and per capita use), the pricing of water, and water use during natural disasters such as floods and droughts; understanding the quantity of and where and when groundwater and surface-water resources are available; changing demographic patterns; patterns in water use; and interbasin transfers during periods of drought. For additional information on these issues and about the topics presented in this report, please see Brahana and Bradley (1985); Brahana and others (1986a); Brahana and others (1986b); Hollyday and Bradley (1985); Kingsbury and Parks (1993); Miller (1974); Parks and Carmichael (1989); U.S. Census Bureau (2012a); and U.S. Census Bureau (2012b).
Purpose and Scope
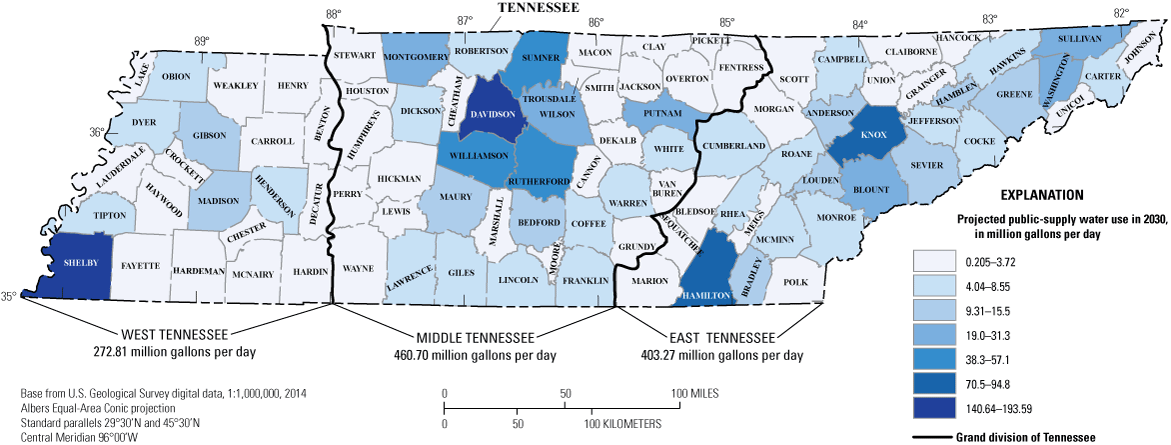
This report presents a summary of water use in 2010 and projected water use in 2020 and 2030 by public-supply water systems in Tennessee (fig. 1). Details are provided concerning data sources, methods, and assumptions for three key elements of analysis: (1) developing a baseline of actual water use and population-served information for each water system in Tennessee, (2) adapting available population information and growth projections by county to estimate future population served by public-supply water systems for 2020–30, and (3) combining current per-capita use rates and population projections to produce estimates of future water use.
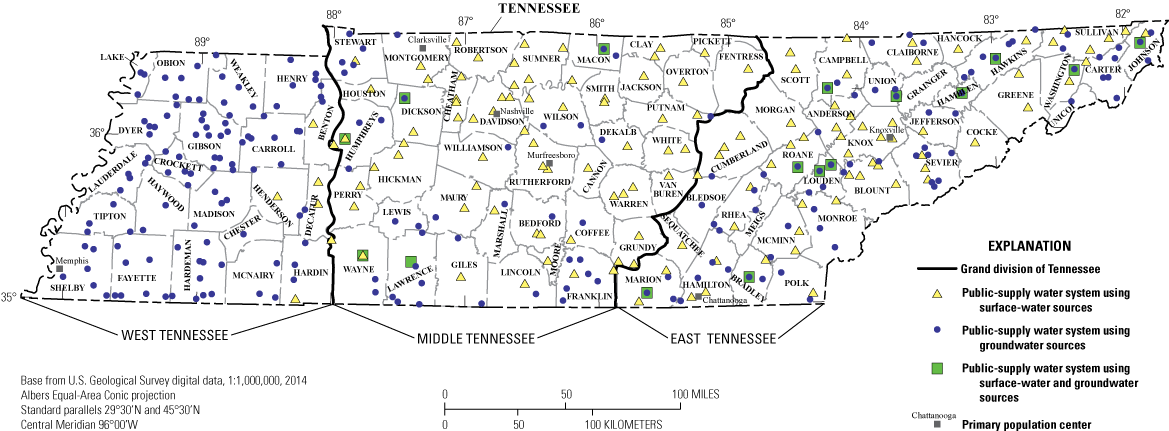
Public-supply water systems in Tennessee in 2010. Modified from Robinson (2018).
Description of Study Area
Tennessee is in the central southeastern United States, bounded by the Mississippi River on the west and extending to the Blue Ridge physiographic region on the east (fig. 1) and encompasses 42,126 square miles (mi2), which includes 926 mi2 of inland water (Webbers, 2003). It is characterized by differences in geology, physiography, and hydrology and can be divided into three distinct regions referred to as the three grand divisions of Tennessee—West Tennessee, Middle Tennessee, and East Tennessee (fig. 1). Thick unconsolidated sedimentary aquifers provide water for public supply in West Tennessee whereas surface-water sources are the primary source for Middle and East Tennessee with some withdrawal in places from groundwater sources such as wells and springs.
A total of 474 public-supply water systems, with at least one system per county (fig. 1), withdrew 916 million gallons per day (Mgal/d) of surface and groundwater and served 5.4 million people in Tennessee during 2010 (Robinson, 2023). The size of public-supply water systems is based on population served and is classified as small (25 to 3,300), medium (3,301 to 10,000), large (10,001 to 100,000), or very large (greater than 100,000). The five very large public-supply water systems in Tennessee are located in Davidson, Hamilton, Knox, Montgomery, and Shelby Counties, the most populous counties in the State. The 227 small, 135 medium, and 107 large public-supply water systems are distributed throughout Tennessee and make up 49, 28, and 23 percent, respectively, of all public-supply water systems. Public-supply water systems have increased their withdrawals from 160 Mgal/d in 1950 (MacKichan, K.A., 1951) to 916 Mgal/d in 2010 (fig. 2; Robinson, 2023).
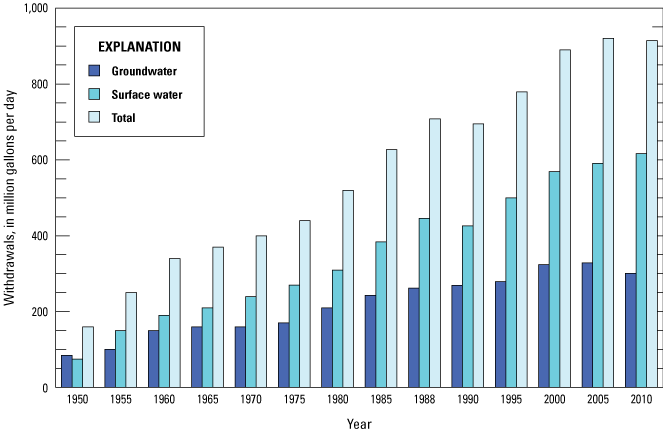
Surface-water and groundwater withdrawals by public-supply water systems in Tennessee, 1950 to 2010. Modified from Robinson (2018).
Approach and Methods
Water use in this study was projected for residential, commercial, and industrial uses, and for treatment and nonrevenue uses by using projected population served (based on county-level projections), monthly operating reports (MORs), and water system surveys (WSSs). Where available, the demographics, water use, and water-use projections by water-use category were summarized for public-water systems in three sections, referred to as grand divisions of Tennessee: East, Middle, and West Tennessee. These divisions are legal, geographic, and cultural, and date back to the earliest period of European settlement (The Tennessee Historical Society, 2018).
Baseline water-use data from public-supply systems in Tennessee were compiled and summarized for 2010. Various water-use characteristics derived from the data were used to estimate water use and water-use projections. Baseline water-use data from 2010 were compiled for systems in Tennessee using two principal sources of information: MORs submitted by each water system to the TDEC–DWR, and results of WSSs of operation characteristics completed by TDEC–DWR. Information obtained from the MORs included monthly average raw-water withdrawals by source, finished water purchased or sold, and the population served by each system. All monthly water data were reported in million gallons per day. To assess public-supply water use in Tennessee, MORs were collected and analyzed for public-supply water systems active for calendar year 2010. Each water system supplied the TDEC–DWR with MORs that included information on the source of water, mean daily or monthly water withdrawal rates, and the population served. In some instances, public-supply water systems were contacted to supplement missing data or verify reported data. The public-supply water systems included investor-owned water companies, private water companies, municipal water departments, regional water authorities, residential developments, mobile home parks, homeowner associations, and institutions such as schools and prisons.
Monthly and annual average water withdrawals by each public-supply water system were separated into surface water, groundwater, and purchased water categories. MORs were used to tabulate annual raw-water withdrawals by each water system, amount of water sold or purchased, and net amount of water used internally by the water systems (Robinson, 2023). The withdrawal rates of systems using surface-water and groundwater supplies were calculated.
TDEC–DWR issued WSSs to each water system to document the amount of total finished water distributed, including water sold to other water-supply systems and the number of accounts billed to residential, commercial, and industrial customers. The WSSs also accounted for water used for treatment and nonrevenue purposes such as firefighting, line flushing, maintenance, and other public uses or losses of water (Robinson, 2023).
Quality-assurance and quality-control reviews were done to evaluate consistency and accuracy of the WSSs. System operators were contacted as needed, and data were corrected based on information provided in interviews. In some cases, the number of accounts and the amount or percentages of water used for other purposes were missing. For consistency of units, where applicable, the amount of water sold to customers was converted from gallons to million gallons per day, and the number of billed accounts was converted from the number of billed accounts per year to the number of billed accounts per month (Robinson, 2023).
For the purposes of analysis, the data from the MORs and WSSs were separated into three categories. The data from the MORs were categorized as finished water distributed, and the data from the WSSs were categorized as billed water and nonrevenue water. For the finished-water category, the MOR monthly raw water withdrawals by water-supply systems, monthly finished water purchased from other systems, and monthly finished water sold to other systems were each averaged to obtain annual daily use values (in million gallons per day) for each water system during 2010. The annual values for raw water withdrawals, finished water purchased, and finished water sold were used to calculate net finished water distributed internally to meet demand for each water system withdrawing source water. For example, if water system A withdrew source water and sold finished water to water system B, and water system A purchased finished water from water system C, the resulting net supply for water system A equates:
whereNSA
is the net supply of water for water system A,
A
is the source water withdrawn,
B
is the finished water sold, and
C
is the finished water purchased.
The billed-water category includes information from the WSS indicating the amount of water sold and the number of billed accounts categorized as residential, commercial, and industrial. The treatment and nonrevenue category includes the total amount and percentage of water used for purposes such as firefighting, line flushing, maintenance, and other public uses or losses of water. Conservation practices and losses vary among utilities and may contribute to a large range in treatment and nonrevenue water use among water systems. The treatment and nonrevenue water use was calculated as the net finished water distributed internally (from the MORs) minus billed water sold to residential, commercial, and industrial customers. Other categories calculated from the MORs and WSSs were treatment and nonrevenue water as a part of net supply of finished water, in percent; treatment and nonrevenue water, in million gallons per day; and the ratio of water sold to residential customers to water sold to commercial and industrial customers.
TDEC–DWR provided population-served data and, where available, the number of billed residential accounts and persons per household were used to calculate the residential net population served and the residential per capita sold coefficients for each system. Population served was used to classify the size of public-supply water systems. Population served by each water system was derived by multiplying the persons per household (by county) by the number of residential connections per water system (W. Muirhead, TDEC–DWR, written commun., 2010).
Water-use projections for the Tennessee water-supply systems depend on population served, population density, and the ratio of commercial and industrial water use to residential water use. The WSSs and MORs were used to identify residential, commercial, and industrial deliveries from the public-water systems. The projected increases in residential deliveries were calculated based on per capita water use in each county and projected population increases from the Center for Business and Economic Research and University of Tennessee (2012; Robinson, 2023). Commercial and industrial deliveries were combined, and the combined water-use projections were related to growth in population served and county population density. In 2005, the ratio of commercial to residential water deliveries tended to increase as county-population density increased by approximately 1,000 people per square mile across the State (U.S. Census Bureau, 2000; U.S. Geological Survey, 2005). The ratio of combined commercial and industrial deliveries to residential deliveries (commercial rate adjustment) as a function of population density was used to derive projected commercial and industrial water use:
whereRCR
is the ratio of water sold to commercial customers to water sold to residential customers;
T2
is the final year;
PD
is the county population density;
T1
is the initial year;
INT2
is intercept two, which is 1,000 people per square mile; and
INT1
is intercept one, which is 1 person per square mile.
PRJRC
is the projected finished water sold to industrial and commercial customers, and
REST2
is the finished water sold to residential customers.
Public-Supply Water Use and Projections of Use for Tennessee
Public-supply water use was projected from 2010 to 2030 for each public-supply water system and summarized by county, state, and the three grand divisions of Tennessee. A summary of selected demographics, public-supply water use in 2010, and projected public-supply water use for 2020–30 is listed in Robinson (2023).
Projected Public-Supply Water Use
Population and water withdrawals are expected to increase through 2030 in Tennessee. Because population served is projected to increase by about 1 million people, or 19 percent, from 2010 to 2030, the supply of finished water to meet demand for Tennessee is projected to increase from 921 to 1,137 Mgal/d, or 23 percent (table 1; figs. 3, 4, 5, 6). The residential, combined commercial and industrial, and treatment and nonrevenue water sectors of public supply are about 37, 32, and 30 percent, respectively, of the total water demand in Tennessee during the same period. Although the distribution of total water demand per public-supply sector is constant by decade for the State, the distribution of water demand per sector varies by decade for each grand division. At the county level, population growth also affects water use across Tennessee. For example, during 2010, 2020, and 2030, the combined actual and projected demands in eight of the largest populated counties in Tennessee—Davidson, Hamilton, Knox, Montgomery, Rutherford, Shelby, Sumner, and Williamson—are between 57 and 59 percent of the total water demand in Tennessee during the same periods. In West Tennessee, public-supply water use is 26, 26, and 24 percent of the total water demand in Tennessee during 2010, 2020, and 2030, respectively. From 2010 to 2030, public-supply water use in West Tennessee is projected to increase 13 percent, from 242.04 to 272.81 Mgal/d (table 1). In Middle Tennessee, public-supply water use for the period of study is between 38 and 41 percent of the total water demand in Tennessee. From 2010 to 2030, public-supply water use in Middle Tennessee is projected to increase 33 percent, from 346.41 to 460.70 Mgal/d (table 1). In East Tennessee, public-supply water use for the period of study is between 35 and 36 percent of the total water demand in Tennessee. From 2010 to 2030, public-supply water use in East Tennessee is projected to increase 21 percent, from 332.11 to 403.27 Mgal/d.
Table 1.
Public-supply water use in 2010 and projections of use in 2020 and 2030 by grand division in Tennessee.[Data are summarized from Robinson (2023). Values for each division may not add to totals because of independent rounding]
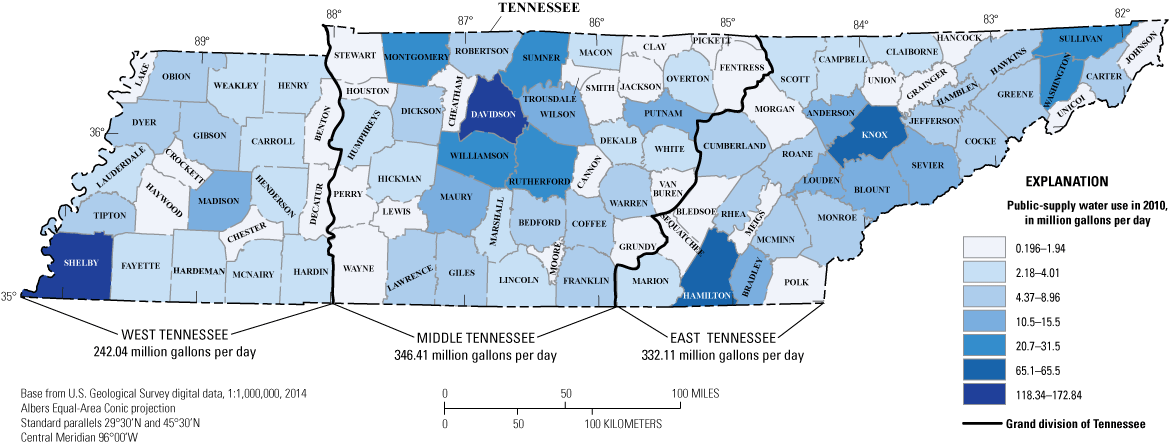
Public-supply water use in 2010 by grand division and county in Tennessee.
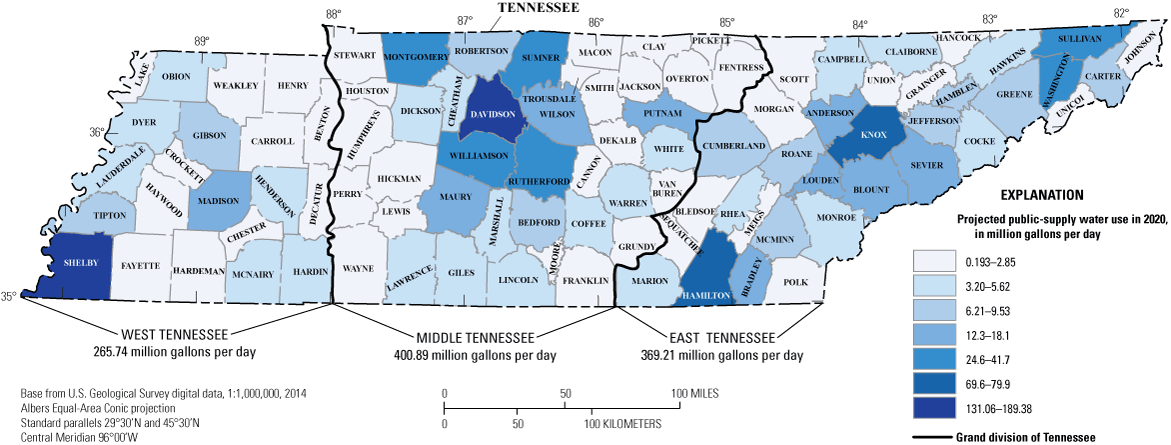
Projected public-supply water use in 2020 by grand division and county in Tennessee.
Projected public-supply water use in 2030 by grand division and county in Tennessee.
Summary of public-supply water use in 2010, 2020, and 2030, Tennessee.
West Tennessee
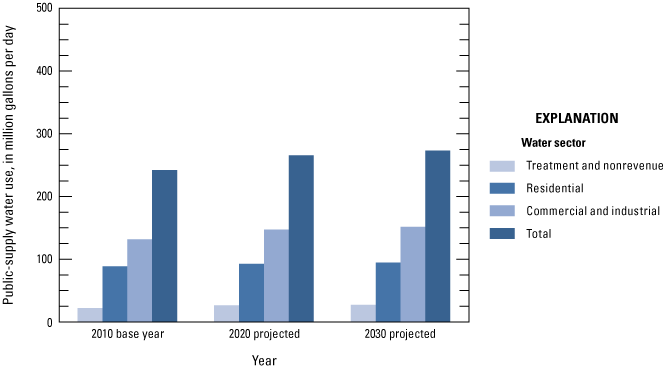
Population and water withdrawals are expected to increase through 2030 in West Tennessee. During 2010, the population served by each system in West Tennessee ranged from 4,955 to 802,421 people, and the total for all systems was about 1.3 million people (table 2; Robinson, 2023). Water withdrawals by 110 principal suppliers in West Tennessee totaled 242 Mgal/d. Groundwater withdrawals by 105 principal suppliers totaled 235 Mgal/d, and surface-water withdrawals by 5 principal suppliers totaled 6.79 Mgal/d. Residential per capita water sold ranged from 38 to 119 gallons per person per day. The ratio of combined commercial and industrial water use to residential water use was determined for 79 water-supply systems in West Tennessee and ranged from 0.002 to 4.21 (Robinson, 2023). Treatment and nonrevenue water in West Tennessee totaled 21.9 Mgal/d, which was 9 percent of the water withdrawals by principal suppliers.
Table 2.
Public-supply water use in 2010 and projections of use in 2020 and 2030, in West Tennessee.[—Left][Data are summarized from Robinson (2023). Figures may not add to totals because of independent rounding. All values in million gallons per day except where noted. NA, not applicable]
Because population served is projected to increase by about 73,000 people during 2010 to 2030 (Center for Business and Economic Research and University of Tennessee, 2012), the supply of finished water to meet internal demand in West Tennessee is projected to increase by 31.0 Mgal/d (table 2; fig. 7). Of this projected increase, 19 percent (6.01 Mgal/d) is projected to be delivered as finished water to residential customers, 64 percent (19.8 Mgal/d) as finished water to commercial and industrial customers, and the remainder (16 percent, or 5.00 Mgal/d) as nonrevenue water. West Tennessee provides water to 21 counties including Shelby County, the most populated county in this region. From 2010 to 2030, the total water demand for Shelby County is projected to increase from 172.84 to 193.59 Mgal/d, or 12 percent (table 2). During 2010, 2020, and 2030, the projected demands in Shelby County are 71 percent of the total water demand in West Tennessee. Shelby County, which relies on groundwater from six public-supply water systems, will account for 20.75 Mgal/d of the projected increase from 2010 to 2030 in West Tennessee (table 2). Public-supply water systems in 14 counties in West Tennessee are projected to account for 10.67 Mgal/d of the increase. A projected decrease in water use of 0.6 Mgal/d is attributed to six counties in West Tennessee. From 2010 to 2030, the percentage of change in the supply of finished water to meet internal demand for all counties in West Tennessee is projected to range from –11 to 78 percent (table 2). As population served increases by 6 percent in West Tennessee from 2010 to 2030, residential water use increases 7 percent, combined commercial and industrial water use increases 14 percent, and treatment and nonrevenue water increases 23 percent. During the same period, residential water use and commercial and industrial water use is 35 to 36 percent and 54 to 56 percent of the total supply, respectively, in West Tennessee (Robinson, 2023).Groundwater is the primary source for public water supply in West Tennessee; therefore, treatment and nonrevenue water is only 9 to 10 percent of the total supply in West Tennessee because groundwater contains less sediment and pollutants than lakes, rivers, and streams and requires less treatment.
Summary of public-supply water use in 2010, 2020, and 2030, West Tennessee.
Middle Tennessee
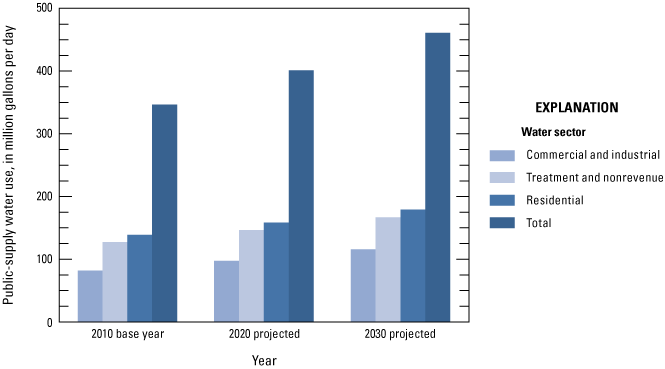
Population and water withdrawals are expected to increase through 2030 in Middle Tennessee. During 2010, the population served by each system in Middle Tennessee ranged from 5,077 to 487,090 people, and the total for all systems was about 2.1 million people (table 3; Robinson, 2023). Raw-water withdrawals by 108 principal suppliers in Middle Tennessee totaled 343 Mgal/d. Groundwater withdrawals by 37 principal suppliers totaled 16.6 Mgal/d, surface-water withdrawals by 66 principal suppliers totaled 320 Mgal/d, and combined groundwater and surface-water withdrawals by 5 principal suppliers totaled 6.76 Mgal/d. Residential per capita sold ranged from 25 to 129 gallons per person per day. The ratio of commercial and industrial to residential water use was determined for 118 water-supply systems in Middle Tennessee and ranged from 0.002 to 5.10 (Robinson, 2023). Nonrevenue water in Middle Tennessee totaled 127 Mgal/d, which was 37 percent of the raw-water withdrawals by principal suppliers.
Table 3.
Public-supply water use in 2010 and projections of use in 2020 and 2030, Middle Tennessee.[Data are summarized from Robinson (2023). Figures may not add to totals because of independent rounding. All values in million gallons per day except where noted. NA, not applicable]
Because population served is projected to increase by about 615,000 people during 2010 to 2030, the supply of finished water to meet internal demand in Middle Tennessee is projected to increase by 115 Mgal/d (table 3; fig. 8). Of this projected increase, 36 percent (41.0 Mgal/d) is projected to be delivered as finished water to residential customers, 29 percent (33.7 Mgal/d) as finished water to commercial and industrial customers, and the remainder (35 percent, or 40.0 Mgal/d) as nonrevenue water. Middle Tennessee provides water to 40 counties including Davidson, Montgomery, Rutherford, Sumner, and Williamson Counties, the five most populated counties in the region. From 2010 to 2030, the combined total water demand for Davidson, Montgomery, Rutherford, Sumner, and Williamson Counties is projected to increase from 221 to 310 Mgal/d, or 40 percent (table 3). During 2010, 2020, and 2030, the combined projected demands in Davidson, Montgomery, Rutherford, Sumner, and Williamson Counties are between 64 and 67 percent of the total water demand in Middle Tennessee. Davidson, Montgomery, Rutherford, Sumner, and Williamson Counties, which rely on surface water from 16 public-supply water systems and groundwater supply from 1 public-supply water system, are to provide 89.4 Mgal/d of the projected increase (table 3). Public-supply water systems in 31 counties in Middle Tennessee relying on groundwater and surface water are projected to provide 25.1 Mgal/d of the increase. A projected decrease in water use of 0.15 Mgal/d is attributed to four counties in Middle Tennessee, which rely on groundwater and surface water from public-supply water systems. From 2010 to 2030, the percentage of change in the supply of finished water to meet internal demand for all counties in Middle Tennessee is projected to range from –5 to 95 percent (table 3). As population served increases by 29 percent in Middle Tennessee from 2010 to 2030, residential water use increases 30 percent, combined commercial and industrial water use increases 41 percent, and treatment and nonrevenue water increases 31 percent. During the same period, residential water use and commercial and industrial water use is 39 to 40 percent and 23 to 25 percent of the total supply, respectively, in Middle Tennessee (fig. 8). Surface water is the primary source for public water supply in Middle Tennessee; therefore, treatment and nonrevenue water is 36 to 37 percent of the total supply in Middle Tennessee for 2010 to 2030 because surface water requires more treatment than groundwater due to more sediments and pollutants.
Summary of public-supply water use in 2010, 2020, and 2030, Middle Tennessee.
East Tennessee
Population and water withdrawals are expected to increase through 2030 in East Tennessee. During 2010, the population served by each system in East Tennessee ranged from 1,386 to 375,871 people, and the total for all systems was about 2 million people (table 4; Robinson, 2023). Raw-water withdrawals by 125 principal suppliers in East Tennessee totaled 331 Mgal/d. Groundwater withdrawals by 61 principal suppliers totaled 36.0 Mgal/d, surface-water withdrawals by 53 principal suppliers totaled 244 Mgal/d, and combined groundwater and surface-water withdrawals by 11 principal suppliers totaled 50.4 Mgal/d. Residential per capita sold ranged from 33 to 134 gallons per person per day. The ratio of commercial and industrial to residential water use was determined for 118 water-supply systems in East Tennessee and ranged from 0.01 to 9.63 (Robinson, 2023). Nonrevenue water in East Tennessee totaled 124 Mgal/d, which was 37 percent of the raw-water withdrawals by principal suppliers.
Table 4.
Public-supply water use in 2010 and projections of use in 2020 and 2030, East Tennessee.[Data are summarized from Robinson (2023). Figures may not add to totals because of independent rounding. All values in million gallons per day except where noted. NA, not applicable]
Because population served is projected to increase by about 316,000 people from 2010 to 2030, the supply of finished water to meet internal demand in East Tennessee is projected to increase by 71 Mgal/d (table 4; fig. 9). Of this projected increase, 28 percent (20.0 Mgal/d) is projected to be delivered as finished water to residential customers, 36 percent (25.6 Mgal/d) as finished water to commercial and industrial customers, and the remainder (35 percent, or 25.0 Mgal/d) as treatment and nonrevenue water. East Tennessee provides water to 34 counties including Hamilton and Knox Counties, the most populated counties in this region. From 2010 to 2030, the total water demand for Hamilton and Knox Counties is projected to increase from 130.6 to 165.3 Mgal/d, or 27 percent (table 4). During 2010, 2020, and 2030, the projected demands in Hamilton and Knox Counties are between 39 and 41 percent of the total water demand in East Tennessee. Hamilton and Knox Counties, which rely on surface water from 9 public-supply water systems and groundwater from 4 public-supply water systems, will account for 34.7 Mgal/d of the projected increase (table 4). Public-supply water systems in 30 counties in East Tennessee relying on groundwater and surface water are projected to provide 71.3 Mgal/d of the increase. A projected decrease in water use of 0.16 Mgal/d is attributed to Roane County in East Tennessee, which rely on groundwater and surface water from public-supply water systems. From 2010 to 2030, the percentage of change in the supply of finished water to meet internal demand for all counties in East Tennessee is projected to range from –1 to 40 percent (table 4). As population served increases by 16 percent in East Tennessee from 2010 to 2030, residential water use increases 16 percent, commercial and industrial water use increases 30 percent, and treatment and nonrevenue water increases 20 percent. During the same period, residential water use and commercial and industrial water use is 35 to 37 percent, and is 26 to 28 percent of the total supply, respectively, in East Tennessee (fig. 9). Surface water is the primary source for public water supply in East Tennessee; therefore, treatment and nonrevenue water is 37 percent of the total supply in East Tennessee because surface water requires more treatment than groundwater due to more sediments and pollutants.
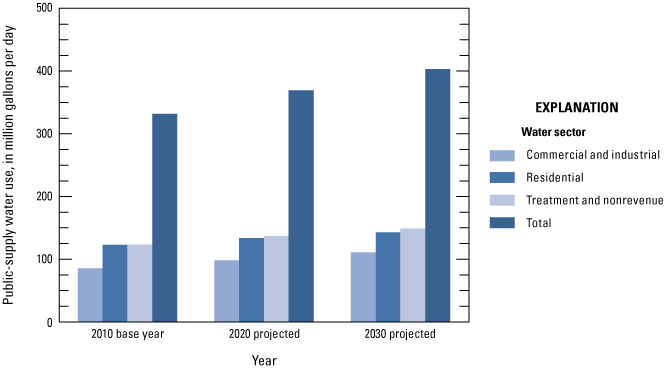
Summary of public-supply water use in 2010, 2020, and 2030, East Tennessee.
Summary
Water-resource managers and planners need information on demographics, water-use data, and water-use projections to help them make decisions regarding future water demand. As a part of this study, water use was projected for residential, combined commercial and industrial, and treatment and nonrevenue water use by using projected population served (based on county-level projections), and data derived from monthly operating reports and water system surveys. Where available, the demographics, water use, and water-use projections by water-use sector were summarized for each public-water system in the study area. The water-supply systems were analyzed in all grand divisions in Tennessee.
Population and water withdrawals are expected to increase through 2030 in Tennessee. Because population served is projected to increase by about 1 million people from 2010 to 2030, the supply of finished water to meet demand in Tennessee is projected to increase from 921 to 1,137 million gallons per day (Mgal/d), or 23 percent. The residential, combined commercial and industrial, and treatment and nonrevenue water sectors of public supply are about 37, 32, and 30 percent, respectively, of the total water demand in Tennessee during 2010, 2020, and 2030.
During 2010, the population served by each system in West Tennessee ranged from 4,955 to 802,421 people, and the total for all systems was about 1.3 million people. Raw-water withdrawals by 110 principal suppliers in West Tennessee totaled 242 Mgal/d. Residential per capita sold ranged from 38 to 119 gallons per person per day. Nonrevenue water in West Tennessee totaled 22.0 Mgal/d, which was 9 percent of the raw-water withdrawals by principal suppliers.
Because population served is projected to increase by about 73,000 people from 2010 to 2030, the supply of finished water to meet internal demand in West Tennessee is projected to increase by 31.0 Mgal/d. Of this projected increase, 19 percent (6.01 Mgal/d) is projected to be delivered as finished water to residential customers, 64 percent (19.8 Mgal/d) as finished water to commercial and industrial customers, and the remainder (16 percent, or 5.00 Mgal/d) as nonrevenue water.
During 2010, the population served by each system in Middle Tennessee ranged from 5,077 to 487,090 people, and the total for all systems was about 2.1 million people. Raw-water withdrawals by 108 principal suppliers in Middle Tennessee totaled 343 Mgal/d. Residential per capita sold ranged from 25 to 129 gallons per person per day. Nonrevenue water in Middle Tennessee totaled 127 Mgal/d, which was 37 percent of the raw-water withdrawals by principal suppliers.
Because population served is projected to increase by about 615,000 people from 2010 to 2030, the supply of finished water to meet internal demand in Middle Tennessee is projected to increase by 115 Mgal/d. Of this projected increase, 36 percent (41.0 Mgal/d) is projected to be delivered as finished water to residential customers, 29 percent (33.7 Mgal/d) as finished water to commercial and industrial customers, and the remainder (35 percent, or 40.0 Mgal/d) as nonrevenue water.
During 2010, the population served by each system in East Tennessee ranged from 1,386 to 375,871 people, and the total for all systems was about 2 million people. Raw-water withdrawals by 125 principal suppliers in East Tennessee totaled 331 Mgal/d. Residential per capita sold ranged from 33 to 134 gallons per person per day. Nonrevenue water in East Tennessee totaled 124 Mgal/d, which was 37 percent of the raw-water withdrawals by principal suppliers.
Because population served is projected to increase by about 316,000 people during 2010 to 2030, the supply of finished water to meet internal demand in East Tennessee is projected to increase by 71 Mgal/d. Of this projected increase, 28 percent (20.0 Mgal/d) is projected to be delivered as finished water to residential customers, 36 percent (25.6 Mgal/d) as finished water to commercial and industrial customers, and the remainder (35 percent, or 25.0 Mgal/d) as nonrevenue water.
Selected References
Alexander, F.M., Keck, L.A., Conn, L.G., and Wentz, S.J., 1984, Drought-related impacts on municipal and major self-supplied industrial water withdrawals in Tennessee—Part B: U.S. Geological Survey Water-Resources Investigations Report84–4074, 398 p. [Also available at https://pubs.usgs.gov/wri/wri844074B/pdf/wrir_84-4074.pdf.]
Brahana, J.V., and Bradley, M.W., 1985, Delineation and description of regional aquifers of Tennessee—The Knox aquifer in central and west Tennessee: U.S. Geological Survey Water-Resources Investigations Report83–4012, 32 p. [Also available at https://pubs.usgs.gov/wri/wri834012/pdf/wrir_83-4012_a.pdf.]
Brahana, J.V., Macy, J.A., Mulderink, D., and Zemo, D., 1986a, Preliminary delineation and description of the regional aquifers of Tennessee—Cumberland Plateau aquifer system: U.S. Geological Survey Water-Resources Investigations Report82–338, 24 p. [Also available at https://pubs.usgs.gov/wri/wrir82-338/pdf/wrir_82-338_a.pdf.]
Brahana, J.V., Mulderink, D., and Bradley, M.W., 1986b, Preliminary delineation and description of the regional aquifers of Tennessee—The Cretaceous aquifer system of west Tennessee: U.S. Geological Survey Water-Resources Investigations Report83–4039, 20 p. [Also available at https://pubs.usgs.gov/wri/wri834039/pdf/wrir_83-4039_a.pdf.]
Center for Business and Economic Research and University of Tennessee, 2012, Tennessee county population projections: accessed January 2013 at http://cber.bus.utk.edu/data/cntypjoct12.xls.
Hollyday, E.F., and Bradley, M.W., 1985, Tennessee ground-water resources, in National water summary 1984—Hydrologic events, selected water-quality trends, and ground-water resources: U.S. Geological Survey Water-Supply Paper 2275, p. 391–396. [Also available at https://doi.org/10.3133/wsp2275.]
Hutson, S.S., 1989, Ground-water use by public-supply systems in Tennessee in 1985: U.S. Geological Survey Water-Resources Investigations Report 89–4092, 1 sheet. [Also available at https://doi.org/10.3133/wri894092.]
Hutson, S.S., and Morris, A.J., 1992, Public water-supply systems and water use in Tennessee, 1988: U.S. Geological Survey Water-Resources Investigations Report91–4195, 74 p. [Also available at https://pubs.usgs.gov/wri/wri914195/pdf/wrir_91-4195_a.pdf.]
Kingsbury, J.A., and Parks, W.S., 1993, Hydrogeology of the principal aquifers and relation of faults to interaquifer leakage in the Memphis area, Tennessee: U.S. Geological Survey Water-Resources Investigations Report93–4075, 18 p. [Also available at https://doi.org/10.3133/wri934075.]
MacKichan, K.A., 1951, Estimated use of water in the United States—1950: U.S. Geological Survey Circular115, 13 p. [Also available at https://doi.org/10.3133/cir115.]
MacKichan, K.A., 1957, Estimated use of water in the United States, 1955: U.S. Geological Survey Circular398, 18 p. [Also available at https://doi.org/10.3133/cir398.]
MacKichan, K.A., and Kammerer, J.C., 1961, Estimated use of water in the United States, 1960: U.S. Geological Survey Circular456, 44 p. [Also available at https://doi.org/10.3133/cir456.]
McAfee, R.P., and Johnson, J.S., 2006, Introduction to economic analysis. California Institute of Technology, accessed November 2011 at https://www.mcafee.cc/Introecon/IEA.pdf.
Murray, C.R., 1968, Estimated use of water in the United States, 1965: U.S. Geological Survey Circular556, 53 p. [Also available at https://doi.org/10.3133/cir556.]
Murray, C.R., and Reeves, E.B., 1972, Estimated use of water in the United States in 1970: U.S. Geological Survey Circular676, 37 p. [Also available at https://doi.org/10.3133/cir676.]
Murray, C.R., and Reeves, E.B., 1977, Estimated use of water in the United States in 1975: U.S. Geological Survey Circular765, 39 p. [Also available at https://doi.org/10.3133/cir765.]
Parks, W.S., and Carmichael, J.K., 1989, Geology and ground-water resources of the Fort Pillow Sand in western Tennessee: U.S. Geological Survey Water-Resources Investigations Report89–4120, 20 p. [Also available at https://doi.org/10.3133/wri894120.]
Robinson, J.A., 2018, Public-supply water use and self-supplied industrial water use in Tennessee, 2010: U.S. Geological Survey Scientific Investigations Report2018–5009, 30 p. [Also available at https://doi.org/10.3133/sir20185009.]
Robinson, J.A., 2023, Public-supply water use in 2010 and projections of use to 2030 by county and grand division in Tennessee: U.S. Geological Survey data release, https://doi.org/10.5066/F77S7N07.
Robinson, J.A., and Brooks, J.M., 2010, Public water-supply systems and associated water use in Tennessee, 2005: U.S. Geological Survey Open-File Report2010–1226, 100 p. [Also available at https://doi.org/10.3133/ofr20101226.]
Solley, W.B., Pierce, R.R., and Perlman, H.W., 1993, Estimated use of water in the United States in 1990: U.S. Geological Survey Circular1081, 76 p. [Also available at https://doi.org/10.3133/cir1081.]
The Tennessee Historical Society, 2018, Grand divisions: The Tennessee Historical Society, accessed on October 18, 2018, at https://www.tennesseehistory.org/grand-divisions/.
U.S. Census Bureau, 2012a, Kentucky—2010—Population and housing unit counts, in 2010 census of population and housing: U.S. Census Bureau, Report CPH–2–19, 105 p., accessed August 11, 2014, at https://www.census.gov/prod/cen2010/cph-2-19.pdf.
U.S. Census Bureau, 2012b, Tennessee—2010—Population and housing unit counts, in 2010 census of population and housing: U.S. Census Bureau, Report CPH–2–44, 126 p., accessed August 11, 2014, at https://www.census.gov/prod/cen2010/cph-2-44.pdf.
U.S. Census Bureau, 2000, Tennessee—2009 quickfacts: U.S. Census Bureau, accessed December 2009 at https://www.census.gov/quickfacts/table/PST045215/00.
U.S. Geological Survey, 2005, Water use in the United States: U.S. Geological Survey web page, accessed April 12, 2013, at https://water.usgs.gov/watuse.
Webbers, A., 2003, Public water-supply systems and associated water use in Tennessee, 2000: U.S. Geological Survey Water-Resources Investigations Report03–4264, 90 p. [Also available at https://pubs.usgs.gov/wri/wri034264/PDF/PublicSupply.pdf.]
For more information about this publication, contact:
Director, USGS Lower Mississippi-Gulf Water Science Center
640 Grassmere Park, Suite 100
Nashville, TN 37211
For additional information, visit: https://www.usgs.gov/centers/lmg-water/
Publishing support provided by the Rolla Publishing Service Center
Disclaimers
Any use of trade, firm, or product names is for descriptive purposes only and does not imply endorsement by the U.S. Government.
Although this information product, for the most part, is in the public domain, it also may contain copyrighted materials as noted in the text. Permission to reproduce copyrighted items must be secured from the copyright owner.
Suggested Citation
Robinson, J.A., and Gain, W.S., 2023, Public-supply water use in 2010 and projections of use in 2020 and 2030, Tennessee: U.S. Geological Survey Scientific Investigations Report 2023–5041, 26 p., https://doi.org/10.3133/sir20235041.
ISSN: 2328-0328 (online)
Study Area
| Publication type | Report |
|---|---|
| Publication Subtype | USGS Numbered Series |
| Title | Public-supply water use in 2010 and projections of use in 2020 and 2030, Tennessee |
| Series title | Scientific Investigations Report |
| Series number | 2023-5041 |
| DOI | 10.3133/sir20235041 |
| Publication Date | April 27, 2023 |
| Year Published | 2023 |
| Language | English |
| Publisher | U.S. Geological Survey |
| Publisher location | Reston, VA |
| Contributing office(s) | Lower Mississippi-Gulf Water Science Center |
| Description | Report: iv, 26 p.; Data Release |
| Country | United States |
| State | Tennessee |
| Online Only (Y/N) | Y |