

Comparing Domestic and Public-Supply Groundwater Quality in the Northern San Joaquin Valley, 2019: California GAMA Priority Basin Project
Links
- Document: Report (21 MB pdf) , HTML , XML
- Data Releases:
- NGMDB Index Page: National Geologic Map Database Index Page (html)
- Download citation as: RIS | Dublin Core
Acknowledgments
Funding for this work was provided by the California State Water Resources Control Board Groundwater Ambient Monitoring and Assessment Program and U.S. Geological Survey Cooperative Matching Funds. We especially thank the site owners and water purveyors for their cooperation in allowing the U.S. Geological Survey to collect samples from their sites.
For consistent presentation of results from the California Groundwater Ambient Monitoring and Assessment Program Priority Basin Project (GAMA-PBP), parts of this report were written following a previously developed template.
Abstract
Groundwater quality in the Northern San Joaquin Valley region of California was studied as part of California State Water Resources Control Board (SWRCB) Groundwater Ambient Monitoring and Assessment Program-Priority Basin Project (GAMA-PBP). The GAMA-PBP made a spatially unbiased assessment of the aquifer system used for domestic drinking-water supply in the study region and compared the results to the aquifer system used for public drinking-water supply. These assessments characterized the quality of raw groundwater to evaluate ambient conditions in regional aquifers and not the quality of treated drinking water. The study included two components: (1) a status assessment presenting study results summarizing the status of groundwater quality used for domestic supply in the Northern San Joaquin Valley and (2) a comparative assessment of groundwater resources used for domestic and public drinking-water supply in the study region.
The status assessment was based on data collected by the GAMA-PBP from 45 sites in the Northern San Joaquin Valley domestic-supply aquifer assessment study unit during 2019. To contextualize water-quality results, concentrations of water-quality constituents in ambient groundwater were compared to regulatory and non-regulatory benchmarks used by the State of California and Federal agencies as health-based or aesthetic standards for public drinking water. A grid-based method to estimate aquifer-scale proportions of groundwater resources with concentrations approaching or exceeding benchmark thresholds was used in the status assessment. This method provides spatially unbiased results and allows inter-comparability with similar groundwater-quality assessments. A spatially weighted method was used to calculate aquifer-scale proportions for public-supply wells within the domestic assessment grid network using contemporaneous regulatory compliance monitoring data. Differences among aquifer-scale proportions for constituents exceeding regulatory and non-regulatory benchmarks in domestic- and public-supply aquifers were quantitatively evaluated. Factors influencing the vertical and lateral distribution of key contaminants of concern (nitrate, fumigants, and arsenic) across overlapping aquifer systems used for domestic and public drinking-water supply were also evaluated.
Status assessment results indicated inorganic and organic constituents with health-based benchmarks were present at high relative concentrations (RCs), meaning they exceeded a benchmark threshold, in 20 and 9 percent of the domestic-supply aquifer system in the Northern San Joaquin Valley, respectively. Inorganic constituents with health-based benchmarks present at high RCs included nitrate and arsenic. The only organic constituents with health-based benchmarks present at high RCs were the fumigants 1,2-dibromo-3-chloropropane (DBCP) and 1,2,3-trichloropropane (1,2,3-TCP). Inorganic constituents with aesthetic-based benchmarks were present at high RCs in 13 percent of the domestic-supply aquifer system in the Northern San Joaquin Valley and included iron and manganese. Microbial indicators (total coliform bacteria and Enterococci) were present in 18 and 2 percent of the domestic-supply aquifer system in the Northern San Joaquin Valley, respectively.
Comparative assessment results indicated inorganic and organic constituents with health-based benchmarks were present at high RCs in 13 and 6 percent of the public-supply aquifer system in the Northern San Joaquin Valley, respectively. Inorganic constituents with aesthetic-based benchmarks were present at high RCs in 22 percent of the public-supply aquifer system in the Northern San Joaquin Valley. There were no significant differences among high RC proportions for individual water-quality constituents, except for nitrate, which was greater in the domestic- compared to public-supply aquifer system in the Northern San Joaquin Valley. The most prevalent constituents with health-based benchmarks contributing to high RC proportions in the public-supply aquifer system were arsenic and fumigants, including DBCP and 1,2,3-TCP.
Analysis of construction data for wells included in the comparative assessment indicated that, although depth to top of perforations are comparable for domestic and public-supply wells in the Northern San Joaquin Valley (median depth about 60 meters [m]), public-supply wells have longer perforation intervals and extend to deeper parts of the aquifer system (exceeding 120 m) than domestic wells that typically draw exclusively from the shallower aquifer system in the upper 80 m of unconsolidated sediments. Analysis of the vertical and lateral distribution of constituents of interest (nitrate, fumigants, and arsenic) across domestic- and public-supply aquifers indicated that nitrate is prevalent in shallow aquifers throughout the Northern San Joaquin Valley but is potentially diluted by mixing with deeper, older groundwater at long-screened public-supply wells. Fumigants were prevalent in areas of urban and agricultural land use in the western part of the Northern San Joaquin Valley, particularly in areas near Lodi, California, but 1,2,3-TCP was more widespread than DBCP and was detected in shallow and deeper parts of the aquifer system, potentially because of its recalcitrance in groundwater and ability to be detected at low concentrations. Arsenic was most prevalent in the western part of the Northern San Joaquin Valley with proximity to deltaic sediments and was detected at high RCs in wells tapping shallow and deep parts of the aquifer system.
Introduction
Almost half the residential population of California depends, in some part, on groundwater for either public or domestic drinking-water supply (Carle, 2015). To assess the quality of ambient groundwater in aquifers used for drinking-water supply and to establish a baseline groundwater-quality monitoring program, the California State Water Resources Control Board (SWRCB), in collaboration with the U.S. Geological Survey (USGS) and Lawrence Livermore National Laboratory, implemented the Groundwater Ambient Monitoring and Assessment Program (GAMA; https://www.waterboards.ca.gov/gama/). In response to legislative mandates (State of California, 1999, 2001a), the SWRCB introduced GAMA in 2000.
GAMA, statewide, currently (2023) consists of two active projects: (1) the GAMA Groundwater Information System, implemented by the SWRCB (https://gamagroundwater.waterboards.ca.gov/gama/gamamap/public/) and (2) the Groundwater Ambient Monitoring and Assessment Program-Priority Basin Project (GAMA-PBP), implemented by the USGS (https://ca.water.usgs.gov/gama/). The GAMA-PBP was established in response to mandates of the Groundwater Quality Monitoring Act of 2001 “to improve comprehensive groundwater monitoring and increase the availability to the public of information about groundwater contamination” (State of California, 2001b, Sections 10780–10782.3). A monitoring framework was subsequently designed by the USGS, in collaboration with the SWRCB, to assess groundwater resources used for drinking-water supply throughout California using spatially distributed sampling approaches based on discretizing aquifer areas into equal-area grid networks (Belitz and others, 2003, 2010; California State Water Resources Control Board, 2003).
The GAMA-PBP assesses two primary types of groundwater resources: (1) public and (2) domestic drinking-water supplies. The difference between public and domestic drinking-water supply is based on the population served and frequency of use. Public drinking-water systems are defined as providers of water for human consumption through pipes or other constructed conveyances that have 15 or more service connections or regularly serve at least 25 individuals for 60 days or more of the year (State of California, 1995, Section 116275). Public-supply wells, by definition, service larger populations than domestic-supply wells and tend to be drilled deeper into aquifers, have longer screens, and continuously pump for longer time spans (California Department of Water Resources, 2022a).
The first phase of the GAMA-PBP, the “public-supply aquifer assessment” (PAA), characterized groundwater resources in California used for public drinking-water supply from 2004 to 2012 (Belitz and others, 2003, 2015). The second phase of the GAMA-PBP is ongoing and has focused on characterizing the quality of groundwater resources used for domestic drinking-water supply (domestic-supply aquifer assessment [DAA]) using similar methods as the 2012 public-supply assessments (U.S. Geological Survey, 2022a). Because drinking water from domestic-supply wells is not regulated by the California Safe Drinking Water Act (California State Water Resources Control Board, 2023), which only applies to public drinking-water systems, there are comparatively fewer data available for assessing the status and vulnerability of domestic groundwater resources statewide. It is a high priority for the SWRCB to understand where communities reliant on domestic-supply wells might be vulnerable to water-quality degradation because these communities may need to connect to public-supply systems in the future (California State Water Resources Control Board, 2021a).
The Northern San Joaquin Valley domestic-supply aquifer study unit is within the Central Valley hydrogeologic province of California (fig. 1), as defined by Belitz and others (2003), and is considered a high-priority DAA study unit by the GAMA-PBP based on the density of households reliant on domestic wells in the region (Johnson and Belitz, 2015). The GAMA-PBP completed the Northern San Joaquin Valley domestic-supply aquifer assessment (NSJV-DAA) in 2019, which included sampling of 45 wells used predominantly for domestic or small-system groundwater supplies. Prior groundwater resource studies in the region reported elevated levels of arsenic and chloride in the western part of the study unit along the San Joaquin River in the Stockton area (Izbicki and others, 2008; O’Leary and others, 2015).
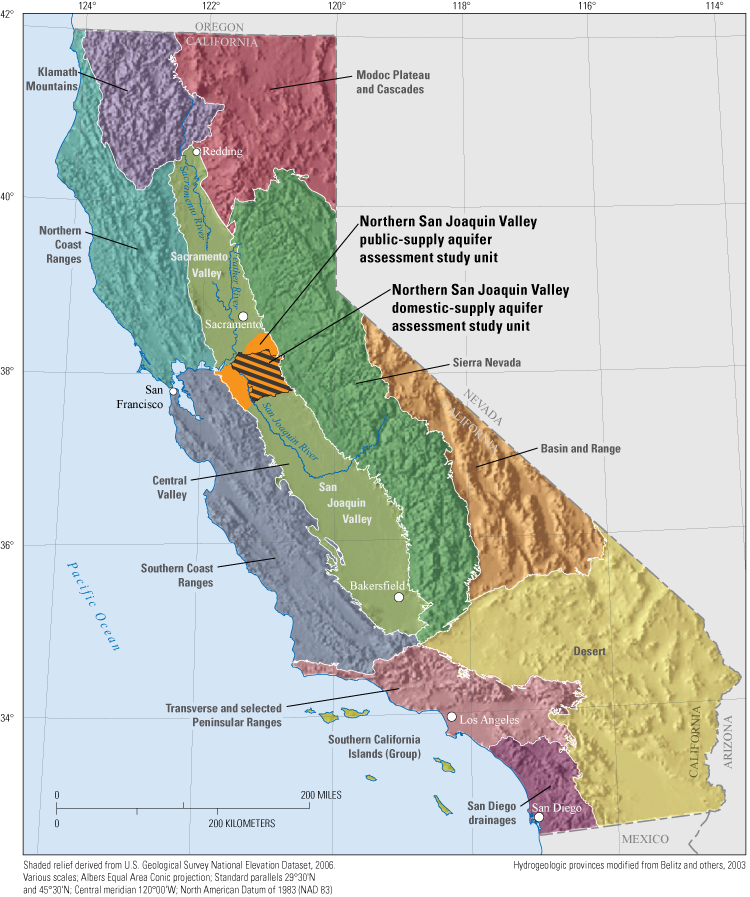
Hydrogeologic provinces of California (Belitz and others, 2003) and the location of the Northern San Joaquin Valley domestic-supply (2019) and public-supply (2005) aquifer study units (Bennett and others, 2010; Balkan and others, 20212), California Groundwater Ambient Monitoring and Assessment (GAMA) Program Priority Basin Project (U.S. Geological Survey, 2022a).
In 2005, the GAMA-PBP assessed the status of groundwater resources used for public drinking-water supply in the region (Northern San Joaquin Valley public drinking-water aquifer assessment [NSJV-PAA]) within a study area mostly overlapping with the NSJV-DAA (fig. 1; Bennett and others, 2010). Prior PAA findings in the region indicated arsenic as a constituent of concern, with about 9 percent of the used resource (by area) having concentrations more than the maximum contamination level (MCL) of 10 micrograms per liter (µg/L; Bennett and others, 2010). Nitrate and fumigants (1,2-dibromo-3-chloropropane [DBCP] and ethylene dibromide [EDB]) related to legacy agricultural land use (Burow and others, 2007) also were detected at concentrations exceeding respective MCLs in smaller proportions (2 and 3 percent, respectively).
In the San Joaquin Valley, it has been hypothesized that groundwater quality is stratified by aquifer depth zones, with shallower, domestic wells having higher levels of nitrate and fumigants derived from legacy agricultural land use compared to deeper, public-supply wells (Burow and others, 2007, 2019; Levy and others, 2021b). Arsenic concentrations have been shown to vary vertically and laterally in aquifer systems and are typically detected in higher concentrations at deeper depths and with proximity to the valley’s axial trough (Izbicki and others, 2008; Haugen and others, 2021). Preliminary results from the NSJV-DAA (Levy and others, 2021a) indicated higher proportions of the resource having nitrate and fumigant concentrations exceeding respective MCLs (11 and 9 percent, respectively) compared to the NSJV-PAA; however, areas with arsenic exceeding the MCL were similar in the two resources (9 percent). Although geologic and anthropogenic sources of high arsenic, nitrate, fumigant, and salinity concentrations in groundwaters in the study region have been well-described in prior studies (Izbicki and others, 2008; Bennett and others, 2010; Anning and others, 2012; O’Leary and others, 2015), it is less well known how water quality varies vertically and laterally among overlapping aquifer zones utilized for domestic and public drinking-water supply.
Purpose and Scope
The purposes of this report are to (1) present results from the 2019 NSJV-DAA sampling that summarize the current (2019) status of groundwater quality used for domestic supply within the study region (status assessment) and (2) update former NSJV-PAA results with more recent regulatory data (2016–19) to directly compare the quality of groundwater resources used for domestic drinking drinking-water supply with the quality of groundwater resources used for public drinking-water supply within the bounds of the NSJV-DAA study unit (comparative assessment). The comparative assessment directly compares the quality of the two used resources by aquifer area and assesses the vertical and lateral distribution of constituents of primary concern (those most commonly exceeding respective MCLs) among the two overlapping aquifer systems. Domestic- and public-supply well-construction data also are compiled and compared to illustrate the extent of variable aquifer depth zones composing the two resources.
Assessment Approaches Used for this Study
GAMA-PBP status assessments are designed to provide a statistically representative characterization of groundwater resources within a defined study unit during the time of sampling. A stratified random sampling design is used to effectively characterize the area of the groundwater resource within a study unit. This approach prevents biasing assessment results to areas of greater well density. The stratified design was achieved by dividing the study unit into equal-area grid cells, randomly selecting one groundwater well in each cell to sample (herein, “grid site”) and using the data obtained from those samples to calculate “aquifer-scale proportions” for different water-quality constituents. Aquifer-scale proportion refers to the areal proportion of a groundwater resource having a defined level of quality (Belitz and others, 2010). This method provides a spatially unbiased assessment of groundwater resources for a given study area and allows inter-comparability of GAMA-PBP assessments with other similar groundwater studies throughout a wide range of spatial scales and sampling resolutions (Belitz and others, 2015).
Water-quality measurements were compared to State and Federal benchmarks (regulatory and non-regulatory) to define specific groundwater-quality classifications for quantification of aquifer-scale proportions. These benchmarks are typically used to evaluate the quality of treated drinking water delivered by public-supply systems in and outside of California. Although domestic groundwater quality is not regulated by the California Safe Drinking Water Act (California State Water Resources Control Board, 2023), the benchmarks provide metrics that can be used for contextualizing domestic drinking-water resources because they were developed to meet broad health- and aesthetic-based standards for human consumption (Toccalino and Hopple, 2010).
The comparative assessment of domestic- and public-supply aquifer systems compares the NSJV-DAA assessment results to those calculated from recent regulatory compliance monitoring data for public-supply wells using the approach of Levy and Fram (2021). Because the GAMA-PBP public-supply assessment in the Northern San Joaquin Valley was made more than a decade before the NSJV-DAA, water-quality data submitted to the California State Water Resources Control Board Division of Drinking Water’s (SWRCB-DDW’s) public-supply well regulatory-monitoring database (California State Water Resources Control Board, 2021d) from more than 400 wells during 2016–19 was used to facilitate a more contemporaneous comparison between the domestic- and public-supply aquifer systems within the DAA grid network. Aquifer-scale proportions for water-quality data from the public-supply wells were calculated using the spatially weighted approach described by Belitz and others (2010) and compared to grid-based estimates and confidence intervals used to evaluate water quality in the status assessment on the study-unit scale (Levy and Fram, 2021). Overview of status assessment results for domestic- and public-supply aquifers are presented, followed by a more in-depth discussion of factors controlling the vertical and lateral distribution of groundwater quality between the two aquifer systems. Summary construction data for domestic- and public-supply wells in the region are compared in aggregate and along hydrogeochemical transects to illustrate key differences in the parts of the regional aquifer system tapped for the water resources.
Hydrogeologic Setting
The Northern San Joaquin Valley domestic-supply aquifer study unit lies within the Central Valley hydrogeologic province described by Belitz and others (2003) and is defined by the California Department of Water Resources (CDWR) as the San Joaquin Valley Eastern San Joaquin groundwater subbasin, which covers an area of about 3,100 square kilometers (km2; California Department of Water Resources, 2018). The climate in the study unit has historically been described as Mediterranean, with warm, dry summers and cold, wet winters (Faunt, 2009). Average annual precipitation in the Northern San Joaquin Valley is about 40–50 centimeters (cm), with average annual minimum and maximum temperatures of 8 and 25 degrees Celsius (°C), respectively (PRISM Climate Group, 2021). Runoff from the Sierra Nevada sustains flow in rivers and streams draining the east side of the study unit. The Stanislaus, Calaveras, and Mokelumne Rivers and several smaller streams flow across the study unit into the San Joaquin River (fig. 2), which flows north into the Sacramento–San Joaquin Delta (hereafter referred to as “the Delta”). The Delta is identified by a network of islands and waterways along the western edge of the Northern San Joaquin Valley study unit (fig. 3).
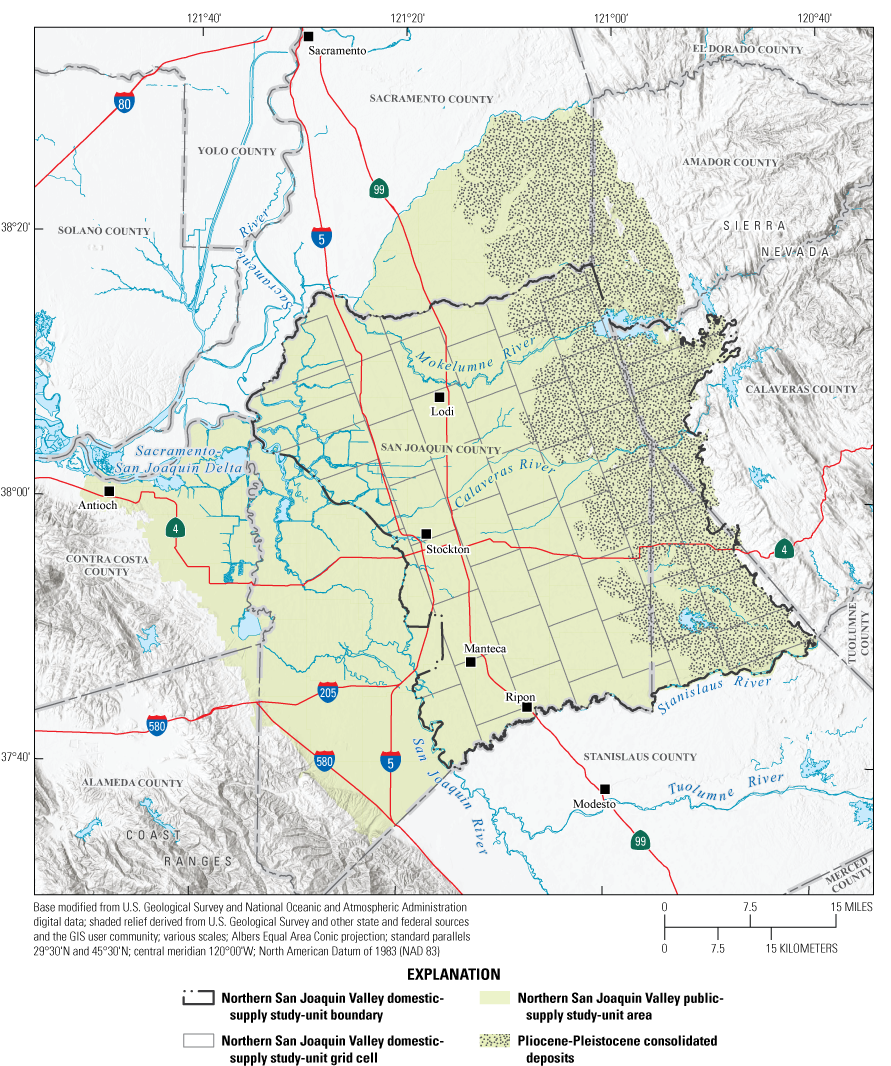
Location and boundaries of the Northern San Joaquin Valley domestic-supply (2019) and public-supply (2005) aquifer study units (Bennett and others, 2010; Balkan and others, 20212), California Groundwater Ambient Monitoring and Assessment (GAMA) Program Priority Basin Project (U.S. Geological Survey, 2022a).
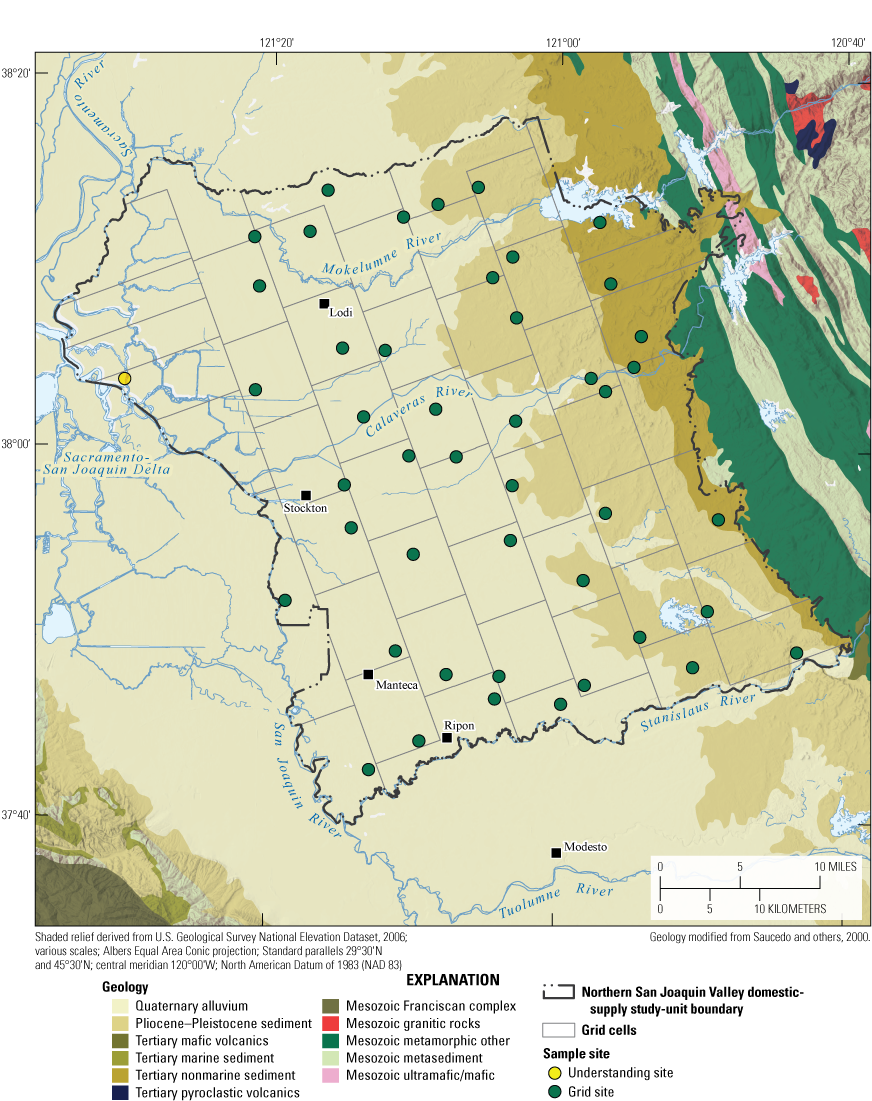
Geologic formations (Saucedo and others, 2000) and groundwater sampling site locations in the Northern San Joaquin Valley domestic-supply aquifer study unit, 2019 (Balkan and others, 2021), California Groundwater Ambient Monitoring and Assessment (GAMA) Program Priority Basin Project (U.S. Geological Survey, 2022a).
Aquifers in the Northern San Joaquin Valley are composed of a mix of unconsolidated alluvial-fan deposits and deeper consolidated volcanic deposits. The alluvial-fan deposits range in age from late-Pliocene to Quaternary and are composed of multiple sediment sequences linked to repeated episodes of glaciation in the Sierra Nevada (Davis and Hall, 1959; Weissmann and others, 2002, 2004, 2005; Burow and others, 2004; fig. 3). Shallower alluvial aquifers typically utilized for drinking-water supply are separated from deeper marine sediments containing saline water by low-permeability volcanic deposits which lies about 300 meters (m) below the land surface in the Stockton area (O’Leary and others, 2015). A small part of the study unit northwest of the City of Stockton is located within the Delta (fig. 3). The Delta is tidally affected and is hydrologically connected to saline waters of the San Francisco Bay (not shown; Piper and others, 1939). Sediments in the Delta are an amalgamation of deposits from the Sierra Nevada and Coast Ranges that accumulated within its marshes. The large volume of organic matter in the Delta has resulted in the formation of thick peat soils (Delusina and others, 2022). Few wells providing drinking water were available to be sampled in this part of the study unit.
Land use generally transitions from major urban areas in the western part of the Northern San Joaquin Valley to agriculturally dominant areas in the center to natural in the uplands to the east (fig. 4; Falcone, 2015). The City of Stockton, on the western edge the study unit, is the largest urban area in the Northern San Joaquin Valley. Stockton is connected to the City of Lodi to the north and the City of Manteca to the south via California State Highway 99, which runs along the axis of the San Joaquin Valley. Public-supply wells tend to cluster at higher densities in urban areas along the western part of the study unit. Agricultural land use surrounds and extends to the east of the major urban areas (Falcone, 2015). Natural land use dominates the eastern edge of the study unit, but there are some semi-developed urban areas mixed in (Falcone, 2015). The transition from agricultural to natural land use generally corresponds to the geologic transition from Quaternary alluvial fan deposits to older, more consolidated deposits that crop out along the eastern edge of the study unit (figs. 3, 4).
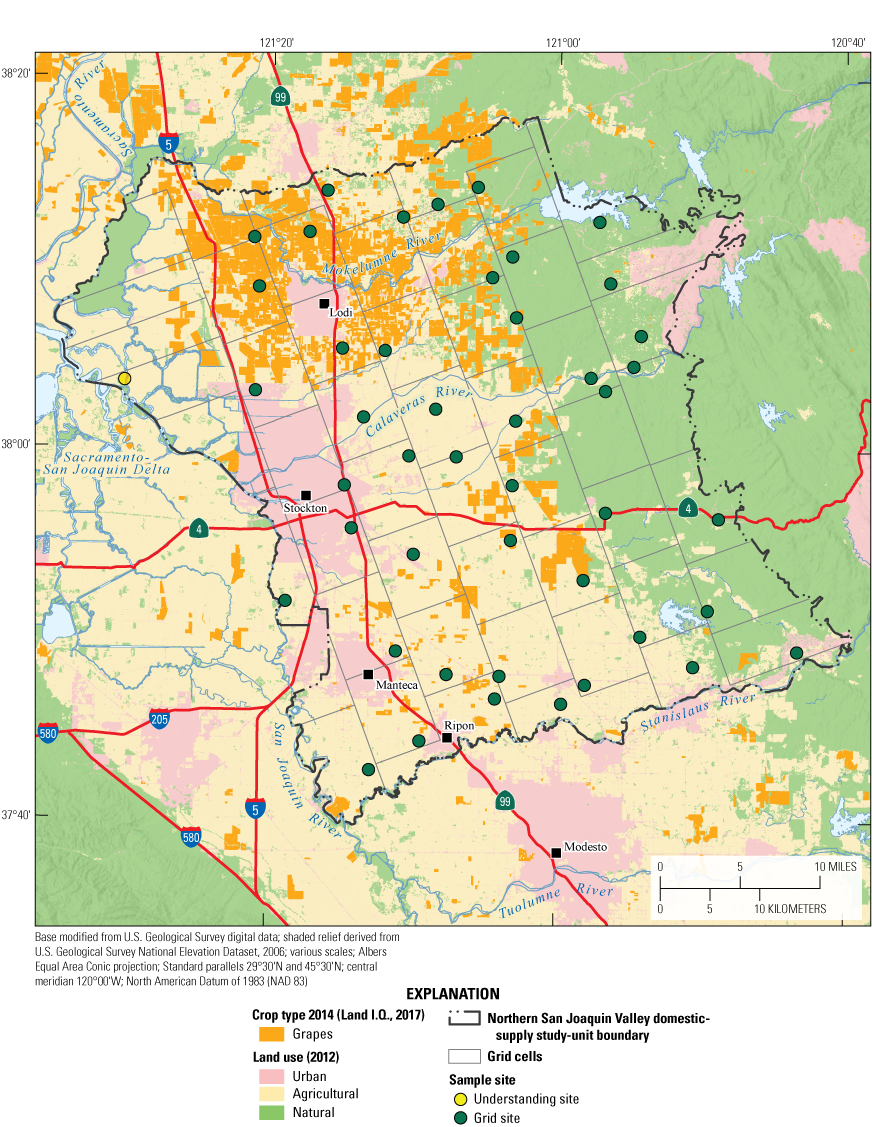
Land use categorized into urban, agricultural, and natural areas, 2012 (Falcone, 2015), in the Northern San Joaquin Valley domestic-supply aquifer study unit, 2019 (Balkan and others, 2021), California Groundwater Ambient Monitoring and Assessment (GAMA) Program Priority Basin Project (U.S. Geological Survey, 2022a).
Sources of groundwater recharge in the study unit include percolation of precipitation, irrigation and urban return flows, and seepage from rivers draining the Sierra Nevada (Burow and others, 2004; Phillips and others, 2007). Water from the Sierra Nevada stored in reservoirs and diverted for irrigation and drinking-water supply is the largest source of groundwater recharge to the study unit (Phillips and others, 2007). Sources of discharge in the study unit are pumping withdrawals for irrigation, domestic, and municipal water supply, discharge to streams, and the combination of evaporation from areas with a shallow depth to water and transpiration of water from plants (evapotranspiration). Regional flow in the study unit is generally driven by an elevation gradient from west to east that ultimately results in the discharge of water to the San Joaquin River and evapotranspiration in the western part of the flow system. The larger regional flow pattern is altered in the central part of the study unit by downward vertical flows driven by irrigation withdrawals coupled with subsequent return flows (Burow and others, 2007; Faunt, 2009). Historically, the Delta has served as a primary discharge area for regional groundwater flow originating in the Sacramento and San Joaquin Valleys. Groundwater extractions have created a regional cone of depression of groundwater levels along the eastern perimeter of the Delta, thereby altering historical flow patterns (O’Leary and others, 2015; fig. 5).
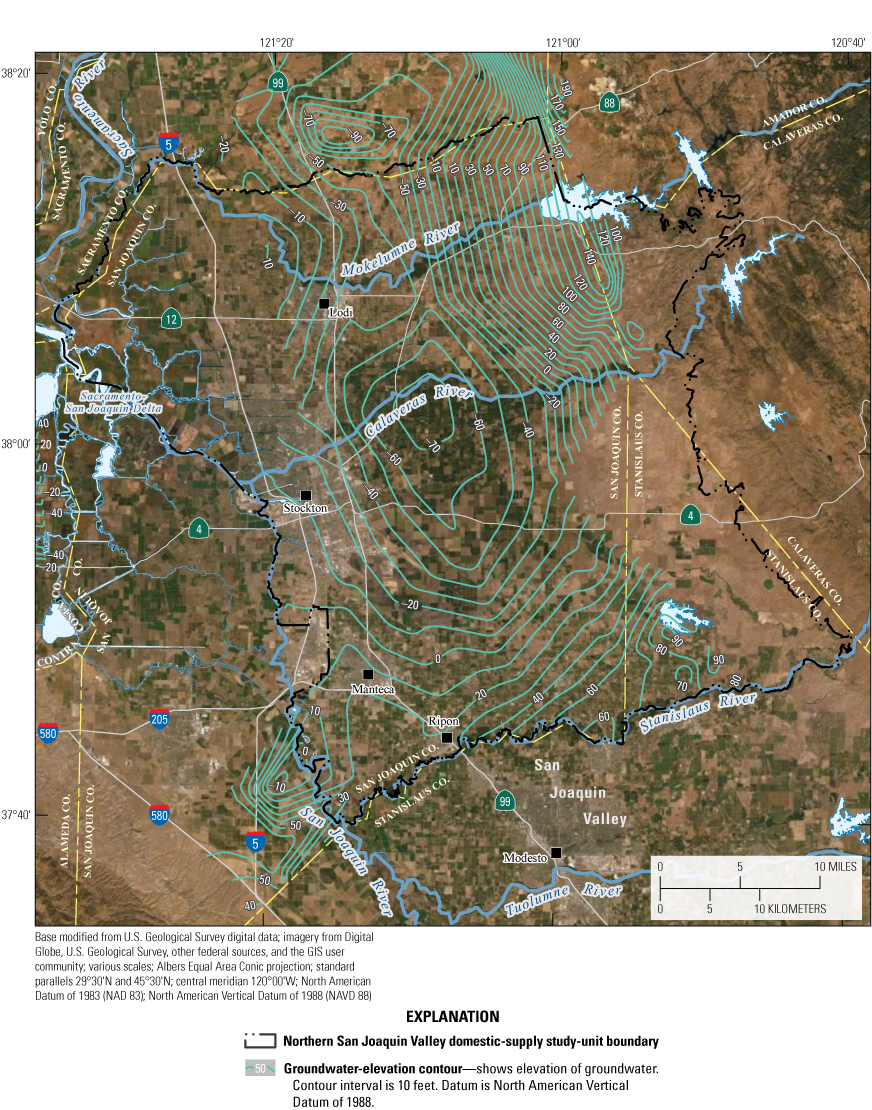
Groundwater elevation contour intervals, fall 2017 (California Department of Water Resources, 2022b), in the Northern San Joaquin Valley domestic-supply aquifer study unit, 2019 (Balkan and others, 2021), California Groundwater Ambient Monitoring and Assessment (GAMA) Program Priority Basin Project (U.S. Geological Survey, 2022a).
Methods
This section describes methods used for the status assessment of the NSJV-DAA and comparative assessment of groundwater resources used for domestic and public drinking-water supply within the Northern San Joaquin Valley study unit area. Methods used to collect and analyze groundwater samples for the NSJV-DAA and associated quality-assurance protocols are reported by Balkan and others (2021).
Status Assessment
The status assessment was designed to characterize the quality of groundwater used for domestic drinking-water supply in the NSJV-DAA study unit using aquifer-scale proportions. This section explains the methods used for (1) defining groundwater quality using established benchmarks, (2) assembling the datasets used for the assessments, (3) selecting constituents for evaluation in the assessments, and (4) calculating aquifer-scale proportions.
Groundwater Quality Defined as Relative Concentration
To maintain consistency with prior GAMA-PBP assessments, this study contextualized groundwater-quality data using relative concentrations (RCs), which are defined as the ratio of a measured constituent’s concentration in groundwater to a regulatory or non-regulatory water-quality benchmark. An RC value less than 1.0 indicates a groundwater-quality constituent is less than its benchmark concentration, and an RC value greater than 1.0 indicates the constituent exceeds its benchmark concentration in the sample. Water-quality constituents without any established benchmarks were not included in the status assessment. Using RCs is a means by which concentration data can be normalized, allowing evaluation and inter-comparison of a wide array of organic and inorganic constituents at concentrations spanning several orders of magnitude (Toccalino and others, 2004; Toccalino and Norman, 2006; Rowe and others, 2007).
The RCs were classified as “low,” “moderate,” or “high” for calculation of aquifer-scale proportions. Values of RCs greater than 1.0 were defined as “high” for all inorganic constituents. For inorganic constituents (trace elements, nutrients, and radioactive constituents), RC values less than or equal to 1.0 and greater than 0.5 were defined as “moderate,” and RC values less than or equal to 0.5 were defined as “low.” For the inorganic constituents, non-detections are classified as “low.”
For organic and special-interest constituents (defined later in the text), RC values less than or equal to 1.0 and greater than 0.1 were defined as moderate, and RC values less than or equal to 0.1 were defined as low. Although the high RC classification indicates concentrations in excess of a benchmark standard for all water-quality constituents, the moderate RC classification can indicate groundwater that could be vulnerable to developing concentrations in excess of benchmark levels in the future and can be used as an early indicator of potential groundwater contamination. The threshold between low and moderate RC is less for organic than for inorganic constituents because organic constituents have anthropogenic origins and are typically not present in groundwater at high RC. Extending the moderate RC range to a lower threshold, therefore, effectively draws attention to areas where there has been anthropogenic contamination. Because many inorganic constituents can be present naturally in groundwater systems at RC levels greater than 0.1, an elevated RC threshold of 0.5 was set to focus on inorganic constituents at levels of more immediate concern (Fram and Belitz, 2014).
Regulatory and non-regulatory benchmarks are typically used to evaluate treated drinking water distributed by public-supply systems. Although the State of California does not regulate water quality from domestic wells under the California Safe Drinking Water Act (California State Water Resources Control Board, 2023), the use of water-quality benchmarks developed to meet health- and aesthetic-based standards for public-supply sources provides context to evaluate the quality of domestic-supply sources for the purposes of this study. The water-quality constituents measured for this study were compared to benchmarks established by the U.S. Environmental Protection Agency (EPA), California State Water Resources Control Board Division of Drinking Water (SWRCB-DDW), and USGS (Norman and others, 2018). For constituents with multiple benchmarks, a primary benchmark was selected in the following order of priority:
-
1. Regulatory, human-health based levels set by the SWRCB-DDW and EPA (U.S. Environmental Protection Agency, 2018; California State Water Resources Control Board, 2022a) in order of priority: SWRCB-DDW and EPA maximum contaminant levels (California State Water Resources Control Board Division of Drinking Water maximum contaminant level [MCL-CA] and U.S. Environmental Protection Agency maximum contaminant level [MCL-US], respectively), whichever MCL is lower; EPA action levels (AL-US); and U.S. Environmental Protection Agency treatment technique levels (TT-US).
-
2. Aesthetic-based levels set by the SWRCB-DDW and EPA (U.S. Environmental Protection Agency, 2018; California State Water Resources Control Board, 2022a): California and EPA secondary maximum contaminant levels (California State Water Resources Control Board, Division of Drinking Water secondary maximum contaminant level [SMCL-CA] and U.S. Environmental Protection Agency secondary maximum contaminant level [SMCL-US]). The salinity indicators chloride, sulfate, and total dissolved solids (TDS) have recommended and upper SMCL-CA levels (California State Water Resources Control Board, 2022a); for this study, the upper levels were used.
-
3. Non-regulatory, human-health based levels set by the EPA and SWRCB-DDW (U.S. Environmental Protection Agency, 2018; California State Water Resources Control Board, 2022b): EPA lifetime health advisory level (HAL-US) or SWRCB-DDW response level (California State Water Resources Control Board, Division of Drinking Water response level, RL-CA), whichever is lower.
-
4. U.S. Environmental Protection Agency human-health benchmarks for pesticides (HHBP-US) and USGS health-based screening levels (HBSL; Norman and others, 2018; U.S. Environmental Protection Agency, 2021).
The HHBP-US and HBSL benchmarks may have cancer and non-cancer thresholds, and in each case, the lower of the two was used when applicable. The “special interest” class of constituents in GAMA-PBP studies has historically included constituents that the State of California was actively considering for an MCL-CA at the time of study or at the beginning of the GAMA-PBP project in 2003 or those that do not directly correspond to the other constituent classes. Perchlorate is a trace inorganic compound and received an MCL-CA in 2007. Detections of perchlorate in groundwater at concentrations near or above the MCL-CA are typically from anthropogenic sources (California State Water Resources Control Board, 2021b), and detections at concentrations less than one-tenth of the MCL-CA are typically from natural sources (Fram and Belitz, 2012). Perchlorate is considered as a constituent of special interest for the purposes of this study and is evaluated in a manner like the organic constituents; this maintains consistency with the evaluation framework for perchlorate in numerous prior GAMA-PBP studies (for example, Bennett, 2018; Burton and Wright, 2018). Also included in the special- interest class of constituents were 24 per- and polyfluoroalkyl substances (PFAS), four of which (perfluorobutanesulfonate [PFBS], perfluorohexanesulfonate [PFHxS], perfluorooctanesulfonate [PFOS], and perfluorooctanoate [PFOA]) currently (2023) have SWRCB-DDW notification and response levels (California State Water Resources Control Board, 2022b).
The SWRCB-DDW “notification level” (California State Water Resources Control Board, Division of Drinking Water notification level, NL-CA) is a non-regulatory, health-based advisory level that is associated with the RL-CA (see primary benchmark prioritization framework discussed earlier in the text) and functions as an early warning indicator for certain contaminants that do not have regulatory benchmarks (California State Water Resources Control Board, 2022b). The NL-CA can range from 6 to 100 times less than the RL-CA. For instances where a constituent had an NL-CA, the value of the NL-CA was used to indicate the low-to-moderate threshold for the RC classification instead of the benchmark multiplied by 0.1 (for organic constituents) or 0.5 (for inorganic constituents).
Following the outlined framework, if the measured constituent concentration was greater than its NL-CA and less than or equal to a corresponding non-regulatory, health-based primary benchmark value (either the RL-CA or HAL-US, whichever is lower), the constituent was considered present at a moderate RC. Boron, vanadium, PFBS, PFHxS, PFOA, and PFOS were the only detected constituents with NL-CA values for which RC thresholds were affected by this modification to the RC classification system. For example, although the primary benchmark for PFOS is the RL-CA of 40 nanograms per liter (ng/L), the low-to-moderate concentration boundary is the NL-CA of 6.5 ng/L and not 4 ng/L (one-tenth of the 40 ng/L RL-CA). Using the NL-CA as the low-to-moderate RC threshold maintains consistency between the interpretation of the moderate RC classification by the GAMA-PBP and the intended use of the NL-CA benchmark by the SWRCB-DDW as an early warning indicator of groundwater-quality degradation (California State Water Resources Control Board, 2022b).
Datasets Used for Status Assessment
Groundwater-quality data used for the NSJV-DAA came from sites sampled by the USGS for the GAMA-PBP using a grid-based sampling approach (fig. 3). Detailed descriptions of grid-cell delineation and well selections for the NSJV-DAA study unit are provided by Balkan and others (2021). In each of the 50 grid cells that made up the NSJV-DAA, 1 domestic well was randomly selected from a list of target sites compiled from CDWR, USGS, State, or county databases until a suitable site was identified for which permission to sample could be obtained from the well owner.
The GAMA-PBP sampled 45 grid sites in the NSJV-DAA study unit and 1 additional site, for a total of 46 sites sampled. All sampled sites were labeled with an alphanumeric GAMA identification (GAMA ID), which contains information about the study area and order of sampling. Details on the attribution of GAMA IDs are compiled in the data release Balkan and others (2021). An additional non-grid (“understanding”) site, S10-ESJB-01U, was on an island in the Delta, which is an area of the study unit with relatively few domestic wells available to be sampled. The well was not used for domestic or small-system drinking-water supply and therefore is not included in status assessment results. This additional well was sampled to understand the geochemical characteristics of groundwater flowing through the Delta sediments (Levy and others, 2021a) and is thus identified as the “understanding site” (figs. 3, 4).
A total of 258 groundwater constituents were analyzed for samples from the 46 sites in the NSJV-DAA (table 1). The results of these analyses are tabulated in Balkan and others (2021) and are also available online from the SWRCB’s GAMA Groundwater Information System (California State Water Resources Control Board, 2021c), the USGS publicly available National Water Information System (NWIS; U.S. Geological Survey, 2021), and the USGS GAMA-PBP Groundwater-Quality Results: Assessment and Trends web page (Jurgens and others, 2018).
Table 1.
Summary of groundwater sites, water-quality constituent groups, and numbers of constituents sampled for each constituent group by the U.S. Geological Survey (USGS) in the Northern San Joaquin Valley domestic-supply aquifer study unit, 2019 (Balkan and others, 2021), California Groundwater Ambient Monitoring and Assessment (GAMA) Program Priority Basin Project (U.S. Geological Survey, 2022a).[Unless otherwise noted, constituent analyses were performed at USGS laboratories. Abbreviations: δ, delta notation, indicating the isotopic enrichment or depletion of a sample relative to a standard of known composition; C, carbon; H, hydrogen; N, nitrogen; O, oxygen]
Selection of Constituents for Additional Evaluation in the Status Assessment
Water-quality constituents were selected for evaluation in the status assessment if they were present at moderate or high RCs in at least one sample from any grid well or if they were an organic or special-interest constituent detected in at least 10 percent of the sites sampled. Evaluating organic and special-interest constituents by RC and detection frequency allowed us to focus the status assessment on concentration and frequency of detection for constituents that are not often present at detectable concentrations in natural groundwater samples. Detection frequency was not used as a criterion for evaluation of the inorganic constituents because inorganic constituents are typically detectable at some concentration in most natural groundwater samples. Three microbial indicators (total coliform, TC; Escherichia coli, EC; and Enterococci, ENT) were only tested for “presence” or “absence” and were included in the status assessment if they were present in at least one well.
There were 15 water-quality constituents selected for evaluation in the status assessment (table 2). Inorganic constituents (34), organic constituents (11), special interest constituents (9), and isotopes and traces (11) that do not have established benchmarks, had low RCs, or were present in less than 10 percent of the sites evaluated are summarized in table 3. Aquifer-scale proportions are not presented for water-quality constituents only detected at low RCs because the proportion of the aquifer having low concentrations for those constituents was 100 percent.
Table 2.
Constituents selected for additional evaluation in the status assessments of groundwater quality (domestic and public supply) in the Northern San Joaquin Valley domestic-supply aquifer study unit, 2019, California Groundwater Ambient Monitoring and Assessment Priority Basin Project (U.S. Geological Survey, 2022a).[Inorganic constituents selected if maximum concentration measured in USGS-GAMA samples were greater than 0.5 times the benchmark concentration. Organic and special interest constituents selected if maximum concentration was greater than 0.1 times the benchmark concentration, or if detection frequency at any concentration was greater than 10 percent. Benchmark type: Regulatory, health-based benchmarks: AL-US, EPA action level; MCL-US, EPA maximum contaminant level; MCL-CA, SWRCB-DDW maximum contaminant level; HAL-US, EPA lifetime health advisory level; TT-US, EPA treatment technique. Non-regulatory health-based benchmarks: NL-CA, SWRCB-DDW notification level; RL-CA, SWRCB-DDW response level. Aesthetic-based benchmarks: SMCL-CA, SWRCB-DDW secondary maximum contaminant level. Benchmark units: µg/L, micrograms per liter; mg/L, milligrams per liter; pCi/L, picocuries per liter; μS/cm, microsiemens per centimeter at 25 degrees Celsius. Other abbreviations: Public supply, public drinking-water aquifer assessment; Both, public and domestic drinking-water aquifer assessments; Domestic supply, domestic drinking-water aquifer assessment; USGS, U.S. Geological Survey; GAMA, Groundwater Ambient Monitoring and Assessment Program; EPA, U.S. Environmental Protection Agency; SWRCB-DDW, California State Water Resources Control Board Division of Drinking Water]
Maximum contaminant level benchmarks are listed as MCL-US when the MCL-US and MCL-CA are identical and as MCL-CA when the MCL-CA is lower than the MCL-US or no MCL-US exists. Secondary contaminant level benchmarks are listed as SMCL-US when the SMCL-US and SMCL-CA are identical and as SMCL-CA when the SMCL-CA is lower than the SMCL-US or no SMCL-US exists. Sources of benchmarks: AL-US: U.S. Environmental Protection Agency (2018); MCL-CA: California State Water Resources Control Board (2022a), MCL-US: U.S. Environmental Protection Agency (2018), RL-CA: California State Water Resources Control Board (2022b), SMCL-CA: California State Water Resources Control Board (2022a), TT-US: U.S. Environmental Protection Agency (2018).
The low-to-moderate concentration boundary for boron is the NL-CA of 1,000 μg/L (California State Water Resources Control Board, 2022b).
The low-to-moderate concentration boundary for vanadium is the NL-CA of 50 µg/L (California State Water Resources Control Board, 2022b).
MCL-US benchmark for trihalomethanes is for the sum of chloroform, bromodichloromethane, dibromochloromethane, and bromoform (U.S. Environmental Protection Agency, 2018).
MCL violation due to presence of total coliform is based on repeat sampling (California State Water Resources Control Board, 2022a).
Presence of Enterococci is considered a violation of treatment technique standards (California State Water Resources Control Board, 2022a).
Table 3.
Constituents detected in samples collected by the U.S. Geological Survey that lack benchmarks, were present only at low relative concentrations, or (for organics) were detected in less than 10 percent of the domestic-supply status assessment grid samples, Northern San Joaquin Valley domestic-supply aquifer study unit, 2019 (Balkan and others, 2021), California Groundwater Ambient Monitoring and Assessment Priority Basin Project (U.S. Geological Survey, 2022a).[Relative concentration (RC) is defined as the measured value divided by the benchmark value. For inorganic constituents, RC>1.0 is defined as high, and 1≥RC>0.5 is defined as moderate. For organic constituents, RC>1.0 is defined as high, and 1≥RC>0.1 is defined as moderate. Benchmark types: Regulatory, health-based benchmarks: AL-US, EPA action level; HAL-US, EPA lifetime health advisory level; MCL-CA, SWRCB-DDW maximum contaminant level; MCL-US, EPA maximum contaminant level. Non-regulatory health-based benchmarks: HBSL, USGS Health Based Screening Level; NL-CA, SWRCB-DDW notification level; RL-CA, SWRCB-DDW response level. Aesthetic-based benchmarks: SMCL-CA, SWRCB-DDW secondary maximum contaminant level. Abbreviations: cm3STP/gH20, cubic centimeter at standard temperature and pressure per gram of water; EPA, U.S. Environmental Protection Agency; fg/kg, femtogram per kilogram; H, hydrogen; mg/L, milligrams per liter; na, not available; ng/L, nanograms per liter; O, oxygen; per mil, parts per thousand; pCi/L, picocuries per liter; SWRCB-DDW, California State Water Resources Control Board Division of Drinking Water; >, greater than; ≥, greater than or equal to; μg/L, micrograms per liter]
Maximum contaminant level benchmarks are listed as MCL-US when the MCL-US and MCL-CA are identical and as MCL-CA when the MCL-CA is lower than the MCL-US or no MCL-US exists. Secondary contaminant level benchmarks are listed as SMCL-CA when the SMCL-US and SMCL-CA are identical and as SMCL-CA when the SMCL-CA is lower than the SMCL-US or no SMCL-US exists. Sources of benchmarks: AL-US: U.S. Environmental Protection Agency (2018), HAL-US: U.S. Environmental Protection Agency (2018), HBSL: Norman and others (2018), MCL-CA: California State Water Resources Control Board (2022a), MCL-US: U.S. Environmental Protection Agency (2018), RL-CA: California State Water Resources Control Board (2022b), SMCL-CA: California State Water Resources Control Board (2022a).
The HAL-US is 30 mg/L "as ammonia." To facilitate comparison to the analytical results, we have converted and reported the HAL-US as 24.7 mg/L "as nitrogen."
The low-to-moderate concentration boundary for boron is the NL-CA of 1,000 μg/L (California State Water Resources Control Board, 2022b).
The low-to-moderate concentration boundary for vanadium is the NL-CA of 50 µg/L (California State Water Resources Control Board, 2022b).
The low-to-moderate concentration boundary for PFBS is the NL-CA of 500 ng/L (California State Water Resources Control Board, 2022b).
The low-to-moderate concentration boundary for PFHxS is the NL-CA of 3 ng/L (California State Water Resources Control Board, 2022b).
The low-to-moderate concentration boundary for PFOS is the NL-CA of 6.5 ng/L (California State Water Resources Control Board, 2022b).
The low-to-moderate concentration boundary for PFOA is the NL-CA of 5.1 ng/L (California State Water Resources Control Board, 2022b).
Calculation of Aquifer-Scale Proportions
Aquifer-scale proportions for the public-supply aquifer system were determined using spatially weighted calculations (Belitz and others, 2010). The spatially weighted method for calculating aquifer-scale proportions is used to avoid bias due to spatial clustering of wells in the study unit. The use of this method prevents urban areas of high public-supply well density from over-representing aquifer conditions within the broader study unit. Calculating high RC aquifer-scale proportions using the spatially weighted method removes spatial bias by averaging the results of multiple wells by cell across the grid-cell network (eq. 1):
whereis the high RC aquifer-scale proportion for the study-unit area,
NSU
is the number of grid sites in the study unit that have data for a given water-quality constituent,
is summation over i grid cells where n is the maximum number of grid cells containing data for a given water-quality constituent,
is the number of wells in cell n of the study unit with a high RC value for a given water-quality constituent, and
Wn
is the number of wells in cell n of the study unit with data for a given water-quality constituent.
Equation 1 calculates the proportion of wells in each grid cell with high RC groundwater for a given water-quality constituent and then averages cell-scale proportions across all cells with data across the study-unit grid network. Spatially weighted aquifer-scale proportions for moderate and low RCs and detection frequencies (presence or absence of a microbial indicator or organic constituent) can be calculated similarly.
A grid-based statistical approach was used to calculate the areal proportion of the aquifer system in the NSJV-DAA study unit having high, moderate, and low RCs for selected water-quality constituents (Belitz and others, 2010). For ease of discussion, these proportions are referred to as “high RC,” “moderate RC,” and “low RC” aquifer-scale proportions. Non-detections were considered to be low RC for inorganic constituents. However, because organic and special-interest constituents are commonly not detected, these chemicals were categorized as having a low RC only when detections were less than the low-to-moderate RC threshold, and a separate aquifer-scale proportion was calculated for non-detections. Aquifer-scale proportions were calculated for individual water-quality constituents and constituent classes. For a given constituent class, the highest RC value for a constituent belonging to that class at each grid site was used to calculate the aquifer-scale proportions for that class. For example, if a site has groundwater at high-RC for boron, a moderate RC for fluoride, and low RCs for the other trace elements, then that site would be considered to have high RC groundwater for the trace-element class because of the high RC of boron. The high-RC aquifer-scale proportion for a constituent class, therefore, represents the proportion of the groundwater resource having at least one detection at high-RC for a constituent within that class. Additionally, aquifer-scale proportions were calculated for presence or absence of microbial indicator species.
High-RC aquifer-scale proportions (PSUhigh) were calculated as the proportion of grid sites in the study unit having high RC for a given constituent or class of constituents (eq. 2):
whereis the high RC aquifer-scale proportion for the study-unit area,
is the number of grid sites in the study unit with a high RC value for a given water-quality constituent or class of constituents, and
is the number of grid sites in the study unit that have data for a given water-quality constituent or constituent class.
Aquifer-scale proportions for moderate and low RCs, non-detections for organic and special-interest constituents, and presence or absence of microbial indicators were calculated similarly by replacing terms using the superscript “high” in equation 1 with terms using the superscripts “moderate,” “low,” “non-detection,” “present,” or “absent,” respectively. Confidence intervals for aquifer-scale proportions were calculated using the Jeffreys interval for the binomial distribution (Brown and others, 2001; Belitz and others, 2010).
Comparative Assessment
In this report, we compare water-quality results between the aquifer system used for domestic drinking-water supply and the aquifer system used for public drinking-water supply in the area defined by the NSJV-DAA study unit. Similar comparisons for overlapping study areas have been made in other GAMA-PBP studies (Bennett, 2018; Burton and Wright, 2018; Levy and Fram, 2021). In 2005, the GAMA-PBP assessed the public-supply aquifer in the Northern San Joaquin Valley, which covered three CDWR-defined groundwater subbasins: the Cosumnes, Eastern San Joaquin, and Tracy subbasins (not shown; Bennett and others, 2010). The Eastern San Joaquin subbasin was a distinct study area in that assessment, and the subbasin roughly overlaps with the NSJV-DAA, providing an opportunity for comparison. However, because the public-supply assessment was done 14 years before the 2019 domestic-supply aquifer assessment and the boundary of the Eastern San Joaquin subbasin was redefined by CDWR in between the assessments (California Department of Water Resources, 2016), a comparison using results from the prior study would not likely be representative of contemporaneous differences in water quality between the two resources. Therefore, representative aquifer-scale proportions for the public-supply aquifer system were calculated for the comparative assessment using regulatory compliance monitoring data sourced from the SWRCB-DDW for all available water-quality analyses of raw, untreated groundwater from public-supply wells within the boundary of the domestic-grid network in the 3 years leading up to the NSJV-DAA (from September 25, 2016, to September 25, 2019; California State Water Resources Control Board, 2021d). This comparative assessment provided a more contemporaneous water-quality dataset covering an equivalent area for direct comparison with the more recently completed NSJV-DAA study unit.
There were 438 public-supply wells that had at least 1 measurement of a water-quality constituent with a benchmark within the 3-year timeframe selected for comparison (fig. 6). Individual wells with data during the period of interest had data for 1–33 water-quality constituents with benchmarks. These data were used to calculate aquifer-scale proportions for cells within the grid network that had at least one measurement of a given water-quality constituent contingent on sufficient cell coverage using SWRCB-DDW data (greater than 50 percent of cells with data, which was determined to be the minimum proportion of coverage needed to provide statistically relevant information for urbanized areas of high public-supply well density in the western part of the study unit).
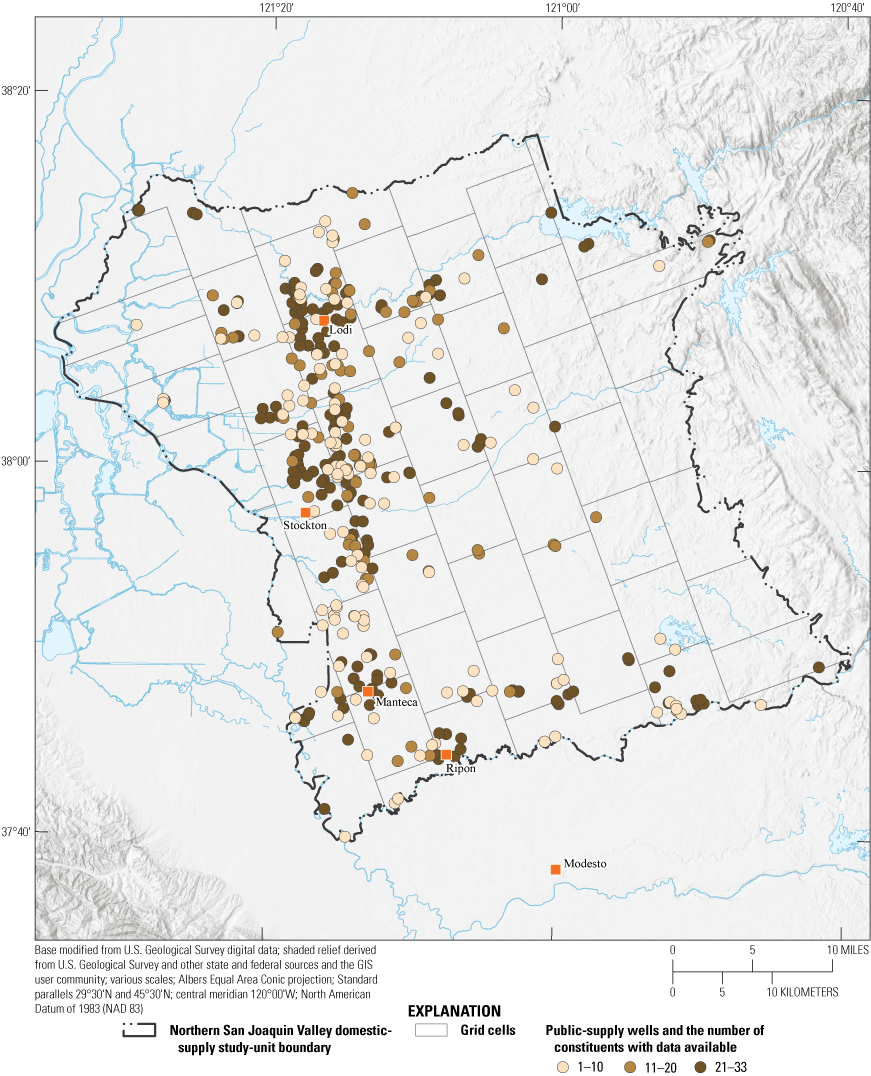
Public-supply wells with regulatory monitoring data for at least one water-quality constituent used for comparative assessment (California State Water Resources Control Board, 2021d) in the Northern San Joaquin Valley domestic-supply aquifer study unit, 2019 (Balkan and others, 2021), California Groundwater Ambient Monitoring and Assessment (GAMA) Program Priority Basin Project (U.S. Geological Survey, 2022a).
The spatially weighted calculation requires at least one measurement per water-quality constituent for each well. The water-quality measurement for a given well and constituent used, therefore, was the most recent result within a 3-year time frame leading up to the sampling of the NSJV-DAA study unit, in this case, September 25, 2016, to September 25, 2019. This method prioritized selection of samples measured as close in time as possible to the NSJV-DAA and within a limited period so that public-supply aquifer assessment results would indicate more recent aquifer conditions and be more comparable to results for the NSJV-DAA.
Spatially weighted calculations representing the public-supply resource used in the comparative assessment are presented for constituents meeting the criteria for inclusion in the NSJV-DAA status assessment. Microbial indicators were not included in the comparative assessment because the data were not comparable. The GAMA-PBP only does a one-time sampling for microbial indicators, whereas public-supply wells are subject to repeated regulatory compliance monitoring designed to identify and treat potential sources of microbial contamination (U.S. Environmental Protection Agency, 2014). Data for water-quality constituents included in the public-supply assessment were available from at least one public-supply well in the NSJV-DAA study unit, providing coverage for 52–82 percent of the grid cells. Data-rich cells were more often located on the more urbanized western side of the study unit where the density of public-supply wells is greater (fig. 6).
The GAMA-PBP results for organic and special-interest constituents in the comparative assessment had to be re-censored because GAMA-PBP reporting levels for these constituents are much less than those in the SWRCB-DDW database (Fram and Belitz, 2012). All GAMA-PBP data used in the comparative assessment were re-censored at the most common reporting level for each respective constituent in the SWRCB-DDW database. Recensoring meant recoding low-level detections of organic and special-interest constituents as non-detections if they were below the reporting level used by the SWCRB-DDW. Reporting levels from the SWRCB-DDW database used for censoring were 3 µg/L for methyl tert-butyl ether, 1 μg/L for trihalomethanes, 0.5 µg/L for solvents, 0.01 μg/L for DBCP, 0.005 μg/L for 1,2,3-TCP, 0.02 for EDB, and 4 μg/L for perchlorate. Any detection for the selected organic and special-interest constituents in GAMA-PBP data that was less than the censoring thresholds was considered a non-detection for the purposes of the comparative assessment.
Differences between the overall water quality of the public- and domestic-supply aquifer systems were quantitatively evaluated by comparing high RC aquifer-scale proportions for any constituents that met criteria for inclusion in respective status assessments. Statistical differences among aquifer-scale proportions for the comparative assessment were considered significant if the spatially weighted proportion (public supply) was outside of the 90-percent confidence interval for the grid-based proportion (domestic supply) by more than 1 percent (to account for rounding error). Confidence intervals were not directly assessed for the spatially weighted aquifer-scale proportions because of uncertainties regarding within-cell data clustering (Belitz and others, 2010).
Construction data were compiled and evaluated for wells used in the comparative assessment to characterize the vertical extent of the aquifer system in the study unit tapped for domestic- and public-supply. Construction information for domestic wells in the NSJV-DAA is compiled in the data release of Balkan and others (2021). Of the 438 public-supply wells that had water-quality data used in the comparative assessment, 190 had data for either depth to top or bottom of perforations and 187 had both in the compilation data release of Levy and Borkovich (2022). Differences among construction data for domestic- and public-supply wells used in the comparative assessment were quantitatively assessed using the Wilcoxon Rank Sum test included in the R software stats package with a critical level (α) of 5 percent (Helsel and others, 2020; R Core Team, 202158).
Status of Groundwater Quality Used for Domestic Supply
The following discussion of the status assessment results for the NSJV-DAA is divided into two parts: one for inorganic constituents and the other for organic and special-interest constituents. Each part describes a survey of the number of constituents that were detected at any concentration compared to the number of constituents analyzed and presents a graphical summary of the RCs of constituents detected at grid sites. Aquifer-scale proportions are then presented for constituent classes and for the individual constituents that were present at moderate or high RCs.
Inorganic Constituents
Inorganic constituents generally occur naturally in groundwater, but their concentrations may be affected by human activities and natural, geologic factors (Hem, 1985). Eight inorganic constituents were identified for further discussion in the status assessment based on their detections at moderate or high RCs at grid sites: the trace element arsenic, the nutrient nitrate, the radioactive constituent uranium, and five inorganic constituents with aesthetic-based SMCL benchmarks (chloride, iron, manganese, specific conductance, and TDS; table 2; figs. 7, 8). Uranium could be classified as either a “trace element,” given that its MCL-US is based on its toxicity as a heavy metal, or as a “radioactive constituent.” Because gross-alpha particle activity can be used as an indicator of uranium in groundwater and measurements of uranium in public-supply wells can be sparse, uranium was classified as a “radioactive constituent” in this report to facilitate discussion when comparing results between domestic- and public-supply sites. Other inorganic constituents detected in the NSJV-DAA, with or without benchmarks, occurring only at low RCs that are not included in the status assessment are presented in table 3.
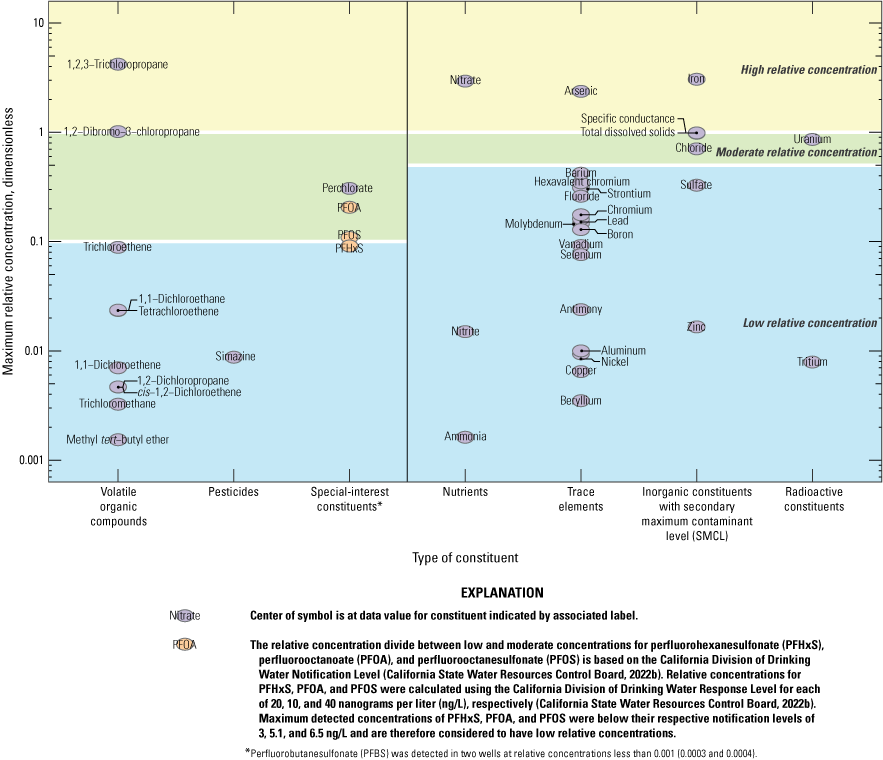
Maximum relative concentrations for constituents detected in grid sites by type of constituent (Balkan and others, 2021), Northern San Joaquin Valley domestic-supply aquifer study unit, 2019, California Groundwater Ambient Monitoring and Assessment Priority Basin Project (U.S. Geological Survey, 2022a).
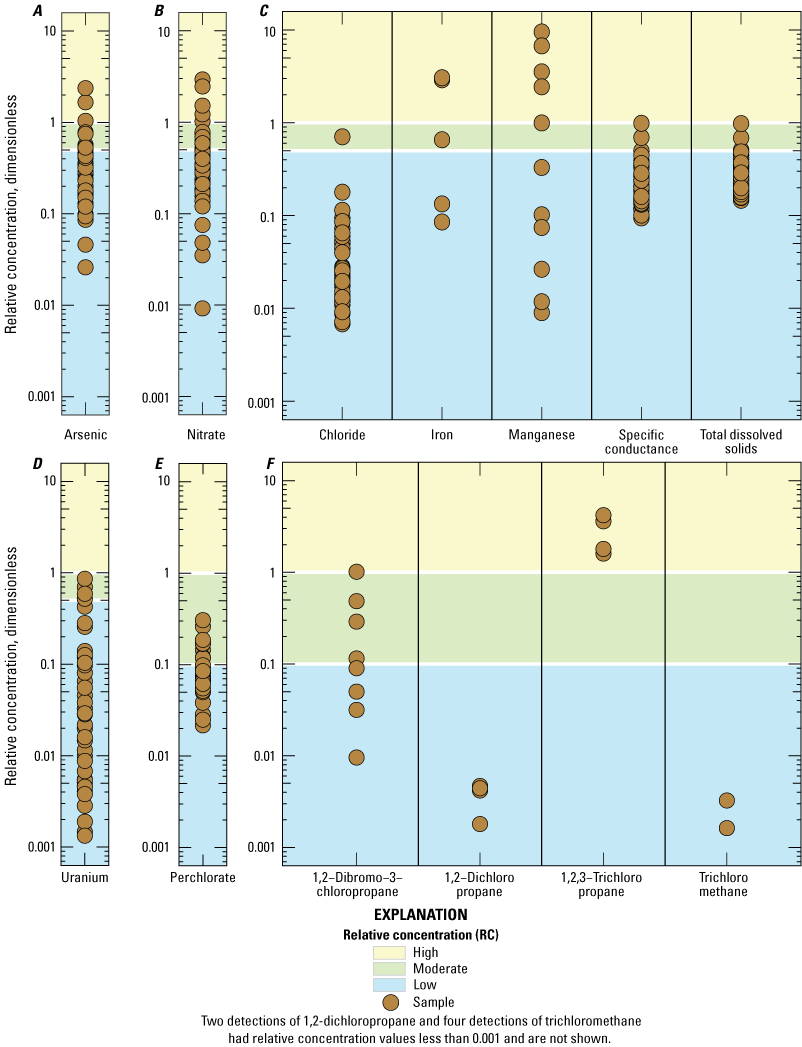
Relative concentrations (RCs) of constituents or constituent classes having moderate or high RCs in samples from U.S. Geological Survey-grid sites (Balkan and others, 2021), Northern San Joaquin Valley domestic-supply aquifer study unit, 2019, California Groundwater Ambient Monitoring and Assessment Priority Basin Project (U.S. Geological Survey, 2022a): A, arsenic; B, nitrate; C, inorganic constituents (with aesthetic-based benchmarks); D, uranium; E, perchlorate; and F, volatile organic compounds.
Inorganic constituents were grouped according to their respective benchmarks to further evaluate their occurrences. As a group, inorganic constituents with health-based benchmarks (arsenic, nitrate, and uranium) were represented by high, moderate, and low RCs in 20, 29, and 51 percent of grid sites in the domestic-supply aquifer system, respectively (table 4). Inorganic constituents having aesthetic-based benchmarks (chloride, iron, manganese, specific conductance, and TDS) had high, moderate, and low RCs in 13, 7, and 80 percent, respectively, of grid sites in the domestic-supply aquifer system. Individual proportions for each of the constituents in these groups are presented in table 5. Arsenic and nitrate were the only constituents with health-based benchmarks detected at high RCs (table 5). Iron and manganese were the only constituents with aesthetic-based benchmarks detected at high RCs (table 5; fig. 8C).
Table 4.
Summary of aquifer-scale proportions for the domestic-supply status assessment for inorganic, organic, and special-interest constituent classes with health-based or aesthetic-based benchmarks (Balkan and others, 2021), Northern San Joaquin Valley domestic-supply aquifer study unit, 2019, California Groundwater Ambient Monitoring and Assessment Priority Basin Project (U.S. Geological Survey, 2022a).[Relative-concentration categories: high, concentration of at least one constituent in group greater than water-quality benchmark; moderate, concentration of at least one constituent in group greater than 0.5 (for inorganics) or 0.1 (for organics) of benchmark and no constituents in group with concentration greater than benchmark; low, concentrations of all constituents in group are less than or equal to 0.5 (for inorganics) or 0.1 (for organics) of benchmark. For the inorganic constituents, non-detections are classified as low. For the organic constituents, low only includes detections relative to the detection limits in Balkan and others (2021). All values greater than 10 percent are rounded to the nearest 1 percent, values less than 10 percent are rounded to the nearest 0.1 percent; rounding of values may result in proportions for a class not adding up to 100 percent]
Table 5.
Grid-based aquifer-scale proportions for constituents that met criteria for additional evaluation in the status assessment, Northern San Joaquin Valley domestic-supply aquifer study unit, 2019, California Groundwater Ambient Monitoring and Assessment Priority Basin Project (U.S. Geological Survey, 2022a).[Grid-based aquifer-scale proportions for organic constituents are based on samples collected by the U.S. Geological Survey from 45 grid sites during July to September 2019. Relative-concentration categories: high; concentrations greater than benchmark; moderate, concentrations less than benchmark and greater than or equal to 0.1 (for organic constituents) or 0.5 (for inorganic constituents) of benchmark; low, concentrations less than 0.1 (for organic constituents) or 0.5 (for inorganic constituents) of benchmark. All values greater than 10 percent are rounded to the nearest 1 percent, values less than 10 percent are rounded to the nearest 0.1 percent; rounding of values may result in proportions for a class not adding up to 100 percent. Abbreviation: na, not applicable]
Organic, Special-Interest, and Microbial-Indicator Constituents
Organic constituents assessed in this study are generally categorized as volatile organic compounds (VOCs) and pesticides. VOCs are characterized by a tendency to evaporate and are often detected in products like paints, solvents, fuels, refrigerants, and fumigants (Zogorski and others, 2006); there are numerous sources of VOCs to the environment. VOCs can become entrained in water recharging the aquifer, where they become isolated from the atmosphere, allowing them to remain entrained in groundwater longer than VOCs in surface water (Zogorski and others, 2006). Pesticides are used to control weeds, fungi, or insects in agricultural and urban settings and, like VOCs, have numerous sources in the environment (Gilliom and others, 2006). Fumigants are a special type of VOC used for pest control and have been historically applied to crops in the San Joaquin Valley (Burow and others, 2019). In this report, fumigants were included in the VOC subclass of organic constituents (table 4).
Special-interest constituents evaluated in the NSJV-DAA included perchlorate and PFAS. Perchlorate is discussed with the anthropogenically derived organic constituents but is not included when summarizing organic constituents as a class. PFAS are a large group of human-made chemicals used in many industrial applications and as a component in a large variety of consumer products and have been included in GAMA-PBP sampling efforts since 2019 because these chemicals are resistant to degradation and are persistent in the environment and human body (Kent, 2021). The EPA launched a program in 2006 to phase out the use and emission of PFOA, PFOS, and other PFAS substances in the United States (U.S. Environmental Protection Agency, 2006).
One or more organic constituents (VOCs or pesticides) were detected in 14 of the 45 grid sites sampled in the NSJV-DAA study unit. Of the 167 organic constituents analyzed, 15 were detected in at least 1 grid site in the NSJV-DAA study unit (tables 2, 3). Of these 15 constituents, 10 have regulatory health-based benchmarks (tables 2, 3). As a group, organic constituents presented high, moderate, and low RCs in the NSJV-DAA system in 8.9, 6.7, and 15 percent, respectively (table 4). Four VOCs were included in the status assessment. Trichloromethane (chloroform) and 1,2-dichloropropane (1,2-DCP) were selected based on prevalence (both detected in greater than 10 percent of samples), whereas 1,2-dibromo-3-chloropropane (DBCP) and 1,2,3-trichloropropane (1,2,3-TCP) were selected based on prevalence and their moderate and high RCs (table 5; fig. 8). Three of the four VOCs (DBCP, 1,2-DCP, and 1,2,3-TCP) have been used as soil fumigants to control pests in the San Joaquin Valley, whereas chloroform is a disinfection by-product commonly present in groundwater after shock chlorination of wells (Zogorski and others, 2006).
Perchlorate had low and moderate RCs in 58 and 20 percent of NSJV-DAA grid sites, respectively (table 5; fig. 8E). Nine PFAS chemicals were detected in five sites in the NSJV-DAA (Balkan and others, 2021). Of the five sites with at least one PFAS constituent, four had multiple PFAS constituent detections, ranging from three to seven detections per site. Four of the nine PFAS constituents detected, PFBS, PFHxS, PFOA, and PFOS, had health-based benchmarks defined by the California SWRCB-DDW and concentrations were below the notification levels defined for each of 500, 3, 5.1 and 6.5 ng/L, respectively (fig. 7). None of the PFAS constituents were detected in greater than 10 percent of NSJV-DAA sites.
Microbial indicators (total coliform bacteria and Enterococci) were present in 18 and 2.2 percent of the domestic-supply aquifer system in the Northern San Joaquin Valley, respectively (table 5). Escherichia coli (E. coli) was not detected in any groundwater sample. Total coliform bacteria are a common bacterium that are prevalent in soils and surface waters. They are generally harmless to humans while Enterococci and E. coli bacteria are indicators of potential fecal contamination because they are found in human and animal wastes (California State Water Resources Control Board, 2019).
Comparative Assessment
A comparative assessment was made to contrast the status of groundwater resources used for domestic and public drinking-water supply in the Northern San Joaquin Valley. Assessment results are divided into three parts: (1) a well-construction comparison evaluating depth differences between domestic- and public-supply wells evaluated in the comparative assessment, (2) a water-quality comparison contrasting aquifer-scale proportions for status assessment constituents, and (3) a discussion of factors affecting the vertical and lateral variability of constituents of primary concern across the two aquifer systems.
Well-Construction Comparison
Well-construction information for domestic- and public-supply wells used in the comparative assessment was quantitatively evaluated. The median (and interquartile range) for depth-to-top of perforations for domestic- and public-supply wells was 64 (45–77) m and 58 (42–70) m, respectively. Although the median depth to perforations was slightly deeper for domestic- compared to public-supply wells, there was not a significant difference between the two (Wilcoxon rank-sum test, probability value [p-value] equal to 0.090; fig. 9A). The median (and interquartile range) for depth to bottom of perforations for domestic- and public-supply wells was 79 (56–91) m and 91 (65–134) m, respectively. Public-supply wells had a significantly deeper median depth to bottom of perforations compared to domestic-supply wells (Wilcoxon rank-sum test, p-value equal to 0.002; fig. 9B). The median (and interquartile range) length of open (screened) intervals for domestic- and public-supply wells was 12 (6–18) m and 26 (12–63) m, respectively. Public-supply wells had significantly longer open intervals compared to domestic-supply wells (Wilcoxon rank-sum test, p-value less than 0.001; fig. 9C).
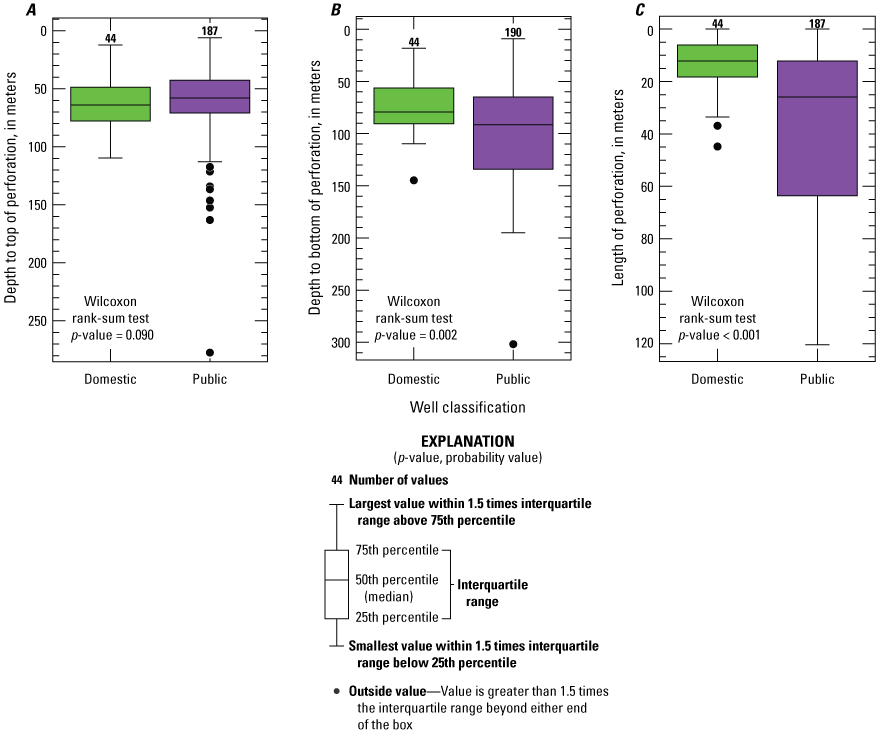
Comparisons of well-construction data for wells from grid sites sampled for the Northern San Joaquin Valley domestic-supply aquifer study unit (green; Balkan and others, 2021) and public-supply wells used in the comparative assessment (purple; Levy and Borkovich, 2022). A, depth to top of perforation; B, depth to bottom of perforation; and C, length of perforation.
Comparison of well-construction information for domestic- and public-supply wells in the Northern San Joaquin Valley indicates that although both types of wells tend to have perforations beginning in the upper, shallower parts of regional aquifers (around 60 m), domestic-well screens tend to be much shorter and represent smaller parts of shallow aquifers than public-supply wells that commonly extend from shallow to deeper aquifer zones exceeding 120-m depths. Therefore, water from domestic-supply wells represents groundwater quality in discrete zones within shallow aquifers, and water from public-supply wells integrates water quality for broader vertical aquifer zones overlapping with those more commonly tapped for domestic supply. The relation between the depth intervals throughout which domestic and public-wells are screened may mean that although both types of wells may be affected by surficially sourced contaminants (such as nitrate and fumigants) in shallow aquifer zones, the concentrations in public-supply wells may be lower due to dilution from deeper groundwater accessed by the longer screened intervals of the wells. Conversely, the longer screened intervals may increase the vulnerability of public-supply wells to geogenic contaminants commonly associated with older groundwater or geochemical conditions more prevalent in deeper parts of the aquifer system.
Water-Quality Comparison
This section compares the quality of groundwater used for domestic and public drinking-water supply in the Northern San Joaquin Valley study unit by aquifer-scale proportions of respective resource areas. Although the NSJV-DAA status assessment presented grid-based aquifer proportions using data collected by the GAMA-PBP in 90 percent of the gridded area, the public-supply water-quality results used for comparison are based on spatially weighted aquifer proportions calculated using contemporaneous regulatory compliance monitoring data from the SWRCB-DDW covering 48 to 82 percent of the gridded area. Most of the constituents identified for inclusion in the status assessment using the SCWRCB-DDW data covered 60 percent or more of the gridded area, with boron having the least coverage with only 48 percent while nitrate had the most with 82 percent. The spatially weighted method minimizes any spatial bias resulting from the clustering of public-supply wells in largely urban areas and allows intercomparison between the two datasets (Belitz and others, 2010). Because of the gridded area coverage disparity between some constituents, it is worth noting that differences in proportions could be the result of a lack of public-supply well data in some areas. However, the constituents with high RCs were those with greater coverage in the public-supply well dataset (all had 60–82 percent coverage) and are assumed to be generally relatable to the proportions calculated from the domestic well grid-based dataset.
Spatially weighted calculations of aquifer-scale proportions characterizing the quality of groundwater resources used for public drinking-water supply are provided by class and individual constituents in tables 6 and 7, respectively, and results of the quantitative comparison among high RC proportions are provided in table 8. Comparative assessment results indicated inorganic and organic constituents with health-based benchmarks were present at high RCs in 13 and 6.2 percent of the public-supply aquifer system in the Northern San Joaquin Valley, respectively (table 6). Inorganic constituents with aesthetic-based benchmarks were present at high RCs in 22 percent of the public-supply aquifer system in the Northern San Joaquin Valley. Like the NSJV-DAA, nitrate and arsenic were the most prevalent inorganic constituents with health-based benchmarks present at moderate RCs (14 percent for both) and high RCs (12 and 2.3 percent, respectively) in the public-supply aquifer system (table 8). The high RC proportion of nitrate was significantly higher in the domestic-supply aquifer system (11 percent) compared to that of the public supply (2.3 percent; fig. 10A; table 8). Although the high RC proportion of arsenic was slightly greater in the public-supply (12 percent) compared to the domestic-supply aquifer system (8.9 percent), the difference was not statistically or substantially different (fig. 10B; table 8).
Table 6.
Summary of spatially weighted aquifer-scale proportions for the public-supply status assessment for inorganic, organic, and special-interest constituent classes with health-based and aesthetic-based benchmarks, Northern San Joaquin Valley domestic-supply aquifer study unit, 2019, California Groundwater Ambient Monitoring and Assessment Priority Basin Project (U.S. Geological Survey, 2022a).[Spatially weighted aquifer-scale proportions for the public-supply status assessment are based on untreated groundwater quality samples from public-supply wells within the boundary of the domestic grid network in the 3 years leading up to the Northern San Joaquin Valley Domestic-Supply Aquifer study unit (from September 25, 2016, to September 25, 2019; California State Water Resources Control Board, 2021d). Relative-concentration categories: high, concentration of at least one constituent in group greater than water-quality benchmark; moderate, concentration of at least one constituent in group greater than 0.5 (for inorganics) or 0.1 (for organics) of benchmark and no constituents in group with concentration greater than benchmark; low, concentrations of all constituents in group are less than or equal to 0.5 (for inorganics) or 0.1 (for organics) of benchmark. All values greater than 10 percent are rounded to the nearest 1 percent, values less than 10 percent are rounded to the nearest 0.1 percent; rounding of values may result in proportions for a class not adding up to 100 percent]
Table 7.
Aquifer-scale proportions for inorganic, organic, and special-interest constituents calculated using the spatially weighted method for public-supply wells, Northern San Joaquin Valley domestic-supply aquifer study unit, 2019, California Groundwater Ambient Monitoring and Assessment Priority Basin Project (U.S. Geological Survey, 2022a).[Spatially weighted aquifer-scale proportions for the public-supply status assessment are based on untreated groundwater-quality samples from public-supply wells within the boundary of the domestic grid network in the 3 years leading up to the Northern San Joaquin Valley Domestic-Supply Aquifer study unit (from September 25, 2016, to September 25, 2019; California State Water Resources Control Board, 2021d). Relative-concentration categories: high, concentrations greater than benchmark; moderate, concentrations less than benchmark and greater than or equal to 0.1 (for organic constituents) or 0.5 (for inorganic constituents) of benchmark; low, concentrations less than 0.1 (for organic constituents) or 0.5 (for inorganic constituents) of benchmark. All values greater than 10 percent are rounded to the nearest 1 percent, values less than 10 percent are rounded to the nearest 0.1 percent; rounding of values may result in proportions for a class not adding up to 100 percent]
Table 8.
Aquifer-scale proportions for inorganic, organic, and special-interest constituents calculated using the spatially weighted method for public-supply wells compared to those calculated using the grid-based method for domestic supply wells, Northern San Joaquin Valley domestic-supply aquifer study unit, 2019, California Groundwater Ambient Monitoring and Assessment Priority Basin Project (U.S. Geological Survey, 2022a).[Spatially weighted aquifer-scale proportions for the public-supply status assessment are based on untreated groundwater-quality samples from public-supply wells within the boundary of the domestic grid network in the 3 years leading up to the Northern San Joaquin Valley Domestic-Supply Aquifer study unit (from September 25, 2016, to September 25, 2019; California State Water Resources Control Board, 2021d). Explanation: How to read results for significant differences. “Dom > Pub” for nitrate means the following: The domestic-supply assessment has a greater high aquifer-scale proportion for nitrate than the public-supply assessment. Relative-concentration (RC) categories: high; concentrations greater than benchmark; moderate, concentrations less than benchmark and greater than or equal to 0.1 (for organic constituents) or 0.5 (for inorganic constituents) of benchmark; low, concentrations less than 0.1 (for organic constituents) or 0.5 (for inorganic constituents) of benchmark. Confidence intervals are given as lower and upper limits. Spatially weighted high-aquifer scale proportions for the public-supply assessment are compared to 90% confidence intervals for the grid-based domestic-supply assessment in order to quantify differences in the resources; if the public aquifer-scale proportion falls within the confidence interval for the domestic aquifer-scale proportion, there is no significant difference between the high aquifer scale proportions of a given constituent between the two resources. Alternately, if the public aquifer-scale proportion is higher or lower than the domestic aquifer-scale proportion, there is a significant difference between the high aquifer-scale proportion for a given constituent between the two resources. All values greater than 10 percent are rounded to the nearest 1 percent, and values less than 10 percent are rounded to the nearest 0.1 percent; rounding of values may result in proportions for a class not adding up to 100 percent Abbreviations: %, percent; CI, confidence interval; >, greater than; NS, not significant (public- and domestic-supply high-aquifer scale proportions are not significantly different); Dom, domestic-supply assessment; Pub, public-supply assessment; VOCs, volatile organic compounds]
The sum of aquifer scale proportions may not sum to 100 percent because the proportion of non-detections is not presented.
Based on Jeffreys interval for the binomial distribution, for non-zero proportions, the confidence interval is calculated as a two-sided interval, and for zero, a one-sided interval is computed (Brown and others, 2001; Belitz and others, 2010).
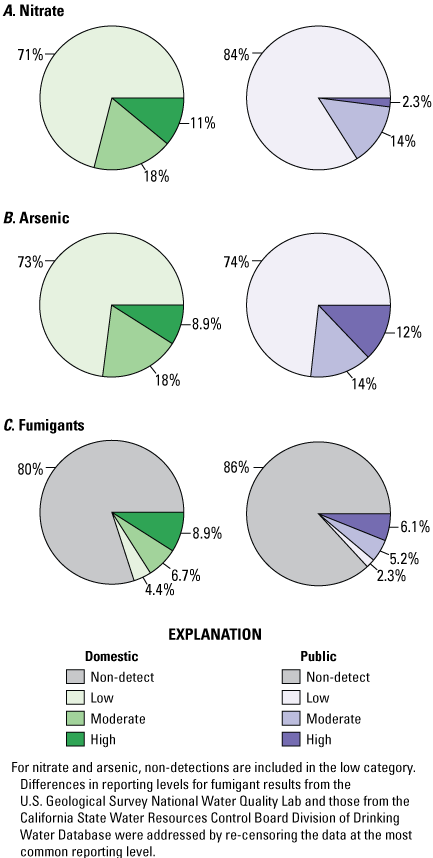
Aquifer-scale proportions of nitrate, arsenic, and fumigants for groundwater resources used for domestic (green) and public (purple) supply in the Northern San Joaquin Valley domestic-supply aquifer study unit, 2019, California Groundwater Ambient Monitoring and Assessment Priority Basin Project (U.S. Geological Survey, 2022a). Abbreviation: %, percent.
Additional inorganic constituents with health-based benchmarks only detected at low RCs in the NSJV-DAA (aluminum, barium, boron, fluoride, lead, selenium, and vanadium) were detected at either moderate or high RCs in small proportions of the public-supply aquifer system (0.1–3.1 percent) but had high RC proportions that were not significantly different from those of the domestic assessment (confidence intervals from 0 to 4.2 percent; tables 7, 8). Insufficient uranium data were available in the SWRCB-DDW database to calculate spatially weighted aquifer-scale proportions (only 17 of 50 cells had uranium data). Gross-alpha particle radioactivity was available, however the MCL-CA for gross-alpha particle radioactivity applies to the adjusted gross-alpha particle activity (measured gross-alpha radioactivity minus uranium activity). Given the limited amount of uranium data in the SWCRB-DDW database spatially weighted aquifer proportions for adjusted gross-alpha particle activity weren’t calculated.
The same five inorganic constituents with aesthetic-based SMCL benchmarks (chloride, iron, manganese, specific conductance, and TDS) selected for evaluation in the NSJV-DAA status assessment were also detected at either moderate or high RC in the public-supply assessment (tables 7, 8). Constituents used to characterize groundwater salinity (chloride, specific conductance, TDS) were present at similar levels between the two resources and did not have significantly different high RC proportions (table 8). Although iron and manganese also did not have significantly different high RC proportions between the two resources, moderate RC proportions were about double for both constituents for the public compared to domestic-supply aquifer system (table 8).
In addition to the organic constituents selected for evaluation in the NSJV-DAA, some additional VOCs were detected at moderate or high RCs in the public-supply aquifer system, including 1,1-dichloroethene (1,1-DCE), 1,2-dibromoethane (EDB), cis-1,2-dichloroethylene (cis-1,2-DCE), tetrachloroethene (PCE), and trichloroethene (TCE; table 2). However, differences in high RC proportions between domestic- and public-supply aquifer systems were not significant for any organic constituent (table 8). The special interest constituent perchlorate was only detected at moderate RCs in 0.3 percent of public-supply aquifers. When the NSJV-DAA perchlorate data were re-censored to SWRCB-DDW reporting levels (4 µg/L), perchlorate was not detected in the domestic-supply aquifer system, and domestic- and public-supply systems had 0-percent high RC proportions (table 8).
Collectively, fumigants (DBCP, EDB, 1,2-DCP, 1,2,3-TCP) were the most prevalent class of organic constituent present at moderate or high RC in domestic- and public-supply aquifer systems (tables 5, 7). Although moderate and high RC proportions of fumigants were slightly greater in domestic-supply (6.7 and 8.9 percent, respectively) compared to public-supply (5.2 and 6.1 percent, respectively) aquifer systems (fig. 10C), these differences were not significant (table 8). In addition, the spatially weighted detection frequency (combination of low, moderate, and high RC) of fumigants also was greater in the domestic-supply (20 percent) compared to the public-supply (13 percent) aquifer system (fig. 10C). Differences in high RC proportions among the domestic and public-supply resources were not significant for any individual fumigant or as a group (table 8).
Spatial Variability of Groundwater Quality in Domestic- and Public-Supply Aquifers
The vertical and lateral variability of groundwater quality in domestic- and public-supply aquifer systems was assessed for constituents with MCL benchmarks that were most prevalent in Northern San Joaquin Valley (nitrate, fumigants, and arsenic). This section presents graphical analyses detailing the spatial distribution of these constituents of concern and discusses key factors controlling their occurrence in domestic- and public-supply aquifer systems.
Differences in vertical and lateral zonation of groundwater quality are illustrated by two-dimensional hydrogeochemical cross sections established along a 60-kilometer (km) transect (from A to A’) through an area encompassing most of the public-supply wells extending north from Ripon/Manteca, through Stockton, to Lodi (fig. 11). Domestic- and public-supply wells within a 7.5-km radius (the approximate width of one grid cell) of the transect were projected onto two-dimensional cross sections. The transect covers most of the domestic- and public-supply wells that have elevated concentrations of constituents of concern within the Northern San Joaquin Valley, which are most prevalent in the western part of the study unit (fig. 12). Only wells with available construction data and corresponding water-quality data were plotted on hydrogeochemical cross sections.
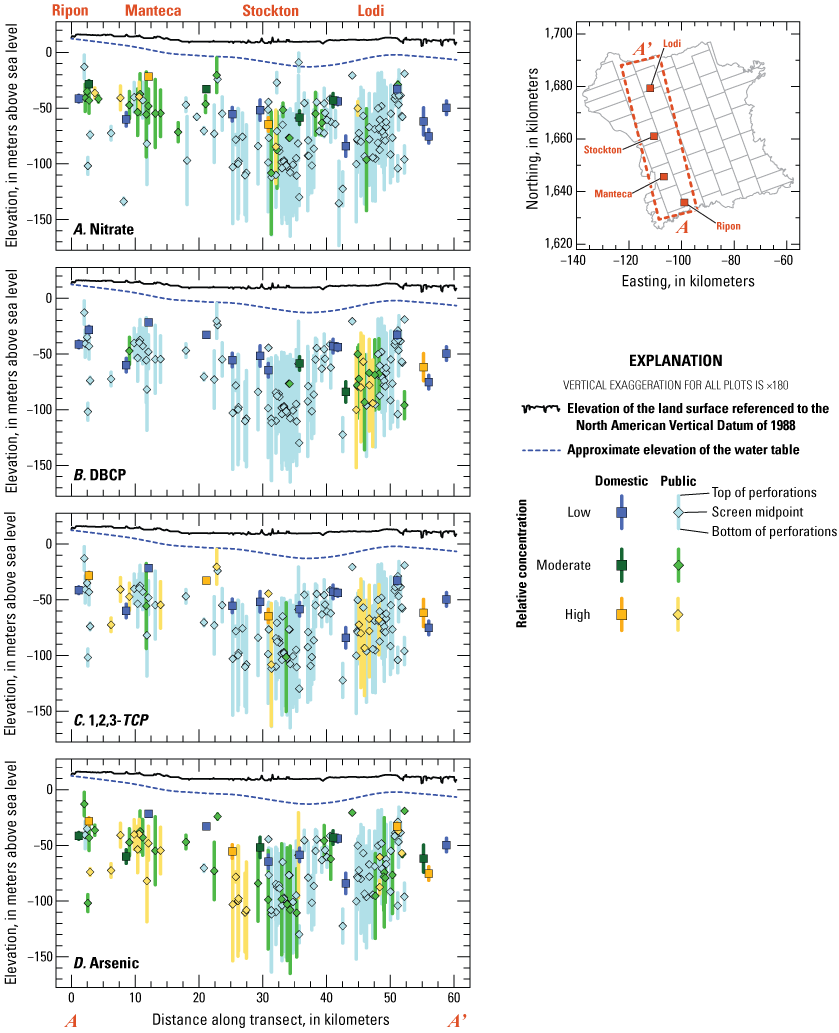
Perforation intervals for domestic- and public-supply wells within a 7.5-kilometer radius of the transect from A to A’ (colored by relative concentration classification low, moderate, or high) for constituents of concern: A, nitrate; B, 1,2-dibromo-3-chloropropane (DBCP); C, 1,2,3-trichloropropane (1,2,3-TCP); and D, arsenic. Land-surface and approximate water-table elevations from Levy (2021) and U.S. Geological Survey (2022b), respectively. Note: All non-detections are considered “low” for ease of graphical representation.
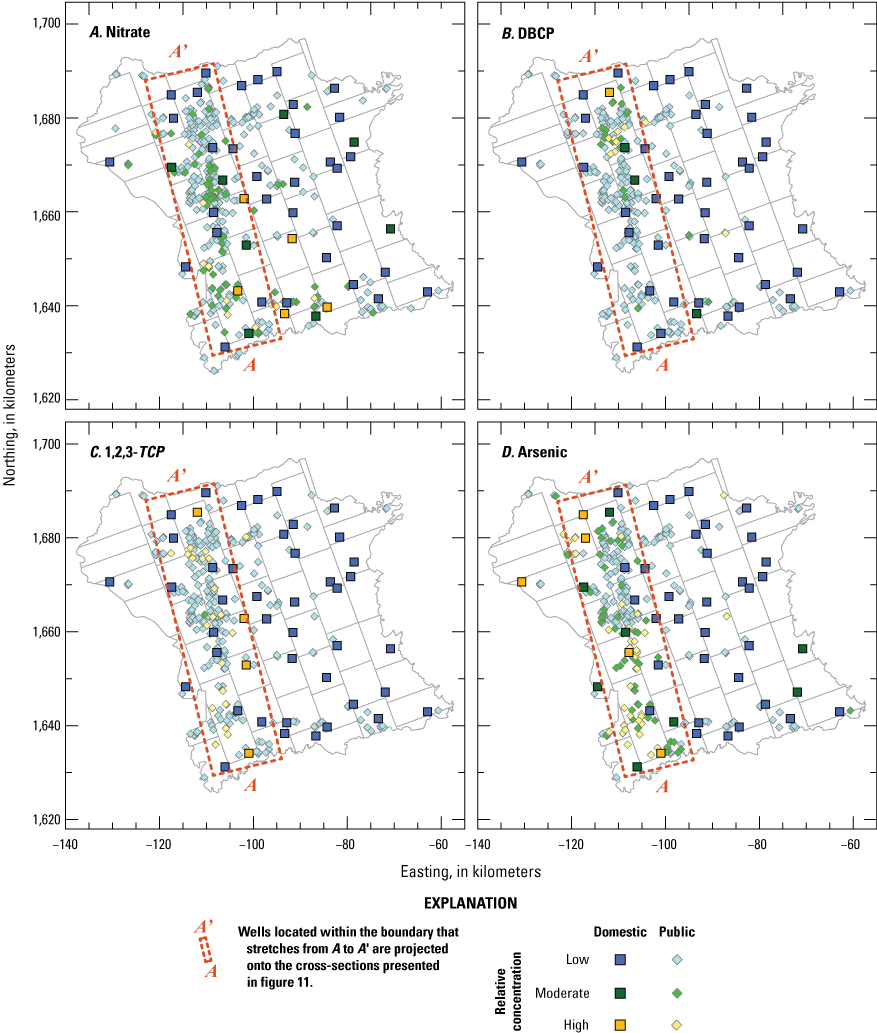
Northern San Joaquin Valley domestic-supply aquifer assessment study-unit grid showing the location of domestic- and public-supply wells used in the comparative assessment colored by relative concentration (low, moderate, or high) for constituents of concern: A, nitrate; B, 1,2-dibromo-3-chloropropane (DBCP); C, 1,2,3-trichloropropane (1,2,3-TCP); and D, arsenic. Note: All non-detections are considered “low” for ease of graphical representation. (Domestic and public-supply well data sources are Balkan and others, 2021 and the California State Water Resources Control Board, 2021d, respectively).
Nitrate
Nitrate is a nutrient that is naturally present in groundwater at concentrations of less than 1 milligram of nitrate as nitrogen per liter (mg-N/L) and is typically detected at elevated concentrations greater than 5 mg-N/L in groundwater affected by agricultural runoff or wastewater sources (Puckett and others, 2011). Nitrate has an MCL of 10 mg-N/L and can cause adverse health effects in infants and adults at high concentrations (Puckett and others, 2011). In the San Joaquin Valley, shallow groundwater tends to have high nitrate concentrations because of decades of fertilizer loading from intensive agricultural development. High nitrate concentrations detected in shallow parts of regional aquifers generally decrease with depth, representing a transition to older, predevelopment groundwater (Burow and others, 2007). However, decades of intensive groundwater pumpage has caused shallow, high-nitrate groundwater to migrate deeper into the aquifer system; to depths more commonly tapped for public drinking-water supply (Levy and others, 2021a).
Domestic wells with high RC values for nitrate were primarily in agricultural areas to the southeast of Stockton and Manteca (figs. 4, 12A). Domestic wells with moderate and low RC values were more distributed throughout the study unit (figs. 4, 12A). Public-supply wells with high and moderate RC values for nitrate were predominantly in urbanized areas in the western part of the study unit—though this is likely because of the spatial bias of public-supply wells to urban areas of high population density (figs. 4, 12A). Although elevated nitrate concentrations (greater than 5 mg-N/L) occur broadly through the study unit across a range of different land-use types, high RC values were most commonly associated with shallow, domestic wells in areas of predominantly agricultural land use (figs. 4, 12A).
Wells with elevated nitrate concentrations tended to have perforation intervals in the upper parts of aquifers across the transect from A to A’ (fig. 11A). Domestic wells with moderate or high RCs were perforated within the upper 80 m of aquifer sediments. Public-supply wells with high RC values tended to have shorter perforation intervals within the upper 80 m of aquifer sediments. Some public-supply wells with moderate and high RC values had longer perforation intervals that extended from this upper (shallower) zone into deeper aquifers and most likely represent a mixture of shallow, high-nitrate and deep, low-nitrate groundwater. Wells perforated below 80 m depths tended to have low RC values for nitrate (fig. 11A).
Fumigants
The primary fumigants of concern detected at elevated concentrations in the study unit were DBCP and 1,2,3-TCP (table 8). These fumigants were historically applied to agricultural crops (particularly vineyards and orchards) in the San Joaquin Valley for pest control, with widespread use beginning in the 1950s and ending when the use of DBCP and 1,2,3-TCP containing fumigant formulations (Telone and DD-mix) were banned in California in 1979 and 1984, respectively (Burow and others, 2019). The SWRCB-DDW established MCLs of 0.2 µg/L and 0.005 µg/L for DBCP and 1,2,3-TCP in 1989 and 2017, respectively (California State Water Resources Control Board, 2016, 2017); DBCP has a half-life of about 6 years in groundwater, and 1,2,3-TCP is thought to persist for longer periods in groundwater systems (Burow and others 1999, 2007, 2019).
Both DBCP and 1,2,3-TCP occurred at elevated concentrations predominantly in the western part of the study unit in domestic and public-supply wells (figs. 12B, 12C). High RC detections for DBCP were restricted to the Lodi area, whereas high RC values for 1,2,3-TCP occurred in urban and agricultural areas along the transect from A to A’ in the western part of the study area (figs. 4, 12C). Domestic wells with high RC values for 1,2,3-TCP occurred in agricultural areas surrounding Ripon/Manteca, Stockton, and Lodi. Public-supply wells with high RC values for 1,2,3-TCP occurred in urban areas along the western part of the study unit (figs. 12B, 12C). Occurrences of DBCP and 1,2,3-TCP in the Lodi area are most likely because of historical applications of fumigants for pest control in local vineyards (figs. 4, 12B, 12C). More widespread occurrence of 1,2,3-TCP throughout agricultural and urban areas within the study unit could be linked to historical agricultural applications or industrial sources in urban settings (Burow and others, 2019). More widespread occurrence of elevated 1,2,3-TCP compared to DBCP also is most likely linked to its comparative persistence in groundwater systems and much lower reporting level and MCL (Burow and others, 2019; Balkan and others, 2021).
The occurrence of elevated DBCP concentrations across the transect from A to A’ was localized to the Lodi area (between 40- and 50-km distances along the transect; fig. 11B). Unlike nitrate, wells with moderate and high RC values for DBCP occurred in wells screened in upper and lower aquifer zones above and below 80-m depths and in longer-screened public-supply wells spanning the two zones (fig. 11B). 1,2,3-TCP tended to occur at high RCs in domestic wells screened within the top 80 m of aquifer sediments in agricultural areas on the eastern extent of the transect from A to A’ and public-supply wells in urban parts of the transect spanning from shallow to deep aquifer zones (figs. 11C, 12C). Because 1,2,3-TCP can be detected at such low concentrations, it is likely a more sensitive indicator of small amounts of shallow, modern groundwater in long-screened wells than other constituents such as nitrate that may be attenuated by mixing with larger proportions of older, deeper groundwater (Burow and others, 2019).
Arsenic
Arsenic is a trace element that is typically detected at elevated concentrations greater than its MCL of 10 µg/L in anoxic groundwater with high pH, typically occurring in the San Joaquin Valley at deeper depths and in proximity to the valley’s axial trough (Haugen and others, 2021). Elevated concentrations of arsenic were almost entirely in the westernmost part of the study area (fig. 11), with increasing proximity to the Delta (fig. 2) for domestic- and public-supply wells (fig. 12D). The well with the highest arsenic concentrations (50.5 µg/L) sampled by the GAMA-PBP was an “understanding” site (not incorporated in status assessment results) sampled on an island in the Delta (fig. 4). Prior studies in the region reported the highest arsenic concentrations occurred in a narrow band along the western part of the study unit (Izbicki and others, 2008).
Elevated concentrations of arsenic were measured in shallow, domestic wells and deeper public-supply wells along the transect from A to A’ but were more commonly associated with the deeper public-supply wells (fig. 11). Elevated arsenic concentrations were most often measured in wells where nitrate and fumigants were low, especially in the south Stockton area (between 25- and 35-km distances on the transect). Localized areas of lower arsenic in public-supply wells in this area tended to have higher nitrate, indicating the redox characteristics of the aquifer are influencing the occurrence of arsenic and nitrate (Izbicki and others, 2008; McMahon and Chapelle, 2008; Anning and others, 2012). Aquifer redox characteristics are likely being affected by the migration of shallow oxic groundwater into the deeper aquifer system, as hypothesized by Haugen and others (2021). However, elevated arsenic co-occurred with elevated concentrations of nitrate and fumigants in shallow groundwater in the Ripon/Manteca area, indicating this area might be a dynamic mixing zone between agriculturally affected recharge and arsenic-bearing groundwater that is geochemically conducive to the mobility of all three contaminants (fig. 11). Arsenic can be mobilized in suboxic or oxic groundwater mixtures at elevated pH levels greater than 7.6 (Izbicki and others, 2008).
Summary
Groundwater quality in the about 3,100 square-kilometer Northern San Joaquin Valley region of California was studied in cooperation with the California State Water Resources Control Board (SWRCB) as part of the Groundwater Ambient Monitoring Assessment Priority Basin Project (GAMA-PBP). A spatially unbiased assessment of aquifer systems used for domestic drinking-water supply in the study region was completed, and results were compared to similar results collected for public drinking-water supply. Assessments characterized the quality of native groundwater to evaluate ambient conditions in regional aquifers and not the quality of treated drinking water. The study included two components: (1) a status assessment presenting study results summarizing the status of groundwater quality used for domestic supply in the Northern San Joaquin Valley and (2) a comparative assessment of groundwater resources used for domestic and public drinking-water supply in the study region. The comparative assessment directly compared the quality of the two used resources by aquifer area and assessed the vertical and lateral distribution of constituents of primary concern (nitrate, fumigants, and arsenic) across the two overlapping aquifer systems.
The status assessment was based on data collected by the GAMA-PBP from 45 sites in the Northern San Joaquin Valley domestic-supply aquifer assessment study unit during 2019. Measured concentrations of water-quality constituents in ambient groundwater were compared to regulatory and non-regulatory benchmarks used by the State of California and Federal agencies as health-based or aesthetic standards for public drinking water to contextualize results. A grid-based method to estimate aquifer-scale proportions of groundwater resources with concentrations approaching or exceeding benchmark thresholds was used in the status assessment. This method provides spatially unbiased results that allow for inter-comparability among similar groundwater-resource assessments. A spatially weighted method was used to calculate aquifer-scale proportions for public-supply wells within the domestic assessment grid network using regulatory compliance monitoring data from 438 public-supply wells with data for at least 1 water-quality constituent measured within 3 years of the domestic assessment. Differences among aquifer-scale proportions for constituents exceeding regulatory and non-regulatory benchmarks in domestic- and public-supply aquifers were quantitatively evaluated by comparing spatially weighted calculations of aquifer-scale proportions exceeding benchmark standards to grid-based confidence intervals. Factors influencing the vertical and lateral distribution of nitrate, fumigants, and arsenic across overlapping aquifer systems used for domestic and public drinking-water supply were also discussed.
Status assessment results indicated that inorganic and organic constituents with health-based benchmarks were present at high relative concentration (RC), meaning they exceeded a benchmark threshold, in 20 and 8.9 percent of the domestic-supply aquifer system in the Northern San Joaquin Valley, respectively. Inorganic constituents with health-based benchmarks present at high RCs included nitrate and arsenic, which were present at high RCs in 11 and 8.9 percent of domestic groundwater resources, respectively. The only organic constituents with health-based benchmarks present at high RCs were the fumigants 1,2-dibromo-3-chloropropane (DBCP) and 1,2,3-trichloropropane (1,2,3-TCP), which were present at high RCs in 2.2 and 8.9 percent of domestic groundwater resources, respectively. Inorganic constituents with aesthetic-based benchmarks were present at high RCs in 13 percent of the domestic-supply aquifer system in the Northern San Joaquin Valley and included iron and manganese, which were present at high RCs in 4.4 and 11 percent of domestic groundwater resources, respectively. Microbial indicators (total coliform bacteria and Enterococci) were present in 18 and 2.2 percent of domestic groundwater resources, respectively.
Inorganic and organic constituents with health-based benchmarks were present at high RCs in 13 and 6.2 percent of the public-supply aquifer system in the Northern San Joaquin Valley, respectively. Inorganic constituents with aesthetic-based benchmarks were present at high RCs in 22 percent of the public-supply aquifer system in the Northern San Joaquin Valley. The most prevalent constituents with health-based benchmarks contributing to high RC proportions in the public-supply aquifer system were arsenic and fumigants (including DBCP and 1,2,3-TCP), which were present at high RCs in 12 and 6.1 percent of public-supply groundwater resource, respectively. The comparative assessment reported no significant differences among high RC proportions for individual water-quality constituents except for nitrate, which was greater in domestic-supply aquifer systems compared to public-supply aquifer systems in the Northern San Joaquin Valley.
Analysis of construction data for wells included in the comparative assessment indicated that, although depth to top of perforations are comparable for domestic- and public-supply wells in the Northern San Joaquin Valley (median depth about 60 meters [m]), public-supply wells have longer perforation intervals than domestic wells (median lengths of 26 and 12 m, respectively) and are finished at deeper depths (median depth to perforations of 91 and 79 m, respectively). Overall, domestic wells typically draw exclusively from the shallower-aquifer system in the upper 80 m of unconsolidated sediments, whereas public-supply wells draw a mixture of water, tapping shallow-aquifer zones and deeper parts of the aquifer system extending to depths exceeding 120 m.
Analysis of the vertical and lateral distribution of constituents of interest (nitrate, fumigants, and arsenic) across domestic- and public-supply aquifers reported that nitrate is prevalent in shallow aquifers throughout the Northern San Joaquin Valley, particularly in areas with agricultural land use, but is potentially diluted by mixing with deeper water sources at public-supply wells. Fumigants were prevalent in areas of urban and agricultural land use in the western part of the Northern San Joaquin Valley, particularly in the Lodi area where vineyards are common, but 1,2,3-TCP was more widespread than DBCP and was detected in shallow and deeper parts of aquifer system. The prevalence of 1,2,3-TCP at high RCs is potentially because of its recalcitrance in groundwater and ability to be detected at low concentrations. Arsenic was most prevalent in the western part of the Northern San Joaquin Valley with proximity to deltaic sediments and was detected at high RCs in wells tapping shallow and deep parts of the aquifer system. Arsenic tended to be lower at wells with elevated nitrate and fumigant concentrations, potentially because of the attenuative effects of shallow, oxic groundwater mixing with anoxic groundwater in deeper parts of the aquifer system.
References Cited
Anning, D.W., Paul, A.P., McKinney, T.S., Huntington, J.M., Bexfield, L.M., and Thiros, S.A., 2012, Predicted nitrate and arsenic concentrations in basin-fill aquifers of the southwestern United States: U.S. Geological Survey Scientific Investigations Report 2012–5065, 78 p., accessed June 10, 2022, at https://doi.org/10.3133/sir20125065.
Balkan, M., Levy, Z.F., Shelton, J.L., Johnson, T.D., and Watson, E., 2021, Groundwater-quality data in the Northern San Joaquin Valley Domestic-Supply Aquifer Study Unit, 2019—Results from the California GAMA Priority Basin Project: U.S. Geological Survey data release, accessed June 10, 2022, at https://doi.org/10.5066/P9Q083IB.
Belitz, K., Dubrovsky, N.M., Burow, K., Jurgens, B.C., and Johnson, T., 2003, Framework for a ground-water quality monitoring and assessment program for California: U.S. Geological Survey Water-Resources Investigations Report 2003–4166, 78 p., accessed June 10, 2022, at https://doi.org/10.3133/wri034166.
Belitz, K., Fram, M.S., and Johnson, T.D., 2015, Metrics for assessing the quality of groundwater used for public supply, CA, USA—Equivalent-population and area: Environmental Science & Technology, v. 49, no. 14, p. 8330–8338. [Available at https://doi.org/10.1021/acs.est.5b00265.]
Belitz, K., Jurgens, B., Landon, M.K., Fram, M.S., and Johnson, T., 2010, Estimation of aquifer scale proportion using equal area grids—Assessment of regional scale groundwater quality: Water Resources Research, v. 46, no. 11. [Available at https://doi.org/10.1029/2010WR009321.]
Bennett, G.L.V., Fram, M.S., Belitz, K., and Jurgens, B.C., 2010, Status and understanding of groundwater quality in the northern San Joaquin Basin, 2005—California GAMA Priority Basin Project: U.S. Geological Survey Scientific Investigations Report 2010–5175, 82 p., accessed June 10, 2022, at https://doi.org/10.3133/sir20105175.
Bennett, G.L.V., 2018, Status and understanding of groundwater quality in the North San Francisco Bay Shallow Aquifer study unit, 2012—California GAMA Priority Basin Project (ver. 1.1, February 2018): U.S. Geological Survey Scientific Investigations Report 2017–5051, 74 p., accessed June 10, 2022, at https://doi.org/10.3133/sir20175051.
Brown, L.D., Cai, T.T., and DasGupta, A., 2001, Interval estimation for a binomial proportion: Statistical Science, v. 16, no. 2, p. 101–133. [Available at https://doi.org/10.1214/ss/1009213286.]
Burow, K.R., Dubrovsky, N.M., and Shelton, J.L., 2007, Temporal trends in concentrations of DBCP and nitrate in groundwater in the eastern San Joaquin Valley, California, USA: Hydrogeology Journal, v. 15, p. 991–1007. [Available at https://doi.org/10.1007/s10040-006-0148-7.]
Burow, K.R., Floyd, W.D., and Landon, M.K., 2019, Factors affecting 1,2,3-trichloropropane contamination in groundwater in California: Science of the Total Environment, v. 672, p. 324–334. [Available at https://doi.org/10.1016/j.scitotenv.2019.03.420.]
Burow, K.R., Panshin, S.Y., Dubrovsky, N.H., Vanbrocklin, D., and Fogg, G.E., 1999, Evaluation of processes affecting 1,2-dibromo-3-chloropropane (DBCP) concentrations in ground water in the eastern San Joaquin Valley, California—Analysis of chemical data and ground-water flow and transport simulations: U.S. Geological Survey Water-Resources Investigations Report 99–4059, 57 p., accessed June 10, 2022, at https://doi.org/10.3133/wri994059.
Burow, K.R., Shelton, J.L., Hevesi, J.A., and Weissmann, G.S., 2004, Hydrogeologic characterization of the Modesto area, San Joaquin Valley, California: U.S. Geological Survey Scientific Investigations Report 2004–5232, 54 p., accessed June 10, 2022, at https://doi.org/10.3133/sir20045232.
Burton, C.A., and Wright, M.T., 2018, Status and understanding of groundwater quality in the Monterey-Salinas Shallow Aquifer study unit, 2012–13—California GAMA Priority Basin Project (ver. 1.1, September 2018): U.S. Geological Survey Scientific Investigations Report 2018–5057, 116 p., accessed June 10, 2022, at https://doi.org/10.3133/sir20185057.
California Department of Water Resources, 2016, California's groundwater: California Department of Water Resources Bulletin 118, accessed December 2021 at https://water.ca.gov/Programs/Groundwater-Management/Bulletin-118.
California Department of Water Resources, 2018, 5-022.01 San Joaquin Valley–Eastern San Joaquin Basin boundary description: California Department of Water Resources 2018 Basin Descriptions, 5 p., accessed June 10, 2022, at https://cadwr.app.box.com/s/rhqaflj4t5d063he9o314ojzz394idec?page=2.
California Department of Water Resources, 2022a, California’s groundwater live—Well infrastructure, accessed April 4, 2023, at https://sgma.water.ca.gov/CalGWLive/.
California Department of Water Resources, 2022b, SGMA Data viewer—Groundwater levels: California Department of Water Resources website, accessed January 2022 at https://sgma.water.ca.gov/webgis/?appid=SGMADataViewer#gwlevels.
California State Water Resources Control Board, 2003, A comprehensive groundwater quality monitoring program for California: California State Water Resources Control Board, Assembly Bill 599 Report to the Governor and Legislature, March 2003, 100 p., accessed June 10, 2022, at https://www.waterboards.ca.gov/publications_forms/publications/legislative/docs/2003/ab599.pdf.
California State Water Resources Control Board, 2016, Groundwater information sheet—Dibromochloropropane (DBCP): California State Water Resources Control Board Division of Water Quality GAMA Program, 7 p., accessed June 10, 2022, at https://www.waterboards.ca.gov/water_issues/programs/gama/docs/coc_dbcb_infosheet_jz0610.pdf.
California State Water Resources Control Board, 2017, Groundwater information sheet—1,2,3-Trichloropropane (TCP): California State Water Resources Control Board Division of Water Quality GAMA Program, 8 p., accessed June 10, 2022, at https://www.waterboards.ca.gov/gama/docs/coc_tcp123.pdf.
California State Water Resources Control Board, 2019, Groundwater information sheet—Bacteria indicators: California State Water Resources Control Board, Division of Water Quality, GAMA Program, 7 p., accessed April 4, 2023, at https://www.waterboards.ca.gov/gama/docs/coc_bacteria_indicators.pdf.
California State Water Resources Control Board, 2021a, Human right to water portal: California State Water Resources Control Board website, accessed December 2021 at https://www.waterboards.ca.gov/water_issues/programs/hr2w/.
California State Water Resources Control Board, 2021b, Perchlorate in drinking water: California State Water Resources Control Board website, accessed December 2021 at https://www.waterboards.ca.gov/drinking_water/certlic/drinkingwater/Perchlorate.html.
California State Water Resources Control Board, 2021c, GAMA groundwater information system: California State Water Resources Control Board, Groundwater Ambient Monitoring and Assessment Program, accessed December 2021 at https://gamagroundwater.waterboards.ca.gov/gama/gamamap/public/Default.asp.
California State Water Resources Control Board, 2021d, EDT library and water quality analyses data and download page: California State Water Resources Control Board website, accessed December 2021 at https://www.waterboards.ca.gov/drinking_water/certlic/drinkingwater/EDTlibrary.html.
California State Water Resources Control Board, 2022a, Domestic water quality and monitoring regulations: California Code of Regulations—Title 22, Division 4, Chapter 15, Article 4, §64431, Chapter 15, Article 5.5 §64444, Chapter 15, Article 3 §64421–64427, and Chapter 15.5, Article 2, §64533, accessed December 30, 2022, at http://ccr.oal.ca.gov/.
California State Water Resources Control Board, 2022b, Drinking water notification levels and response levels—An overview: California State Water Resources Control Board Division of Drinking Water, 18 p., accessed June 10, 2022, at https://www.waterboards.ca.gov/drinking_water/certlic/drinkingwater/documents/notificationlevels/notification_response_level_overview_2022_11_01.pdf .
California State Water Resources Control Board, 2023, California Safe Drinking Water Act: Chapter 4 of Part 12 (Drinking Water) of Division 104 (Environmental Health) of California H&S Code (Section 116270 et seq.) and Articles 1 and 2 of Group 4, of Subchapter 1 of Chapter 5 (Sanitation) of Division 1 (Department of Health Services) of Title 17 and Chapters 1 through 19 of Division 4 (Environmental Health) of Title 22 of the California Code of Regulations, accessed April 5, 2023, at http://ccr.oal.ca.gov/.
Carle, D., 2015, Introduction to water in California (2d ed.): Berkeley, Calif., University of California Press, 352 p. [Available at https://doi.org/10.1525/9780520962897.]
Delusina, I., Starratt, S.W., and Verosub, K.L., 2022, Environmental evolution of peat in the Sacramento–San Joaquin Delta (California) during the Middle and Late Holocene as deduced from pollen, diatoms and magnetism: Quaternary International, v. 621, p. 50–61. [Available at https://doi.org/10.1016/j.quaint.2020.05.012.]
Falcone, J.A., 2015, U.S. conterminous wall-to-wall anthropogenic land use trends (NWALT), 1974–2012: U.S. Geological Survey Data Series 948, 33 p. plus appendixes 3–6 as separate files, accessed June 10, 2022, at https://doi.org/10.3133/ds948.
Faunt, C.C., ed., 2009, Groundwater availability of the Central Valley Aquifer, California: U.S. Geological Survey Professional Paper 1766, 225 p., accessed June 10, 2022, at https://pubs.usgs.gov/pp/1766/.
Fram, M.S., and Belitz, K., 2012, Status and understanding of groundwater quality in the Tahoe-Martis, Central Sierra, and Southern Sierra study units, 2006–2007—California GAMA Priority Basin Project: U.S. Geological Survey Scientific Investigations Report 2011–5216, 222 p., accessed June 10, 2022, at https://doi.org/10.3133/sir20115216.
Fram, M.S., and Belitz, K., 2014, Status and understanding of groundwater quality in the Sierra Nevada Regional study unit, 2008—California GAMA Priority Basin Project: U.S. Geological Survey Scientific Investigations Report 2014–5174, 118 p., accessed June 10, 2022, at https://doi.org/10.3133/sir20145174.
Gilliom, R.J., Barbash, J.E., Crawford, C.G., Hamilton, P.A., Martin, J.D., Nakagaki, N., Nowell, L.H., Scott, J.C., Stackelberg, P.E., Thelin, G.P., and Wolock, D.M., 2006, The quality of our Nation’s waters—Pesticides in the Nation’s streams and ground water, 1992–2001: U.S. Geological Survey Circular 1291, 184 p. [Available at https://doi.org/10.3133/cir1291.]
Haugen, E.A., Jurgens, B.J., Arroyo-Lopez, J.A., and Bennett, G.L., 2021, Groundwater development leads to decreasing arsenic concentrations in the San Joaquin Valley, California: Science of the Total Environment, v. 771, p. 145223. [Available at https://doi.org/10.1016/j.scitotenv.2021.145223.]
Helsel, D.R., Hirsch, R.M., Ryberg, K.R., Archfield, S.A., and Gilroy, E.J., 2020, Statistical methods in water resources: U.S. Geological Survey Techniques and Methods, book 4, chap. A3, 458 p. (Supersedes U.S. Geological Survey Techniques of Water-Resources Investigations, book 4, chap. A3, version 1.1). [Available at https://doi.org/10.3133/tm4A3.]
Hem, J.D., 1985, Study and interpretation of the chemical characteristics of natural water (3d ed.): U.S. Geological Survey Water Supply Paper 2254, 263 p., accessed June 10, 2022, at https://doi.org/10.3133/wsp2254.
Izbicki, J.A., Stamos, C.L., Metzger, L.F., Halford, K.J., Kulp, T.R., and Bennett, G.L., 2008, Source, distribution, and management of arsenic in water from wells, Eastern San Joaquin Ground-Water subbasin, California: U.S. Geological Survey Open-File Report 2008–1272, 8 p., accessed June 10, 2022, at https://doi.org/10.3133/ofr20081272.
Johnson, T.D., and Belitz, K., 2015, Identifying the location and population served by domestic wells in California: Journal of Hydrology—Regional Studies, v. 3, p. 31–86. [Available at https://doi.org/10.1016/j.ejrh.2014.09.002.]
Jurgens, B.C., Jasper, M., Nguyen, D.H., and Bennett, G.L., 2018, USGS CA GAMA-PBP groundwater-quality results—Assessment and trends: U.S. Geological Survey web page, accessed June 10, 2022, at https://doi.org/10.5066/P91WJ2G1.
Kent, R.H., 2021, Sampling for per- and polyfluoroalkyl substances (PFAS) by the Groundwater Ambient Monitoring and Assessment Priority Basin Project: U.S. Geological Survey Fact Sheet 2021–3028, 4 p., accessed June 10, 2022, at https://doi.org/10.3133/fs20213028.
Land IQ, 2017, Land use-2014-land IQ [ds2677]: Land IQ dataset prepared for the California Department of Water Resources, accessed June 1, 2022, at https://map.dfg.ca.gov/metadata/ds2677.html.
Levy, Z.F., 2021, Grid cells and modeled groundwater levels to characterize hydrologic conditions for public-supply aquifers in California's Central Valley, 1990–2020: U.S. Geological Survey data release, accessed June 10, 2022, at https://doi.org/10.5066/P9JBZXVY.
Levy, Z.F., and Borkovich, J.G., 2022, Compilation of public-supply well construction depths in California: U.S. Geological Survey data release, accessed December 13, 2022, at https://doi.org/10.5066/P90OHVIC.
Levy, Z.F., and Fram, M.S., 2021, Status and understanding of groundwater quality in the northern Sierra Nevada foothills domestic-supply aquifer study units, 2015–17—California GAMA Priority Basin Project: U.S. Geological Survey Scientific Investigations Report 2021–5019, 120 p., accessed June 10, 2022, at https://doi.org/10.3133/sir20215019.
Levy, Z.F., Balkan, M., and Shelton, J.L., 2021a, Quality of groundwater used for domestic supply in the northern San Joaquin Valley, California: U.S. Geological Survey Fact Sheet 2021–3040, 4 p., accessed June 10, 2022, at https://doi.org/10.3133/fs20213040.
Levy, Z.F., Jurgens, B.C., Burow, K.R., Voss, S.A., Faulkner, K.E., Arroyo-Lopez, J.A., and Fram, M.F., 2021b, Critical aquifer overdraft accelerates degradation of groundwater quality in California’s Central Valley during drought: Geophysical Research Letters, v. 48, no. 17. [Available at https://doi.org/10.1029/2021GL094398.]
McMahon, P.B., and Chapelle, F.H., 2008, Redox processes and water quality of selected principal aquifer systems: Groundwater, v. 46, no. 2, p. 259–271, accessed December 28, 2010, at https://doi.org/10.1111/j.1745-6584.2007.00385.x.
Norman, J.E., Toccalino, P.L., and Morman, S.A., 2018, Health-based screening levels for evaluating water-quality data (2d ed.): U.S. Geological Survey web page, accessed June 10, 2022, at https://doi.org/10.5066/F71C1TWP.
O’Leary, D., Izbicki, J.A., and Metzger, L.F., 2015, Sources of high-chloride water and managed aquifer recharge in an alluvial aquifer in California, USA: Hydrogeology Journal, v. 23, p. 1515–1533. [Available at https://doi.org/10.1007/s10040-015-1277-7.]
Pierri, D., 2021, Actual decay of tetrachloroethene (PCE) and trichloroethene (TCE) in a highly contaminated shallow groundwater system: Environmental Advances, v. 5, no. 100090. [Available at https://doi.org/10.1016/j.envadv.2021.100090.]
Phillips, S.P., Green, C.T., Burow, K.R., Shelton, J.L., and Rewis, D.L., 2007, Simulation of multiscale ground-water flow in part of the northeastern San Joaquin Valley, California: U.S. Geological Survey Scientific Investigations Report 2007–5009, 43 p., accessed June 10, 2022, at https://doi.org/10.3133/sir20075009.
Piper, A.M., Gale, H.S., Thomas, H.E., and Robinson, T.W., 1939, Geology and Ground-Water Hydrology of the Mokelumne area, California: U.S. Geological Survey Water Supply Paper 780, 230 p., 8 pls., accessed June 10, 2022, at https://pubs.er.usgs.gov/publication/wsp780.
PRISM Climate Group, 2021, PRISM climate data: Oregon State University, accessed December 26, 2021, at https://prism.oregonstate.edu/.
Puckett, L.J., Tesoriero, A.J., and Dubrovsky, N.M., 2011, Nitrogen contamination of surficial aquifers—A growing legacy: Environmental Science and Technology, v. 45, no. 3, p. 839–844, accessed June 10, 2022, at https://doi.org/10.1021/es1038358.
R Core Team, 2021, R: A language and environment for statistical computing: Vienna, Austria, R Foundation for Statistical Computing, accessed June 10, 2022, at https://www.R-project.org/.
Rowe, B.L., Toccalino, P.L., Moran, M.J., Zogorski, J.S., and Price, C.V., 2007, Occurrence and potential human-health relevance of volatile organic compounds in drinking water from domestic wells in the United States: Environmental Health Perspectives, v. 115, no. 11, p. 1539–1546, accessed June 10, 2022, at https://doi.org/10.1289/ehp.10253.
Saucedo, G.J., Bedford, D.R., Raines, G.L., Miller, R.J., Wentworth, C.M., Jennings, C.W., Strand, R.G., and Rogers, T.H., 2000, GIS data for the geologic map of California: Sacramento, Calif., California Division of Mines and Geology, CD 2000-007, accessed March 10, 2023, at https://ngmdb.usgs.gov/Prodesc/proddesc_43655.htm.
State of California, 1995, California Legislative Information, Section 116275 of the California Safe Drinking Water Act: State of California, accessed December 2021 at https://leginfo.legislature.ca.gov/faces/codes_displayText.xhtml?lawCode=HSC&division=104.&title=&part=12.&chapter=4.&article=1.
State of California, 1999, Item 3940-001-0001—State Water Resources Control Board in Supplemental report of the 1999 Budget Act 1999–00 Fiscal Year: State Water Resources Control Board, accessed December 2021, at https://lao.ca.gov/1999/99-00_supp_rpt_lang.pdf.
State of California, 2001a, California Legislative Information, Assembly Bill No. 599, chapter 522: State of California, accessed December 2021, at https://leginfo.legislature.ca.gov/faces/billTextClient.xhtml?bill_id=200120020AB599.
State of California, 2001b, Part 2.76, sections 10780–10782.3 in Groundwater Monitoring Act of 2001: California Water Code, California Legislative Information, accessed December 2021 at https://leginfo.legislature.ca.gov/faces/billTextClient.xhtml?bill_id=200120020AB599&search_keywords=Groundwater+Monitoring.
Toccalino, P.L., and Hopple, J.A., 2010, The quality of our Nation’s waters—Quality of water from public-supply wells in the United States, 1993–2007—Overview of major findings: U.S. Geological Survey Circular 1346, 58 p., accessed June 10, 2022, at https://doi.org/10.3133/cir1346.
Toccalino, P.L., and Norman, J.E., 2006, Health-based screening levels to evaluate U.S. Geological Survey ground water quality data: Risk Analysis, v. 26, no. 5, p. 1339–1348, accessed June 10, 2022, at https://doi.org/10.1111/j.1539-6924.2006.00805.x.
Toccalino, P.L., Norman, J.E., Phillips, R.H., Kauffman, L.J., Stackelberg, P.E., Nowell, L.H., Krietzman, S.J., and Post, G.B., 2004, Application of health-based screening levels to ground-water quality data in a state-scale pilot effort: U.S. Geological Survey Scientific Investigations Report 2004–5174, 64 p., accessed June 10, 2022, at https://doi.org/10.3133/sir20045174.
U.S. Environmental Protection Agency, 2006, Assessing and managing chemicals under TSCA—Fact sheet 2010/2015 PFOA stewardship program: U.S. Environmental Protection Agency website, accessed June 10, 2022, at https://www.epa.gov/assessing-and-managing-chemicals-under-tsca/fact-sheet-20102015-pfoa-stewardship-program.
U.S. Environmental Protection Agency, 2014, Revised total coliform rule and total coliform rule: U.S. Environmental Protection Agency website, accessed January 2022 at https://www.epa.gov/dwreginfo/revised-total-coliform-rule-and-total-coliform-rule.
U.S. Environmental Protection Agency, 2018, 2018 Edition of the drinking water standards and health advisories tables: Washington, D.C., U.S. Environmental Protection Agency, 20 p., accessed June 10, 2022, at https://nepis.epa.gov/Exe/ZyPDF.cgi/P100U7U8.PDF?Dockey=P100U7U8.PDF.
U.S. Environmental Protection Agency, 2021, Human health benchmarks for pesticides: U.S. Environmental Protection Agency website, accessed December 2021 at https://iaspub.epa.gov/apex/pesticides/f?p=HHBP:home.
U.S. Geological Survey, 2021, National water information system—Web interface: U.S. Geological Survey website, accessed December 2021 at https://doi.org/10.5066/F7P55KJN.
U.S. Geological Survey, 2022a, Groundwater ambient monitoring & assessment program priority basin project—GAMA-PBP: U.S. Geological Survey website, accessed March 10, 2022, at https://ca.water.usgs.gov/gama/.
U.S. Geological Survey, 2022b, The National Elevation Dataset (NED): U.S. Geological Survey database website, accessed March 10, 2022, at https://www.usgs.gov/publications/national-elevation-dataset.
Warner, K.L., and Ayotte, J.D., 2015, The quality of our Nation’s waters—Water quality in the glacial aquifer system, northern United States, 1993–2009: U.S. Geological Survey Circular 1352, 116 p., accessed June 10, 2022, at https://doi.org/10.3133/cir1352.
Weissmann, G.S., Bennett, G.L., and Lansdale, A.L., 2005, Factors controlling sequence development on Quaternary fluvial fans, San Joaquin Basin, California, USA, in Harvey, A.M., Mather, A.E., and Stokes, M., eds., Alluvial Fans—Geomorphology, Sedimentology, Dynamics: Geological Society of London, Special Publications, v. 251, p. 169–186. [Available at https://doi.org/10.1144/GSL.SP.2005.251.01.12.]
Weissmann, G.S., Mount, J.F., and Fogg, G.E., 2002, Glacially driven cycles in accumulation space and sequence stratigraphy of a stream-dominated alluvial fan, San Joaquin Valley, California, USA: Journal of Sedimentary Research, v. 72, no. 2, p. 240–251. [Available at https://doi.org/10.1306/062201720240.]
Zogorski, J.S., Carter, J.M., Ivahnenko, T., Lapham, W.W., Moran, M.J., Rowe, B.L., Squillace, P.J., and Toccalino, P.L., 2006, Volatile organic compounds in the Nation’s ground water and drinking-water supply wells: U.S. Geological Survey Circular 1292, 101 p., accessed June 10, 2022, at https://doi.org/10.3133/cir1292.
Conversion Factors
International System of Units to U.S. customary units
Temperature in degrees Celsius (°C) may be converted to degrees Fahrenheit (°F) as follows:
°F = (1.8 × °C) + 32.
Temperature in degrees Fahrenheit (°F) may be converted to degrees Celsius (°C) as follows:
°C = (°F − 32) / 1.8.
Datum
Vertical coordinate information is referenced to the North American Vertical Datum of 1988 (NAVD 88).
Horizontal coordinate information is referenced to the North American Datum of 1983 (NAD 83).
Elevation, as used in this report, refers to distance above the vertical datum.
Supplemental Information
Specific conductance is given in microsiemens per centimeter at 25 degrees Celsius (µS/cm at 25 °C).
Concentrations of chemical constituents in water are given in milligrams per liter (mg/L), micrograms per liter (µg/L), or nanograms per liter (ng/L).
Concentrations of nitrate are given in milligrams of nitrate as nitrogen per liter (mg-N/L)
Concentrations of sulfur hexafluoride are given in femtograms per kilogram (fg/kg).
Activities for radioactive constituents in water are given in picocuries per liter (pCi/L).
Results for measurements of stable isotopes of an element (with symbol E) in water, solids, and dissolved constituents commonly are expressed as the relative difference in the ratio of the number of the less abundant isotope (iE) to the number of the more abundant isotope of a sample with respect to a measurement standard.
Values of δ2H and δ18O are expressed as the difference in delta-values from the Vienna standard mean ocean water (VSMOW) standard in parts per thousand (per mil).
Values of δ15N are expressed as the difference in delta-values from atmospheric nitrogen gas (N2) in parts per thousand (per mil).
Abbreviations
AL-US
U.S. Environmental Protection Agency action level
CDWR
California Department of Water Resources
cm3STP/gH2O
cubic centimeters of gas at standard temperature and pressure per gram of water
1,2-DCP
1,2-dichloropropane
DAA
domestic-supply aquifer assessment
DBCP
1,2-dibromo-3-chloropropane
EDB
1,2-dibromoethane
EPA
U.S. Environmental Protection Agency
GAMA
Groundwater Ambient Monitoring and Assessment Program
GAMA-PBP
Groundwater Ambient Monitoring and Assessment Program Priority Basin Project
HAL-US
U.S. Environmental Protection Agency lifetime health advisory level
HHBP-US
U.S. Environmental Protection Agency human-health benchmarks for pesticides
MCL-CA
California State Water Resources Control Board Division of Drinking Water maximum contaminant level
MCL-US
U.S. Environmental Protection Agency maximum contaminant level
NL-CA
California State Water Resources Control Board, Division of Drinking Water notification level
NSJV-DAA
Northern San Joaquin Valley domestic-supply aquifer assessment
NSJV-PAA
Northern San Joaquin Valley public drinking-water aquifer assessment
p-value
probability value
PFAS
per- and polyfluoroalkyl substances
PFBS
perfluorobutanesulfonate
PFHxS
perfluorohexanesulfonate
PFOA
perfluorooctanoate
PFOS
perfluorooctanesulfonate
RC
relative concentration
RL-CA
California State Water Resources Control Board, Division of Drinking Water response level
SMCL-CA
California State Water Resources Control Board, Division of Drinking Water secondary maximum contaminant level
SMCL-US
U.S. Environmental Protection Agency secondary maximum contaminant level
SWRCB
California State Water Resources Control Board
SWRCB-DDW
California State Water Resources Control Board, Division of Drinking Water (California Department of Public Health Prior to July 1, 2014)
1,2,3-TCP
1,2,3-trichloropropane
TDS
total dissolved solids
THM
trihalomethane
TT-US
U.S. Environmental Protection Agency treatment technique levels
VOC
volatile organic compound
USGS
U.S. Geological Survey
α
Greek letter alpha representing the level of significance used in statistical tests
For more information concerning the research in this report, contact the
Director, California Water Science Center
U.S. Geological Survey
6000 J Street, Placer Hall
Sacramento, California 95819
https://www.usgs.gov/centers/ca-water/
Publishing support provided by the U.S. Geological Survey
Science Publishing Network, Sacramento Publishing Service Center
Disclaimers
Any use of trade, firm, or product names is for descriptive purposes only and does not imply endorsement by the U.S. Government.
Although this information product, for the most part, is in the public domain, it also may contain copyrighted materials as noted in the text. Permission to reproduce copyrighted items must be secured from the copyright owner.
Suggested Citation
Bennett, G.L., V, Haugen, E.A., and Levy, Z.F., 2023, Comparing domestic and public-supply groundwater quality in the northern San Joaquin Valley, 2019—California GAMA Priority Basin Project: U.S. Geological Survey Scientific Investigations Report 2023–5049, 44 p., https://doi.org/10.3133/sir20235049.
ISSN: 2328-0328 (online)
Study Area
| Publication type | Report |
|---|---|
| Publication Subtype | USGS Numbered Series |
| Title | Comparing domestic and public-supply groundwater quality in the northern San Joaquin Valley, 2019—California GAMA Priority Basin Project |
| Series title | Scientific Investigations Report |
| Series number | 2023-5049 |
| DOI | 10.3133/sir20235049 |
| Publication Date | June 05, 2023 |
| Year Published | 2023 |
| Language | English |
| Publisher | U.S. Geological Survey |
| Publisher location | Reston, VA |
| Contributing office(s) | California Water Science Center |
| Description | Report: x, 44 p.; 2 Data Releases |
| Country | United States |
| State | California |
| Other Geospatial | Northern San Joaquin Valley |
| Online Only (Y/N) | Y |