

Bathymetric and Velocimetric Surveys at Highway Bridges Crossing the Missouri and Mississippi Rivers near St. Louis, Missouri, August 3–10, 2020
Links
- Document: Report (26.5 MB pdf) , HTML , XML
- Data Releases:
- USGS data release - Bathymetry and velocity data from surveys at highway bridges crossing the Missouri and Mississippi Rivers near St. Louis, Missouri, October 2008 through May 2016
- USGS data release - Bathymetry and velocity data from surveys at highway bridges crossing the Missouri River between Kansas City and St. Louis, Missouri, January 2010 through May 2017
- USGS data release - Bathymetry and velocity data from surveys at highway bridges crossing the Missouri and Mississippi Rivers on the periphery of Missouri, December 2008 through August 2018
- USGS data release - Bathymetry and velocity data from surveys at highway bridges crossing the Missouri and Mississippi Rivers near St. Louis, Missouri, August 3–10, 2020
- Version History: Version History (1.19 kB txt)
- NGMDB Index Page: National Geologic Map Database Index Page (html)
- Download citation as: RIS | Dublin Core
Acknowledgments
The author would like to acknowledge Dennis Heckmann (retired), Travis Stump, and Jennifer Harper at the Missouri Department of Transportation for their role in funding and supporting the work of the project detailed in this report.
The author also wishes to gratefully acknowledge Benjamin C. Rivers at the U.S. Geological Survey Central Midwest Water Science Center for his help in collecting and processing the data for this project.
Abstract
Bathymetric and velocimetric data were collected by the U.S. Geological Survey, in cooperation with the Missouri Department of Transportation, near 15 bridges at 10 highway crossings of the Missouri and Mississippi Rivers near Washington, Louisiana, and St. Louis, Missouri, on August 3–10, 2020. A multibeam echosounder mapping system was used to obtain channel-bed elevations for river reaches about 1,640 to 1,970 feet longitudinally and generally extending laterally across the active channel from bank to bank during moderate flood-flow conditions. These surveys provided channel geometry and hydraulic conditions at the time of the surveys and provided characteristics of scour holes that may be useful in developing predictive guidelines or equations for computing potential scour depth. These data also may be useful to the Missouri Department of Transportation as a low to moderate flood-flow assessment of the bridges for stability and integrity issues with respect to bridge scour during floods.
Bathymetric data were collected around every in-channel pier. Scour holes were present at most piers for which bathymetry could be obtained, except those on banks or surrounded by riprap. All the bridge sites in this study were previously surveyed and documented in previous studies, including the two new bridge structures at Louisiana and Washington (structures A8141 and A8504, sites 22 and 32, respectively). Comparisons between bathymetric surfaces from the previous surveys and those of the current (2020) study do not indicate any consistent correlation in channel-bed elevations with streamflow conditions. The comparisons of the 2020 surveys to two previous surveys at the new bridge structure A8141 at Washington (site 22) resulted in net erosion of the channel bed in both comparisons, despite the 2020 streamflow being less than either previous survey. Alternatively, there was a net gain of sediment at new bridge structure A8504 at Louisiana (site 32) between 2014 and 2020, which was the most substantial increase in the surveys detailed in this report; substantially less flow in 2020 than in 2014 or changes to the channel and spur dikes near the bridge may have contributed to the observed sediment gain.
Pier size, nose shape, and skew to approach flow had a substantial effect on the size of the scour hole observed at a given pier. Larger and deeper scour holes were present at piers with wide or blunt noses caused by exposed footings, seal courses, or caissons. When a pier was skewed to primary approach flow, the scour hole was generally deeper and larger than at a similar pier without skew; however, the shape of the scour hole near skewed piers in this study generally was longer and deeper on the leeward side, contrary to the general shape of scour holes for skewed piers. However, this phenomenon has been observed historically at these sites, and likely is exacerbated by debris rafts or other turbulence-inducing features near the atypical scour holes. A substantial scour hole was observed near pier 11 of structure A6500 (site 33), which was deeper than in the 2016 survey. The scour holes observed at pier 17 of structure L0561 (site 25) and piers 3 and 4 of structure A1500 (site 34) also were slightly deeper and wider in 2020 than in 2016. At new bridge structures A8141 at Washington (site 22) and A8504 at Louisiana (site 32), the smaller cross-sectional area and configuration of the piers of the new bridges resulted in substantially less scour than with the wider old piers.
Introduction
Scour in alluvial channels is the removal of channel-bed and bank material by flowing water and is the leading cause of bridge failures in the United States (Arneson and others, 2012). Scour at a bridge site is caused by short- and long-term geomorphic processes and the local effects from elements of the structure in or next to the waterway (Huizinga and Rydlund, 2004; Arneson and others, 2012). Because the effects of scour can be severe and dangerous, bridges and other structures over waterways are routinely assessed and inspected. High-flow conditions attributed to higher velocity and depth from increased streamflow can exacerbate scour processes.
The Missouri Department of Transportation (MoDOT) manages most of the transportation infrastructure within Missouri. A part of their responsibility is fulfilled through periodic inspections of highway structures, including bridges that span waterways. At most of these structures, all or most of the structure can be inspected from land or from personnel lift trucks deployed from the roadway of the structure; however, for structures over primary waterways, such as the Missouri and Mississippi Rivers, inspecting the submerged part of the bridge requires a different approach.
The U.S. Geological Survey (USGS), in cooperation with MoDOT, began assessing scour at selected waterway crossings in Missouri in 1988 (Becker, 1994) and at waterway crossings throughout the State in 1991 (Huizinga and Rydlund, 2004). In 2007, the USGS, in cooperation with MoDOT, began monitoring scour at bridges using single-beam echosounders (Rydlund, 2009) and surveying channel bathymetry using a multibeam echosounder mapping system (MBMS; Huizinga and others, 2010; Huizinga, 2012; also see report references listed in table 1). The MBMS is a useful tool not only in surveying channel bathymetry but also in providing a medium- to high-resolution representation of submerged bridge structural elements. In 2010, the first round of periodic surveys at waterway crossings across the Missouri and Mississippi Rivers throughout Missouri began, beginning with bridges in the Kansas City, Mo., area and followed by bridges in the St. Louis, Mo., area, bridges on the Missouri River between Kansas City and St. Louis, and those on the periphery of Missouri (table 1). During high-flow conditions in June–August 2011, many of the highway bridges and several of the railroad bridges along the length of the Missouri River downstream from Montana were assessed (Densmore and others, 2013; Dietsch and others, 2014), including the 37 highway bridges (at 28 crossings) over the Missouri River in and into Missouri (Huizinga, 2012). These surveys help MoDOT fulfill the need for underwater inspection of bridges over the Missouri and Mississippi Rivers and provide a valuable snapshot in time of the channel bed elevations and velocities in the area near the bridge crossings, which can be used for developing or modifying tools for predicting bridge scour and other geomorphological processes.
Table 1.
Routine periodic surveys of bridges crossing the Missouri and Mississippi Rivers in and into Missouri.| Dates of routine surveys | Report references | Data references | Special notes |
|---|---|---|---|
| March 2010 | Huizinga (2010) | Huizinga (2020b) | Excluded L0734, A7650 not yet built. |
| June 2015 | Huizinga (2016) | Huizinga (2020b) | Excluded K0456/A0450. |
| August 2019 | Huizinga (2022a) | Huizinga (2021) | None. |
| October 2010 | Huizinga (2011) | Huizinga (2017b) | A6500 not yet built. |
| May 2016 | Huizinga (2017a) | Huizinga (2017b) | None. |
| April–May 2013 | Huizinga (2014) | Huizinga (2020c) | None. |
| May 2017 | Huizinga (2020a) | Huizinga (2020c) | Excluded K0969, included A8340 in Kansas City. |
| June 2014 | Huizinga (2015) | Huizinga (2020d) | None. |
| July–August 2018 | Huizinga (2020e) | Huizinga (2020d) | Excluded K0932. |
The study detailed in this report covers the surveys at the highway bridges across the Missouri and Mississippi Rivers in the St. Louis area (fig. 1), and the new bridges over the Missouri River at Washington, Mo., and over the Mississippi River at Louisiana, Mo. (fig. 1), both of which were under construction at the time of the previous surveys in those areas (May 2017 and July–August 2018, respectively; tables 1, 2). Therefore, this study details surveys at 15 bridges at 10 crossings (table 2).
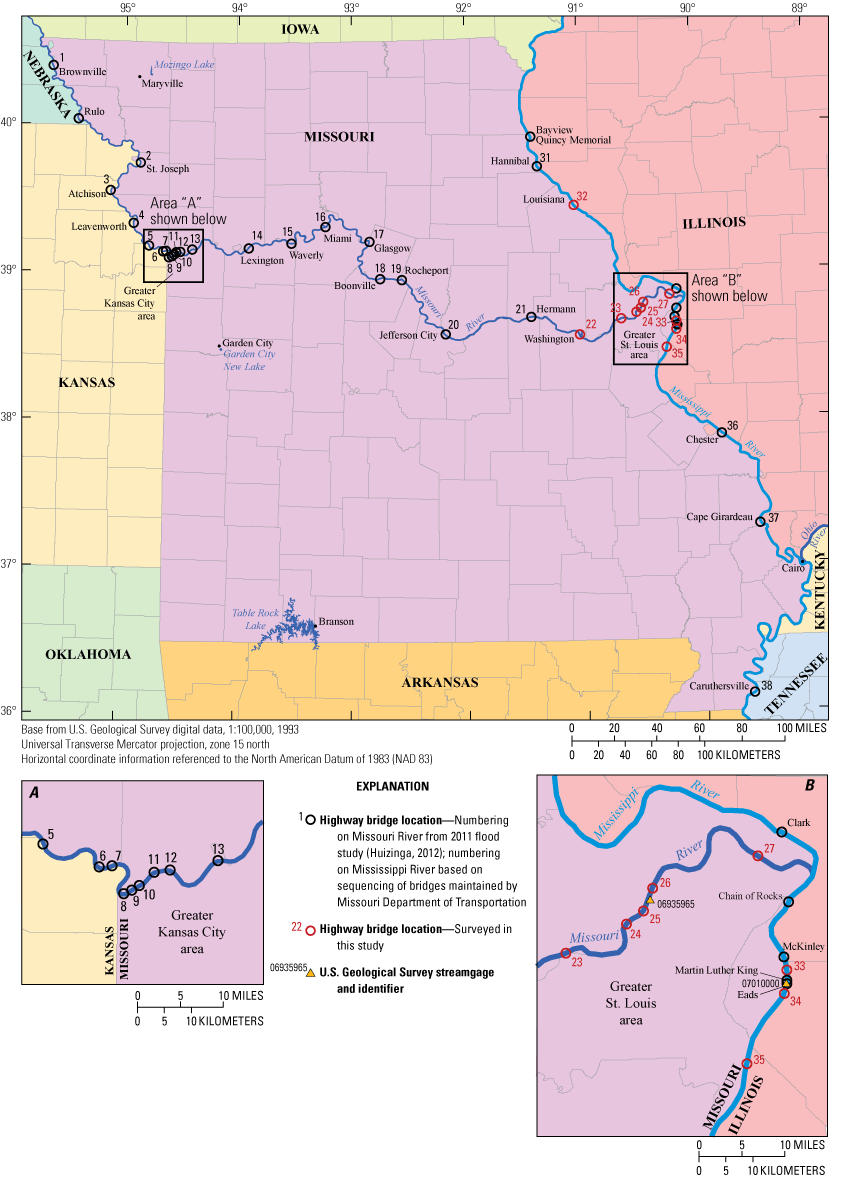
Location of highway bridges crossing the Missouri and Mississippi Rivers in and into Missouri, and bathymetric surveys of the Missouri and Mississippi River channels, August 3–10, 2020.
Table 2.
Highway bridges crossing the Missouri and Mississippi Rivers in and into Missouri surveyed in August 2020.[Bridges are listed in downstream order. MO, Missouri State highway; IS, Interstate highway; E, eastbound; W, westbound; US, U.S. highway; --, not known/applicable; S, southbound; N, northbound]
| Site number (fig. 1) | Structure number | Local name | County, State | Route | River milea | Remarks | Figures |
|---|---|---|---|---|---|---|---|
| 22 | A8141 | Washington | Franklin, Mo. | MO 47 | 67.6 | Replaced K0969 in 2018 | 1, 6–11, 1.1 |
| 23 | A7577 | Daniel Boone | St. Charles, Mo. | IS 64 E | 43.9 | Dual bridge with A4017 | 1, 12–14, 16–19, 1.2 |
| A4017 | St. Louis, Mo. | IS 64 W | Dual bridge with A7577 | 1, 12–13, 15–19, 1.2 | |||
| 24 | A5585 E | Page Avenue | St. Charles, Mo. | MO 364 E | 32.7 | Dual bridge crossing | 1, 20–22, 24–27, 1.3 |
| A5585 W | St. Louis, Mo. | MO 364 W | Dual bridge crossing | 1, 20–21, 23–27, 1.3 | |||
| 25 | A3292 | Blanchette | St. Charles, Mo. | IS 70 E | 29.6 | Dual bridge with L0561 | 1, 28–31, 33–35, 1.4 |
| L0561 | St. Louis, Mo. | IS 70 W | Dual bridge with A3292 | 1, 28–29, 31–35, 1.4 | |||
| 26 | A4557 E | Discovery | St. Charles, Mo. | MO 370 E | 27.0 | Dual bridge crossing | 1, 36–39, 41–43, 1.5 |
| A4557 W | St. Louis, Mo. | MO 370 W | Dual bridge crossing | 1, 36–38, 40–43, 1.5 | |||
| 27 | A3047 | Lewis & Clark | St. Charles, Mo. | US 67 | 8.1 | -- | 1, 44–50, 1.6 |
| 32 | A8504 | Louisiana | Pike, Mo. | US 54 | 283.2 | Replaced K0932 in 2019 | 1, 51–55, 1.7 |
| 33 | A6500 | Stan Musial Veterans Memorial | St. Louis City, Mo. | IS 70 | 181.2 | -- | 1, 5, 56–61, 1.8 |
| 34 | A1500 | Poplar Street | St. Louis City, Mo. | IS 55 | 179.2 | -- | 1, 62–67, 1.9 |
| 35 | A4936 | Jefferson Barracks | St. Louis, Mo. | IS 255 S | 168.8 | Dual bridge with A1850 | 1, 68–70, 72–76, 1.10, 1.11 |
| A1850 | IS 255 N | Dual bridge with A4936 | 1, 68–69, 71–76, 1.10, 1.11 |
River mile on the Missouri is the distance upstream from the confluence of the Missouri River with the Mississippi River at St. Louis, Missouri (fig. 1). River mile on the Mississippi is the distance upstream on the Upper Mississippi River, starting at the confluence with the Ohio River at Cairo, Illinois (fig. 1), at river mile 953.5 of the Lower Mississippi River.
Purpose and Scope
The purpose of this report is to describe the equipment and methods used and to document results of bathymetric and velocimetric surveys completed on August 3–10, 2020, of the Missouri and Mississippi River channels near 15 highway bridges at 10 crossings near St. Louis, Mo. (fig. 1; table 2). The results obtained from the bathymetric and velocimetric surveys of the channels document the channel-bed geometry and velocity distribution at the time of the surveys and provide characteristics of scour holes that may be useful in developing or modifying predictive guidelines or equations for computing potential scour depth. These data also may be used by MoDOT as a low to moderate flood-flow comparison to help assess the bridges for stability and integrity issues with respect to bridge scour. Results are also compared to previous surveys at the sites (Huizinga, 2011, 2012, 2014, 2015, 2017a; Huizinga and others, 2010).
Description of Study Area
The study area for this report primarily is the Missouri and Mississippi Rivers in and around St. Louis, Mo. (fig. 1). In total, 15 bridges at 10 crossings were surveyed within the study area (fig. 1, inset B); however, the study area extends upstream on the Missouri River to Washington, Mo., and upstream on the Mississippi River to Louisiana, Mo. The Missouri River flows west to east from Washington through the St. Louis metropolitan area before joining the Mississippi River north of downtown St. Louis. The Mississippi River flows generally south from Louisiana through the St. Louis metropolitan area. The Missouri and Mississippi Rivers are channelized in and around the St. Louis metropolitan area and other surveyed areas where stone revetment, spur dikes, and L-head dikes are present along the banks to maintain the channel alignment, and levees and floodwalls are present on the upper banks to limit flooding in the industrial, commercial, residential, and agricultural areas on the flood plains. The site numbering sequence used in this report is consistent with previous studies on the Missouri and Mississippi Rivers (Huizinga, 2012, 2015).
Description of Streamflow Conditions
Data from real-time streamgages on the Missouri River at St. Charles, Mo. (USGS station 06935965, hereinafter referred to as “the St. Charles streamgage;” USGS, 2022a; fig. 1), indicated streamflow and stage were receding after a minor flood during surveys on the Missouri River on August 3–6, 2020 (fig. 2A). The minor flood occurred after a period of moderate flows that were preceded by relatively higher spring flows in April through June (fig. 2B). Similarly, data from the streamgage on the Mississippi River at St. Louis, Mo. (USGS station 07010000, hereinafter referred to as “the St. Louis streamgage;” USGS, 2022a; fig. 1), indicated the Mississippi River also was on or between minor flood rises when sites on the Mississippi River were surveyed August 6–10, 2020 (fig. 2A), but occurred immediately after the first major rise after a period of moderate flows (fig. 2B).
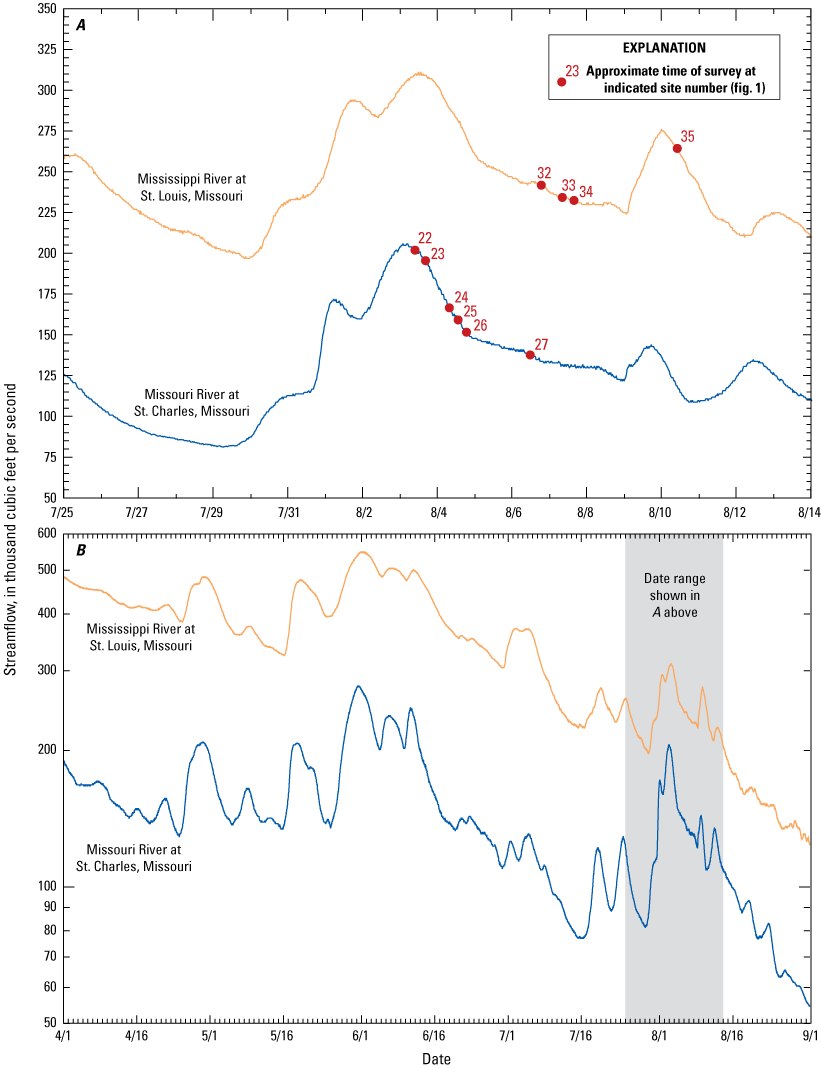
Hourly streamflow from the streamgages on the Missouri River at St. Charles, Missouri (U.S. Geological Survey [USGS] station 06935965), and on the Mississippi River at St. Louis, Missouri (USGS station 07010000; USGS, 2022a). A, July 25–August 14, 2020. B, April 1–September 1, 2020.
Streamflow on the Missouri River measured at the St. Charles streamgage ranged from about 130,000 to 206,000 cubic feet per second (ft3/s) between the first and last survey, which is equivalent to the daily exceedance range of about 8 to 24 percent (the probability that the indicated streamflow value would be equaled or exceeded on any given day; USGS, 2022b) and is less than the 50-percent annual exceedance probability (the probability that the indicated streamflow value would be equaled or exceeded within a period of 1 year; also known as the 2-year recurrence interval) flood discharge of 250,000 ft3/s (U.S. Army Corps of Engineers [USACE], 2003b, plate E–20). Daily exceedance probabilities for the St. Charles streamgage were computed using daily streamflow from 2000 to 2022 (USGS, 2022b). Streamflow on the Mississippi River measured at the St. Louis streamgage ranged from about 224,000 to 311,000 ft3/s during the dates of the surveys, which is equivalent to the daily exceedance probability range of about 18 to 33 percent (USGS, 2022c) and is less than the 50-percent annual exceedance probability (2-year recurrence interval) flood discharge of 450,000 ft3/s (USACE, 2003a, table D–28). Daily exceedance probabilities for the St. Louis streamgage were computed using daily streamflow from 1932 to 2022 (USGS, 2022c).
Streamflow conditions during the dates of each survey were in the low to moderate flood-flow regime. In an analysis of real-time scour monitoring data at Jefferson City, Mo., Huizinga (2014) noted that substantial pier scour generally begins soon after the onset of hydrograph rise (substantial rise of 8 feet [ft] or more), although the scour often does not reach maximum depth until the peak stage is reached or sometime thereafter (see fig. 35 in Huizinga, 2014). Although streamflow conditions did not peak during this study, streamflow peaked several times earlier in the year (fig. 2B), and streamflow was substantially higher than base flow based on the daily exceedance values. Although the scour conditions captured at the sites in this study may not represent the maximum scour potential at the sites, the cumulative information gathered during multiple surveys from 2008 to 2020 at these sites remains useful for determining scour for a variety of flow conditions, particularly when combined with, or compared to, a scour scenario captured at high flood-flow conditions.
Description of Equipment and Basic Processing
The bathymetry of the Missouri or Mississippi River at each of the bridges was determined using a high-resolution MBMS. The various components of the MBMS used for this study are described in previous studies on the Missouri and Mississippi Rivers in Missouri (see report references listed in table 1) and on the Missouri and Yellowstone Rivers in North Dakota (Densmore and others, 2013). MBMS survey methods and data quality checks were similar to these previous studies. A brief description of the equipment follows; a more-complete description of the various system components and methods used in this study are available in previous reports by Huizinga (2010), Huizinga and others (2010), and Densmore and others (2013).
An MBMS is an integration of several individual components: the multibeam echosounder (MBES), a sound-velocity probe, an inertial navigation system (INS), and a data-collection and data-processing computer. The MBES used in this study is the Norbit iWBMSh (fig. 3), operated at a frequency of 400 kilohertz (kHz). The iWBMSh is similar in operation to the MBES systems used in other previous studies in the St. Louis area, except that it has a curved piezoceramic receiver array, which enables bathymetric data to be collected throughout a swath range of 210 degrees. Optimum data usually are collected in a swath of less than 160 degrees (80 degrees on each side of nadir, or straight down below the MBES); nevertheless, the swath can be electronically rotated to either side of nadir, enabling data collection along sloping banks up to a depth just below the water surface. The sound-velocity probe provides real-time measurements of the speed of sound at the MBES to accurately determine the depth readings of the MBES (Hughes-Clarke and others, 1996). The river environment tends to be well mixed, such that the sound velocity at the MBES is sufficiently representative of a sound-velocity profile of the full water column. The Norbit iWBMSh uses the Applanix Position Orientation Solution for Marine Vessels (POS MV) OceanMaster INS system, consisting of an inertial measurement unit (IMU) attached directly to the MBES mount in a “tightly coupled” configuration (fig. 3A) and two Global Navigation Satellite System (GNSS) antennae. The INS provides position in three-dimensional space and measures the attitude of the vessel (pitch, roll, yaw, and heading) to accurately position the data received by the MBES. Real-time kinematic (RTK) differential corrections for the INS came from cellular communication with the MoDOT GNSS real-time network for the navigation and tide solution during the 2020 surveys.
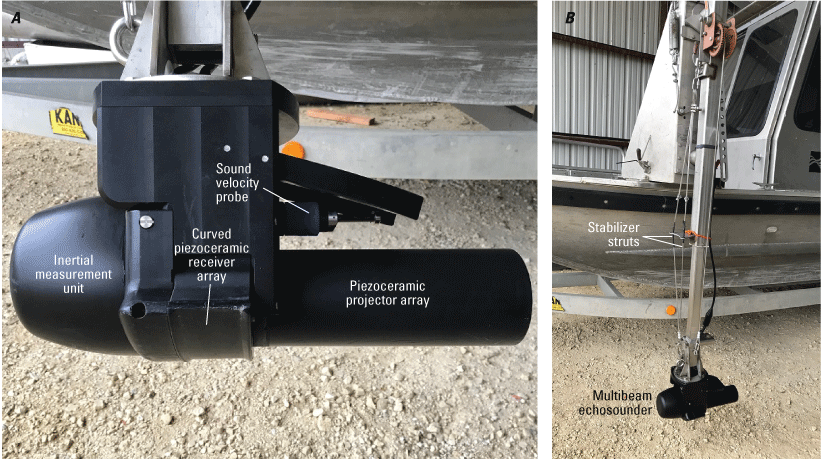
The multibeam echosounder. Photographs by Richard J. Huizinga, U.S. Geological Survey (USGS). A, Viewed from the side. B, Mounted on the port side of a USGS boat.
Like in all previous surveys after 2010 (see report references listed in table 1), the navigation information from the 2020 surveys was postprocessed using the POSPac Mobile Mapping Suite (MMS) software (version 8.0; Applanix Corporation, 2021) to mitigate the effects of degraded positional accuracy of the vessel while near or under a bridge resulting from GNSS outages. The POSPac MMS software provides tools to identify and compensate for sensor and environmental errors to compute an optimally blended navigation solution from the GNSS and raw IMU data. The blended navigation solution (called a “smoothed best estimate of trajectory” or “SBET” file) generated by postprocessing the navigation data was applied to the survey at a given bridge to minimize the effects of the GNSS outages. Because of advances in technology, surveys before 2010 do not have an SBET file and are more likely to have artifacts resulting from minor positional variations between surveys.
Data from the MBES and INS components were processed and integrated into a cohesive dataset for cleanup and visualization. A computer onboard the survey vessel ran the HYPACK/HYSWEEP data acquisition software (version 2020; HYPACK, Inc., 2020) that was used to prepare for and do bathymetric surveys. After completing the surveys, the acquired depth data were further processed to remove data spikes and other spurious points in the multibeam swath trace, georeferenced using the navigation and position solution data from the SBET file and visualized in HYPACK/HYSWEEP as a gridded bathymetric surface or a point cloud.
Information about the velocity of the river at various points throughout each study reach were collected using an acoustic Doppler current profiler (ADCP), similar to previous studies since 2011 by Huizinga (for example, see Huizinga, 2012, 2022a). A Teledyne RD Instruments Rio Grande ADCP operating at 600 kHz was used to obtain velocities at 1.64-ft increments, or “bins,” throughout the water column. The Rio Grande ADCP operates in depths from 2.3 to 230 ft to determine the velocity of water by measuring the Doppler shift of an acoustic signal reflected from various particles suspended in the water (Mueller and others, 2013). By measuring the Doppler shift in four different beam directions, the velocity of the water in each bin can be determined in three dimensions. The depth-averaged velocities from the two traverses of a given section line were computed using averaging algorithms from the Velocity Mapping Toolbox (version 4.09; Parsons and others, 2013).
Basic Description of Methods
The methods used to acquire and ensure the collection of quality data were the same as those used in previous studies using the MBES (methods are detailed in Huizinga and others, 2010; Huizinga, 2010, 2012). A brief summary of—and any differences from—these methods are highlighted below.
Surveying Methods
Generally, the surveyed area extended across the active channel from bank to bank, just like the previous studies on the Missouri and Mississippi Rivers (Huizinga and others, 2010; Huizinga, 2012; see also references listed in table 1). The survey extent ranged from 1,640- to 1,970-ft long in the longitudinal (streamwise) direction, positioned so that the surveyed highway bridges were about one-third to one-half of the total length from the upstream extent. The upstream and downstream extents for each site in this study are near those used in the 2011 flood study for the Missouri River sites (Huizinga, 2012) and the most-recent studies for the Mississippi River sites (Huizinga, 2015, 2017a). The upstream and downstream boundaries of the surveyed areas were assumed to capture all the substantial hydraulic effects (wake vortices and shear flow) of the bridge structures.
Like in previous studies, bathymetric data were obtained along longitudinal transect lines, and each survey was designed such that the survey swaths overlapped to attempt to ensure complete coverage of the channel bed and minimize sonic “shadows” (Huizinga and others, 2010). Many of the surveyed swaths had substantial overlap, except in shallow areas near the channel banks or spur dikes and near in-flow structures or debris rafts. Areas near bridge piers and along the banks also were surveyed in an upstream direction with the MBES swath electronically tilted to port or starboard to increase the acquisition of bathymetric data higher on the banks and sides of the piers. The electronically tilted swath generally was 120 to 160 degrees wide, extending from 10 degrees above horizontal on the bank-ward or pier-ward side of the survey vessel, and 20 to 60 degrees past nadir below the vessel.
After completing the bathymetric survey at a given site, velocity data were obtained with the ADCP on seven transections spanning the channel within the study area. The position and speed of the boat was determined using a differential GNSS receiver mounted on a pole directly above the ADCP. The bottom-track reference method for determining boat speed was anticipated to be unusable because of moving channel-bed material, so the boat velocity was determined using the GNSS essential fix data (the NMEA–0183 GGA string [shorthand for the $GPGGA standard output format for GNSS essential fix data defined by the National Marine Electronics Association 0183 standard that includes information on the three-dimensional location and accuracy of the GNSS receiver; National Marine Electronics Association, 2002]) from the differential GNSS receiver. The distance between the velocity section lines generally was about 260 ft. Three sections were upstream, and four sections were downstream from the bridge being surveyed. Each section line was traversed in each direction across the river, and the reported velocity values were the average from the two traverses of a given section line. Streamflow for a site was computed as the average of the streamflows from reciprocal pairs (two transects per section line) at the various sections in the reach. Generally, measured streamflow for an individual transect was within 5 percent of the average.
Survey Quality-Assurance/Quality-Control Measures
A quality-assurance plan has been established for streamflow and velocity measurements using ADCPs that includes several instrument diagnostics checks and calibrations. These standard operating procedures were followed when acquiring the velocity profile data for these surveys. For a detailed discussion of these procedures, see Mueller and others (2013).
For the MBMS, the principal quality-assurance measures were assessed in real time during the survey. The MBMS operator assessed the quality of the collected data in real time by making visual observations of cross-track swath shape (such as convex, concave, or skewed bed returns in flat, smooth bottoms), noting data-quality flags and alarms from the MBES and the INS, and noting comparisons between adjacent overlapping swaths. In addition to the real-time quality-assurance assessments, beam angle checks and a suite of patch tests were done to ensure quality data were acquired from the MBMS for the 2020 surveys. The beam angle test and one of the patch tests were completed at Mozingo Creek Lake near Maryville, Mo. (fig. 1). Additional patch tests were completed at Garden City New Lake near Garden City, Mo., and at Table Rock Lake near Branson, Mo. (fig. 1).
Beam Angle Check
A beam angle check is used to determine the accuracy of the depth readings obtained by the outer beams (greater than 25 degrees from nadir [vertical]) of the MBES (USACE, 2013), which may change with time as a result of inaccurate sound velocities, physical configuration changes, and overall survey depths. The HYPACK/HYSWEEP software has a utility that develops a statistical assessment of the quality of the outer beams compared to a reference surface (HYPACK, Inc., 2020). On June 23, 2020, a reference surface was surveyed for a part of Mozingo Creek Lake near Maryville, Mo. (fig. 1), and perpendicular check lines were run across the reference surface. Included with the measurement was a sound-velocity profile cast to document and quantify any stratification in the water column near the reference surface. The results of this beam angle check (table 3) were within the recommended performance standards used by the USACE for hydrographic surveys for all the representative angles below 70 degrees, except an outlier at 50 degrees, which was 2 percent greater than the performance standard (USACE, 2013). Points acquired outside of the central 100–110 degrees of the swath generally had overlap with adjacent swaths, which increases the quality of the survey in the overlapped areas because of duplication.
Table 3.
Results of a beam angle check from two check lines over a reference surface at Mozingo Creek Lake near Maryville, Missouri, on June 23, 2020.[Data are summarized from Huizinga (2022b). <, less than; --, no data]
Ideally, the average depth of the reference surface used in the beam angle check would be equal to or greater than the depth of each study reach. The depth of the Missouri and Mississippi River in each study reach generally is unknown before each survey because of the dynamic nature of the channel bed and streamflow conditions; however, the average depth of the reference surface (about 40 ft) was expected to be greater than the average depth observed in the 2020 surveys because the average depths observed during previous surveys in the St. Louis area were less than 40 ft (the average depth is the difference between the average water-surface elevation and average channel-bed elevation in table 5 of Huizinga [2017a]). Like described in the “Surveying Methods” section previously, areas of overlap between adjacent swaths were larger where depths exceeded the average depths. Data from the outer beams in these areas were either verified or removed to mitigate any detrimental effects caused by beam angle inaccuracies.
Patch Tests
Patch tests are a series of dynamic calibration tests that are used to check for subtle variations in the orientation and timing of the MBES with respect to the INS and real-world coordinates. The patch tests are used to determine timing offsets caused by latency between the MBES and the INS, and to determine angular offsets to roll, pitch, and yaw caused by the alignment of the transducer head (fig. 4). These offsets have been observed to be essentially constant for a given survey season, barring an event that causes the mount to change such as striking a floating or submerged object (see report references listed in table 1). The offsets determined in the patch test are applied when processing the data collected during a survey.
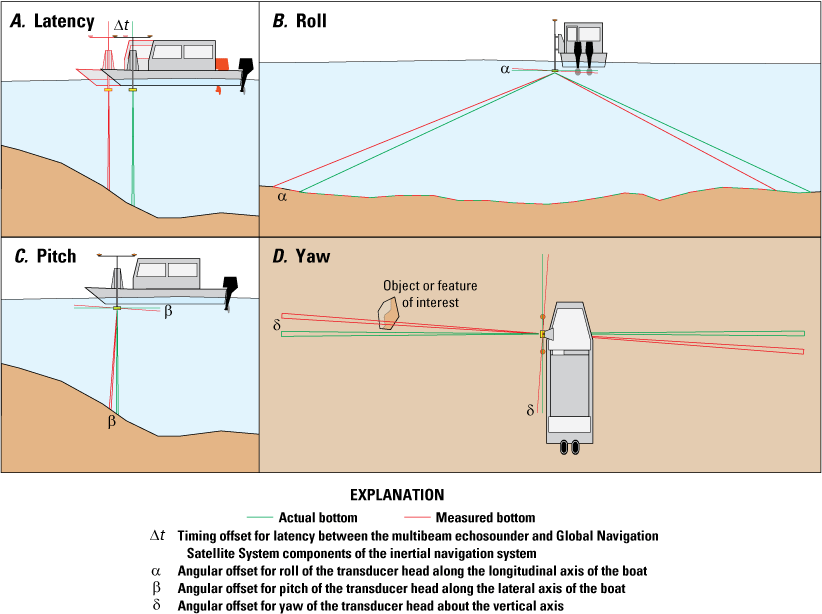
Generalized effects on data from a multibeam echosounder (from Huizinga, 2022a). A, Timing offset for latency. B, Angular offset for roll. C, Angular offset for pitch. D, Angular offset for yaw.
Patch tests were completed before and after the 2020 river surveys at three lakes in Missouri (table 4). Although the MBES had several minor strikes of floating or submerged debris at various times during the 2020 survey season, the roll, pitch, or yaw angles did not apparently change from the beginning to the end of the river surveys in August (table 4). All offsets were consistent with offsets for this boat and similar equipment configurations used in other recent surveys (Huizinga, 2020a, e, 2022a).
Table 4.
Patch test results at various locations, June 23–October 20, 2020.[Data are summarized from Huizinga (2022b). Dates are given in month/day/year]
| Date of test | Timing offset, in seconds | Angular offset for roll, in degrees | Angular offset for pitch, in degrees | Angular offset for yaw, in degrees | Location (fig. 1) |
|---|---|---|---|---|---|
| 06/23/2020 | 0 | −0.30 | 0 | 0 | Mozingo Creek Lake near Maryville, Missouri |
| 07/14/2020 | 0 | −0.30 | 0 | 0 | Garden City New Lake near Garden City, Missouri |
| 10/20/2020 | 0 | −0.30 | 0 | 0 | Table Rock Lake near Branson, Missouri |
Angular offsets determined from the patch tests were applied to the bathymetric data before removing data spikes and other spurious points in the multibeam swaths using automatic filters and manual editing. The bathymetric data were then projected to a three-dimensional grid at a resolution of 1.64 ft using the Combined Uncertainty and Bathymetry Estimator (CUBE) method (Calder and Mayer, 2003), as implemented in the MBMax processing package of the HYPACK/HYSWEEP software (HYPACK, Inc., 2020) and used to generate a gridded raster surface of the channel bed (and associated uncertainty) near each bridge (hereinafter referred to as a “bathymetric surface”) using ArcMap (version 10.8.1; Esri, 2022).
Uncertainty Estimation
Similar to recent bathymetry studies in Missouri (Huizinga, 2015, 2016, 2017a, b, 2020a, b, c, d, e, 2021, 2022a), uncertainty in each survey was estimated by computing the uncertainty for each survey-grid cell in the bathymetric surface of the survey area using the CUBE method (Calder and Mayer, 2003). The gridded uncertainty is a measure of the variability of the individual points in the cell used to determine the CUBE-derived elevation for the cell. Statistics of gridded uncertainty for each of the survey areas are shown in table 5. An example of the spatial distribution of gridded uncertainty typically observed in the survey data at structure A6500 on Interstate 70 is shown in figure 5. The uncertainty data were output and combined with the three-dimensional bathymetry data and are included with metadata in the USGS data release associated with this study (Huizinga, 2022b).
Table 5.
Total gridded uncertainty results for bathymetric data at a 1.64-foot grid spacing from surveys on the Missouri and Mississippi Rivers near St. Louis, Missouri, August 3–10, 2020.[Data are summarized from Huizinga (2022b)]
| Site number (fig. 1) | Structure number | Uncertainty, in feet | Percentage of bathymetry points with uncertainty value less than a given threshold | ||||||
|---|---|---|---|---|---|---|---|---|---|
| Maximum | Average | Median | Standard deviation | 1.00 foot | 0.50 foot | 0.25 foot | 0.10 foot | ||
| 22 | A8141 | 3.18 | 0.09 | 0.10 | 0.06 | 100.0 | 99.7 | 98.6 | 76.5 |
| 23 | A7577/A4017 | 3.41 | 0.09 | 0.07 | 0.06 | 100.0 | 99.7 | 98.7 | 73.6 |
| 24 | A5585 E & W | 2.26 | 0.09 | 0.10 | 0.06 | 100.0 | 99.8 | 98.7 | 74.9 |
| 25 | A3292/L0561 | 3.25 | 0.10 | 0.10 | 0.07 | 99.9 | 99.7 | 98.2 | 73.2 |
| 26 | A4557 E & W | 3.25 | 0.09 | 0.10 | 0.06 | 99.9 | 99.7 | 98.4 | 77.8 |
| 27 | A3047 | 3.58 | 0.08 | 0.07 | 0.05 | 100.0 | 99.8 | 99.1 | 87.2 |
| 32 | A8504 | 3.02 | 0.11 | 0.10 | 0.06 | 100.0 | 99.8 | 98.9 | 56.8 |
| 33 | A6500 | 3.64 | 0.14 | 0.13 | 0.07 | 99.9 | 99.6 | 97.1 | 26.8 |
| 34 | A1500 | 3.84 | 0.14 | 0.13 | 0.08 | 99.9 | 99.5 | 97.1 | 33.3 |
| 35 | A4936/A1850 | 3.58 | 0.12 | 0.10 | 0.08 | 99.9 | 99.5 | 96.4 | 50.4 |
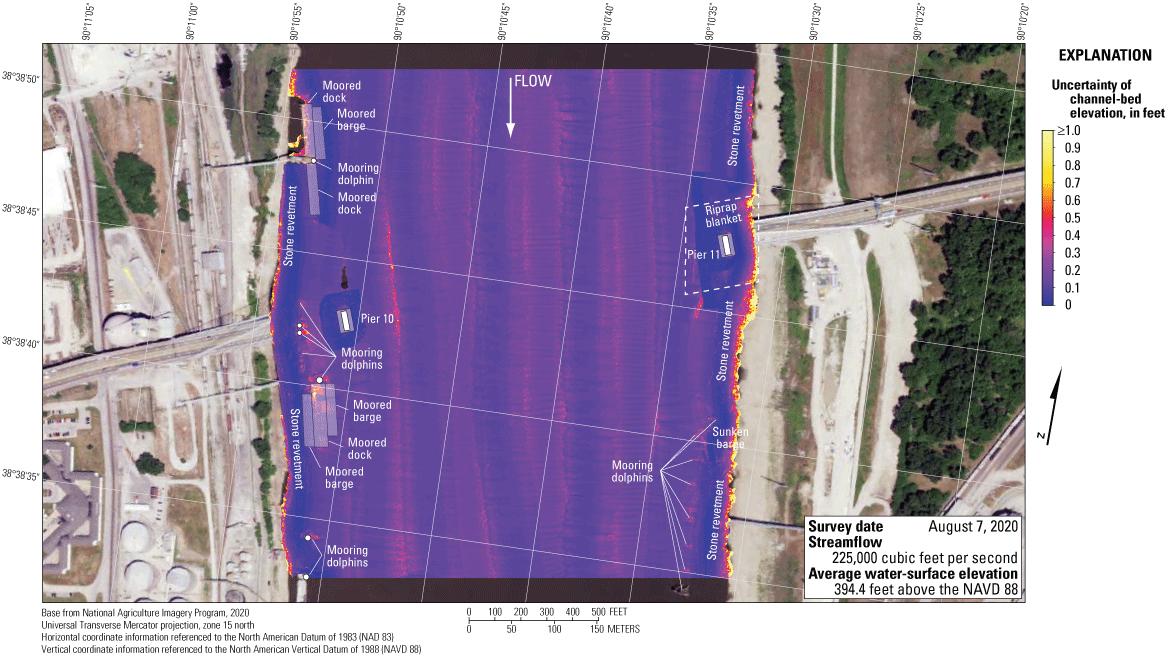
Uncertainty of gridded bathymetric data from the Mississippi River channel near structure A6500 on Interstate 70 in St. Louis, Missouri.
More than 99 percent of the uncertainty values at all the sites were less than 0.50 ft (table 5), which is within the specifications for a “Special Order” survey, the most-stringent survey standard of the International Hydrographic Organization (IHO; IHO, 2020). More than 96 percent of the uncertainty values were less than 0.25 ft, and more than 50 percent of the uncertainty values were less than 0.10 ft at all the sites except 33 and 34 (table 5). The tops of bridge substructural elements (pier footings and seal courses) typically had uncertainty values of less than 0.10 ft. Like noted in previous surveys with this type of equipment (see, for example, Huizinga, 2012, 2016), the uncertainty values were larger near moderate-relief features (banks, spur dikes, rock riprap and outcrops, and scour holes near piers). The largest uncertainty in this group of surveys was 3.84 ft (table 5); however, as noted in previous studies, uncertainty values of this magnitude typically happened near high-relief features, such as the front or side of a pier footing (fig. 5). Occasionally, the uncertainty values also were larger (1.00 ft or greater) in the outermost beams of the multibeam swath where overlap occurred with an adjacent swath, particularly when the MBES head was electronically tilted for the survey lines along the banks or near the piers. Overlapping adjacent swaths in the channel thalweg (the line of maximum depth in the channel) also can display larger uncertainty values because substantial bed movement can happen between survey passes (fig. 5).
The uncertainty of the gridded data computed using the CUBE method has been decreasing with time compared to previous surveys (see table 4 in previous studies; Huizinga, 2010, 2017a). The decrease in uncertainty primarily is the result of improvements in data-collection equipment and methods. The Norbit iWBMSh used in these surveys has a tightly coupled IMU attached directly to the MBES mount, which decreases some of the uncertainty by reducing the lever arm length (and therefore the potential movement) between the MBES and IMU. The ability to electronically tilt the swath substantially reduces the time between when unrotated, down-looking data and rotated, side-looking data are collected, which reduces the uncertainty of the data in the swath overlap zone that might otherwise experience more substantial bed movement.
The survey at structure A6500 on Interstate 70 had the second-highest maximum value of uncertainty (3.64 ft), as well as the lowest percentage of bathymetry points with an uncertainty of less than the various thresholds (table 5). The survey was obtained with relatively smooth longitudinal swaths (fig. 5), which was the case at nearly all the sites surveyed in this study. The primary anomalies at this site were observed along the banks and near the piers, where the MBES was used in an electronically tilted configuration to extend the potential coverage in these areas, resulting in high uncertainty values. This site is in the St. Louis harbor, which has numerous mooring dolphins, service docks, and moored barges along the banks. Furthermore, structure A6500 has very large piers that are skewed to flow. All these factors limit smooth navigation near the banks and likely contributed to the increased uncertainty of data near the bank. Generally, the magnitude and distribution of uncertainty observed at this site is representative of those observed at all the other surveyed sites.
Results of Bathymetric and Velocimetric Surveys
The site-specific results for each bridge are discussed in the following sections, starting with the upstream-most bridge and progressing downstream, first on the Missouri River followed by the Mississippi River. The site-specific results are followed by a discussion of general findings that are not specific to a particular site. The range of bed elevations described as “the channel-bed elevations” for each survey was based on statistical analyses of the bathymetric surface at each site and covers the 5th to 95th percentile range of the data. Because the surveys generally were limited to the active channel from bank-to-bank excluding overbank areas, this percentile range generally covered the channel bed but excluded the banks and localized high or low spots, such as spur dikes or scour holes near piers. All elevation data were referenced to the North American Vertical Datum of 1988 (NAVD 88).
For consistency with earlier studies, dune sizes are described in general terms for each of the bridge sites using the categories set by Huizinga (2012) for the discussion of bathymetry during the 2011 flood. In this report, small dunes and ripples are those that are less than 5 ft high from crest to trough, medium dunes are those that are 5 to 10 ft high, large dunes are those that are 10 to 15 ft high, and very large dunes are those that are greater than or equal to 15 ft high.
All the bridge sites in this study were previously surveyed (Huizinga, 2011, 2012, 2014, 2015, 2017a; Huizinga and others, 2010), and bathymetry data from earlier surveys at all 10 crossings are included with metadata in Huizinga (2017b, 2020c, d). A map showing the difference in channel-bed elevation for the area common to the comparison surveys is included for each site, and data from previous surveys are included in the cross-section plot for that bridge. The difference maps were created using the Geomorphic Change Detection (GCD; version 7) add-in tool for ArcGIS available through the Riverscapes Consortium (2022). GCD computes elevation difference and volumetric change in storage between two gridded raster surfaces (each as a digital elevation model [DEM] of the surface) derived from repeat topographic or bathymetric surveys. The GCD program provides a suite of tools to associate the uncertainties for points in the various surveys (using the uncertainty values associated with each point, or an average uncertainty of the survey when point-specific uncertainty data were not available [2010 or earlier survey data]) and propagates those uncertainties through the DEM of difference (DoD) map. The GCD program also provides a way to segregate the best estimates of change using threshold masks. A threshold mask of 95-percent confidence was used for comparisons in the current study, and summary statistics (maximum, minimum, and average) of the DoD maps were determined. Sediment volumes for cut (scour) and fill (deposition) between the 2020 survey and any previous surveys between 2008 and 2016 also were determined. The surveys are broadly compared based on their timing and the streamflow at the time of the survey. Additionally, shaded triangulated irregular network (TIN) images of the channel and side of pier were prepared for each surveyed pier. These visualizations are shown in appendix 1, figures 1.1 to 1.10.
Although the configuration of the channel bed and the underlying sediment transport conditions at a site are associated with an instantaneous streamflow in the discussions that follow, a given bathymetric surface actually reflects more than those instantaneous transport conditions. A wide variety of factors affect the channel-bed configuration of a reach for a specific streamflow, including magnitude of flow velocities and velocity distribution, the number, size, and timing of previous flood rises, whether the stage currently is rising or falling, and other local hydraulic conditions (Gilbert and Murphy, 1914; Simons and Richardson, 1966). Furthermore, the channel-bed configuration at a site is affected by upstream and local sediment conditions (size and spatial distribution) and contributions, as well as water temperature and other seasonal variations (Simon, Li and Associates, 1985). Because of the myriad number and interactions between factors affecting sediment transport conditions and the resulting bed conditions, it was assumed that the configuration and size of bed forms observed during the current (2020) surveys in the St. Louis area depended on more than the instantaneous streamflow at a given site. Although it is beyond the scope of the current (2020) study to examine all the antecedent conditions that created the observed channel-bed configuration, the comparisons with previous surveys under different streamflow conditions nevertheless contributes to understanding the many complexities of sediment transport and resulting channel-bed conditions.
Like in recent previous studies (see report references listed in table 1), when discussing the vertically averaged velocity values obtained during the surveys in the sections that follow, neighboring vectors having random variations in direction and magnitude were taken as an indication of nonuniform flow in the section resulting from shear and wake vortices. Conversely, neighboring vectors having gradual and systematic variations were taken as an indication of uniform flow in the section. The Missouri and Mississippi Rivers are highly turbulent even in the absence of structures that generate strong shear or wakes, but in the interest of conciseness, nonuniform flow is loosely described as “turbulent” in the following sections.
Structure A8141 on State Highway 47 at Washington, Missouri
Structure A8141 (site 22; table 2) on State Highway 47 crosses the Missouri River at river mile (RM) 67.6 at Washington, Mo., west of and upstream from St. Louis, Mo. (fig. 1). The site was surveyed on August 3, 2020, and the average water-surface elevation of the river in the survey area, determined by the RTK GNSS tide solution, was 474.1 ft (table 6; fig. 6). Streamflow on the Missouri River was about 180,000 ft3/s as measured by an ADCP during the survey (table 6). Structure A8141 was built upstream from K0969 (fig. 6), which it replaced in 2018 (table 2).
Table 6.
Bridge and survey information, and selected channel-bed elevations from surveys on the Missouri and Mississippi Rivers near St. Louis, Missouri, August 3–10, 2020.[Data are summarized from Huizinga (2022b). Dates are given in month/day/year. All elevations are in feet above the North American Vertical Datum of 1988. ADCP, acoustic Doppler current profiler; IS, Interstate highway; US, U.S. highway; MO, State highway]
| Site number (fig. 1) | Structure number | Survey date | Route | River milea | Streamflow from ADCP measurements,b in cubic feet per second | Average water-surface elevation near the bridge, in feet | Average channel-bed elevation,c in feet | Approximate elevation of the indicated percentile of the bathymetric data, in feet | Approximate local minimum channel elevation,d in feet | |
|---|---|---|---|---|---|---|---|---|---|---|
| 5th percentile | 95th percentile | |||||||||
| 22 | A8141 | 08/03/20 | MO 47 | 67.6 | 180,000 | 474.1 | 448.5 | 438.8 | 460.9 | 420 |
| 23 | A7577/ A4017 | 08/03/20 | IS 64 | 43.9 | 151,000 | 451.8 | 425.8 | 415.8 | 439.5 | 392 |
| 24 | A5585 E & W | 08/04/20 | MO 364 | 32.7 | e132,000 | 438.5 | 416.8 | 407.2 | 427.8 | 404 |
| 25 | A3292/ L0561 | 08/04/20 | IS 70 | 29.6 | 162,000 | 436.0 | 412.0 | 402.7 | 422.5 | f386 |
| 26 | A4557 E & W | 08/04/20 | MO 370 | 27.0 | 150,000 | 433.7 | 409.2 | 401.3 | 419.8 | 394 |
| 27 | A3047 | 08/06/20 | US 67 | 8.1 | 127,000 | 414.0 | 393.7 | 383.5 | 402.8 | 376 |
| 32 | A8504 | 08/06/20 | US 54 | 283.2 | 101,000 | 449.2 | 421.9 | 411.7 | 437.9 | 406 |
| 33 | A6500 | 08/07/20 | IS 70 | 181.2 | 225,000 | 394.4 | 358.1 | 350.6 | 376.3 | f333 |
| 34 | A1500 | 08/07/20 | IS 55 | 179.2 | 210,000 | 393.8 | 358.1 | 347.0 | 373.8 | f338 |
| 35 | A4936/ A1850 | 08/10/20 | IS 255 | 168.8 | 242,000 | 390.6 | 360.2 | 347.2 | 375.5 | 315 |
For sites 22–27, river mile is the distance upstream on the Lower Missouri River, starting at the confluence with the Mississippi River at St. Louis, Missouri (fig. 1), at river mile 195.2 of the Upper Mississippi River. For sites 32–35, river mile is the distance upstream on the Upper Mississippi River, starting at the confluence with the Ohio River at Cairo, Illinois (fig. 1), at river mile 953.5 of the Lower Mississippi River.
The average streamflow obtained while making the various velocity transects. The reported value is the streamflow computed using Global Navigation Satellite System (GNSS) essential fix data string as the reference, as described in the “Surveying Methods” section of the text.
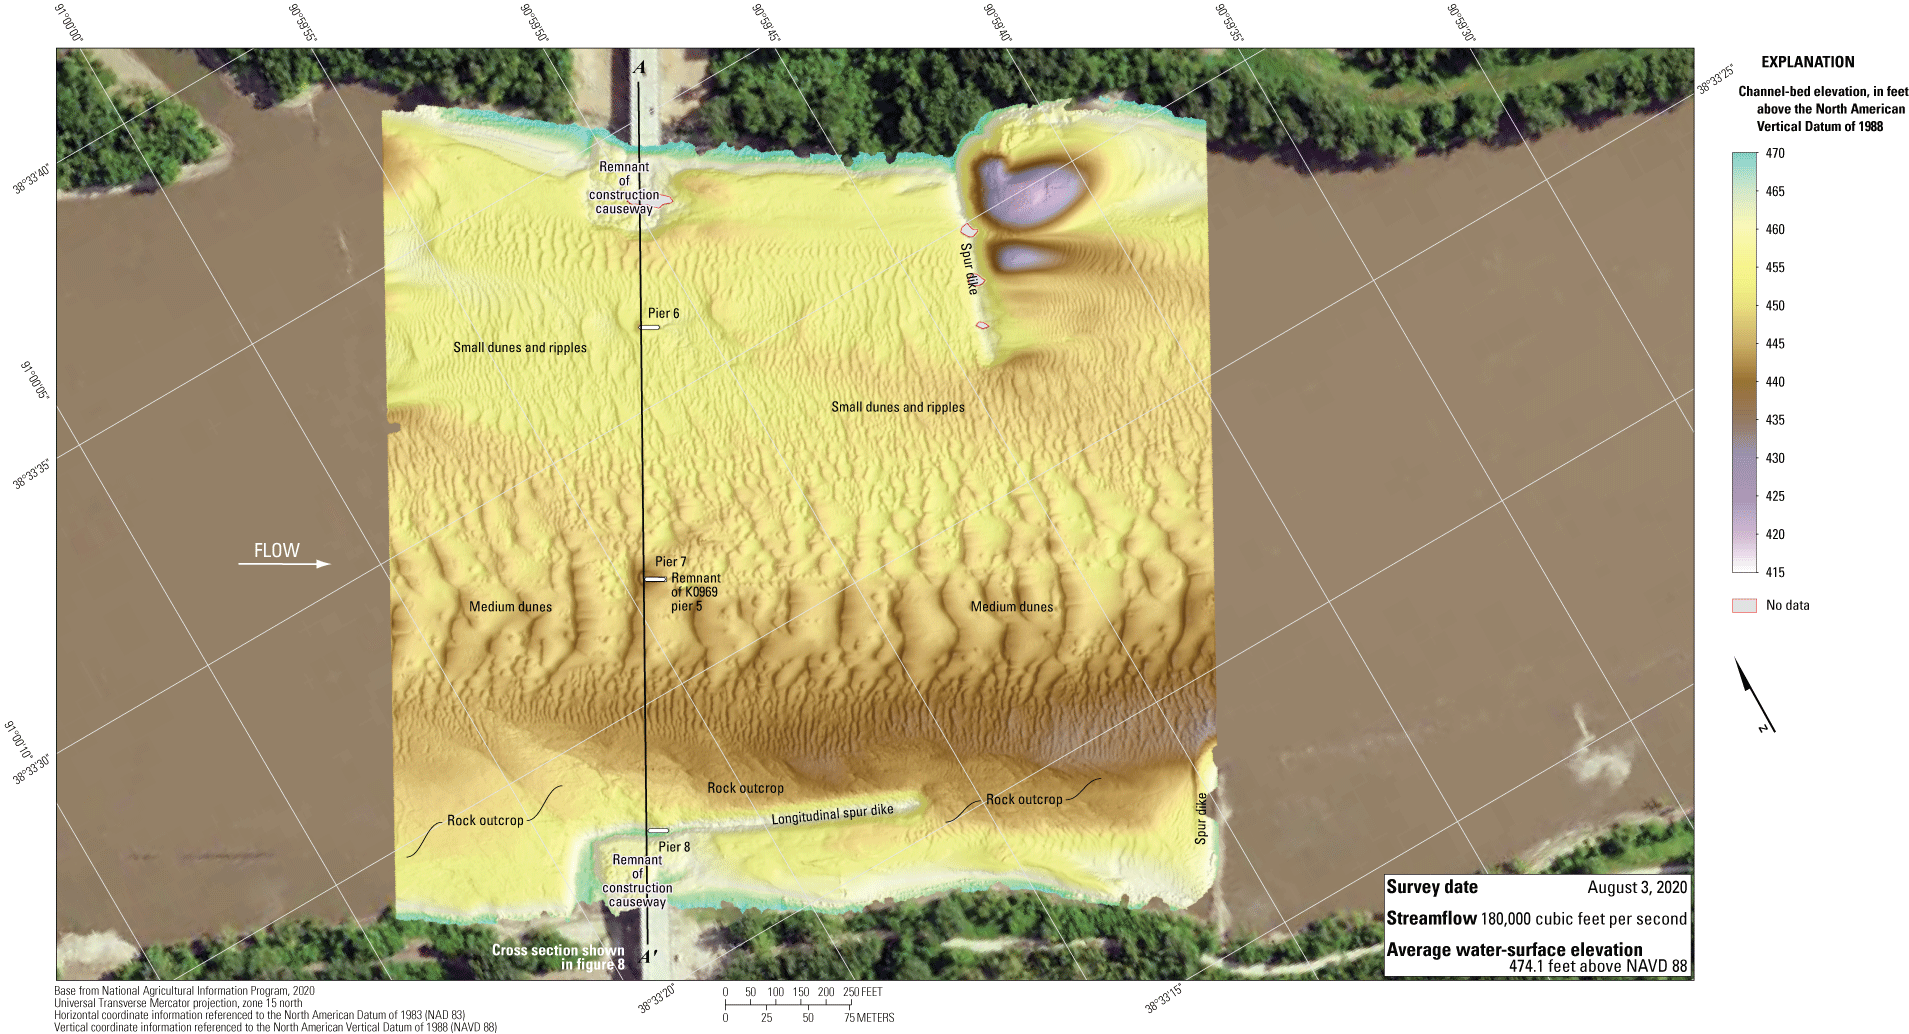
Bathymetric survey of the Missouri River channel near structure A8141 on State Highway 47 at Washington, Missouri.
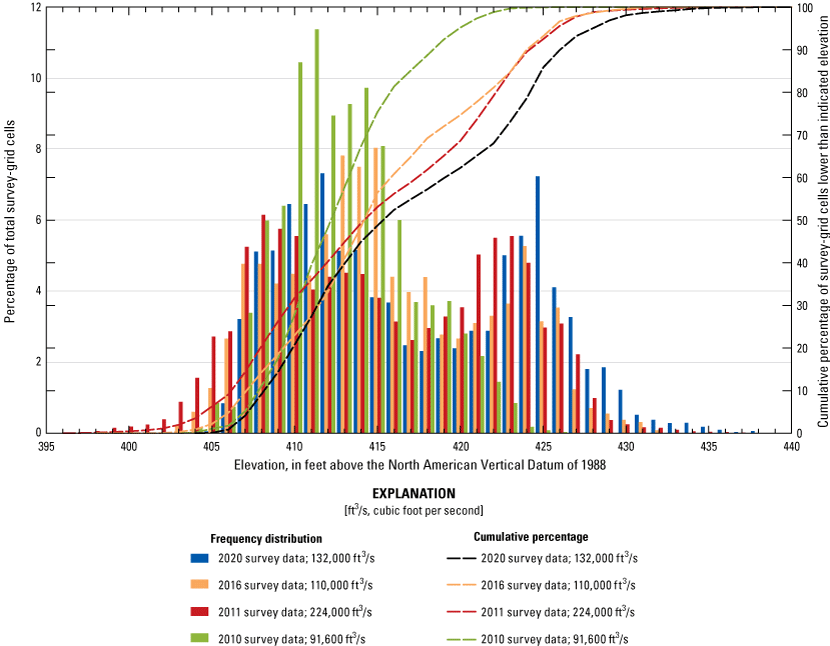
The survey area was about 1,640 ft long and about 1,590 ft wide, extending across the active channel from bank to bank (fig. 6). The survey area extended about 525 ft upstream from the centerline of structure A8141, and piers 6 through 8 were in the water. The channel-bed elevations ranged from about 439 to 461 ft for most of the surveyed area (5th to 95th percentile range of the bathymetric data; fig. 7), except downstream from the left (north) spur dike that had a local minimum channel-bed elevation of about 420 ft (fig. 6; table 6). A thalweg was present along the right (south) bank and deepened in a downstream direction throughout the reach. A series of medium dunes were present in the middle of the channel, and numerous small dunes and ripples were present throughout the rest of the channel (fig. 6).
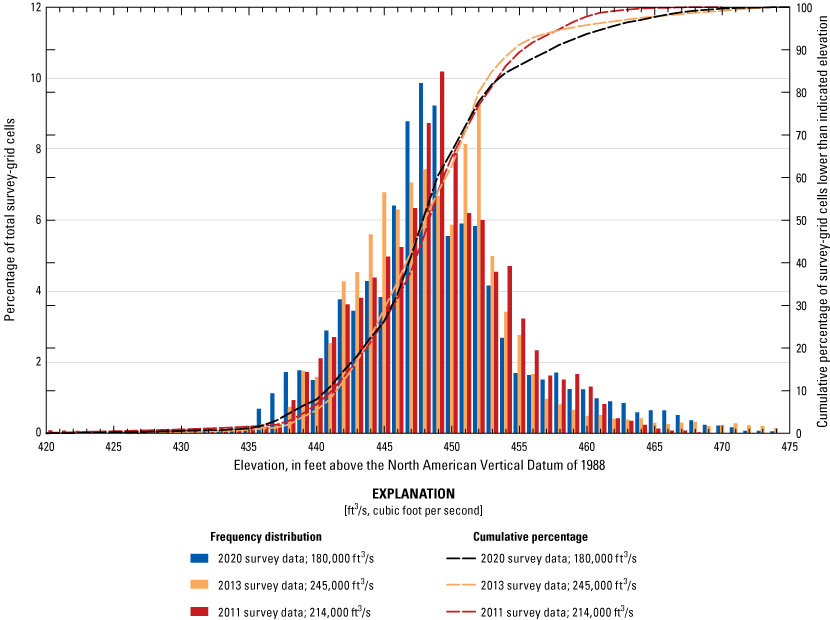
Frequency distribution of bed elevations for bathymetric survey-grid cells in 1-foot elevation bins on the Missouri River near structure A8141 on State Highway 47 at Washington, Missouri, on August 3, 2020, compared to previous surveys in 2011 and 2013 (Huizinga, 2012, 2014, respectively).
Small to moderate scour holes were observed near piers 6 and 7 (figs. 6, 1.1). The scour hole near pier 6 had a minimum channel-bed elevation of about 446 ft (fig. 8; table 7), which is about 6 ft below the average channel-bed elevation upstream from the scour hole (the “Depth of scour hole from upstream channel bed” in table 7). The scour hole near pier 7 had a minimum channel-bed elevation of about 439 ft (fig. 8; table 7), which is about 10 ft below the average channel-bed elevation upstream from the scour hole. Information from bridge plans indicate that both main channel piers 6 and 7 of structure A8141 are shafts drilled 20 ft into bedrock, with about 59 ft of bed material between the bottom of the scour hole and bedrock at pier 6 and 48 ft of bed material at pier 7 (fig. 8; difference between “Approximate minimum elevation in/of scour hole near/at upstream pier/bent face” and “Approximate elevation of bedrock near pier/bent” in table 7). Pier 8 was embedded in the longitudinal spur dike near the right bank, and the minimum channel elevation at the toe of the dike was about 451 ft (figs. 6, 8; table 7). Pier 8 is founded on shafts drilled 25 ft into bedrock, and bedrock was exposed at the toe of the spur dike (figs. 6, 8; table 7); the rock of the spur dike and bedrock likely will limit or prevent a local scour hole forming near pier 8. In the previous survey of the old structure K0969, the 16-ft-wide caisson foundations of piers 5 and 6 were exposed to flow (see fig. 43 in Huizinga [2014]), whereas only the 8-ft-wide pedestals of the new bridge piers 6 and 7 were exposed to flow in the 2020 survey. The smaller cross-sectional area of the new bridge piers near the channel bed seems to have reduced the scour hole caused by the piers, compared to the old bridge (see figs. 42 and 43 in Huizinga [2014]). Furthermore, the top of the footing of pier 7 was partly exposed in the 2020 survey (figs. 6, 8, 1.1C, 1.1D), which might provide some mitigation to the scour hole at this pier because the downward flow of the horseshoe vortex at the pier face is blunted by the footing (Arneson and others, 2012).
Table 7.
Results near piers and bents from surveys on the Missouri River near St. Louis, Missouri, August 3–6, 2020.[Data are summarized from Huizinga (2022b). Sites are shown on figure 1. MoDOT, Missouri Department of Transportation; --, not known/applicable; all elevations are in feet above the North American Vertical Datum of 1988]
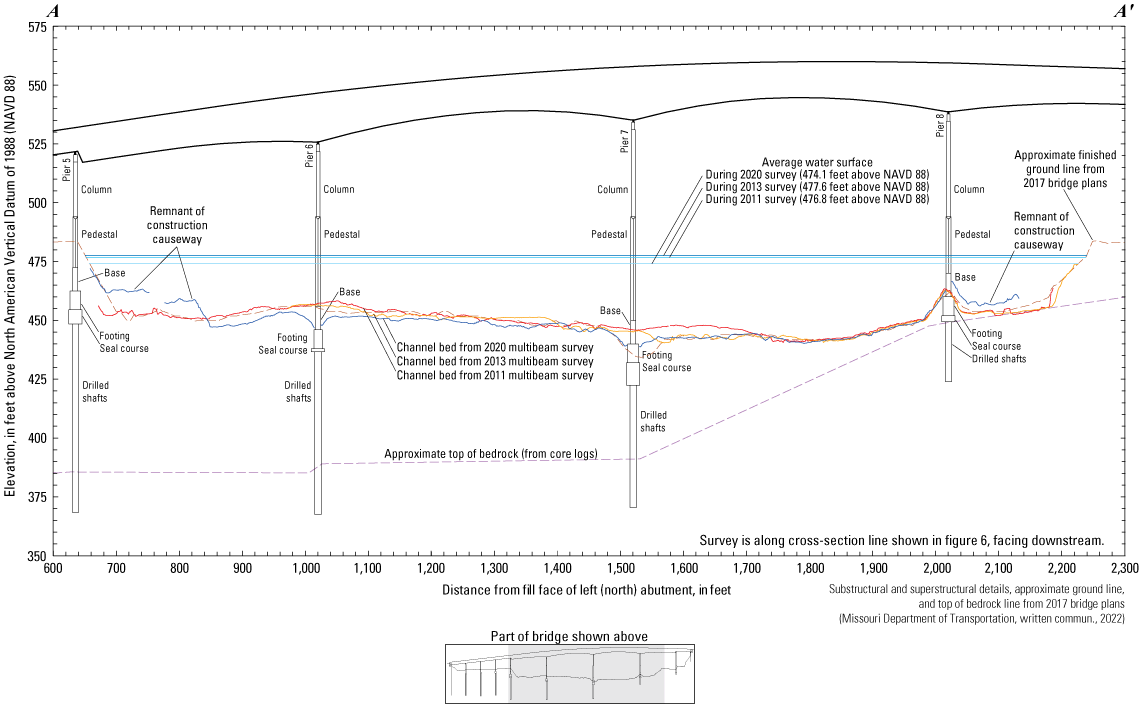
Key features, substructural and superstructural details, and surveyed channel bed of structure A8141 on State Highway 47 crossing the Missouri River at Washington, Missouri.
The computed difference between the survey DEMs with a probabilistic threshold mask of 95-percent confidence based on uncertainty (hereinafter, referred to simply as “the difference”) from the survey on August 3, 2020, and the previous survey on April 22, 2013 (fig. 9), indicates about 59 percent of the joint area of interest had change greater than the 95-percent confidence interval of uncertainty (hereinafter referred to as “detectable change”), which means about 41 percent of the differences in the joint area of interest are equivocal and within the 95-percent confidence bounds of uncertainty of detectable change (hereinafter referred to as “within the bounds of uncertainty;” table 8). Bed variation seemed about equal between scour and deposition in the middle part of the channel from 2013 to 2020 in the DoD (fig. 9); however, scour is dominant in the thalweg downstream from the bridge as well as along the left (north) bank throughout the reach, whereas deposition is dominant downstream from the left (north) spur dike and behind the longitudinal dike near the right (south) bank (fig. 9). The average difference between the bathymetric surfaces (the statistical mean value of the gridded raster surface [fig. 9] created from the thresholded difference between the 2020 and 2013 gridded raster bathymetric surfaces) was –0.42 ft (table 8), indicating minor to moderate channel degradation between the 2013 and 2020 surveys. The net volume of cut in the reach from 2013 to 2020 was about 100,400 cubic yards (yd3), and the net volume of fill was about 46,900 yd3, resulting in a net loss of about 53,500 yd3 of sediment between 2013 and 2020. The cross sections from the two surveys along the upstream face of the bridge are not substantially different from one another for most of the cross section, except near the left bank where the 2020 section is substantially higher than the previous sections, and much of the area around pier 6 where the 2020 survey section is 5 to 10 ft below the 2013 survey section (fig. 8). The higher bed elevations near the banks likely are remnants of construction causeways built along the upstream bridge face (fig. 6). The frequency distribution of bed elevations in 2020 also was similar to 2013 but with a higher percentage of cells at lower and higher channel-bed elevations (fig. 7). The smaller cross section of the new piers mentioned in the previous paragraph (fig. 8) is evidenced in the smaller scour holes near the piers (fig. 6, as compared to figs. 42 and 43 in Huizinga [2014]), which are very similar to the scour and deposition resulting from different dune sizes between the surveys (fig. 9). The rock outcrop on the right (south) bank showed no signs of substantial change, being in the equivocal area outside the 95-percent confidence interval of detectable change (indicated by the white area on the right [south] bank in fig. 9). Although rock ultimately is an erodible material, its rate of erosion is substantially slower than that of the sand and silt found in most of the channel (Arneson and others, 2012). The longitudinal spur dike on the right (south) bank showed minor erosion on one side and deposition on the other (fig. 9); however, deposition or scour apparent on opposing faces of a feature likely results from minor horizontal positional variances between the surveys (see “Uncertainty Estimation” section).
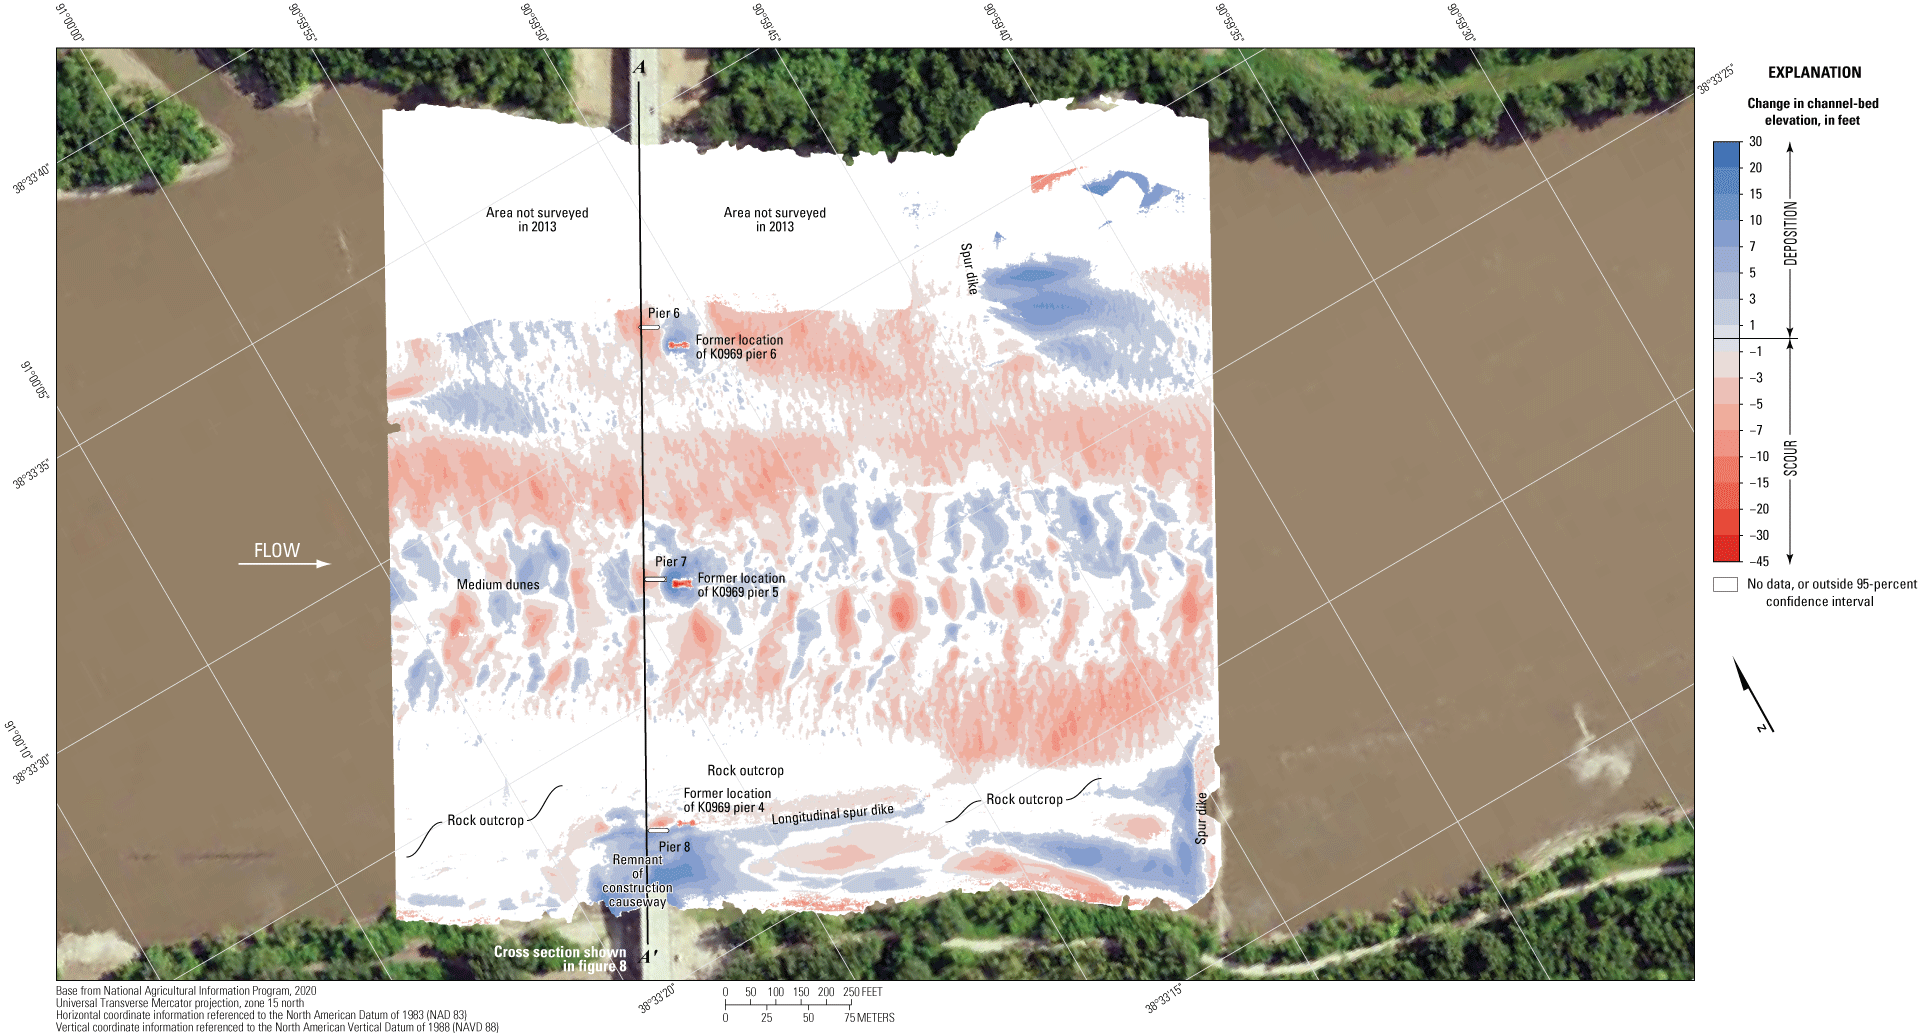
Difference between surfaces created from bathymetric surveys of the Missouri River channel near structure A8141 on State Highway 47 at Washington, Missouri, on August 3, 2020, and April 22, 2013, with probabilistic thresholding.
Table 8.
Summary information and bathymetric surface difference statistics from surveys on the Missouri and Mississippi Rivers near St. Louis, Missouri, from August 3–10, 2020, and previous surveys (Huizinga, 2011, 2012, 2014, 2015, 2017a; Huizinga and others, 2010).—Left[Data are summarized from Huizinga (2022b). Dates are shown as month/day/year. All elevations are referenced to the North American Vertical Datum of 1988. Min, minimum; Max, maximum; A, Huizinga (2012); B, Huizinga (2014); C, Huizinga (2011); D, Huizinga (2017a); E, Huizinga (2015); F, Huizinga and others (2010)]
| Site number (fig. 1) | Structure number | Previous survey | Difference between 2020 survey and previous surveya | ||||||
|---|---|---|---|---|---|---|---|---|---|
| Source of data | Date | Streamflow, in cubic feet per second | Surveyed area, in 1×10⁶ square feet | Average water-surface elevation, in feet | Streamflow, in cubic feet per second | Surveyed area, in 1×10⁶ square feet | Average water-surface elevation, in feet | ||
| 22 | A8141 | A | 07/27/11 | 214,000 | 2.460 | 476.8 | −34,000 | 0.069 | −2.7 |
| B | 04/22/13 | 245,000 | 2.086 | 477.6 | −65,000 | 0.443 | −3.5 | ||
| 23 | A7577/ A4017 | C | 10/18/10 | 95,300 | f4.167 | 444.2 | 55,700 | −1.286 | 7.6 |
| A | 07/29/11 | 220,000 | 2.872 | 453.4 | −69,000 | 0.009 | −1.6 | ||
| D | 05/23/16 | 117,000 | 2.707 | 446.0 | 34,000 | 0.174 | 5.8 | ||
| 24 | A5585 E & W | C | 10/21/10 | 91,600 | 1.550 | 432.0 | 40,400 | 0.532 | 6.5 |
| A | 08/01/11 | 224,000 | 2.002 | 443.2 | −92,000 | 0.079 | −4.7 | ||
| D | 05/24/16 | 110,000 | 2.042 | 434.1 | 22,000 | 0.039 | 4.4 | ||
| 25 | A3292/ L0561 | C | 10/21/10 | 91,600 | 1.847 | 430.0 | 70,400 | 0.222 | 6.0 |
| A | 08/02/11 | 225,000 | 1.981 | 440.4 | −63,000 | 0.087 | −4.4 | ||
| D | 05/24/16 | 116,000 | 2.052 | 431.8 | 46,000 | 0.016 | 4.2 | ||
| 26 | A4557 E & W | C | 10/22/10 | 90,000 | 1.899 | 428.4 | 60,000 | 0.189 | 5.3 |
| A | 08/02/11 | 225,000 | 2.037 | 438.2 | −75,000 | 0.051 | −4.5 | ||
| D | 05/24/16 | 114,000 | 2.042 | 429.9 | 36,000 | 0.046 | 3.8 | ||
| 27 | A3047 | C | 10/25/10 | 87,400 | 1.680 | 410.2 | 39,600 | 0.392 | 3.8 |
| A | 08/03/11 | 225,000 | 2.216 | 421.8 | −98,000 | −0.144 | −7.8 | ||
| D | 05/27/16 | 131,000 | 2.045 | 413.7 | −4,000 | 0.027 | 0.3 | ||
| 32 | A8504 | E | 06/06/14 | 194,000 | 2.502 | 451.2 | −93,000 | −0.027 | −2.0 |
| 33 | A6500 | F | 07/07/09 | 295,000 | f5.981 | 398.2 | −70,000 | −2.475 | −3.8 |
| D | 05/25/16 | 276,000 | 3.572 | 396.6 | −51,000 | −0.066 | −2.2 | ||
| 34 | A1500 | C | 10/20/10 | 277,000 | f6.992 | 396.5 | −67,000 | −4.297 | −2.7 |
| D | 05/25/16 | 279,000 | 2.699 | 395.7 | −69,000 | −0.004 | −1.9 | ||
| 35 | A4936/ A1850 | C, F | 10/02–03/08 | 215,000 | f7.963 | 383.8 | 27,000 | −4.633 | 6.8 |
| C, F | 05/12–13/09 | 424,000 | f9.069 | 403.7 | −182,000 | −5.739 | −13.1 | ||
| C, F | 07/08/09 | 271,000 | f7.937 | 390.3 | −29,000 | −4.607 | 0.3 | ||
| C | 10/19/10 | 288,000 | f8.111 | 391.6 | −46,000 | −4.781 | −1.0 | ||
| D | 05/26/16 | 290,000 | 3.262 | 390.5 | −48,000 | 0.068 | 0.1 | ||
Table 8.
Summary information and bathymetric surface difference statistics from surveys on the Missouri and Mississippi Rivers near St. Louis, Missouri, from August 3–10, 2020, and previous surveys (Huizinga, 2011, 2012, 2014, 2015, 2017a; Huizinga and others, 2010).—Right[Data are summarized from Huizinga (2022b). Dates are shown as month/day/year. All elevations are referenced to the North American Vertical Datum of 1988. Min, minimum; Max, maximum; A, Huizinga (2012); B, Huizinga (2014); C, Huizinga (2011); D, Huizinga (2017a); E, Huizinga (2015); F, Huizinga and others (2010)]
A positive value of difference means the 2020 value was larger than previous value, whereas a negative value means the 2020 value was smaller than the previous value.
The maximum or minimum value of change likely is near a vertical pier face and affected by minor positional variances.
The difference between the survey on August 3, 2020, and the earliest survey on July 27, 2011 (fig. 10), indicates about 71 percent of the joint area of interest had detectable change, which means about 29 percent of the differences in the joint area of interest are equivocal and within the bounds of uncertainty (table 8). Scour is dominant throughout most of the reach between 2011 and 2020 in the DoD, except along the left (north) bank, downstream from the left (north) spur dike, and behind the longitudinal dike near the right bank (fig. 10). The substantial scour hole near former pier 5 of structure K0969 in 2011 also filled (fig. 10). Nevertheless, the average difference between the bathymetric surfaces was –1.20 ft (table 8), indicating moderate channel degradation between the 2011 and 2020 surveys. However, the net loss of sediment between 2011 and 2020 was about 26,500 yd3, which is less than the net loss of sediment between 2013 and 2020 (table 8). The cross section from the 2020 survey along the upstream face of the bridge varies from 5 to 15 ft below the 2011 survey section, except near the remnant of the construction causeways near the banks (fig. 8). The frequency distribution of bed elevations in 2020 seems very similar to 2011 but with a higher percentage of cells at lower channel-bed elevations, as well as some higher channel-bed elevations (fig. 7). The rock outcrop on the right (south) bank showed localized signs of minor scour and deposition, and the longitudinal spur dike on the right (south) bank showed minor scour on one face and deposition on the other (fig. 10). Like with the previous DoD, deposition or scour apparent on opposing faces of a feature likely results from minor horizontal positional variances between the surveys (see “Uncertainty Estimation” section).
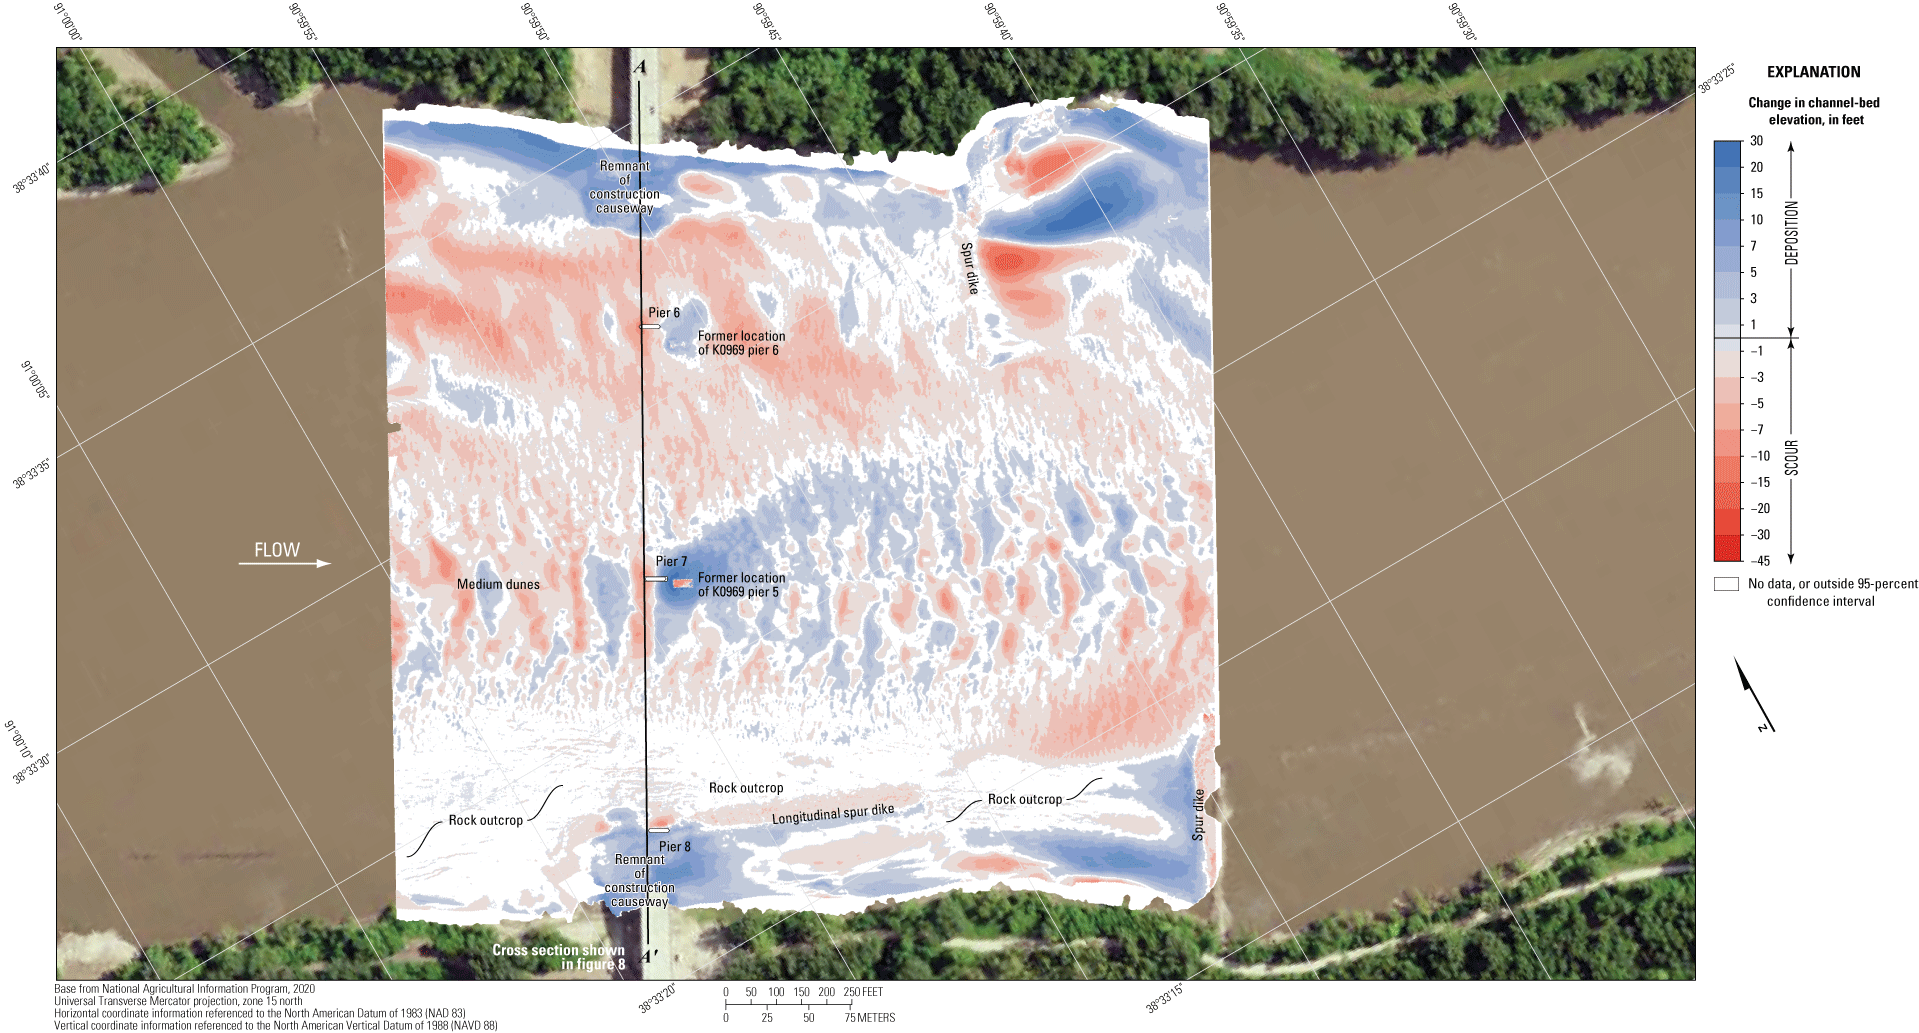
Difference between surfaces created from bathymetric surveys of the Missouri River channel near structure A8141 on State Highway 47 at Washington, Missouri, on August 3, 2020, and July 27, 2011, with probabilistic thresholding.
The vertically averaged velocity vectors indicate mostly uniform flow in the middle of the channel, where velocities range from about 4 to 9 feet per second (ft/s; fig. 11). Local lower velocities and turbulence were observed downstream from the various spur dikes on both banks (fig. 11). The wake vortices downstream from piers 6 and 7 were not pronounced and seemed to be no greater than the general nonuniformity of flow observed in the channel (fig. 11). Minor localized turbulence was present in all the sections (fig. 11).
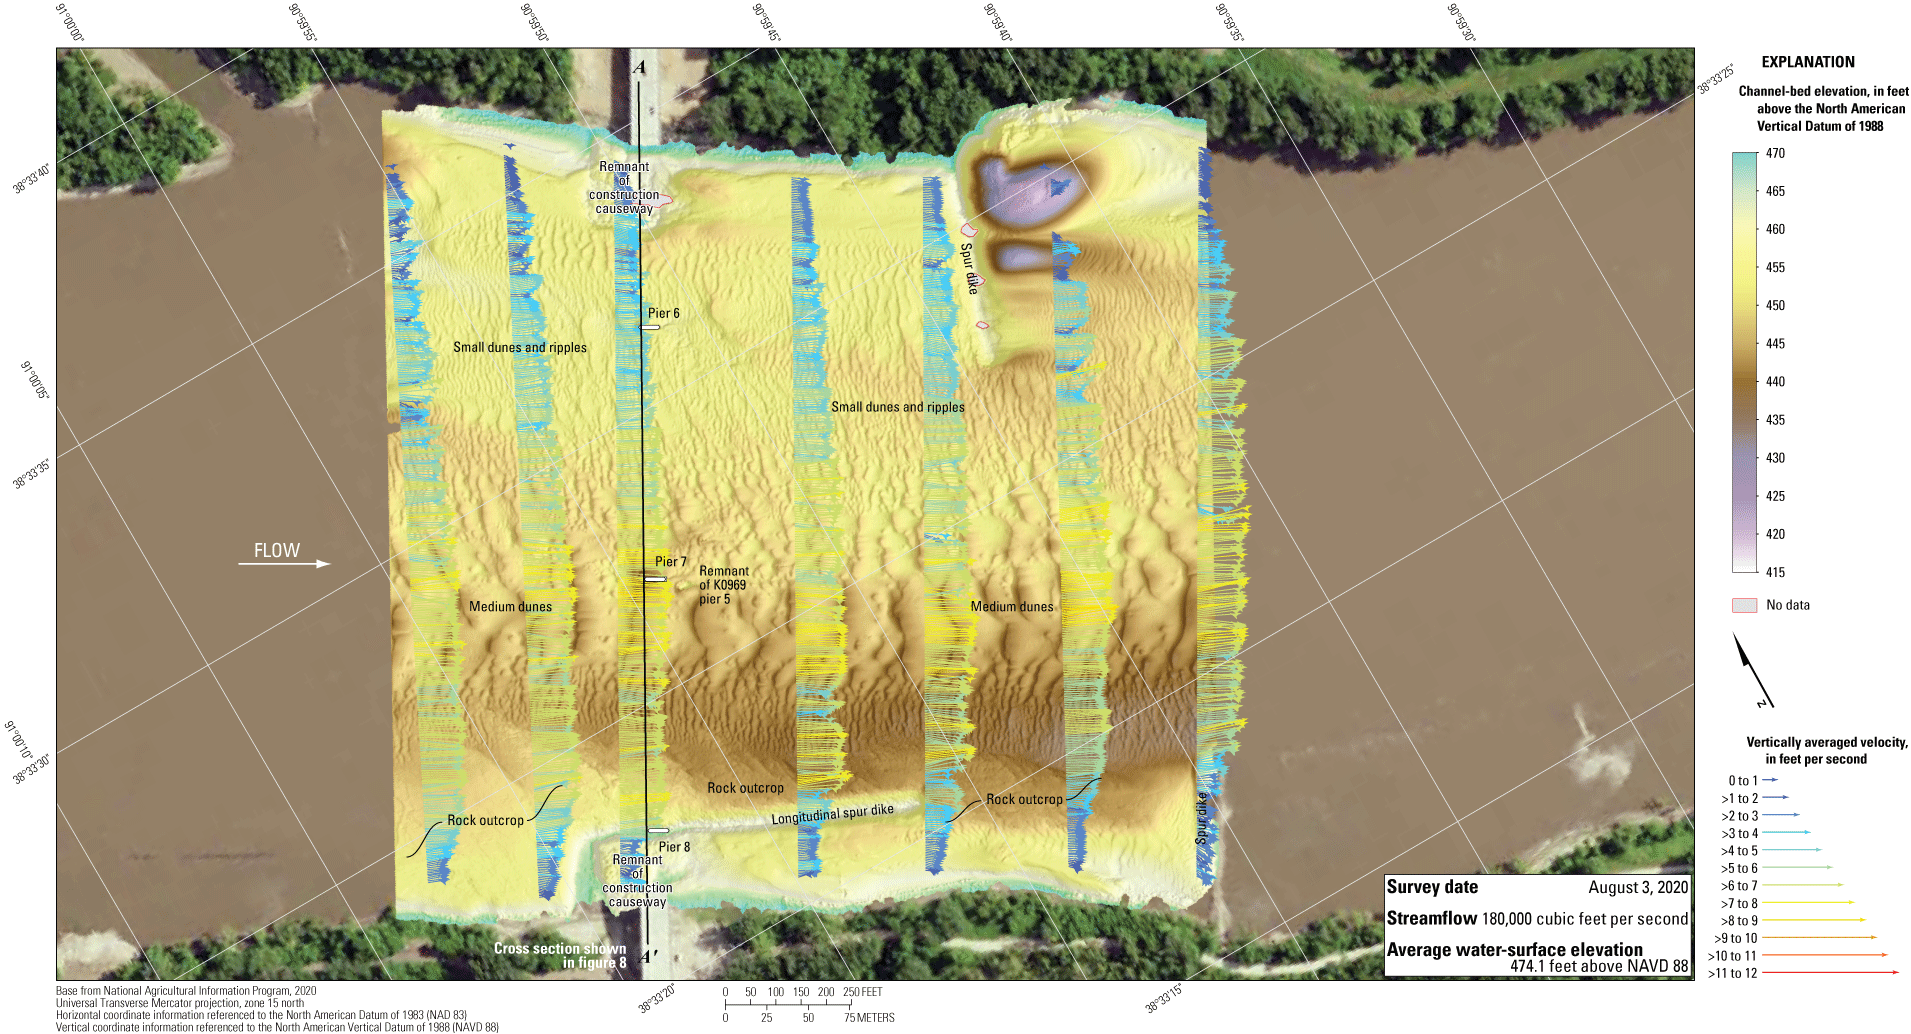
Bathymetry and vertically averaged velocities of the Missouri River channel near structure A8141 on State Highway 47 at Washington, Missouri.
Structures A7577 and A4017 on Interstate 64
Structures A7577 and A4017 (site 23; table 2) are dual bridges on Interstate 64, crossing the Missouri River at RM 43.9, on the northwestern side of the St. Louis metropolitan area (fig. 1). The site was surveyed on August 3, 2020, when the average water-surface elevation of the river in the survey area, determined by the RTK GNSS tide solution, was 451.8 ft (table 6; fig. 12), and streamflow was about 151,000 ft3/s during the survey (table 6).
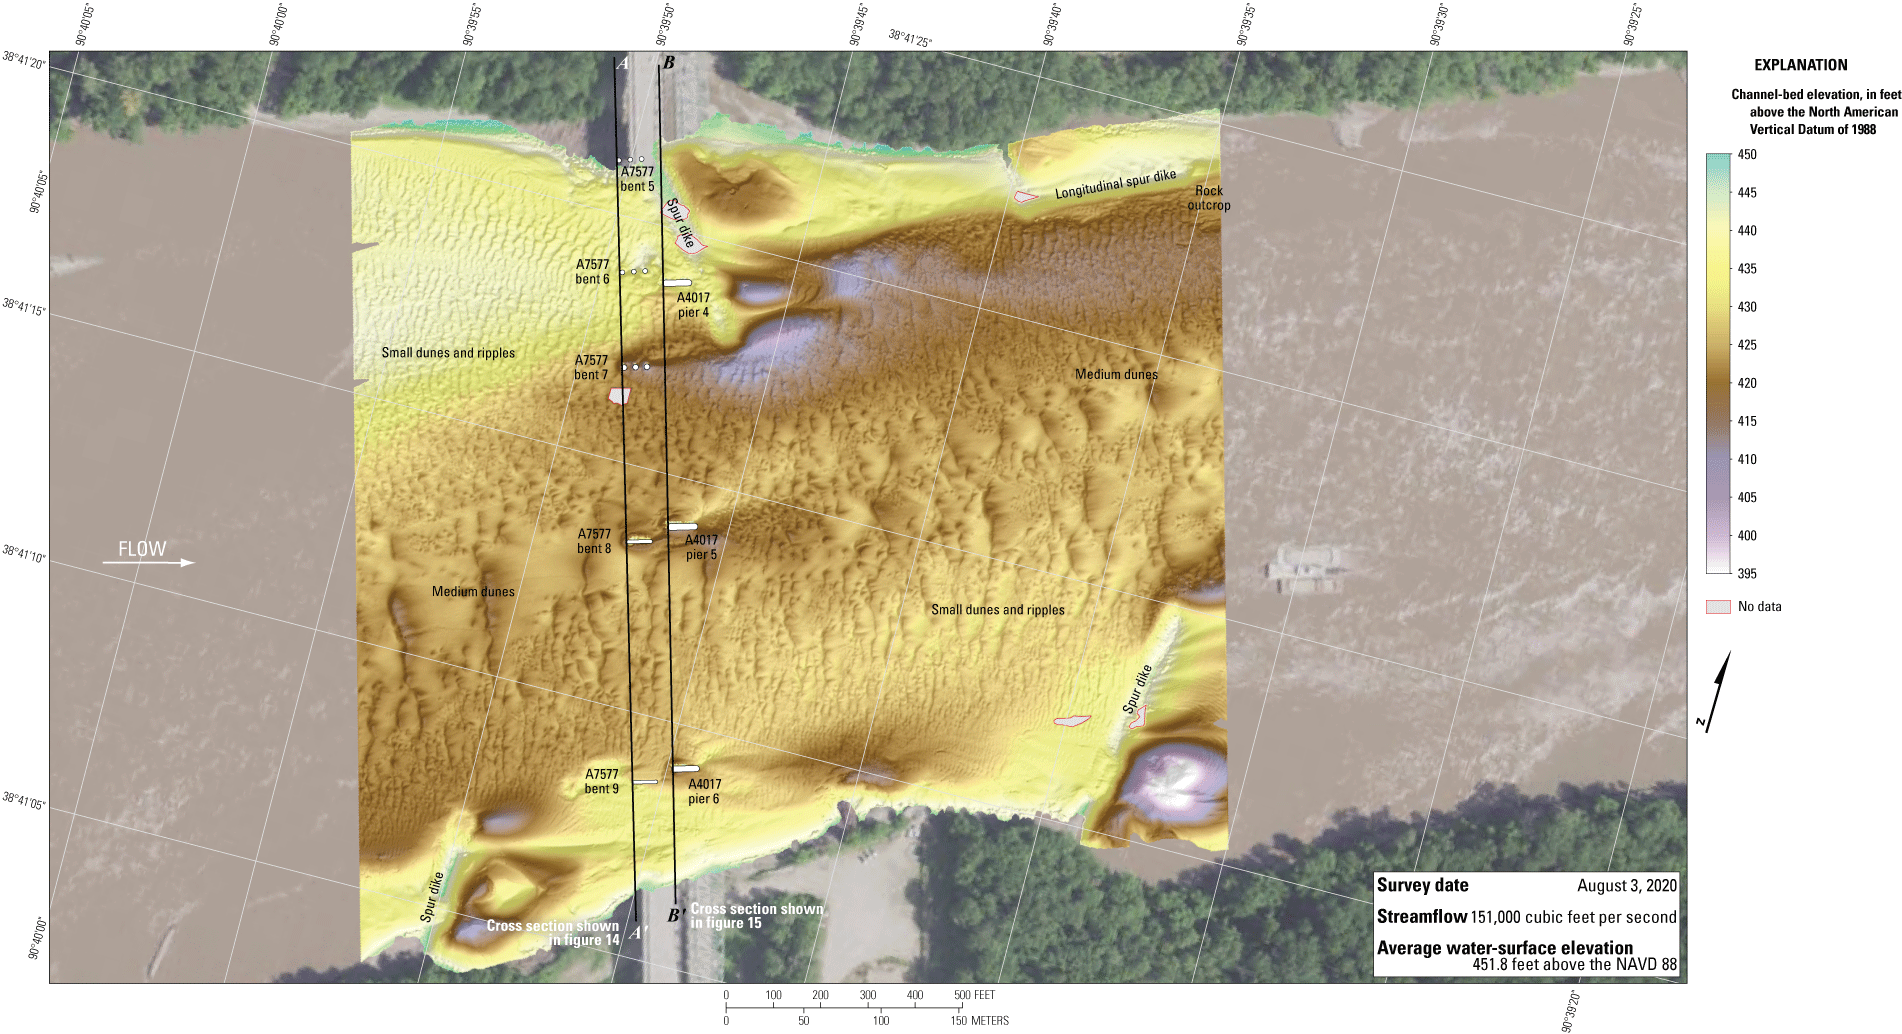
Bathymetric survey of the Missouri River channel near structures A7577 and A4017 on Interstate 64 near St. Louis, Missouri.
The survey area was about 1,840 ft long and about 1,590 ft wide, extending across the active channel from bank to bank (fig. 12). The survey area extended about 620 ft upstream from the centerline of structures A7577 and A4017 (fig. 12). The channel-bed elevations ranged from about 416 to 440 ft throughout the survey area (5th to 95th percentile range of the bathymetric data; fig. 13), except near some of the main channel piers of structures A7577 and A4017 and near the streamside tips of or downstream from various spur dikes (fig. 12; table 6). The construction causeway on the left bank between bents 5 and 6 and extending about 100 ft upstream from structure A7577 in the 2016 survey seems to have been completely removed (fig. 12) leaving bent 5 on the left bank just upstream from a spur dike. A series of medium dunes were present in the middle of the channel, which crosses from the right bank towards the left bank in the surveyed area (fig. 12). Numerous small dunes and ripples were present throughout the rest of the channel (fig. 12).
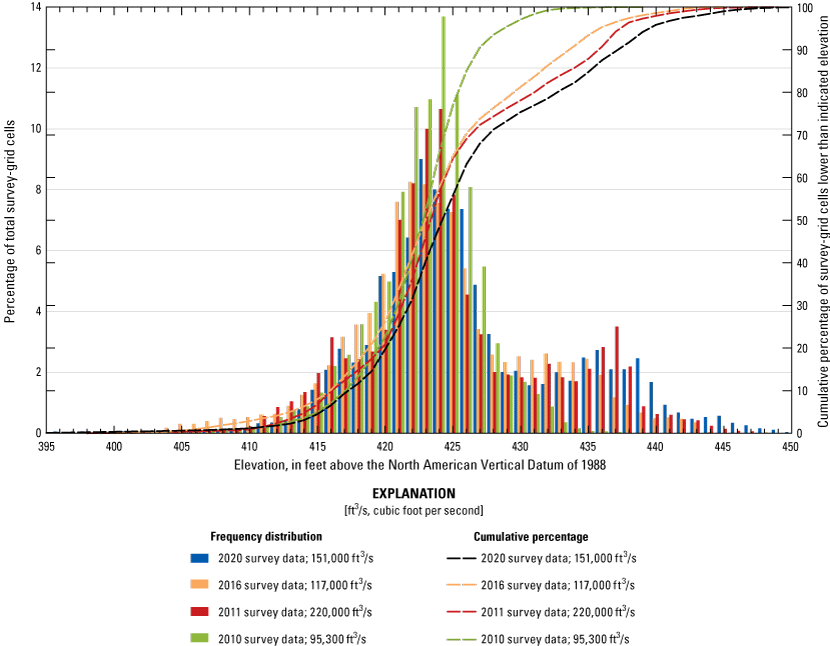
Frequency distribution of bed elevations for bathymetric survey-grid cells in 1-foot elevation bins on the Missouri River near structures A7577 and A4017 on Interstate 64 near St. Louis, Missouri, on August 3, 2020, compared to previous surveys in 2010, 2011, and 2016 (Huizinga, 2011, 2012, 2017a, respectively).
Small to moderate scour holes were observed near the bents and piers in the main channel, particularly bents 7 and 8 of structure A7577 and piers 5 and 6 of structure A4017 (fig. 12, 1.2). The scour hole near bent 7 of structure A7577 had a minimum channel-bed elevation of about 412 ft (fig. 14; table 7), which is about 9 ft below the average channel-bed elevation upstream from the scour hole (table 7). The scour hole near bent 8 of structure A7577 had a minimum channel-bed elevation of about 417 ft, which is about 5 ft below the average channel-bed elevation upstream from the scour hole (table 7). Information from bridge plans indicate that all the main channel bents of structure A7577 (bents 6–9) are shafts drilled 15–16 ft into bedrock, and the thickness of bed material between the bottom of the scour holes and bedrock ranges from 26 to 71 ft because of the sloping bedrock (table 7; fig. 14). The scour hole near pier 5 of structure A4017 had a minimum channel-bed elevation of about 413 ft (fig. 15; table 7), which is about 8 ft below the average channel-bed elevation upstream from the scour hole (table 7). The scour hole near pier 6 of structure A4017 had a minimum channel-bed elevation of about 416 ft, which is about 5 ft below the average channel-bed elevation upstream from the pier (table 7). Information from bridge plans indicate that both main channel piers 5 and 6 of structure A4017 are shafts drilled 13–26 ft into bedrock whereas pier 4 is a footing on bedrock; the thickness of bed material between the bottom of the scour holes and bedrock ranges from 21 to 56 ft because of the sloping bedrock (table 7; fig. 15).
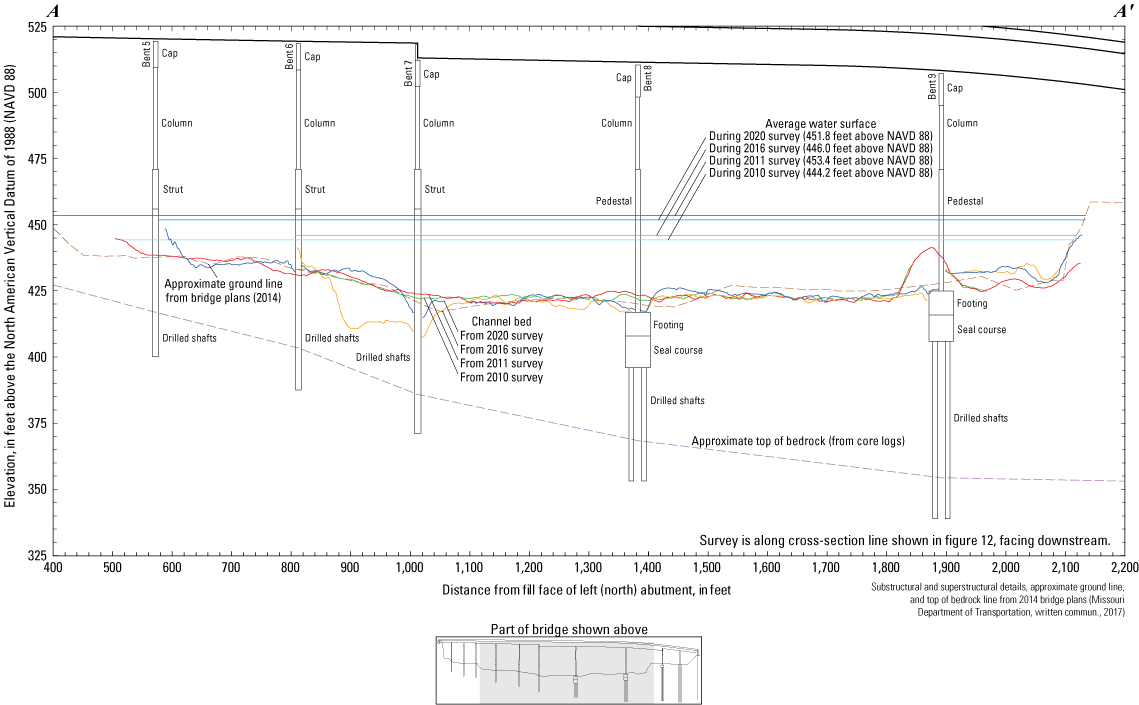
Key features, substructural and superstructural details, and surveyed channel bed of structure A7577 on Interstate 64 crossing the Missouri River near St. Louis, Missouri.
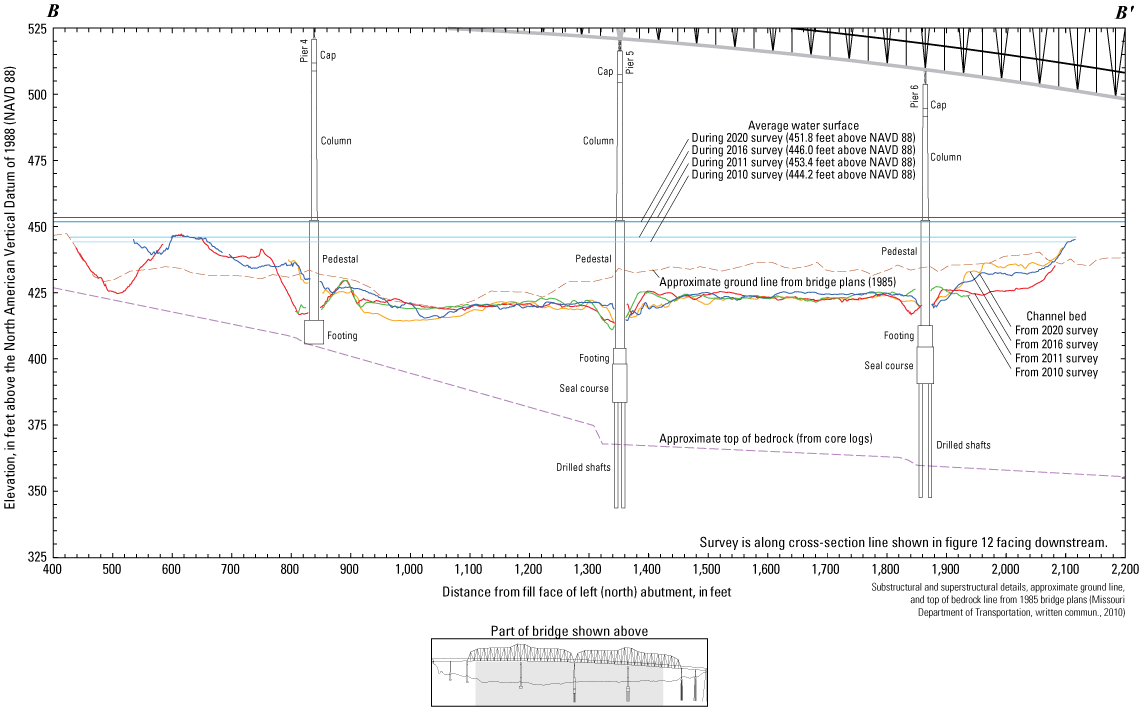
Key features, substructural and superstructural details, and surveyed channel bed of structure A4017 on Interstate 64 crossing the Missouri River near St. Louis, Missouri.
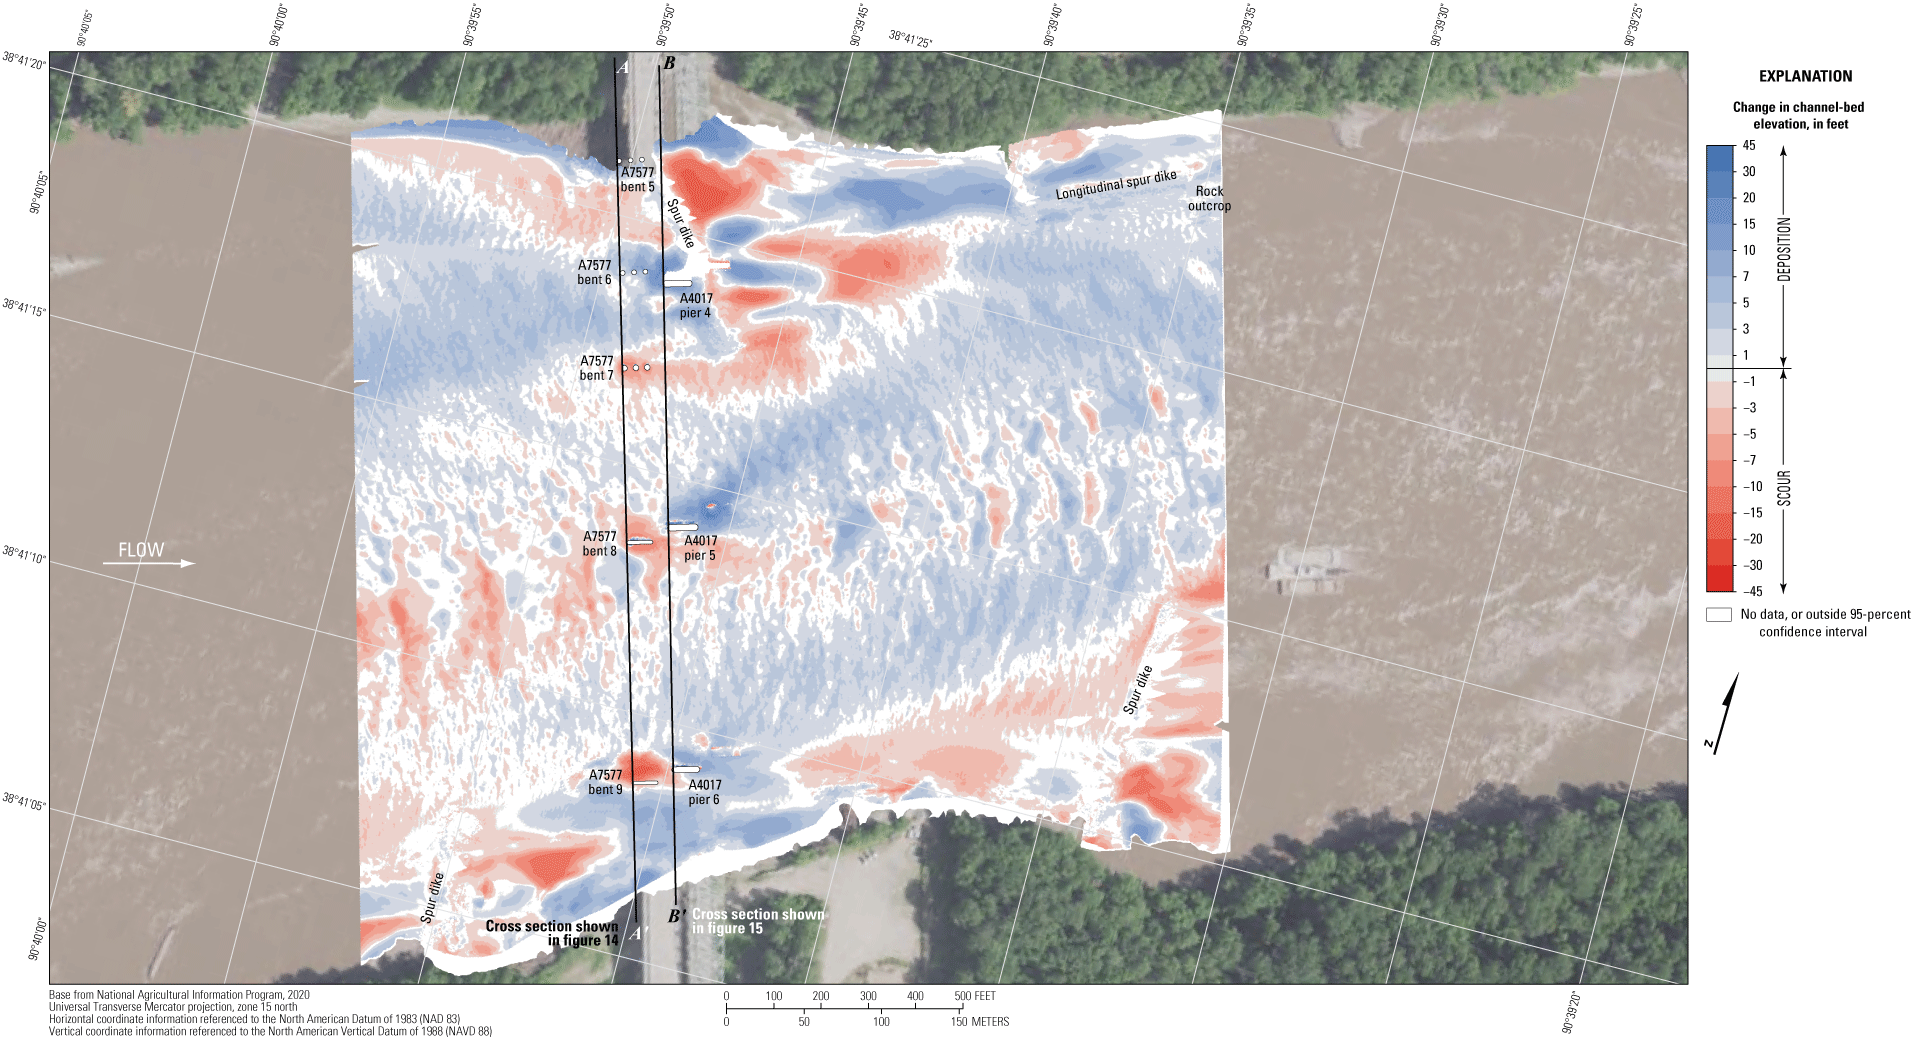
The difference between the survey on August 3, 2020, and the previous survey on May 23, 2016 (fig. 16), indicates about 87 percent of the joint area of interest had detectable change, which means about 13 percent of the differences in the joint area of interest are equivocal and within the bounds of uncertainty (table 8). Deposition seems dominant throughout most of the reach between 2016 and 2020 in the DoD, except along the right (south) bank and in the area near where the construction causeway existed in 2016 (fig. 16). However, the substantial scour hole along the edge of the causeway in 2016 was filled in 2020 (fig. 16). The average difference between the bathymetric surfaces was +1.35 ft (table 8), indicating moderate channel aggradation between the 2016 and 2020 surveys. The net volume of cut in the reach from 2016 to 2020 was about 72,100 yd3, and the net volume of fill was about 188,000 yd3, resulting in a net gain of about 115,900 yd3 of sediment between 2016 and 2020 (table 8). The cross section from the 2020 survey along the upstream face of the bridges generally varies above and below the 2016 survey section, except near the left bank for the upstream bridge (fig. 14) near the construction causeway in 2016. The frequency distribution of bed elevations in 2020 seems similar in shape to 2016 but with a higher percentage of cells at higher channel-bed elevations (fig. 13). The rock outcrop on the north (left) bank downstream from the bridge showed localized signs of minor scour and deposition, and the various spur dikes throughout the channel showed minor scour on one face and deposition on the other (fig. 16). Like with previous DoDs, deposition or scour apparent on opposing faces of a feature likely results from minor horizontal positional variances between the surveys (see “Uncertainty Estimation” section).
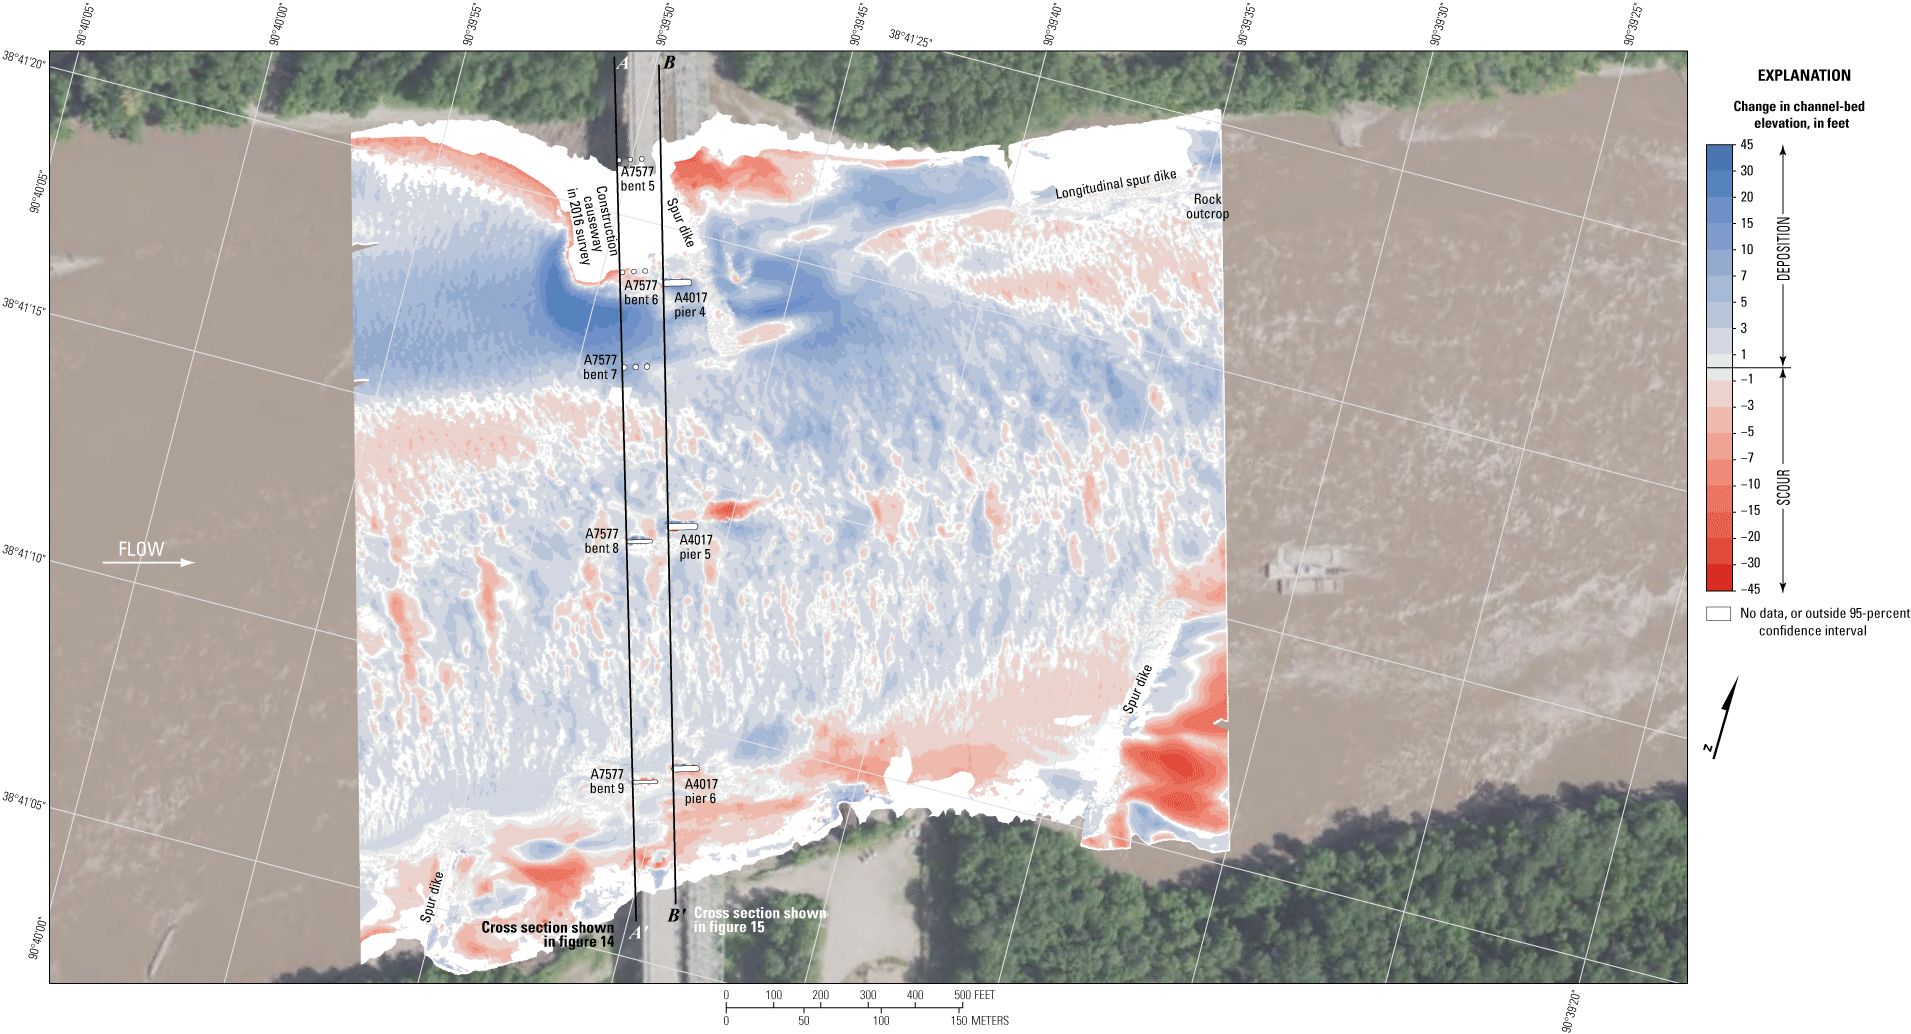
Difference between surfaces created from bathymetric surveys of the Missouri River channel near structures A7577 and A4017 on Interstate 64 near St. Louis, Missouri, on August 3, 2020, and May 23, 2016, with probabilistic thresholding.
The difference between the survey on August 3, 2020, and the flood survey on July 29, 2011 (fig. 17), indicates about 80 percent of the joint area of interest had detectable change, which means about 20 percent of the differences in the joint area of interest are equivocal and within the bounds of uncertainty (table 8). Deposition seems dominant throughout most of the reach between 2011 and 2020 in the DoD, except for localized substantial erosion in the channel thalweg and downstream from the spur dikes on both banks (fig. 17). The average difference between the bathymetric surfaces was +1.20 ft (table 8), again indicating moderate channel aggradation between the 2011 and 2020 surveys, and the net gain of sediment between 2011 and 2020 was about 99,100 yd3, which is less than but consistent with the net gain of sediment between 2016 and 2020 (table 8). The cross section from the 2020 survey along the upstream face of bridges generally varies above and below the 2011 survey section, except near a pile of material near the right bank of structure A7577 (fig. 14) and near pier 4 of structure A4017 (fig. 15). The frequency distribution of bed elevations in 2020 seems similar in shape to 2011, which is similar to 2016, again with a higher percentage of cells at higher channel-bed elevations (fig. 13). The rock outcrop on the north (left) bank downstream from the bridge showed localized signs of minor deposition, and the various spur dikes throughout the channel showed minor scour on one face and deposition on the other (fig. 17). Like with previous DoDs, deposition or scour apparent on opposing faces of a feature likely results from minor horizontal positional variances between the surveys (see “Uncertainty Estimation” section).
Difference between surfaces created from bathymetric surveys of the Missouri River channel near structures A7577 and A4017 on Interstate 64 near St. Louis, Missouri, on August 3, 2020, and July 29, 2011, with probabilistic thresholding.
The difference between the survey on August 3, 2020, and the earliest survey on October 18, 2010 (fig. 18), indicates about 79 percent of the joint area of interest had detectable change, which means about 21 percent of the differences in the joint area of interest are equivocal and within the bounds of uncertainty (table 8). Scour and deposition seem nearly balanced throughout the reach between 2010 and 2020 in the DoD, except for localized scour downstream from the spur dike on the left (north) bank and localized deposition upstream from the same dike and near pier 5 of structure A4017 (fig. 18). The average difference between the bathymetric surfaces was +0.10 ft (table 8), indicating the balance of scour and deposition between the 2010 and 2020 surveys. There was a net gain of sediment between 2010 and 2020 of only about 5,800 yd3, further indicating the balance of scour and deposition between 2010 and 2020 (table 8). The frequency distribution of bed elevations in 2020 seems similar in shape to 2010 below 425 ft; however, above 425 ft, the 2010 distribution has a substantially higher percentage of cells for a given elevation (fig. 13). The difference in the distribution may be the result of the substantially narrower survey area in 2010 and general lack of bank information (fig. 18). As with previous DoDs, deposition or scour apparent on opposing faces of a feature likely results from minor horizontal positional variances between the surveys (see “Uncertainty Estimation” section).
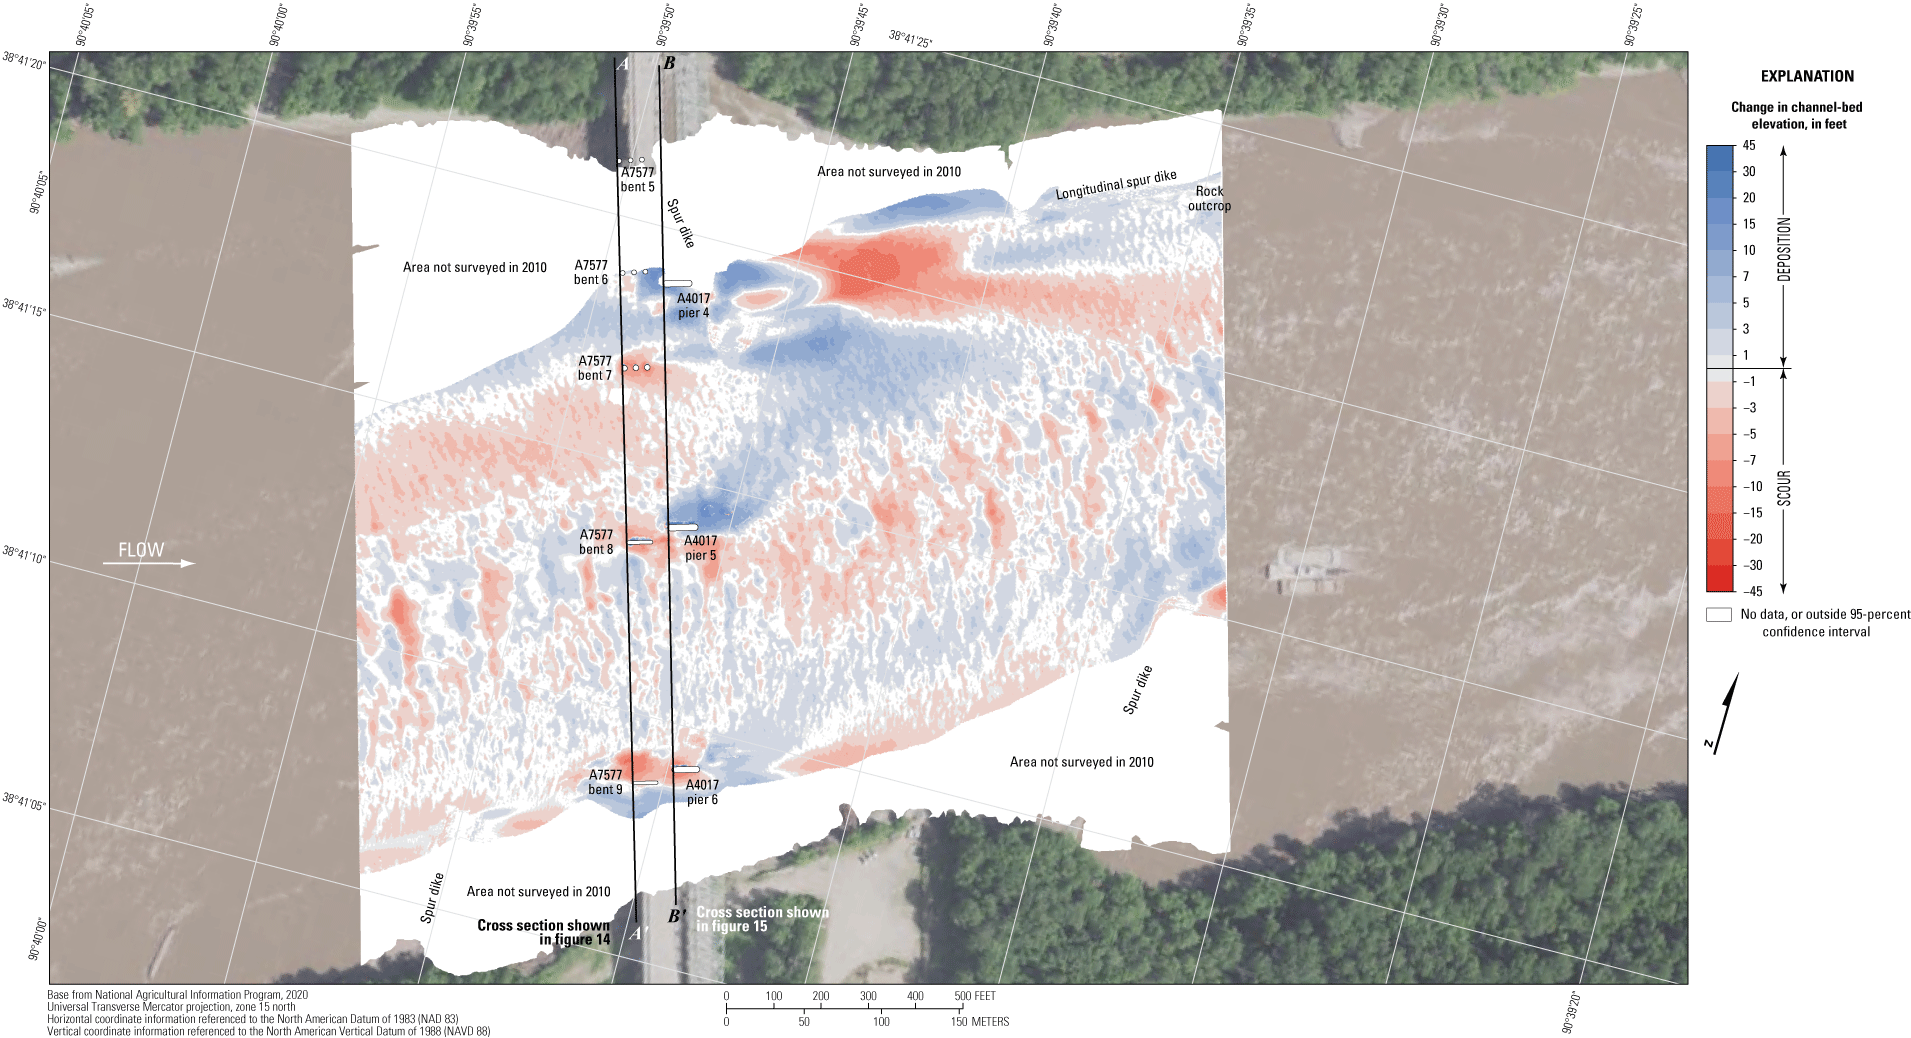
Difference between surfaces created from bathymetric surveys of the Missouri River channel near structures A7577 and A4017 on Interstate 64 near St. Louis, Missouri, on August 3, 2020, and October 18, 2010, with probabilistic thresholding.
The vertically averaged velocity vectors, which ranged from about 4 to 9 ft/s, indicate mostly uniform flow in the middle of the channel (fig. 19). Local lower velocities and turbulence were observed downstream from the various spur dikes on both banks (fig. 19). The wake vortices downstream from the main channel piers and bents were not pronounced and seemed to be no greater than the general nonuniformity of flow observed in the channel (fig. 19). Minor localized turbulence was present in all the sections (fig. 19).
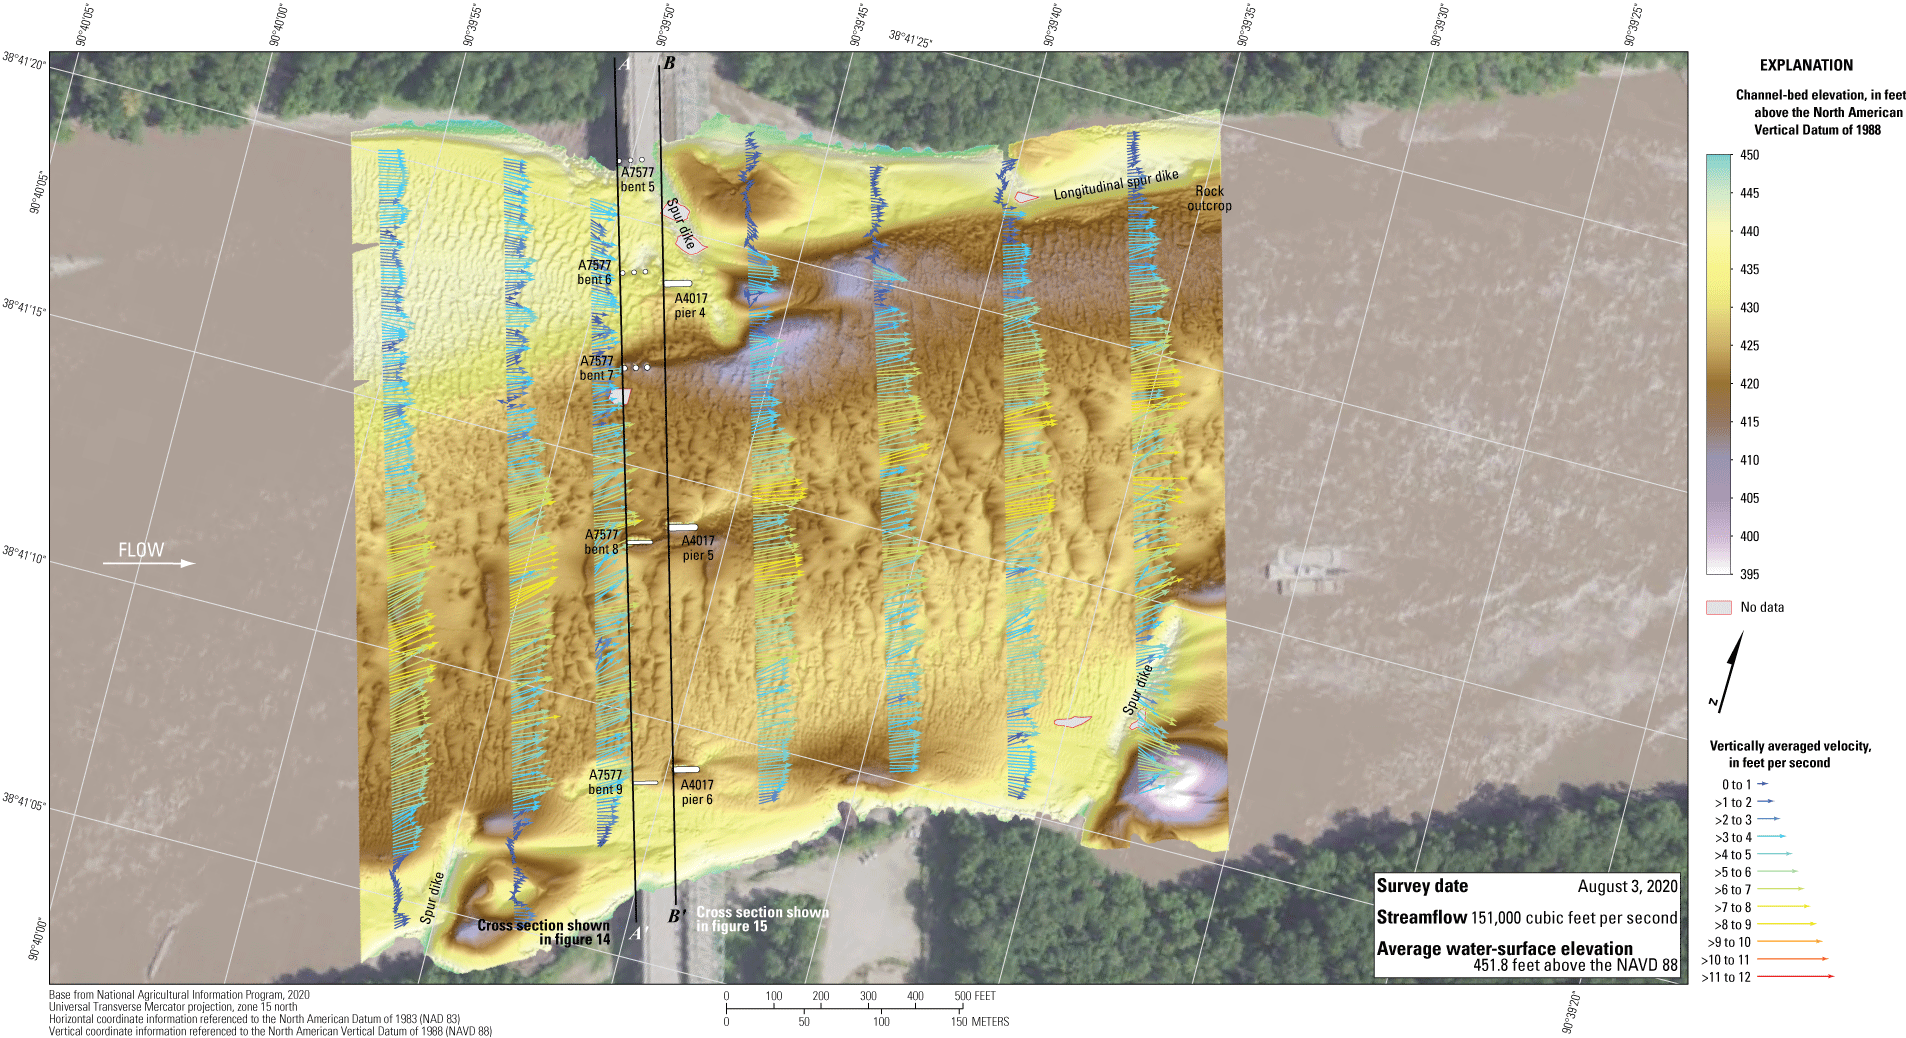
Bathymetry and vertically averaged velocities of the Missouri River channel near structures A7577 and A4017 on Interstate 64 near St. Louis, Missouri.
Dual Bridge Structure A5585 on State Highway 364
Structure A5585 (site 24; table 2) consists of twin bridges on State Highway 364, crossing the Missouri River at RM 32.7, on the northwestern side of the St. Louis metropolitan area (fig. 1). The site was surveyed on August 4, 2020, when the average water-surface elevation near the bridge, determined by the RTK GNSS tide solution, was 438.5 ft (table 6; fig. 20), and streamflow was measured at about 132,000 ft3/s during the survey (table 6), which does not account for flow through a side channel near the site.
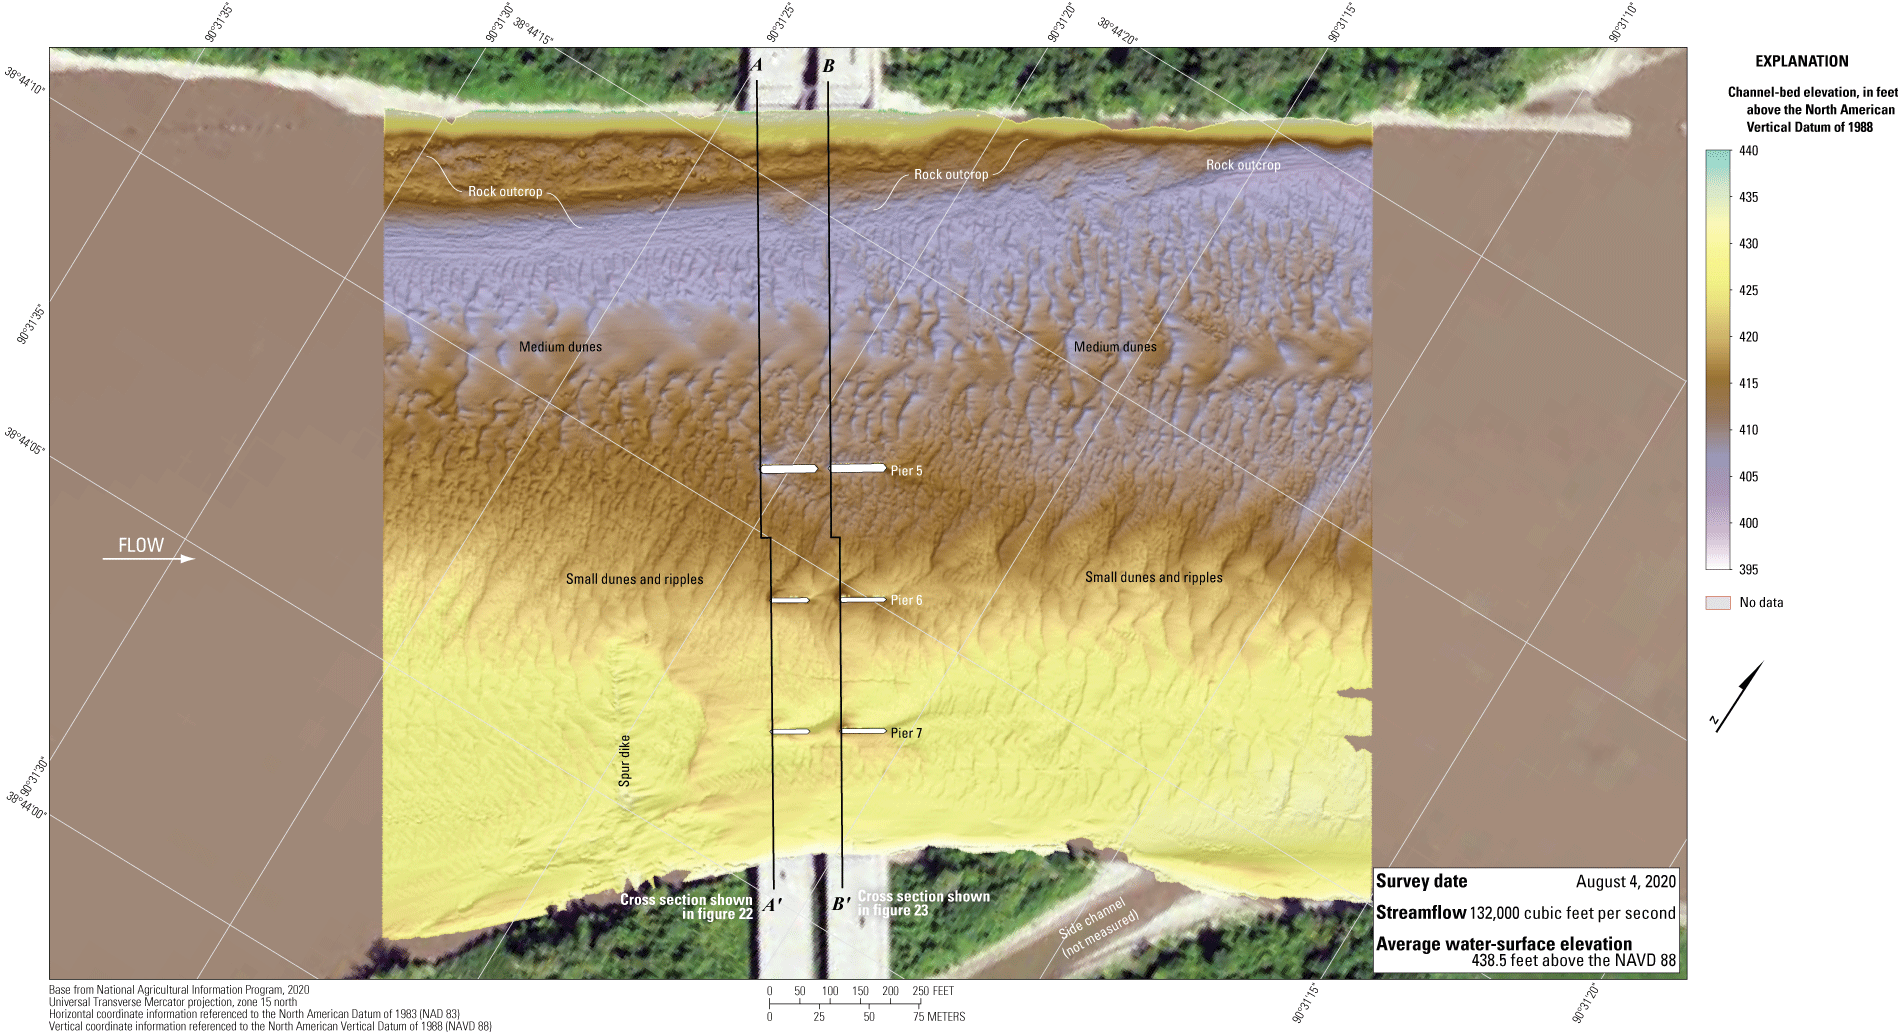
Bathymetric survey of the Missouri River channel near dual bridge structure A5585 on State Highway 364 near St. Louis, Missouri.
The survey area was about 1,640 ft long and about 1,300 ft wide, extending from bank to bank in the main channel (fig. 20). The survey area extended about 720 ft upstream from the centerline of dual bridge structure A5585 at pier 5 (fig. 20). The approximate channel-bed elevations ranged from about 407 to 428 ft for most of the surveyed area (5th to 95th percentile range of the bathymetric data; table 6; fig. 21), except along the channel thalweg on the left (north) bank where medium dunes caused local approximate minimum channel-bed elevations of about 404 ft (fig. 20; table 6). The thalweg was along the outside of the river bend on the left (north) bank and was about 10 to 15 ft deeper than the bed in the middle of the channel (fig. 20). Numerous medium to small dunes and ripples were present throughout the channel (fig. 20). Like in previous surveys (Huizinga, 2011, 2012, 2017a), a rock outcrop was present on the left (north) bank throughout the reach (fig. 20).
Frequency distribution of bed elevations for bathymetric survey-grid cells in 1-foot elevation bins on the Missouri River near dual bridge structure A5585 on State Highway 364 near St. Louis, Missouri, on August 4, 2020, compared to previous surveys in 2010, 2011, and 2016 (Huizinga, 2011, 2012, 2017a, respectively).
Small to moderate scour holes were observed near the main channel piers of dual bridge structure A5585 (figs. 20, 1.3). The scour holes generally were about 4 to 6 ft below the average channel-bed elevation upstream from the scour hole for both the upstream and downstream piers (table 7). Information from bridge plans indicates that the main channel piers of both bridges of structure A5585 are shafts drilled 11 ft into bedrock (table 7; figs. 22, 23). Depth of bed material between bedrock and the bottom of the various scour holes at dual bridge structure A5585 ranged from 35 to 71 ft because of the sloping bedrock in the area (table 7; figs. 22, 23). The approximate minimum channel-bed elevation in each of the scour holes was substantially higher than the bottom of the seal course elevation at each pier of 371.62 ft (table 7; figs. 22, 23).
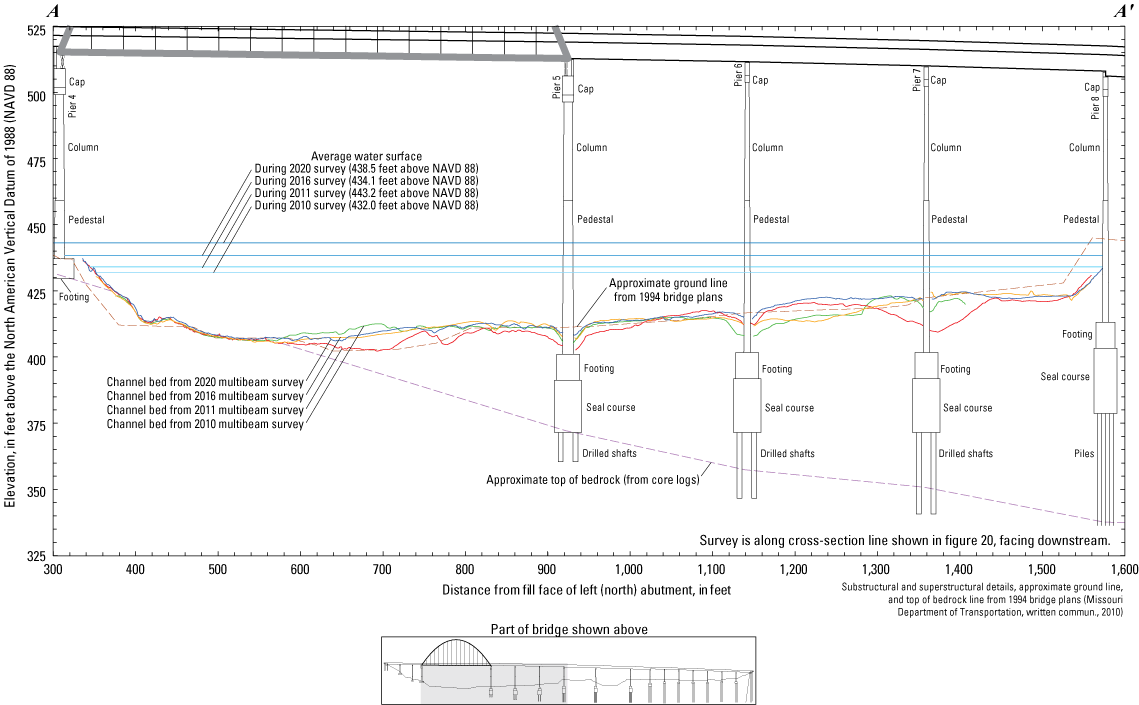
Key features, substructural and superstructural details, and surveyed channel bed of upstream structure A5585 on State Highway 364 crossing the Missouri River near St. Louis, Missouri.
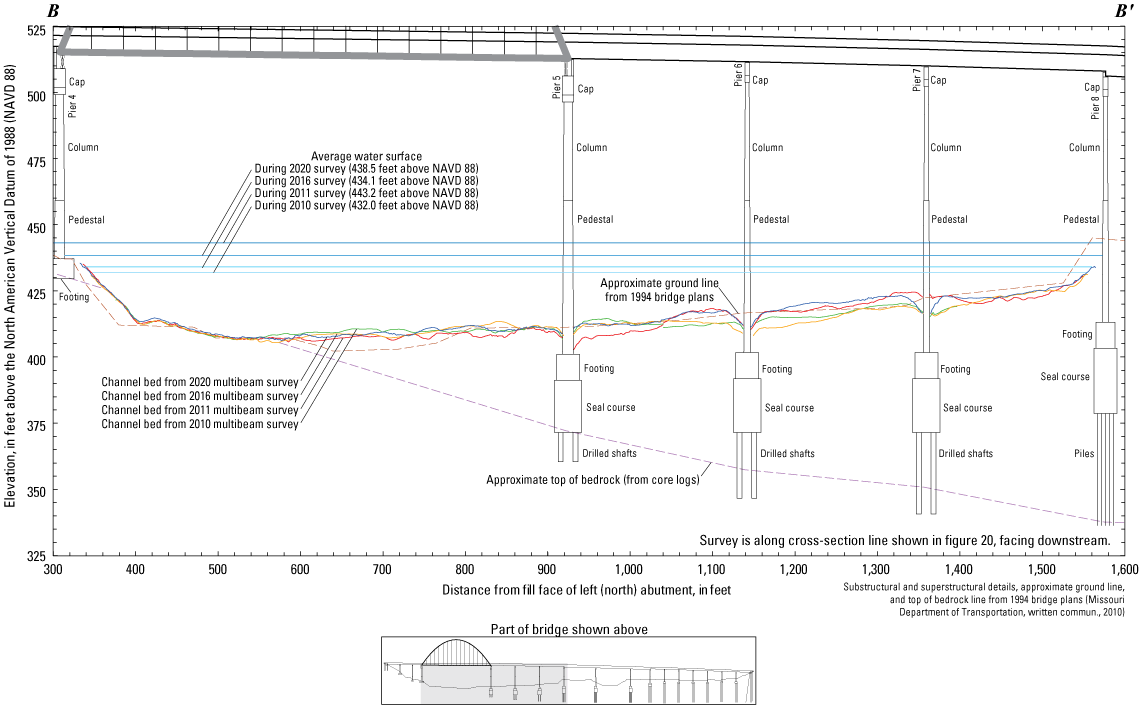
Key features, substructural and superstructural details, and surveyed channel bed of downstream structure A5585 on State Highway 364 crossing the Missouri River near St. Louis, Missouri.
The difference between the survey on August 4, 2020, and the previous survey on May 24, 2016 (fig. 24), indicates about 85 percent of the joint area of interest had detectable change, which means about 15 percent of the differences in the joint area of interest are equivocal and within the bounds of uncertainty (table 8). Deposition seems dominant throughout most of the reach between 2016 and 2020 in the DoD, except along the thalweg near the left (north) bank (fig. 24). The average difference between the bathymetric surfaces was +1.51 ft (table 8), indicating moderate to substantial channel aggradation between the 2016 and 2020 surveys. The net volume of cut in the reach from 2016 to 2020 was about 31,900 yd3, and the net volume of fill was about 126,000 yd3, resulting in a net gain of about 94,100 yd3 of sediment between 2016 and 2020 (table 8). The cross section from the 2020 survey along the upstream face of the bridges generally varies above and below the 2016 survey section, except between piers 5 and 7 of both bridges (figs. 22, 23) where the 2020 section is 5 to 10 ft higher than the 2016 section. The frequency distribution of bed elevations in 2020 seems similar in shape to 2016 but with a higher percentage of cells at higher channel-bed elevations (fig. 21). The rock outcrop on the left (north) bank showed localized signs of minor deposition, but most of the rock outcrop indicated changes within 1 ft of the 2016 elevation, or changes outside the 95-percent confidence interval (fig. 24).
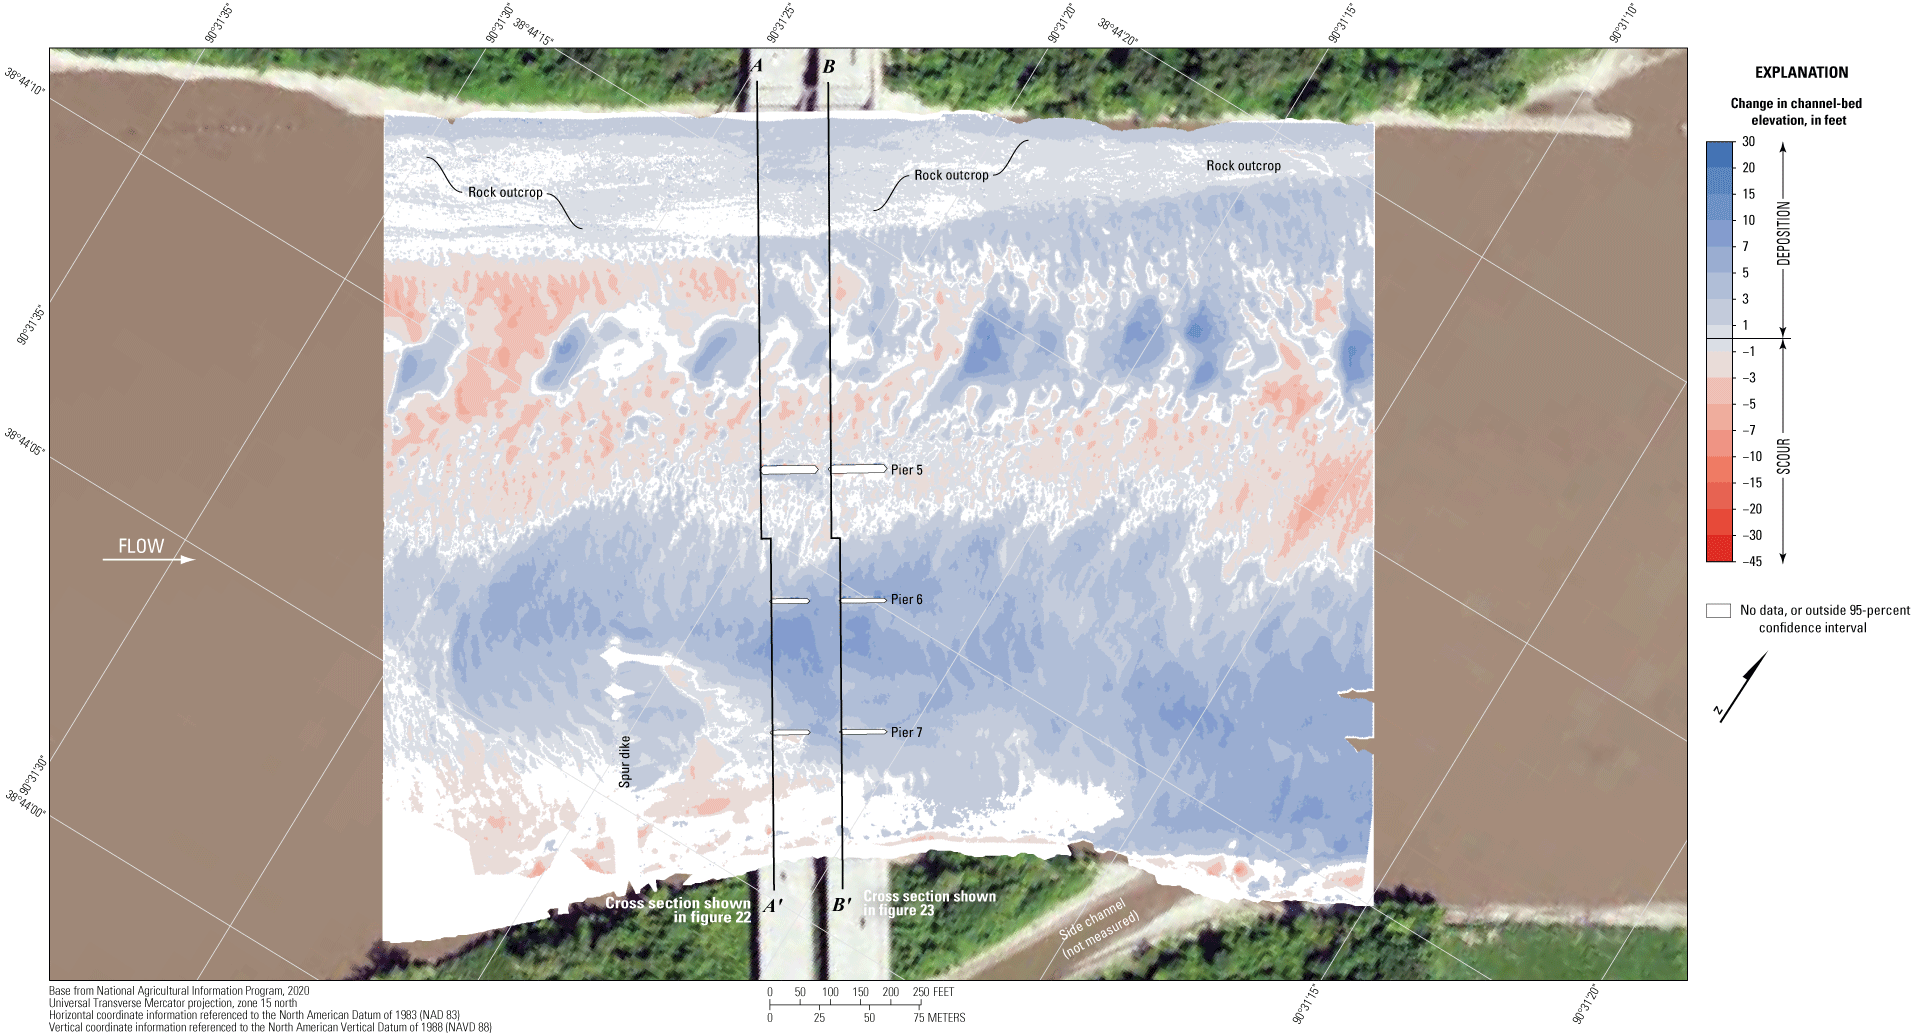
Difference between surfaces created from bathymetric surveys of the Missouri River channel near dual bridge structure A5585 on State Highway 364 near St. Louis, Missouri, on August 4, 2020, and May 24, 2016, with probabilistic thresholding.
The difference between the survey on August 4, 2020, and the flood survey on August 1, 2011 (fig. 25), indicates about 73 percent of the joint area of interest had detectable change, which means about 27 percent of the differences in the joint area of interest are equivocal and within the bounds of uncertainty (table 8). Deposition again seems dominant throughout most of the reach between 2011 and 2020 in the DoD, except for localized minor erosion throughout the channel (fig. 25) in the location of large dunes in the 2011 survey (Huizinga, 2012). The average difference between the bathymetric surfaces was +1.90 ft (table 8), again indicating moderate to substantial channel aggradation between the 2011 and 2020 surveys, and the net gain of sediment between 2011 and 2020 was about 101,800 yd3, which is more than but consistent with the net gain of sediment between 2016 and 2020 (table 8). The cross section from the 2020 survey along the upstream face of bridges generally is 5 to 15 ft higher than the 2011 survey section, except near the left bank and channel thalweg (figs. 22, 23). The frequency distribution of bed elevations in 2020 seems similar in shape to 2011, which is similar to 2016, but has a higher percentage of cells at higher channel-bed elevations (fig. 21). The rock outcrop on the left (north) bank showed localized signs of minor scour and deposition (fig. 25); however, the differences of most of the channel near the rock outcrop were equivocal.
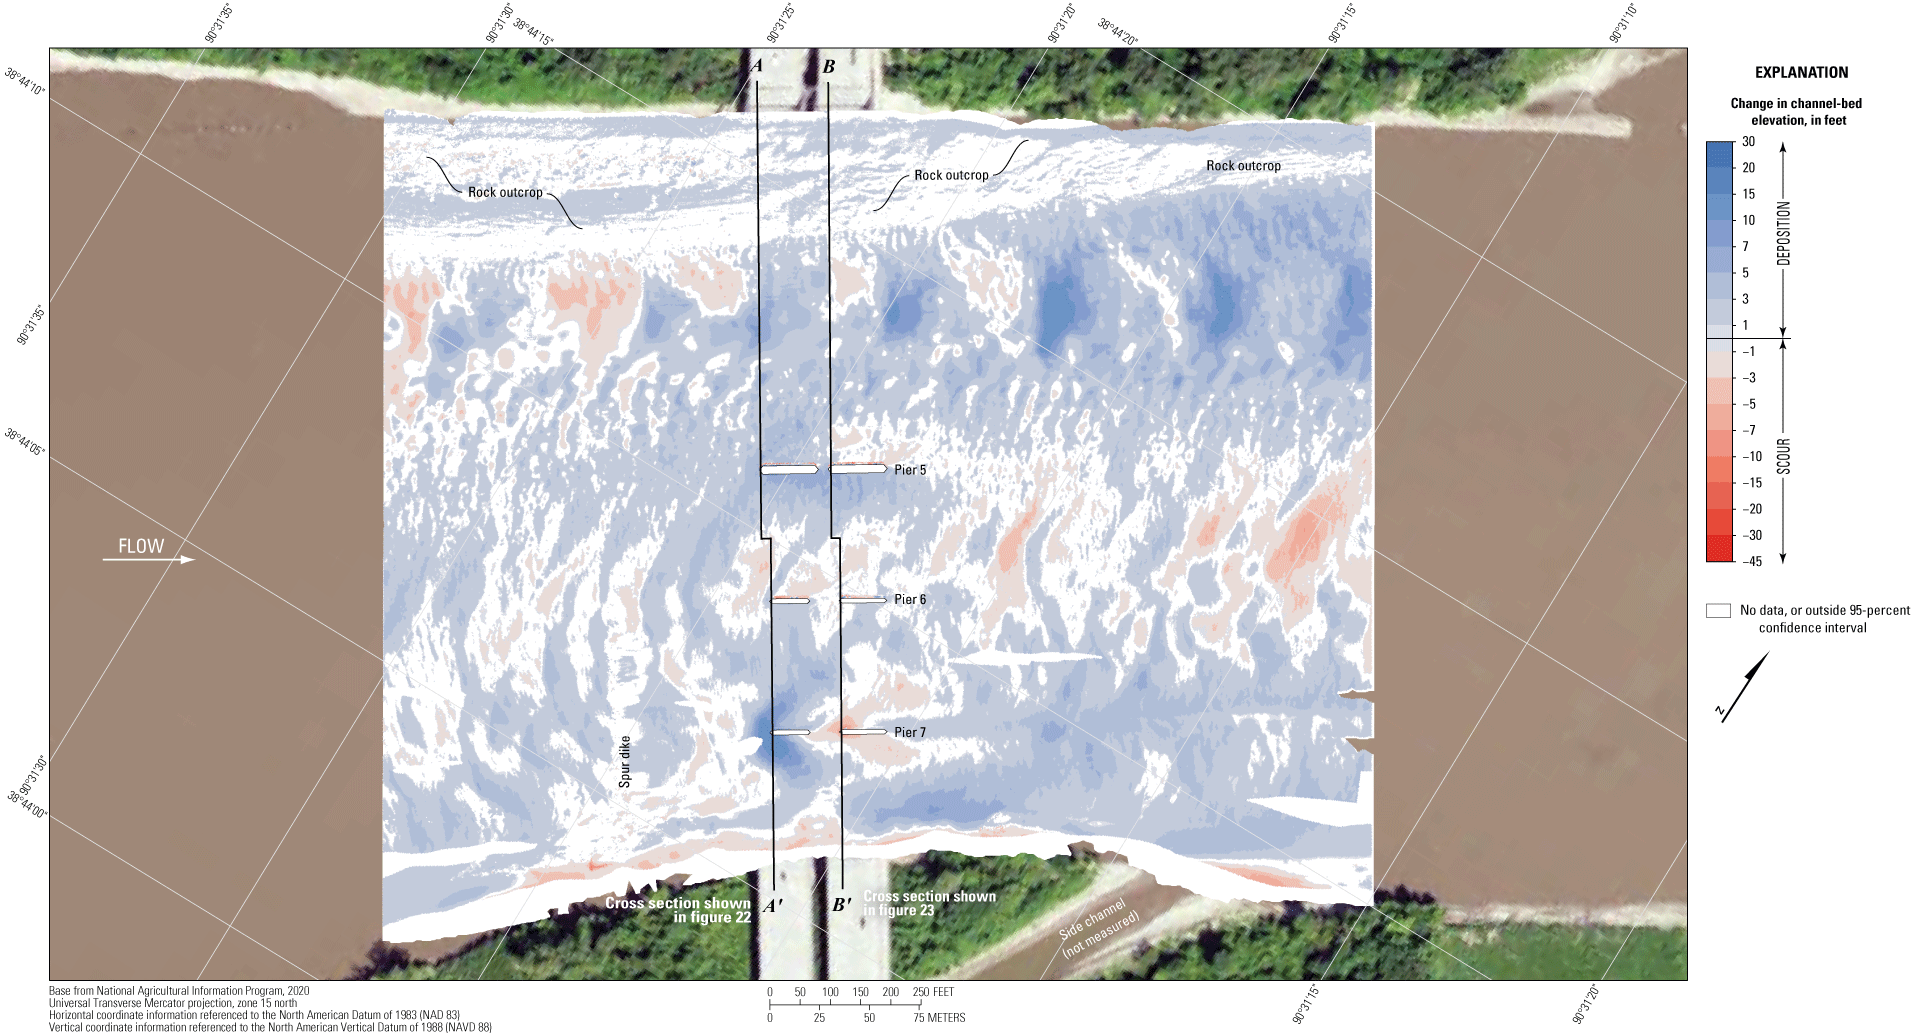
Difference between surfaces created from bathymetric surveys of the Missouri River channel near dual bridge structure A5585 on State Highway 364 near St. Louis, Missouri, on August 4, 2020, and August 1, 2011, with probabilistic thresholding.
The difference between the survey on August 4, 2020, and the earliest survey on October 21, 2010 (fig. 26), indicates about 82 percent of the joint area of interest had detectable change, which means about 18 percent of the differences in the joint area of interest are equivocal and within the bounds of uncertainty (table 8). Scour and deposition seem nearly balanced throughout the reach between 2010 and 2020 in the DoD because of more scour in the thalweg and deposition near the right (south) bank (fig. 26). The average difference between the bathymetric surfaces was +1.03 ft (table 8), indicating moderate aggradation between the 2010 and 2020 surveys. There was a net gain of sediment between 2010 and 2020 of about 46,800 yd3 (table 8). The frequency distribution of bed elevations in 2010 is substantially different from 2020, and a substantially higher percentage of cells are at lower elevations than in 2020 (fig. 21). The difference in the distribution may be the result of the substantially narrower survey area in 2010 and the general lack of bank information (fig. 26). Like with the previous DoDs, deposition or scour apparent on opposing faces of a feature likely results from minor horizontal positional variances between the surveys (see “Uncertainty Estimation” section).
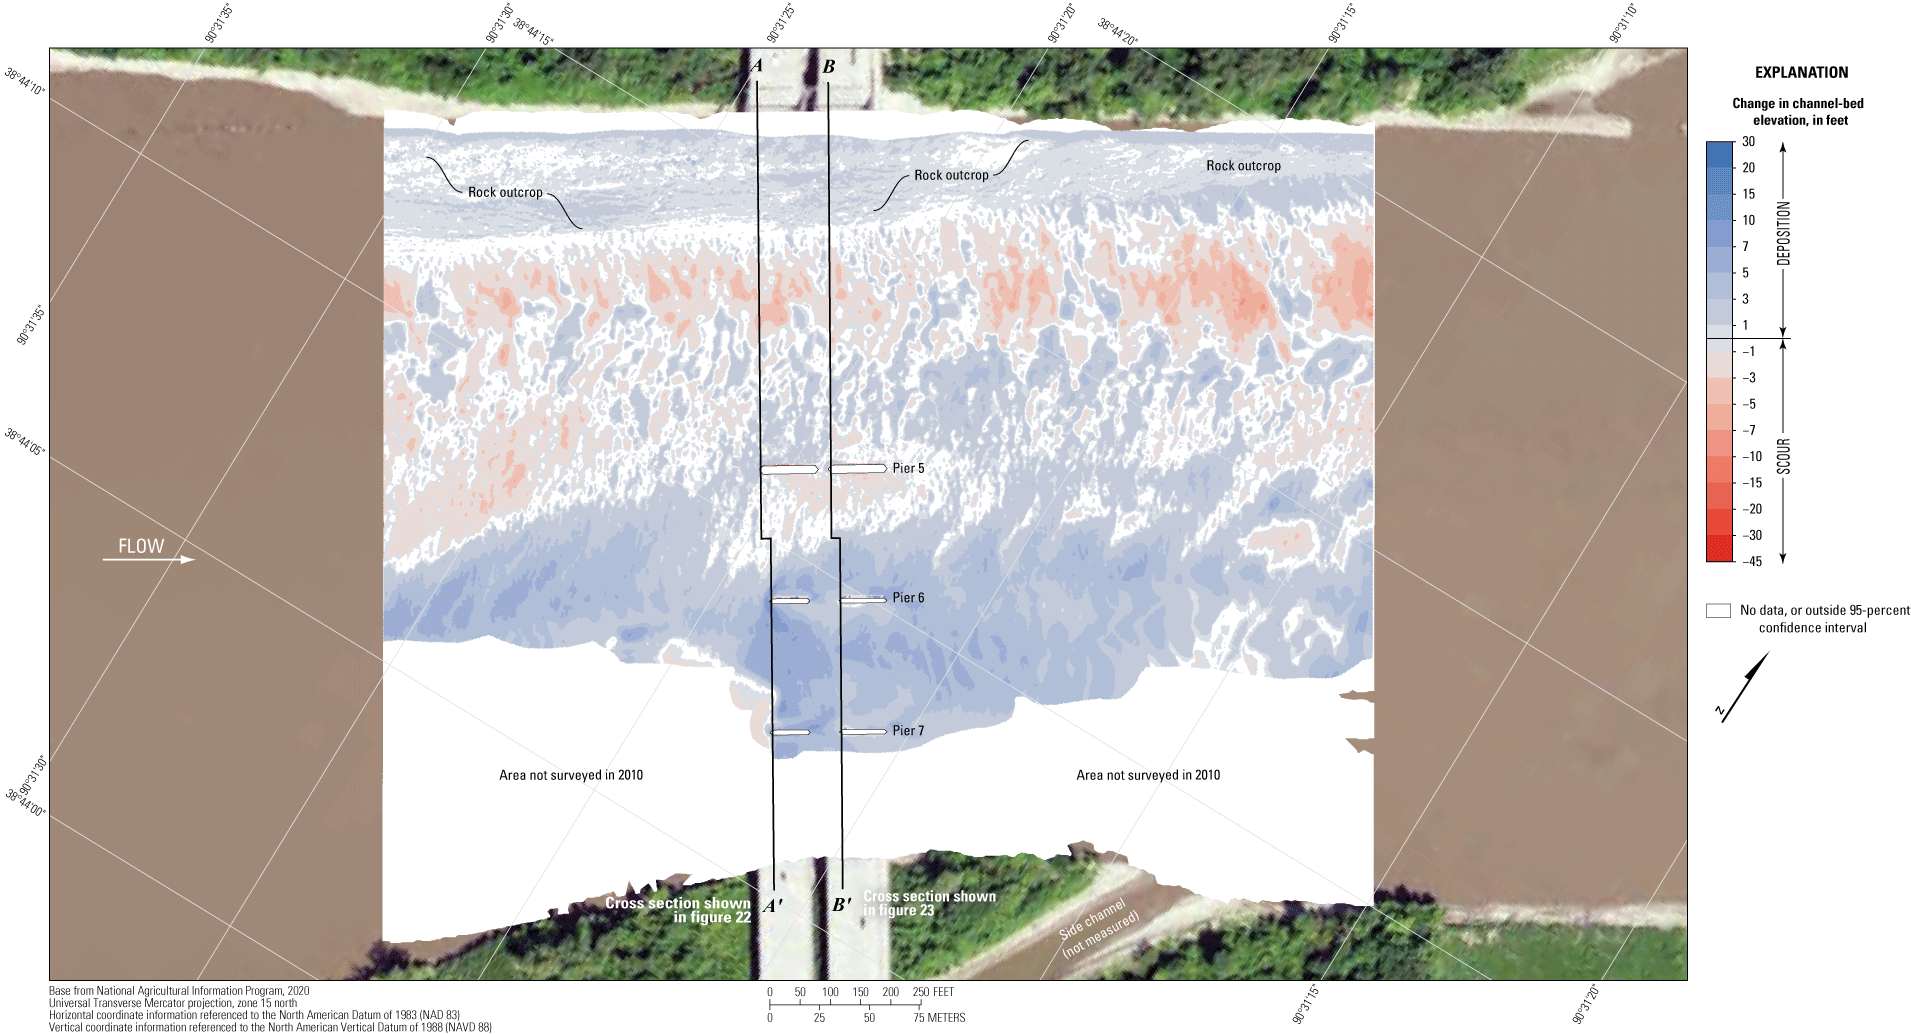
Difference between surfaces created from bathymetric surveys of the Missouri River channel near dual bridge structure A5585 on State Highway 364 near St. Louis, Missouri, on August 4, 2020, and October 21, 2010, with probabilistic thresholding.
The vertically averaged velocity vectors, which range from about 4 to 9 ft/s, indicate mostly uniform flow in the middle of the channel (fig. 27). Lower velocities and turbulence were observed on the right (south) side of the channel. The wake vortices downstream from pier 5 were slightly more substantial than at sites 22 or 23 but seemed to be no greater than the general nonuniformity of flow observed in the channel (fig. 27). Minor localized turbulence again was present in all the sections (fig. 27).
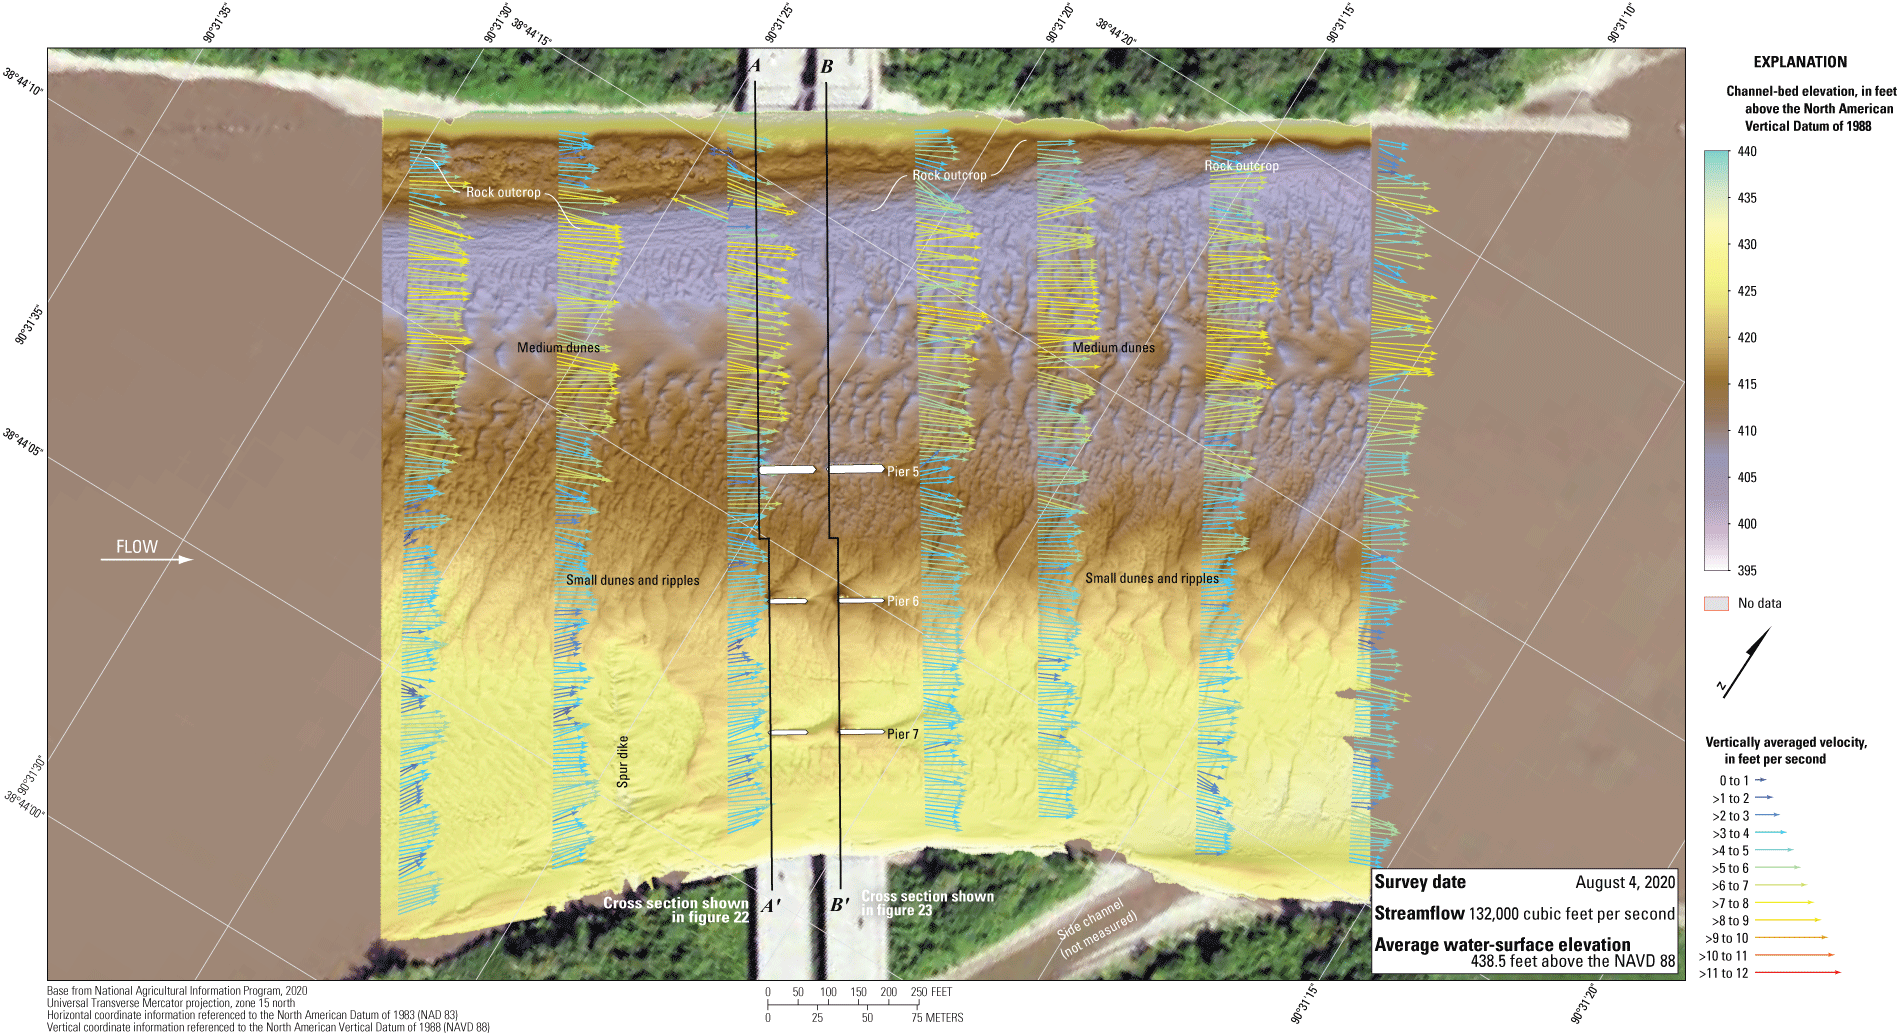
Bathymetry and vertically averaged velocities of the Missouri River channel near dual bridge structure A5585 on State Highway 364 near St. Louis, Missouri.
Structures A3292 and L0561 on Interstate 70
Structures A3292 and L0561 (site 25; table 2) are dual bridges on Interstate 70, crossing the Missouri River at RM 29.6, on the northwestern side of the St. Louis metropolitan area (fig. 1). The site was surveyed on August 4, 2020, when the average water-surface elevation of the river in the survey area, determined by the RTK GNSS tide solution, was 436.0 ft (table 6; fig. 28); and streamflow on the Missouri River was about 162,000 ft3/s during the survey (table 6).
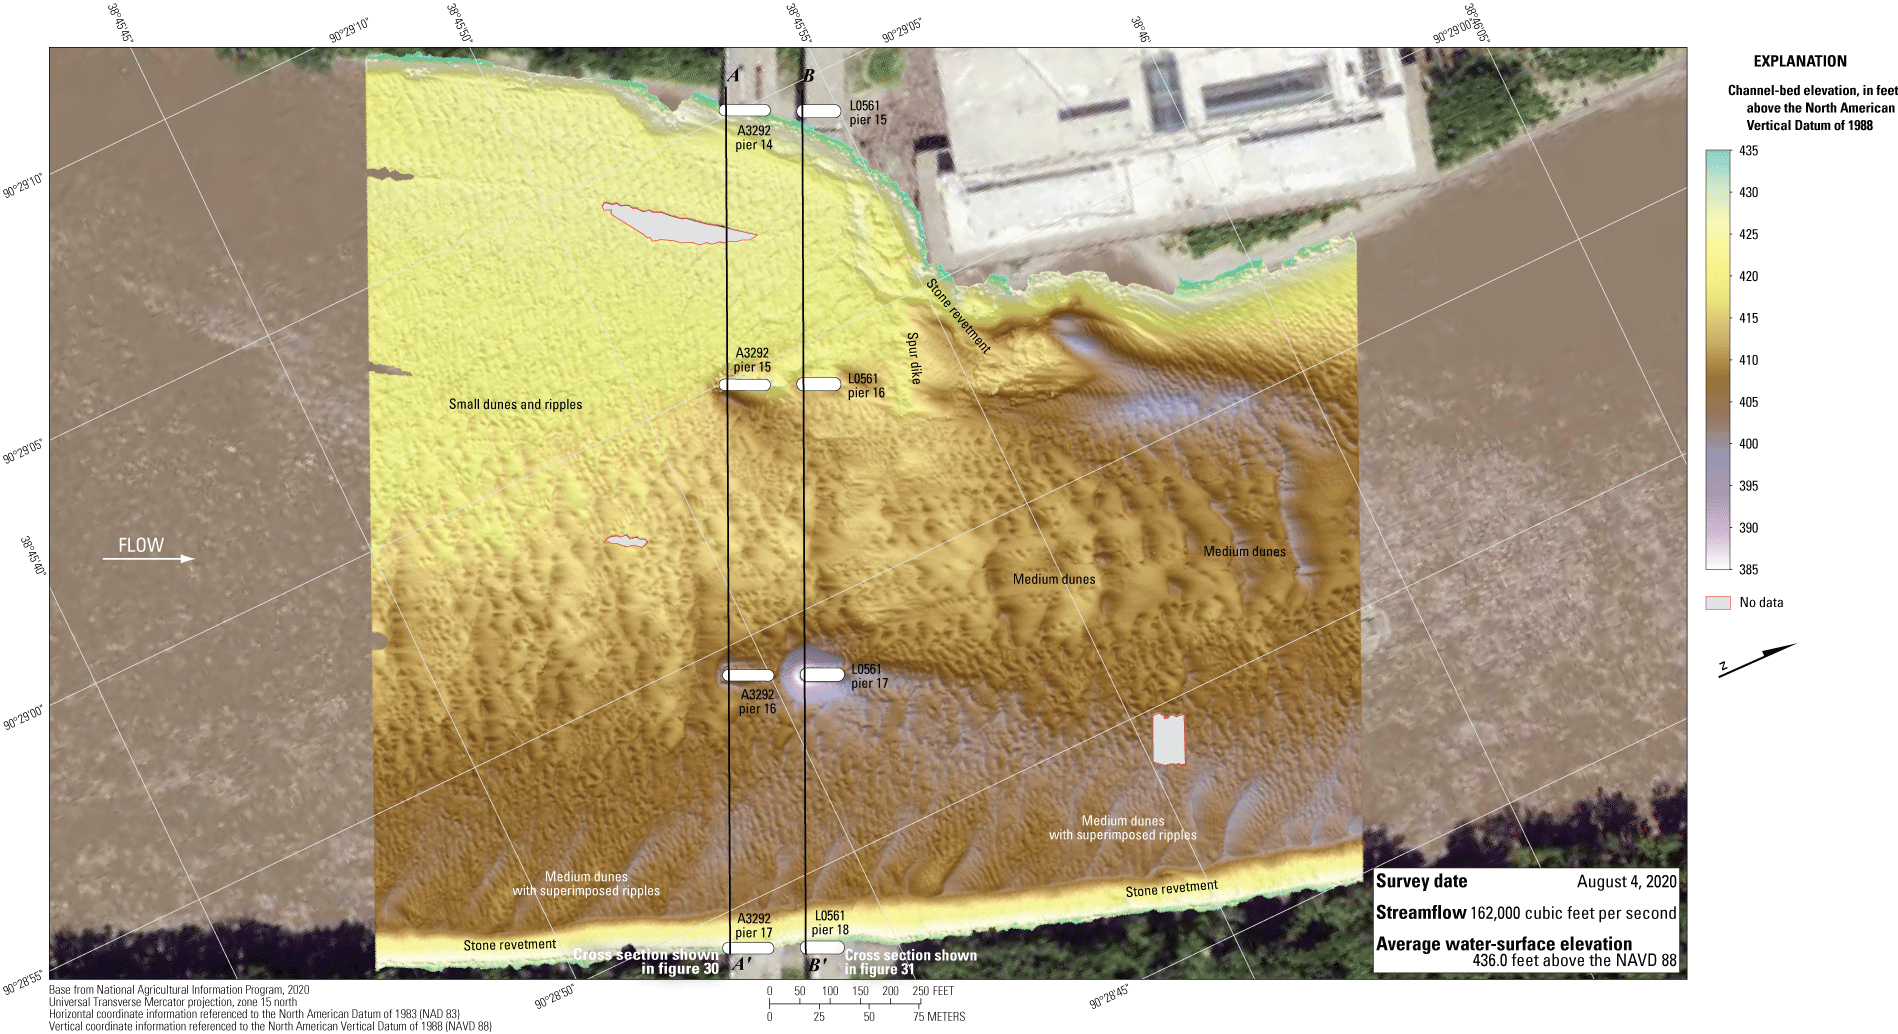
Bathymetric survey of the Missouri River channel near structures A3292 and L0561 on Interstate 70 near St. Louis, Missouri.
The survey area was about 1,840 ft long and varied in width from about 1,500 ft wide at the upstream end to about 1,050 ft wide at the downstream end, extending across the active channel from bank to bank (fig. 28). The survey area extended about 690 ft upstream from the centerline of structures A3292 and L0561 (fig. 28). The channel-bed elevations ranged from about 403 to 422 ft for most of the surveyed area (5th to 95th percentile range of the bathymetric data; table 6; fig. 29), except downstream from the spur dike on the left (northwest) bank downstream from the bridge, near the piers, and in the downstream channel thalweg along the right (southeast) bank (fig. 28; table 6). A series of medium dunes were present in the middle of the channel and in the thalweg along the right (southeast) bank throughout the reach (fig. 28). Numerous small dunes and ripples were present throughout the rest of the channel (fig. 28).
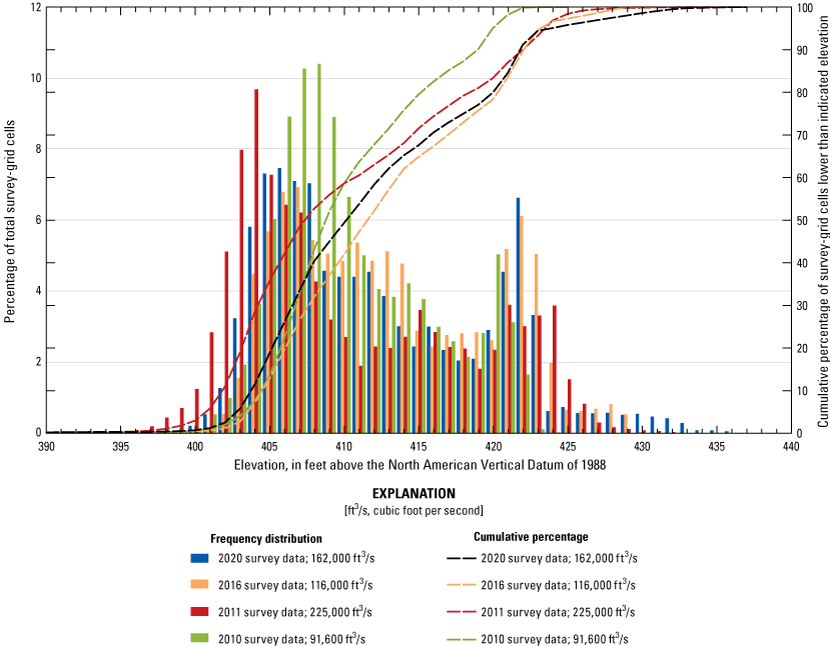
Frequency distribution of bed elevations for bathymetric survey-grid cells in 1-foot elevation bins on the Missouri River near structures A3292 and L0561 on Interstate 70 near St. Louis, Missouri, on August 4, 2020, compared to previous surveys in 2010, 2011, and 2016 (Huizinga, 2011, 2012, 2017a, respectively).
A minor scour hole near the left main channel piers (fig. 28) had an approximate minimum channel-bed elevation of about 403 ft at pier 15 of structure A3292 (fig. 30) and about 409 ft at pier 16 of structure L0561 (fig. 31; table 7), which about 12 ft below the average channel bed upstream from the scour hole near pier 15 of structure A3292 (table 7). The scour hole was deeper on the leeward right (southeast) side of pier 15 (figs. 28, 30, 1.4B, 1.4C) contrary to the general shape of scour holes for skewed piers (Arneson and others, 2012); however, this phenomenon has been observed historically at this site (see fig. 20 and “Size and Shape of Scour Holes” discussion in Huizinga [2017a]), and is likely exacerbated by debris observed at the pier nose and the effects of the angled flow near the left main channel piers caused by the constriction downstream (fig. 32). Information from bridge plans indicates that pier 15 of structure A3292 is founded on shafts drilled about 16 ft in bedrock (table 7), and about 53 ft of bed material was present between the bottom of the scour hole and bedrock near the upstream pier (table 7; fig. 30). Pier 16 of structure L0561 is founded on a caisson on bedrock. The bottom of the minor local scour hole near this pier was about 58 ft above the bottom of the caisson and bedrock (table 7; fig. 31).
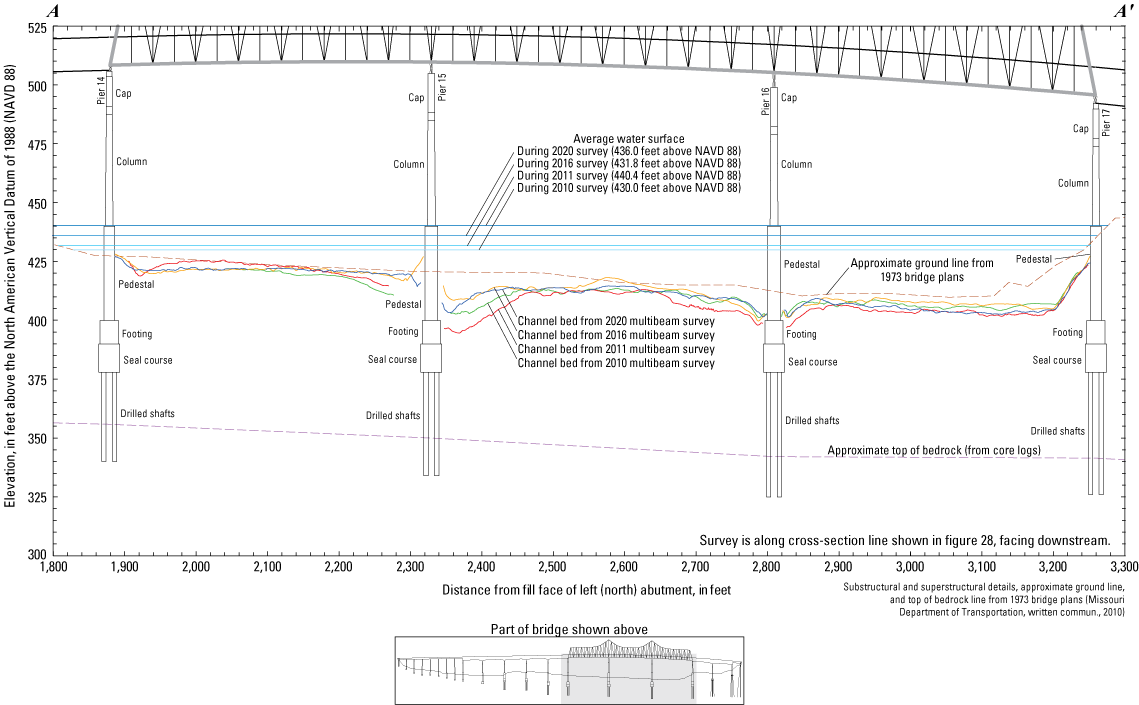
Key features, substructural and superstructural details, and surveyed channel bed of structure A3292 on Interstate 70 crossing the Missouri River near St. Louis, Missouri.
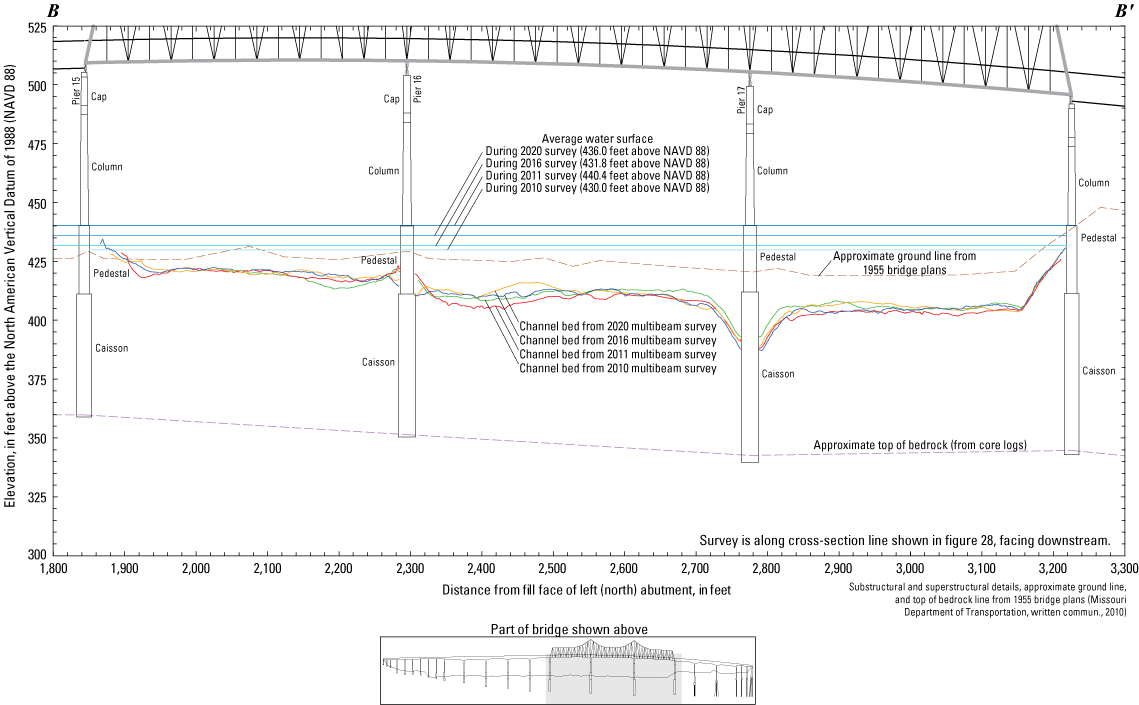
Key features, substructural and superstructural details, and surveyed channel bed of structure L0561 on Interstate 70 crossing the Missouri River near St. Louis, Missouri.
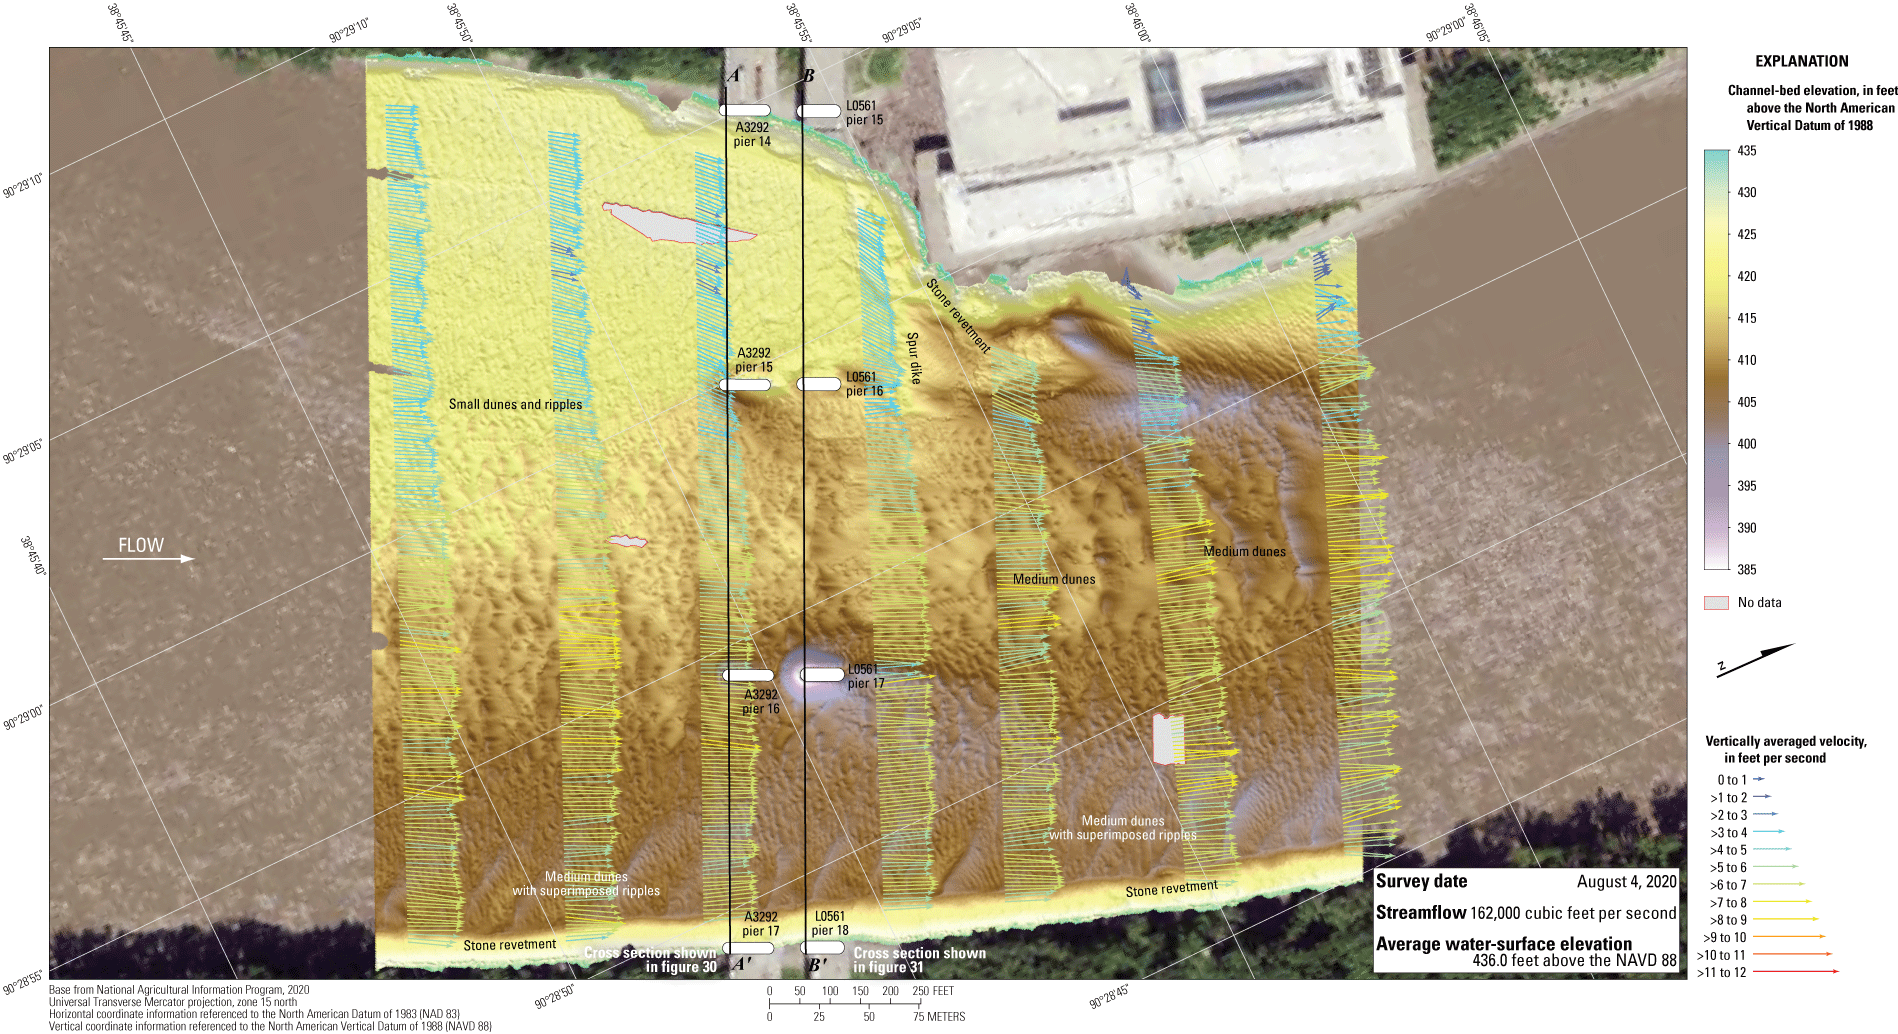
Bathymetry and vertically averaged velocities of the Missouri River channel near structures A3292 and L0561 on Interstate 70 near St. Louis, Missouri.
Larger scour holes were present near the right main channel piers of structures A3292 and L0561, particularly the downstream pier (figs. 28, 1.4D, 1.4E). The scour hole at upstream pier 16 had an approximate minimum channel-bed elevation of about 400 ft (table 7; fig. 30), about 6 ft below the average channel bed upstream from the scour hole near that pier, whereas the scour hole at downstream pier 17 had an approximate minimum channel-bed elevation of about 386 ft (table 7; fig. 31), about 19 ft below the average channel bed upstream from the scour hole near that pier. Information from bridge plans indicates that pier 16 of structure A3292 is founded on shafts drilled 17 ft into bedrock, and about 58 ft of bed material was present between the bottom of the scour hole and bedrock (table 7; fig. 30). Pier 17 of structure L0561 is founded on a caisson on bedrock, and about 43 ft of bed material was present between the bottom of the scour hole and bedrock (table 7; fig. 31). The wider caisson of the downstream pier combined with the turbulence from the upstream pier likely contributes to the more substantial scour of the downstream pier.
The vertically averaged velocity vectors, which range from 3 to 8 ft/s, indicate mostly uniform flow throughout the channel (fig. 32). Flow was angled to the right (southeast) in the upstream part of the reach because of the contraction downstream from the bridges (fig. 32). Exceptions to uniform conditions include substantial turbulence observed downstream from the right (southeast) main channel piers of structures A3292 and L0561 and along the left (northwest) bank in the downstream-most transects (fig. 32). The right main channel piers were aligned with flow, whereas the left main channel piers were not.
The difference between the survey on August 4, 2020, and the previous survey on May 24, 2016 (fig. 33), indicates about 82 percent of the joint area of interest had detectable change, which means about 18 percent of the differences in the joint area of interest are equivocal and within the bounds of uncertainty (table 8). Scour seems dominant throughout most of the reach between 2016 and 2020 in the DoD, except in localized troughs in the medium dune features along the thalweg, and on the downstream left (northwest) bank near and downstream from the bridges (fig. 33). The average difference between the bathymetric surfaces was –1.13 ft (table 8), indicating moderate channel degradation between the 2016 and 2020 surveys. The net volume of cut in the reach from 2016 to 2020 was about 94,600 yd3, and the net volume of fill was about 25,400 yd3, resulting in a net loss of about 69,200 yd3 of sediment between 2016 and 2020 (table 8). The cross section from the 2020 survey along the upstream face of the bridge is generally similar to but below the 2016 survey section (figs. 30, 31). The scour holes near pier 15 of structure A3292 and piers 16 and 17 of structure L0561 were slightly wider and deeper in 2020 than in 2016. The frequency distribution of bed elevations in 2020 seems similar in shape to 2016 but shifted 1 to 2 ft towards lower elevations (fig. 29). The stone revetment along the right (southeast) bank showed localized signs of minor scour and deposition (fig. 33).
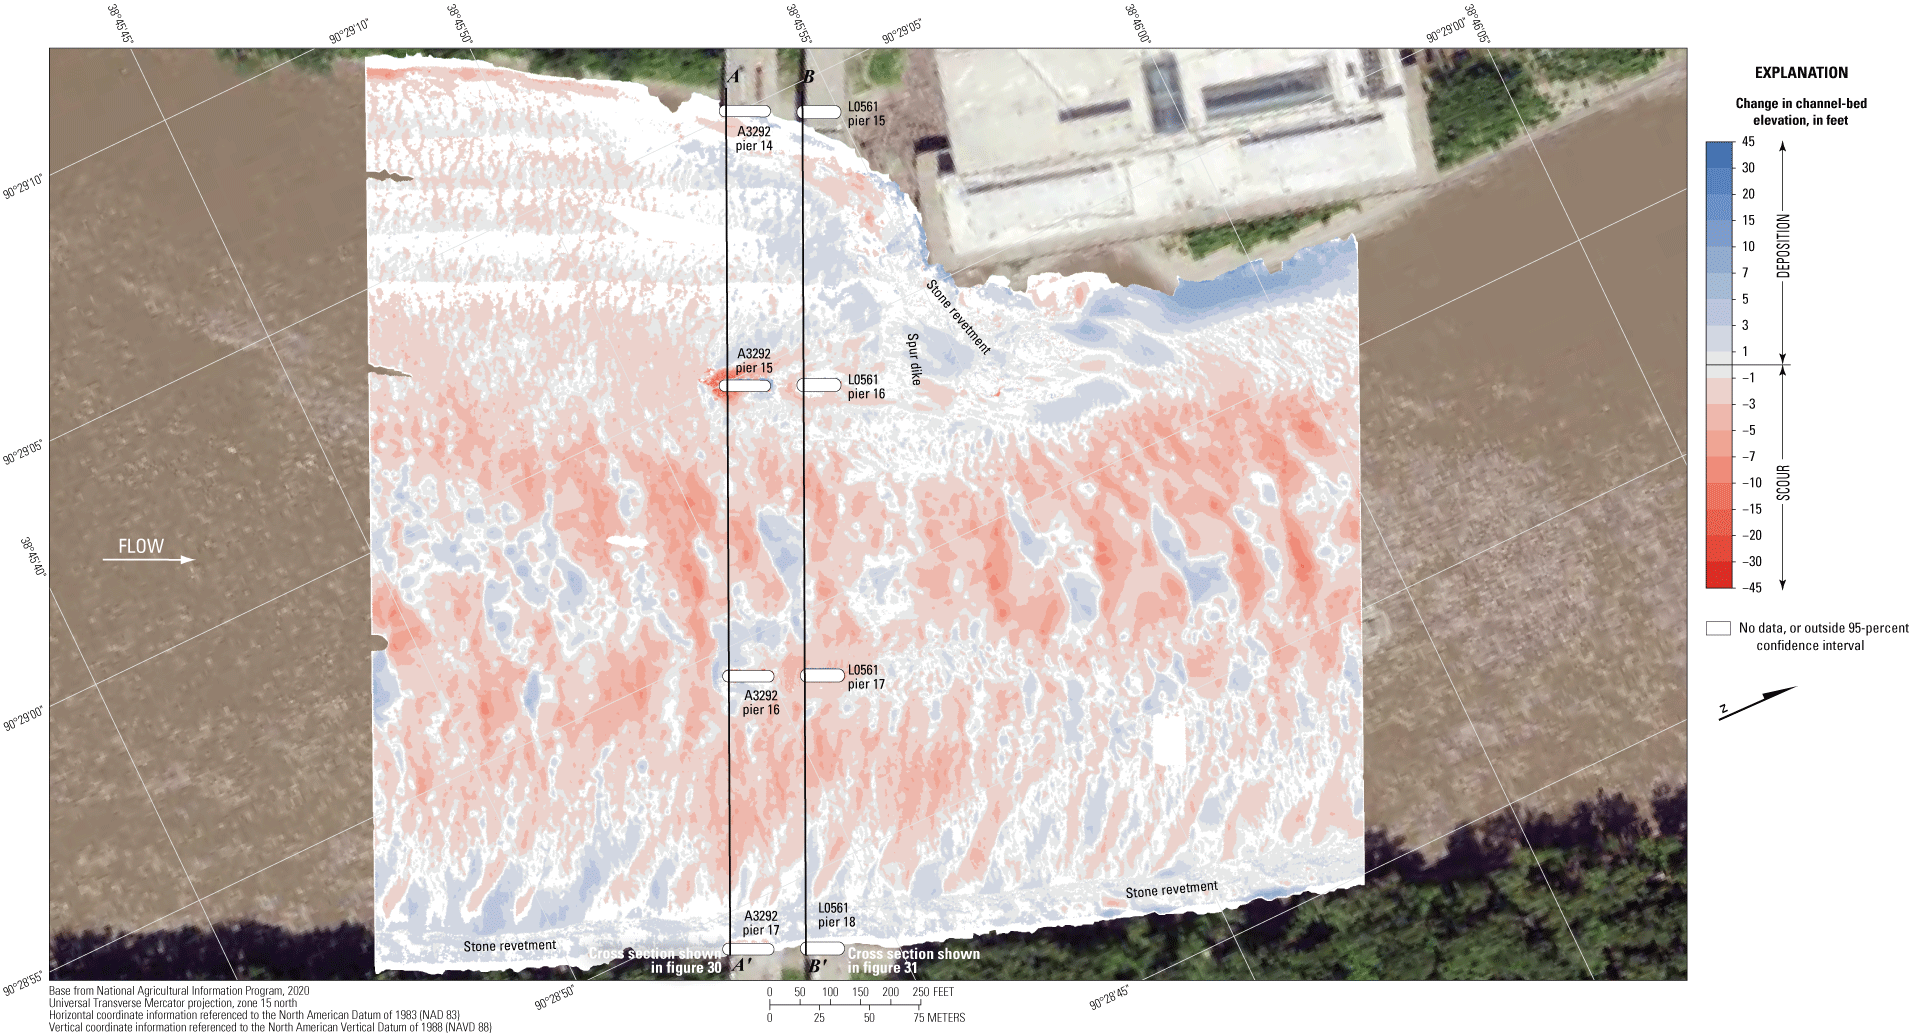
Difference between surfaces created from bathymetric surveys of the Missouri River channel near structures A3292 and L0561 on Interstate 70 near St. Louis, Missouri, on August 4, 2020, and May 24, 2016, with probabilistic thresholding.
The difference between the survey on August 4, 2020, and the flood survey on August 2, 2011 (fig. 34), indicates about 75 percent of the joint area of interest had detectable change, which means about 25 percent of the differences in the joint area of interest are equivocal and within the bounds of uncertainty (table 8). Deposition seems dominant throughout most of the reach between 2011 and 2020 in the DoD, except for localized substantial erosion downstream from the spur dike and along the left (northwest) bank upstream from the bridges, and minor localized scour in the channel thalweg (fig. 34). The average difference between the bathymetric surfaces was +1.64 ft (table 8), indicating moderate to substantial channel aggradation between the 2011 and 2020 surveys, and the net gain of sediment between 2011 and 2020 was about 88,300 yd3, which is greater than the net loss of sediment between 2016 and 2020 (table 8). The cross section from the 2020 survey along the upstream face of bridges generally varies above and below the 2011 survey section, except near the left (northwest) bank and near the piers (figs. 30, 31). The scour hole near pier 17 of structure L0561 was wider and deeper in 2020 than in 2011. The frequency distribution of bed elevations in 2020 seems similar in shape to 2011 but with a higher percentage of cells at higher channel-bed elevations (fig. 29). The stone revetment along the right (southeast) bank showed localized signs of scour and deposition downstream from the bridge and moderate deposition upstream from the bridges (fig. 34). The deposition upstream from the bridges may be the result of revetment placed there after the 2011 flood.
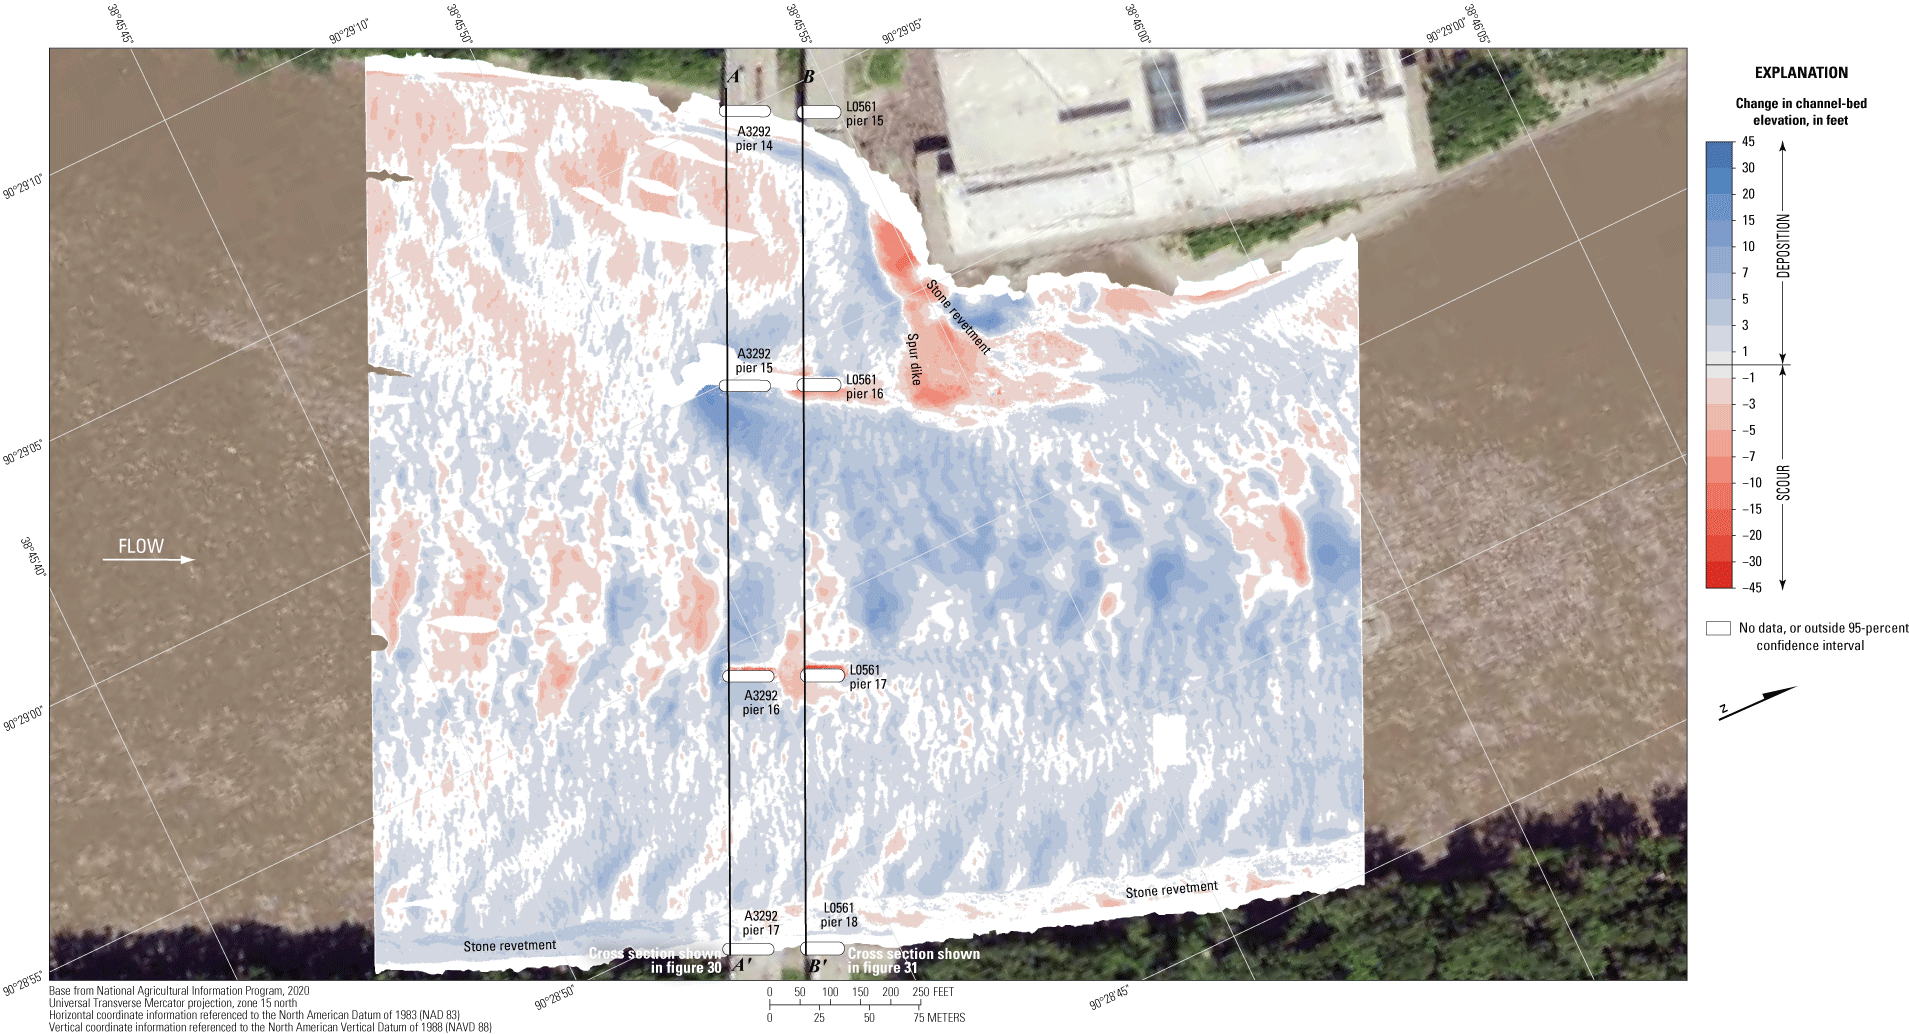
Difference between surfaces created from bathymetric surveys of the Missouri River channel near structures A3292 and L0561 on Interstate 70 near St. Louis, Missouri, on August 4, 2020, and August 2, 2011, with probabilistic thresholding.
The difference between the survey on August 4, 2020, and the earliest survey on October 21, 2010 (fig. 35), indicates about 78 percent of the joint area of interest had detectable change, which means about 22 percent of the differences in the joint area of interest are equivocal and within the bounds of uncertainty (table 8). Scour and deposition seem nearly balanced throughout the reach between 2010 and 2020 in the DoD; and deposition is dominant on the left (northwest) side and scour dominant on the right (southeast) side, and localized scour and deposition are near the main channel piers (fig. 35). The scour hole near pier 17 of structure L0561 was substantially wider and deeper in 2020 than in 2010. The average difference between the bathymetric surfaces was –0.33 ft and a net loss of sediment between 2010 and 2020 of only about 16,400 yd3, further indicating the balance of scour and deposition between 2010 and 2020 (table 8). The frequency distribution of bed elevations in 2020 seems similar in shape to 2010 below 406 ft; however, above 406 ft, the 2010 distribution has a substantially higher percentage of cells for a given elevation (fig. 29). The difference in the distribution likely is the result of the substantially narrower survey area in 2010 and a general lack of bank information (fig. 35).
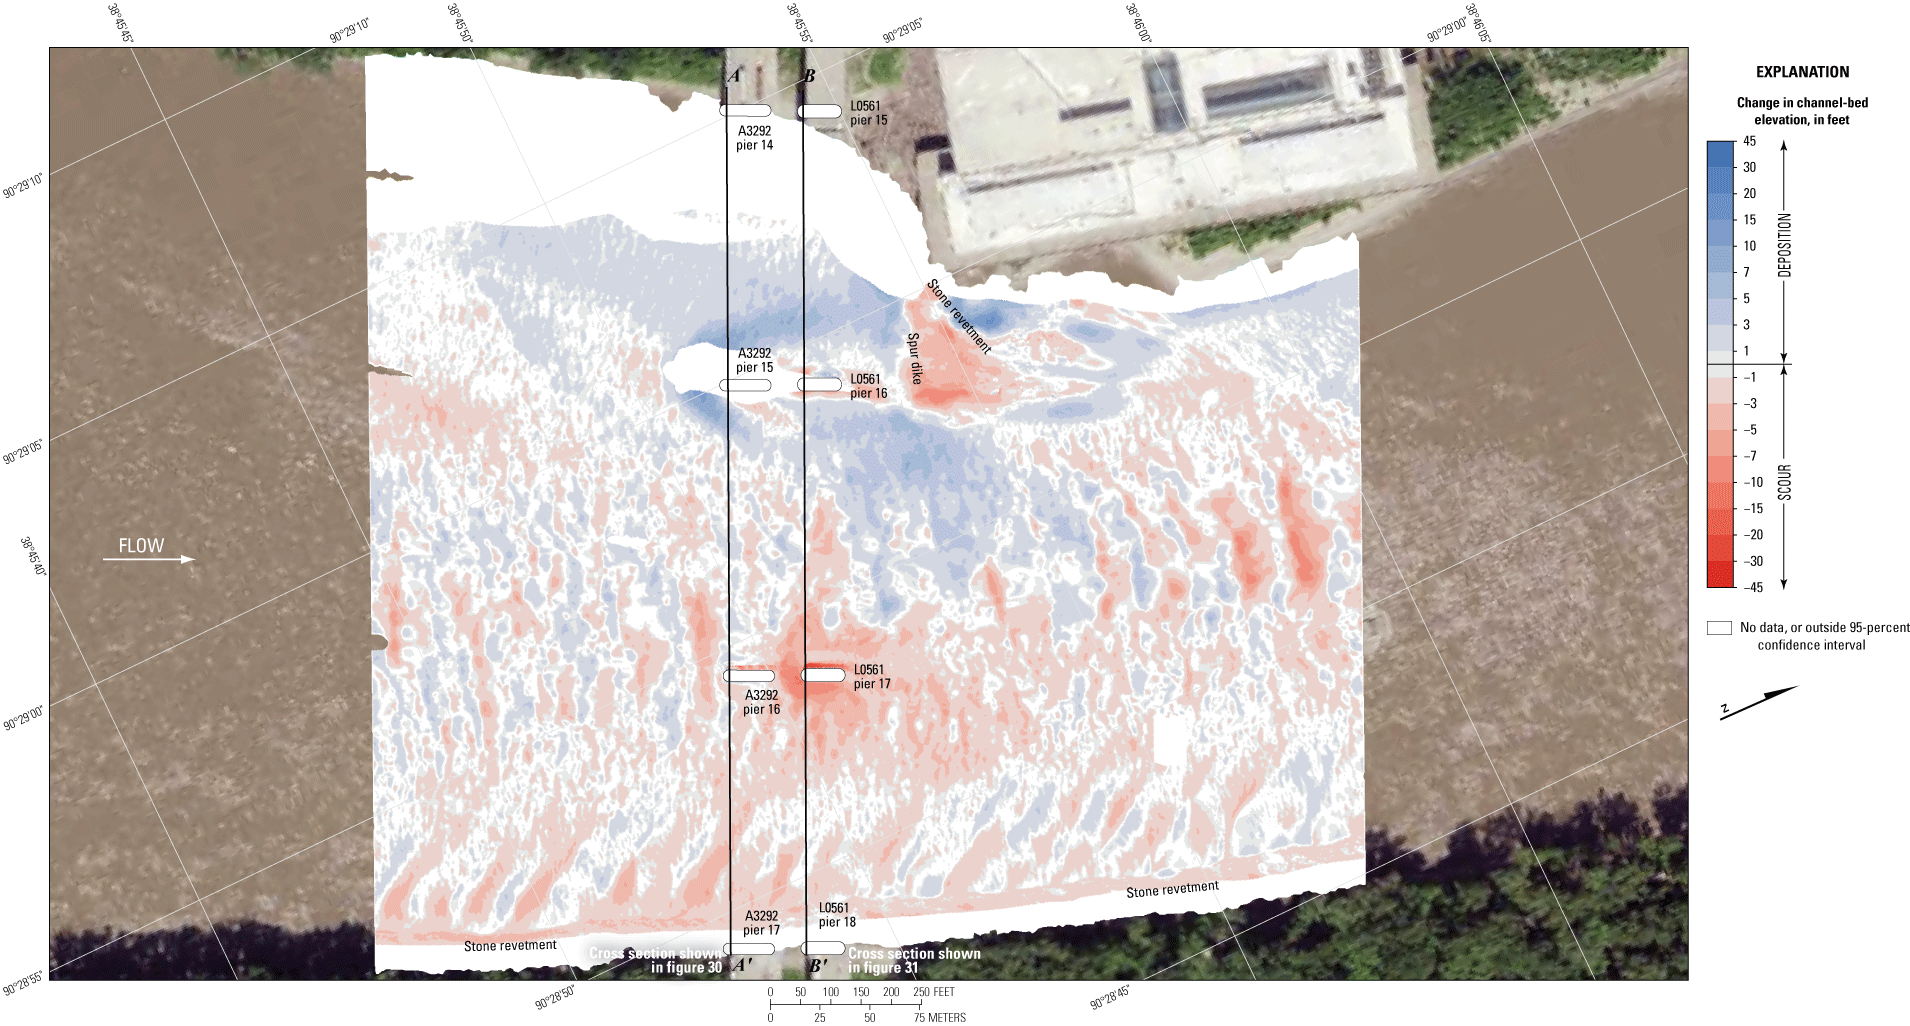
Difference between surfaces created from bathymetric surveys of the Missouri River channel near structures A3292 and L0561 on Interstate 70 near St. Louis, Missouri, on August 4, 2020, and October 21, 2010, with probabilistic thresholding.
Dual Bridge Structure A4557 on State Highway 370
Structure A4557 (site 26; table 2) consists of twin bridges on State Highway 370, crossing the Missouri River at RM 27.0, on the northwestern side of the St. Louis metropolitan area (fig. 1). The site was surveyed on August 4, 2020, when the average water-surface elevation near the bridge, determined by the RTK GNSS tide solution, was 433.7 ft (table 6; fig. 36); and streamflow on the Missouri River was about 150,000 ft3/s during the survey (table 6).
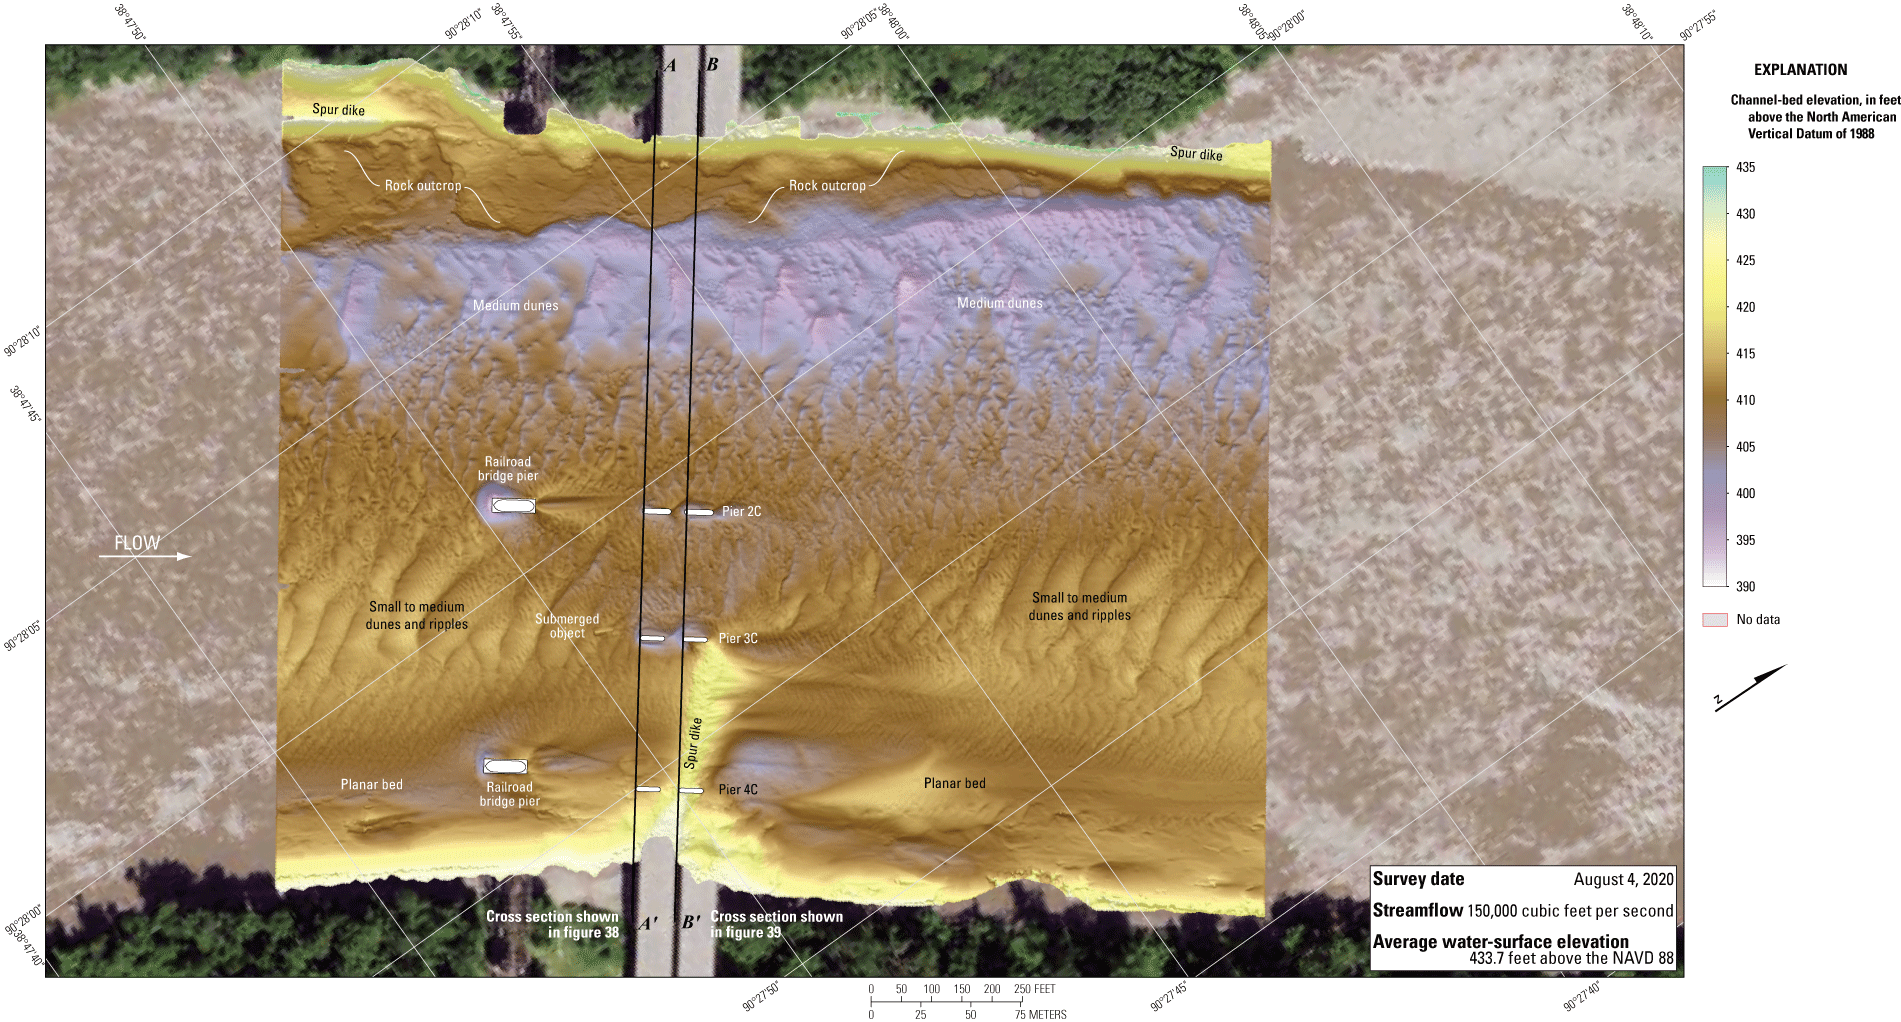
Bathymetric survey of the Missouri River channel near dual bridge structure A4557 on State Highway 370 near St. Louis, Missouri.
The survey area was about 1,640 ft long and about 1,300 ft wide, extending from bank to bank in the main channel (fig. 36). The survey area extended about 670 ft upstream from the centerline of dual bridge structure A4557 (fig. 36). The approximate channel-bed elevations ranged from about 401 to 420 ft for most of the surveyed area (5th to 95th percentile range of the bathymetric data; table 6; fig. 37), except near the piers and along the toe of the rock outcrop along the left (northwest) side of the channel, which had a minimum channel-bed elevation of about 394 ft (fig. 36; table 6). A series of medium dune features were observed in the channel thalweg along the left (northwest) side, numerous small to medium dunes and ripples were detected throughout other parts of the channel, and a nearly planar bed area with no prominent features was along the right (southeast) bank (fig. 36). Like in previous surveys (Huizinga, 2011, 2012, 2017a), a spur dike was present under the downstream bridge on the right (southeast) bank, and a rock outcrop was present on the left (northwest) bank throughout the reach (fig. 36).
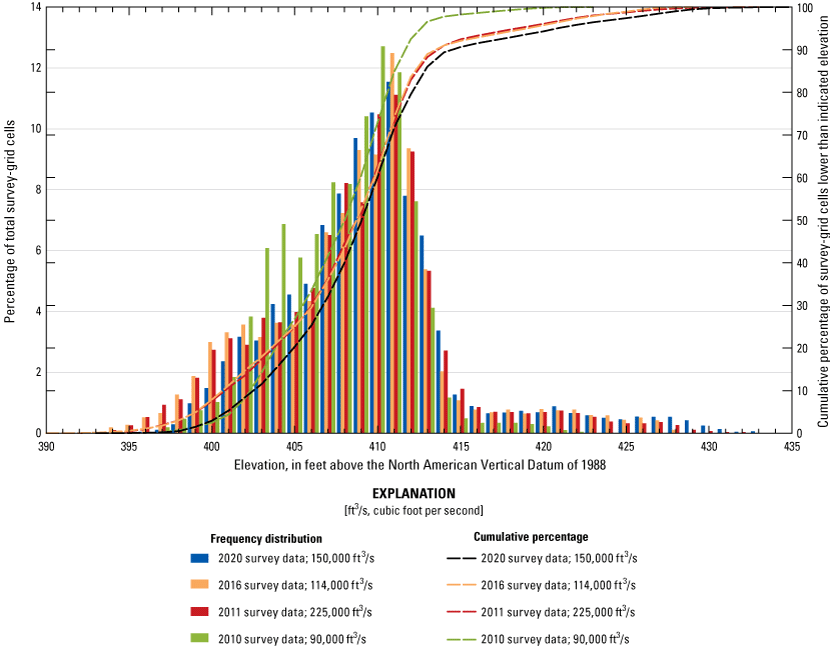
Frequency distribution of bed elevations for bathymetric survey-grid cells in 1-foot elevation bins on the Missouri River near dual bridge structure A4557 on State Highway 370 near St. Louis, Missouri, on August 4, 2020, compared to previous surveys in 2010, 2011, and 2016 (Huizinga, 2011, 2012, 2017a, respectively).
Small to moderate scour holes were observed near the main channel piers, except those near the spur dike on the right side of the channel (pier 4C at both bridges; figs. 36, 1.5). At pier 2C, the scour hole near the upstream (eastbound) pier had a minimum channel-bed elevation of about 405 ft (table 7; figs. 36, 38), about 3 ft below the average channel bed upstream from the scour hole at that pier; and the scour hole at the downstream (westbound) pier had a minimum channel-bed elevation of about 404 ft (table 7; figs. 36, 39), about 4 ft below the average channel bed upstream from the scour hole at that pier. At pier 3C, the scour hole at the upstream pier had a minimum channel-bed elevation of about 402 ft (table 7; figs. 36, 38), about 6 ft below the average channel bed upstream from the scour hole at that pier; and the scour hole at the downstream pier had a minimum channel-bed elevation of about 401 ft (table 7; figs. 36, 39), about 7 ft below the average channel bed upstream from the scour hole at that pier. Essentially, no scour hole was present around either upstream or downstream pier 4C (fig. 36); however, the spur dike next to these piers caused a local deep hole that reached a minimum channel-bed elevation of about 408 ft downstream from the westbound pier (table 7; fig. 36). These piers were embedded in the rock of the dike, which likely limited or prevented additional scour near them. Material from the toe of the spur dike extended to downstream (westbound) pier 3C and may limit scour on the right (south) side of that pier as well; however, flow seems to be deflected towards the left (north) upstream from pier 3C (fig. 40) and may affect the amount of scouring near these piers.
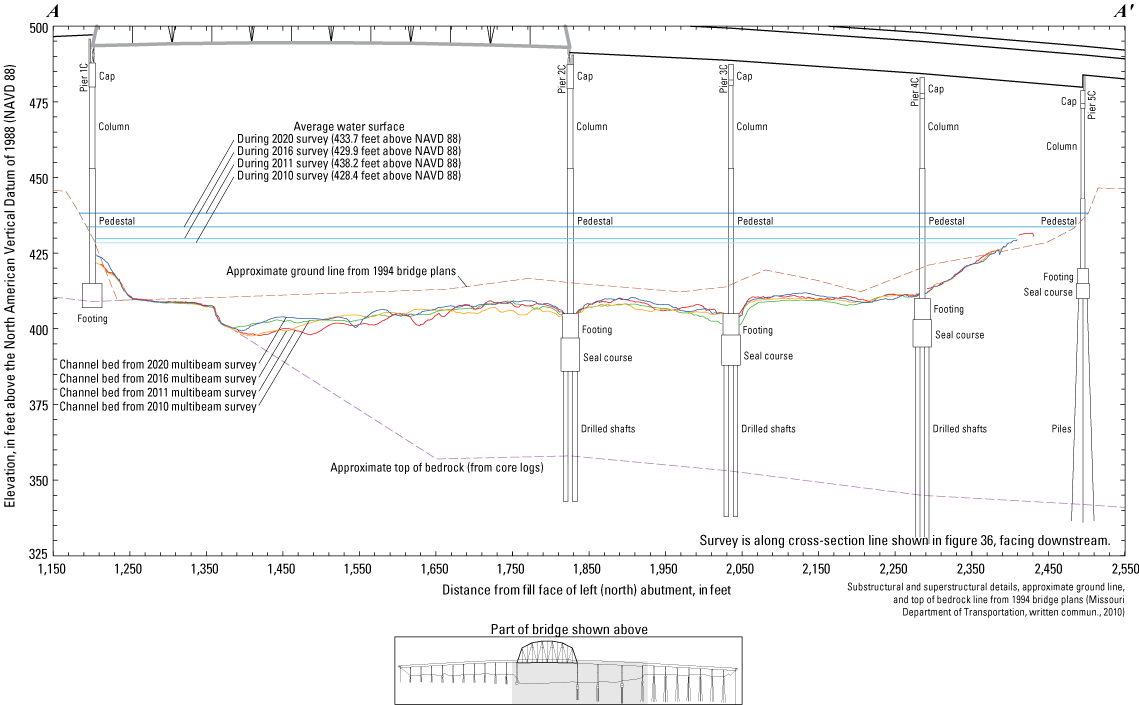
Key features, substructural and superstructural details, and surveyed channel bed of upstream structure A4557 on State Highway 370 crossing the Missouri River near St. Louis, Missouri.
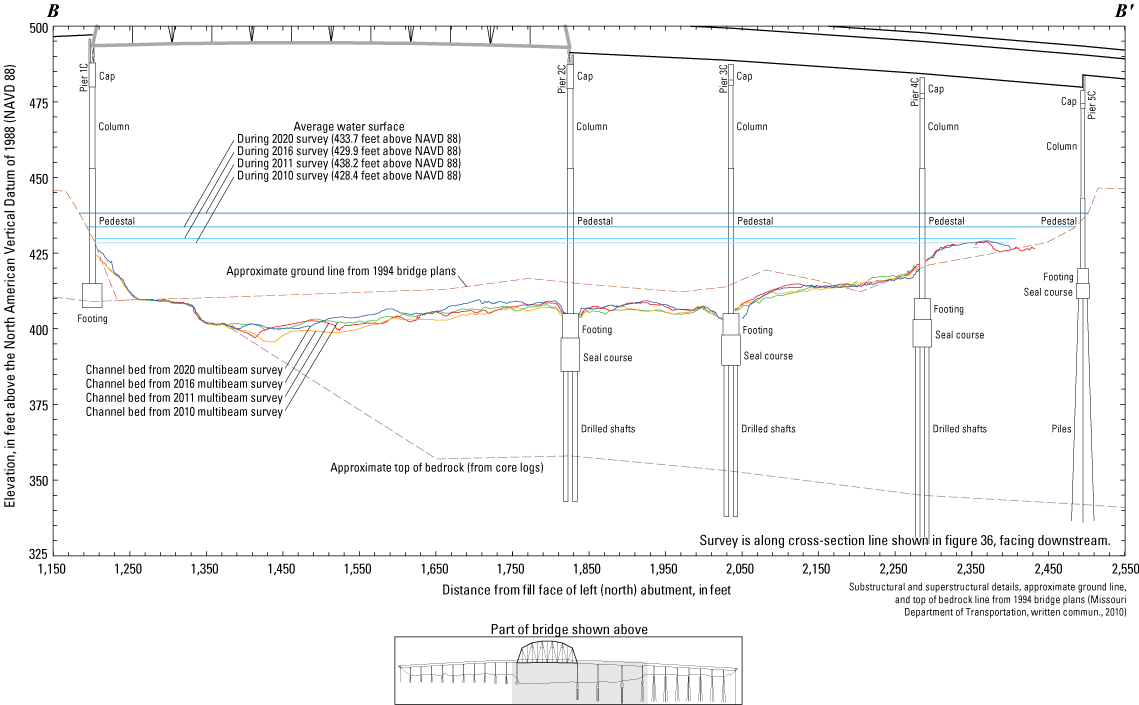
Key features, substructural and superstructural details, and surveyed channel bed of downstream structure A4557 on State Highway 370 crossing the Missouri River near St. Louis, Missouri.
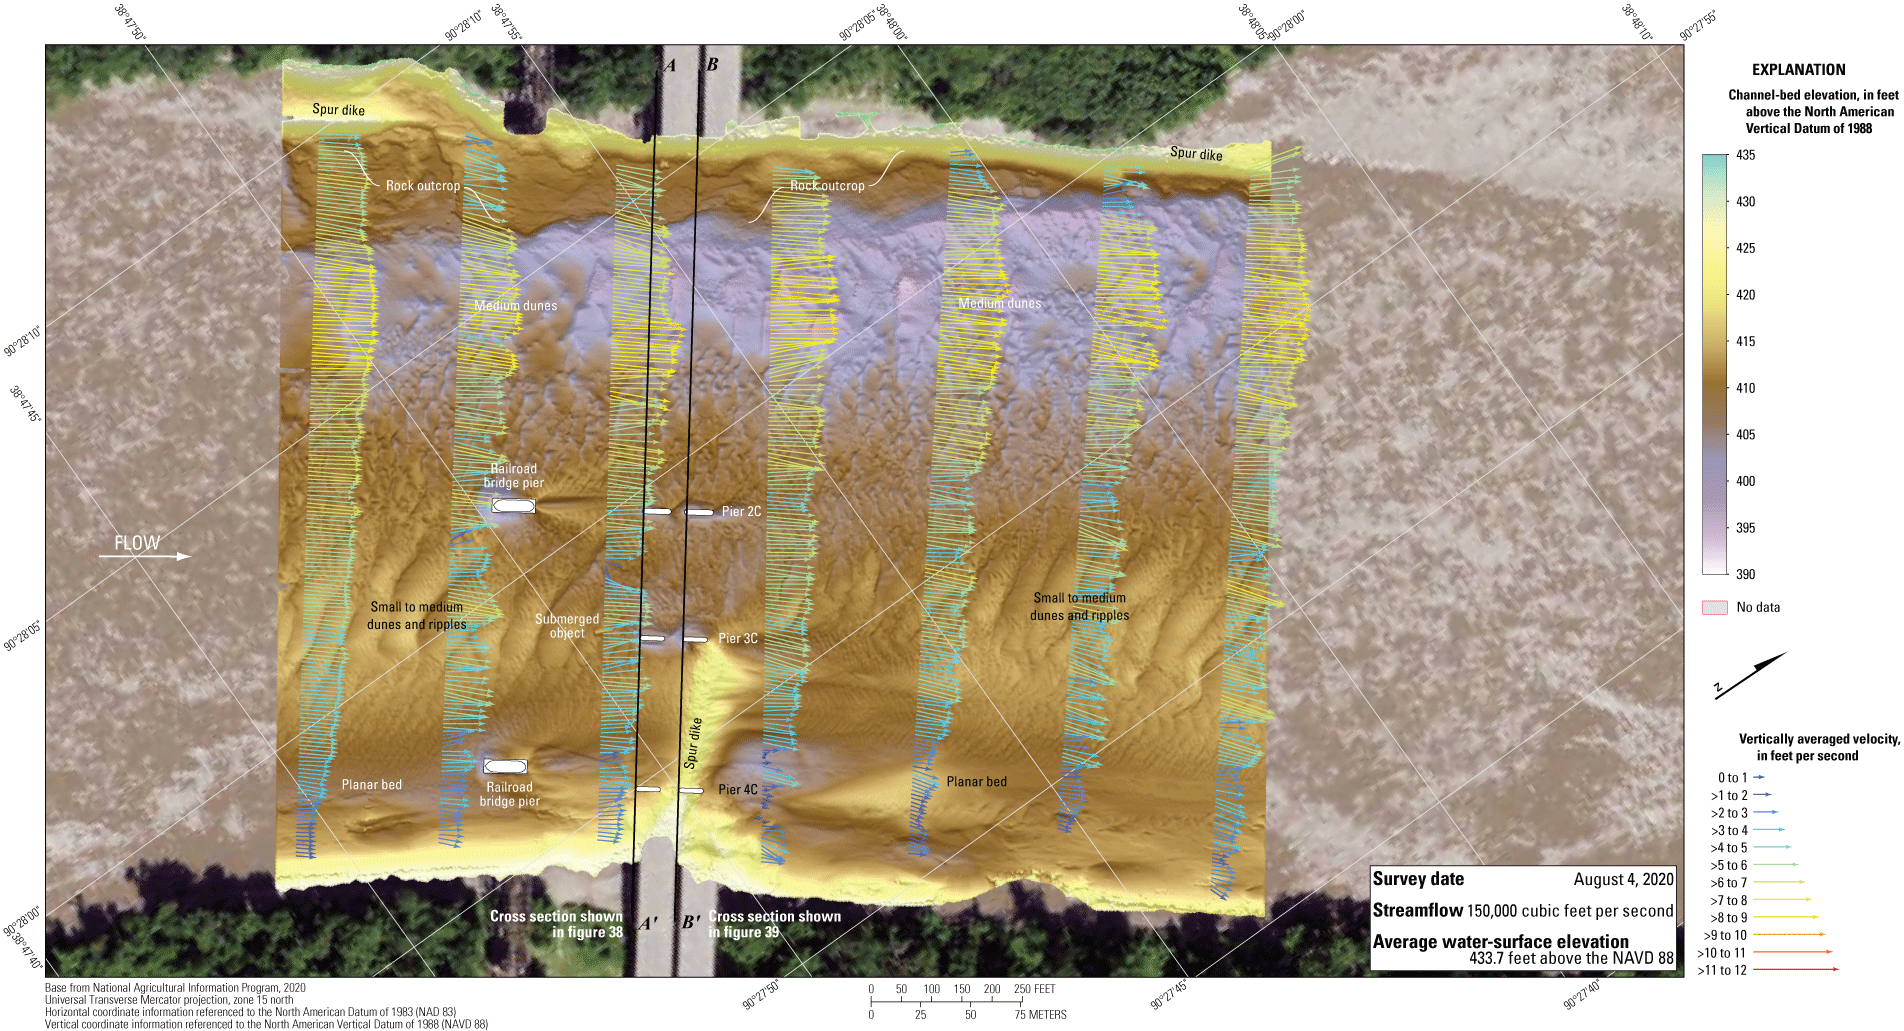
Bathymetry and vertically averaged velocities of the Missouri River channel near dual bridge structure A4557 on State Highway 370 near St. Louis, Missouri.
The vertically averaged velocity vectors, which range from 3 to 9 ft/s, indicate mostly uniform flow with localized moderate turbulence throughout most of the reach (fig. 40). Other exceptions to uniform conditions include flow reversal on the right (southeast) bank downstream from the spur dike (fig. 40). All the piers were aligned with flow, as indicated by little to no turbulence observed downstream that can be directly attributed to the piers (fig. 40).
A substantial scour hole was observed at the railroad bridge pier upstream from pier 2C (fig. 36). The hole had a minimum channel-bed elevation of 394 ft at the upstream pier face, about 17 ft below the average channel bed upstream from the scour hole (fig. 36). A smaller scour hole also was present at the railroad bridge pier upstream from pier 4C, which had a minimum channel-bed elevation of 402 ft at the upstream pier face, about 6 ft below the average channel bed upstream from the scour hole (fig. 36). The scour holes at the railroad bridge piers did not seem to affect the scour at piers 2C or 4C of structure A4557 (fig. 36).
Information from bridge plans indicates that the main channel piers of dual bridge structure A4557 are founded on shafts drilled 15 ft into bedrock (table 7; figs. 38, 39). Depth of bed material between bedrock and the bottom of the various scour holes at dual bridge structure A4557 ranged from 46 to 66 ft because of the sloping bedrock and channel bed in the area (table 7; figs. 38, 39). The minimum channel-bed elevation in each of the scour holes was more than 12 ft higher than the bottom of the seal course elevation at each pier (table 7; figs. 38, 39).
The difference between the survey on August 4, 2020, and the previous survey on May 24, 2016 (fig. 41), indicates about 76 percent of the joint area of interest had detectable change, which means about 24 percent of the differences in the joint area of interest are equivocal and within the bounds of uncertainty (table 8). Deposition seems dominant throughout most of the reach between 2016 and 2020 in the DoD, except in the middle of the upstream channel, along the thalweg near the left (northwest) bank, and near the right (southeast) bank (fig. 41). The average difference between the bathymetric surfaces was +0.72 ft (table 8), indicating minor to moderate channel aggradation between the 2016 and 2020 surveys. The net volume of cut in the reach from 2016 to 2020 was about 30,900 yd3, and the net volume of fill was about 71,500 yd3, resulting in a net gain of about 40,600 yd3 of sediment between 2016 and 2020 (table 8). The cross section from the 2020 survey along the upstream face of the bridges generally varies above and below the 2016 survey section, except between the left bank and pier 2C (figs. 38, 39) where the 2020 section is generally higher than the 2016 section. The frequency distribution of bed elevations in 2020 is remarkably similar in shape to 2016 and only had a slightly lower percentage of cells at most of the channel-bed elevations (fig. 37). The rock outcrop on the left (northwest) bank showed very small, localized areas of minor deposition, but nearly all the indicated changes are within 1 ft of the 2016 elevation, or outside the 95-percent confidence interval (fig. 41).
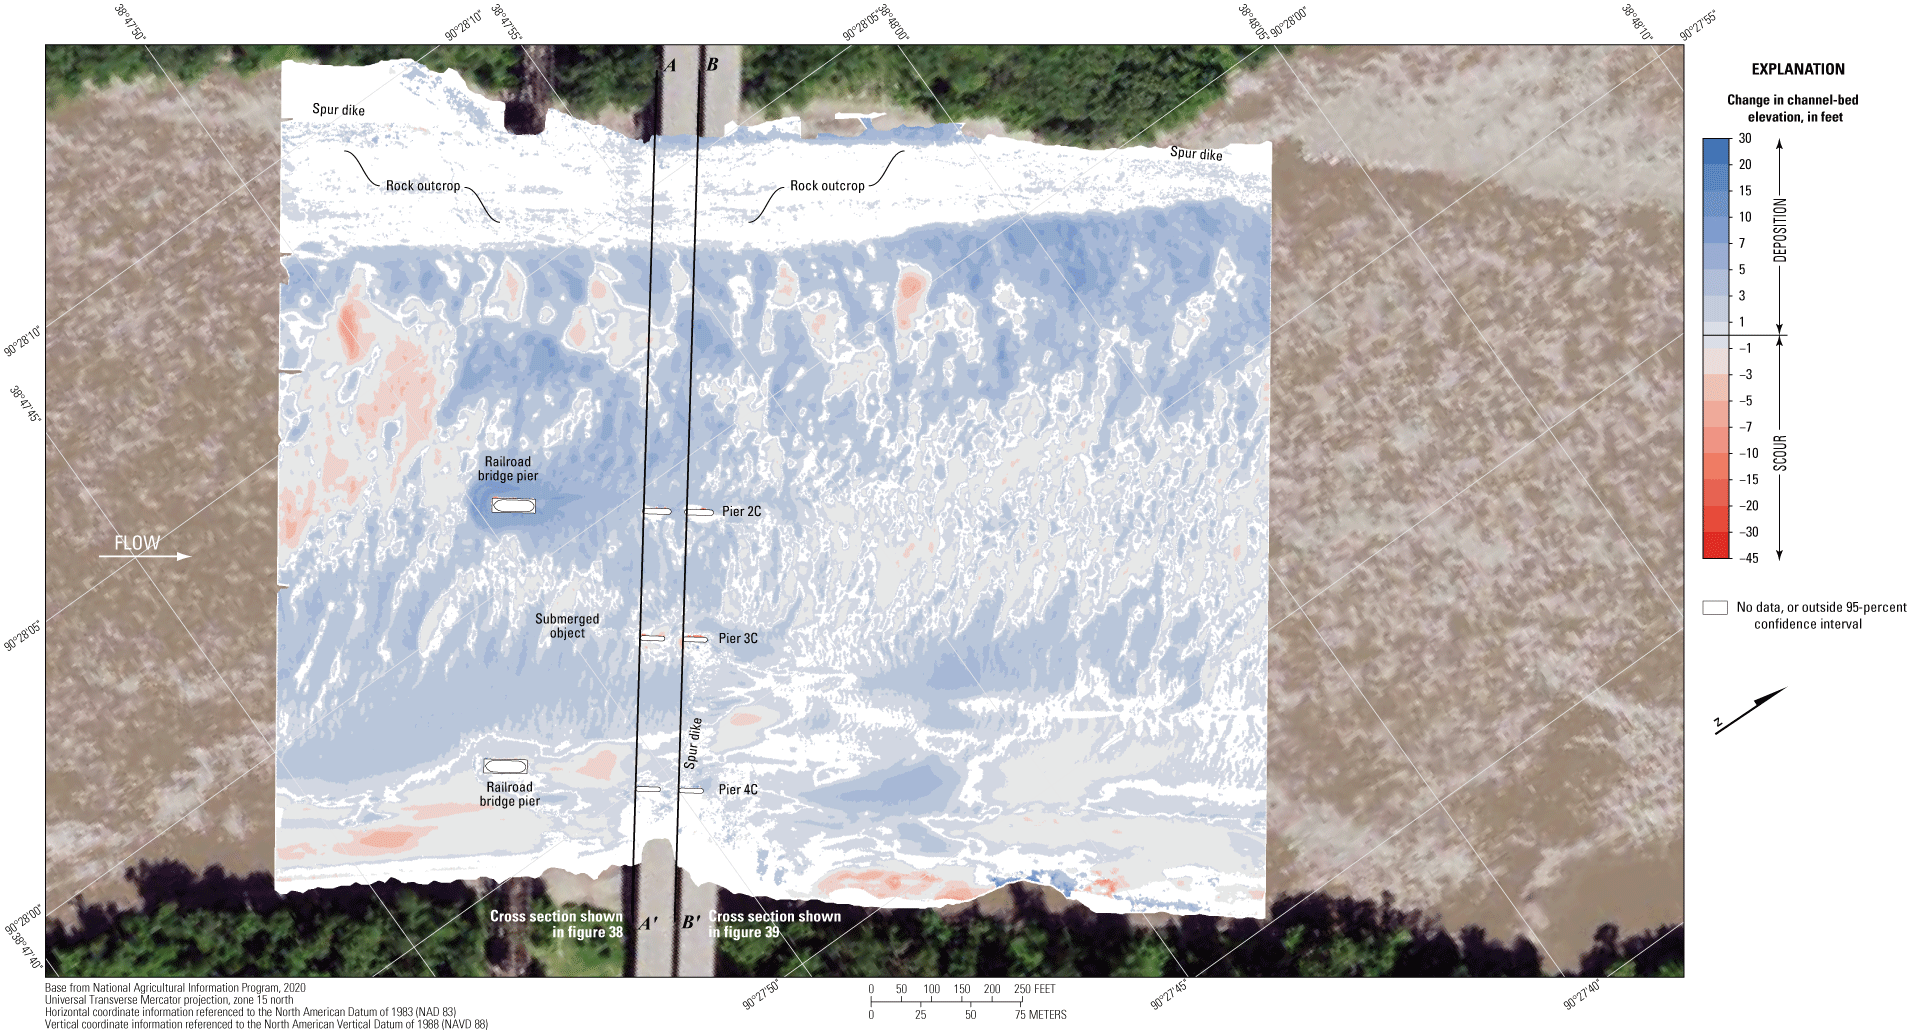
Difference between surfaces created from bathymetric surveys of the Missouri River channel near dual bridge structure A4557 on State Highway 370 near St. Louis, Missouri, on August 4, 2020, and May 24, 2016, with probabilistic thresholding.
The difference between the survey on August 4, 2020, and the flood survey on August 2, 2011 (fig. 42), indicates only 60 percent of the joint area of interest had detectable change, which means about 40 percent of the differences in the joint area of interest are equivocal and within the bounds of uncertainty (table 8). Areas of moderate to substantial deposition are balanced with areas of moderate to substantial scour throughout most of the reach between 2011 and 2020 in the DoD, except on the rock outcrop on the left (northwest) bank and in the middle of the downstream channel (fig. 42). The average difference between the bathymetric surfaces was +0.79 ft (table 8), again indicating minor to moderate channel aggradation between the 2011 and 2020 surveys, and the net gain of sediment between 2011 and 2020 was about 35,400 yd3, which is less than but consistent with the net gain of sediment between 2016 and 2020 (table 8). The cross section from the 2020 survey along the upstream face of bridges generally is 5–10 ft higher than the 2011 survey section, except near the rock outcrop on the left bank and the spur dike on the right bank (figs. 38, 39). The frequency distribution of bed elevations in 2020 is again remarkably similar in shape to 2011 (which is nearly identical to 2016) but has a slightly lower percentage of cells at all channel-bed elevations (fig. 37). The rock outcrop on the left (northwest) bank again showed localized signs of minor to moderate deposition (fig. 42); however, most of the rock outcrop was equivocal, and the moderate apparent deposition likely results from minor horizontal positional variances between the surveys (see “Uncertainty Estimation” section).
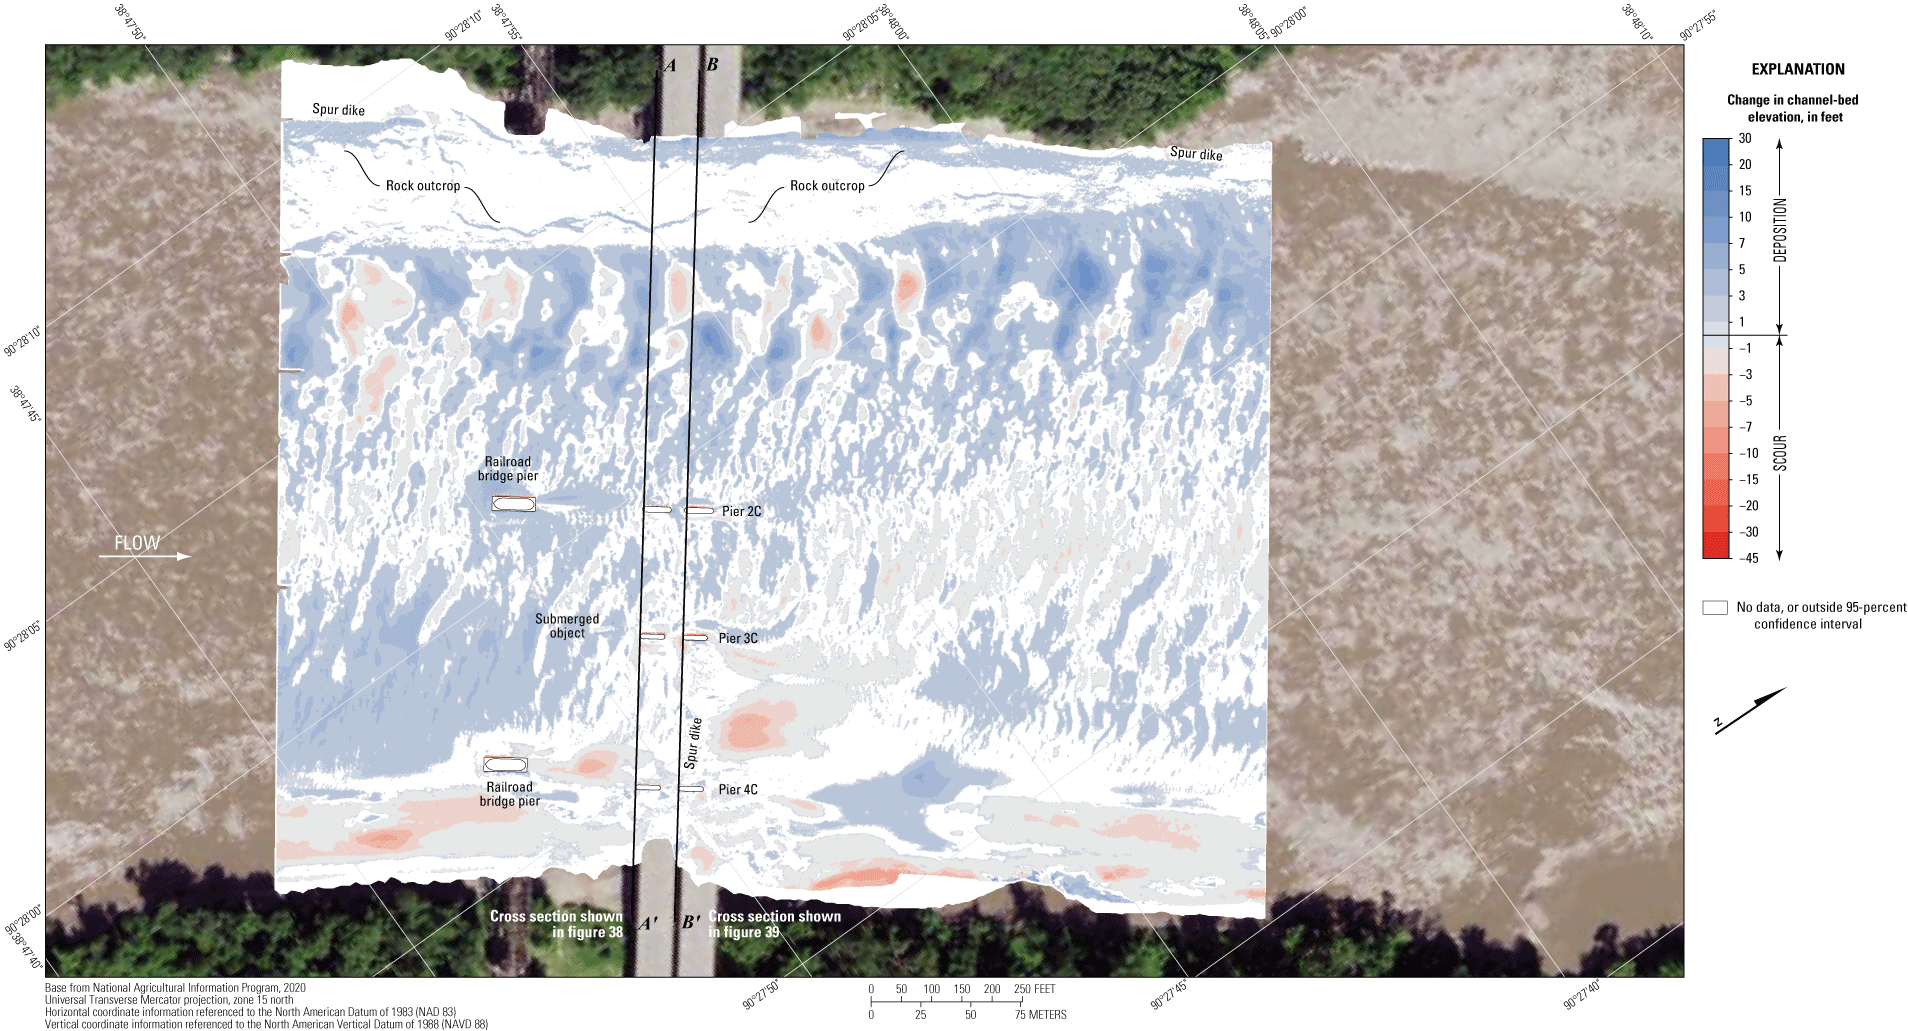
Difference between surfaces created from bathymetric surveys of the Missouri River channel near dual bridge structure A4557 on State Highway 370 near St. Louis, Missouri, on August 4, 2020, and August 2, 2011, with probabilistic thresholding.
The difference between the survey on August 4, 2020, and the earliest survey on October 22, 2010 (fig. 43), indicates about 90 percent of the joint area of interest had detectable change, which means only about 10 percent of the differences in the joint area of interest are equivocal and within the bounds of uncertainty (table 8). Like with the other comparisons, scour and deposition seem nearly balanced throughout the reach between 2010 and 2020 in the DoD because of more scour in the thalweg and deposition near the right (southeast) bank (fig. 43). The average difference between the bathymetric surfaces was +0.53 ft (table 8), indicating minor aggradation between the 2010 and 2020 surveys. There was a net gain of sediment between 2010 and 2020 of about 32,500 yd3 (table 8). The frequency distribution of bed elevations in 2010 is again similar to 2020 but with a different (lower and higher, alternately) percentage of cells at a similar range of channel-bed elevations than in 2020 (fig. 37). The difference in the distribution may be the result of the substantially narrower survey area in 2010 and the general lack of bank information (fig. 43). The rock outcrop on the left (northwest) bank again showed localized signs of minor deposition (fig. 43); however, nearly all the indicated changes are within 1–3 ft of the 2010 elevation. As with several previous DoDs, this apparent deposition likely results from minor horizontal positional variances between the surveys (see “Uncertainty Estimation” section).
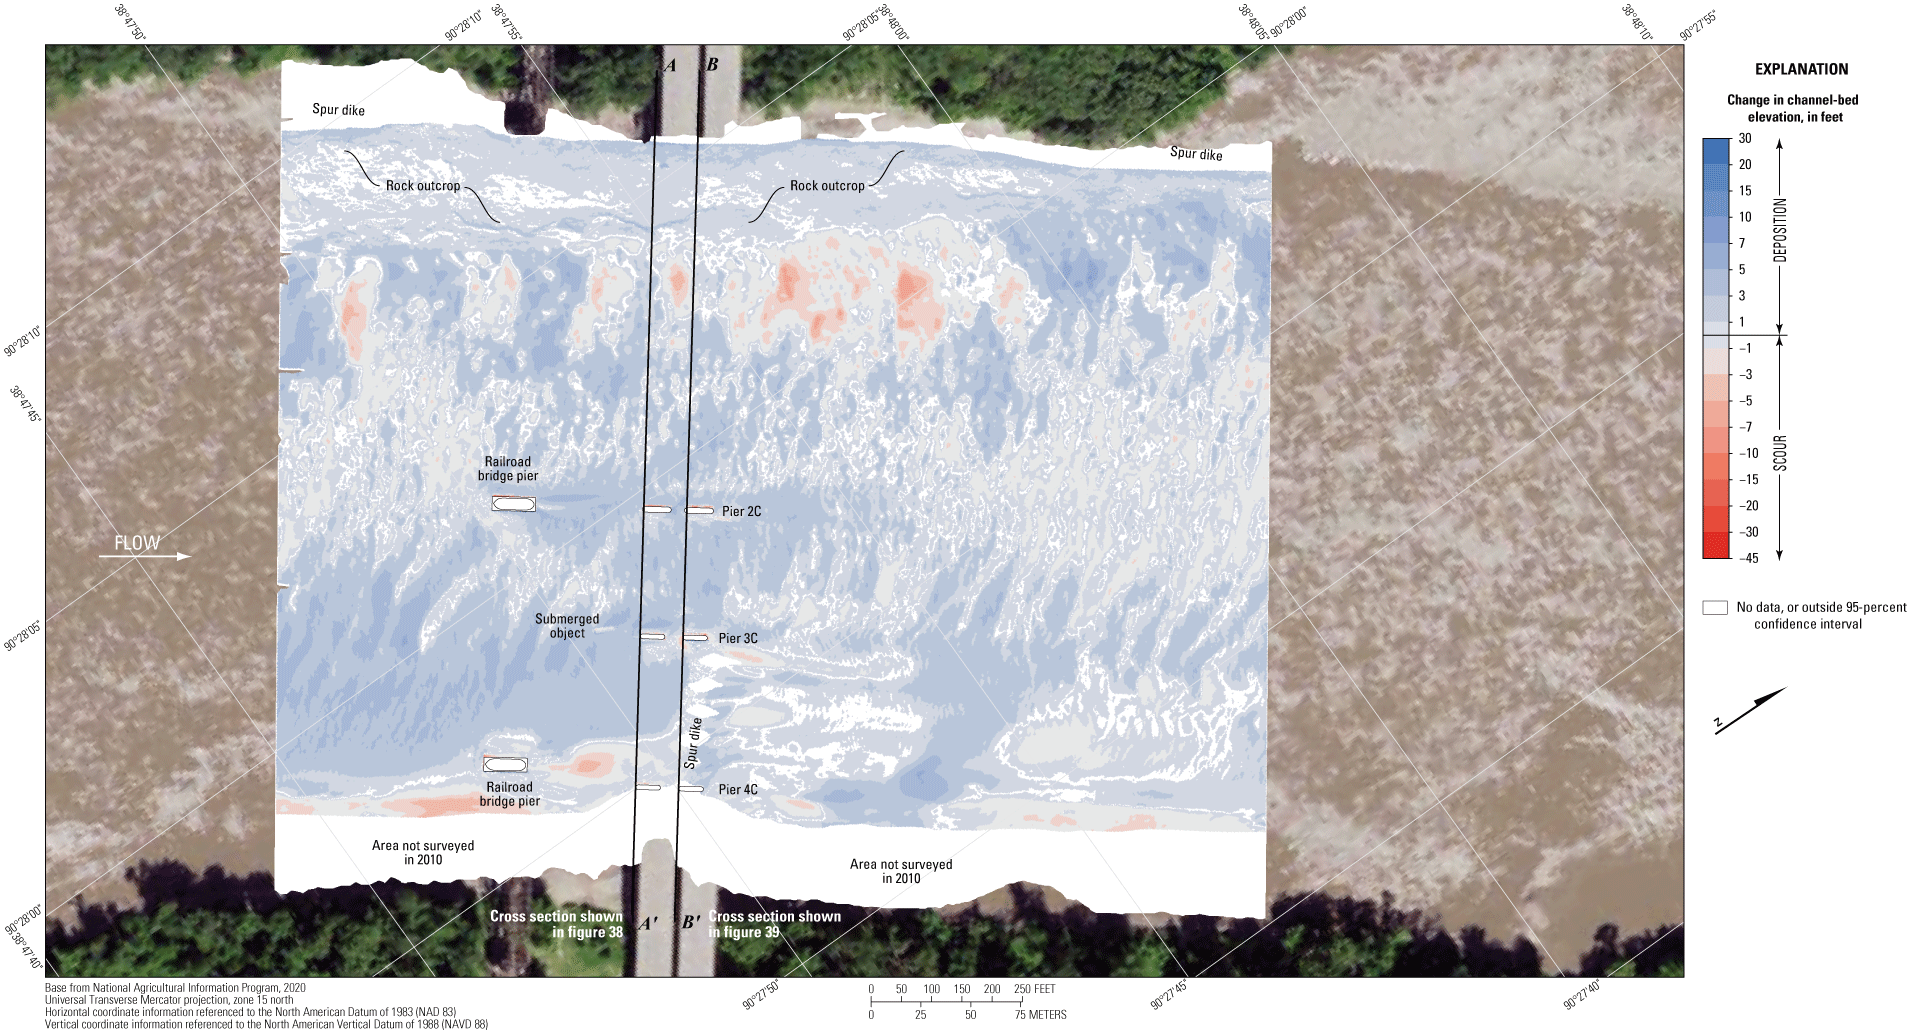
Difference between surfaces created from bathymetric surveys of the Missouri River channel near dual bridge structure A4557 on State Highway 370 near St. Louis, Missouri, on August 4, 2020, and October 22, 2010, with probabilistic thresholding.
Structure A3047 on U.S. Highway 67
Structure A3047 (site 27; table 2) on U.S. Highway 67 crosses the Missouri River at RM 8.1, on the northern side of the St. Louis metropolitan area (fig. 1). The site was surveyed on August 6, 2020, when the average water-surface elevation of the river in the survey area, determined by the RTK GNSS tide solution, was 414.0 ft (table 6; fig. 44) and streamflow on the Missouri River was about 127,000 ft3/s during the survey (table 6).
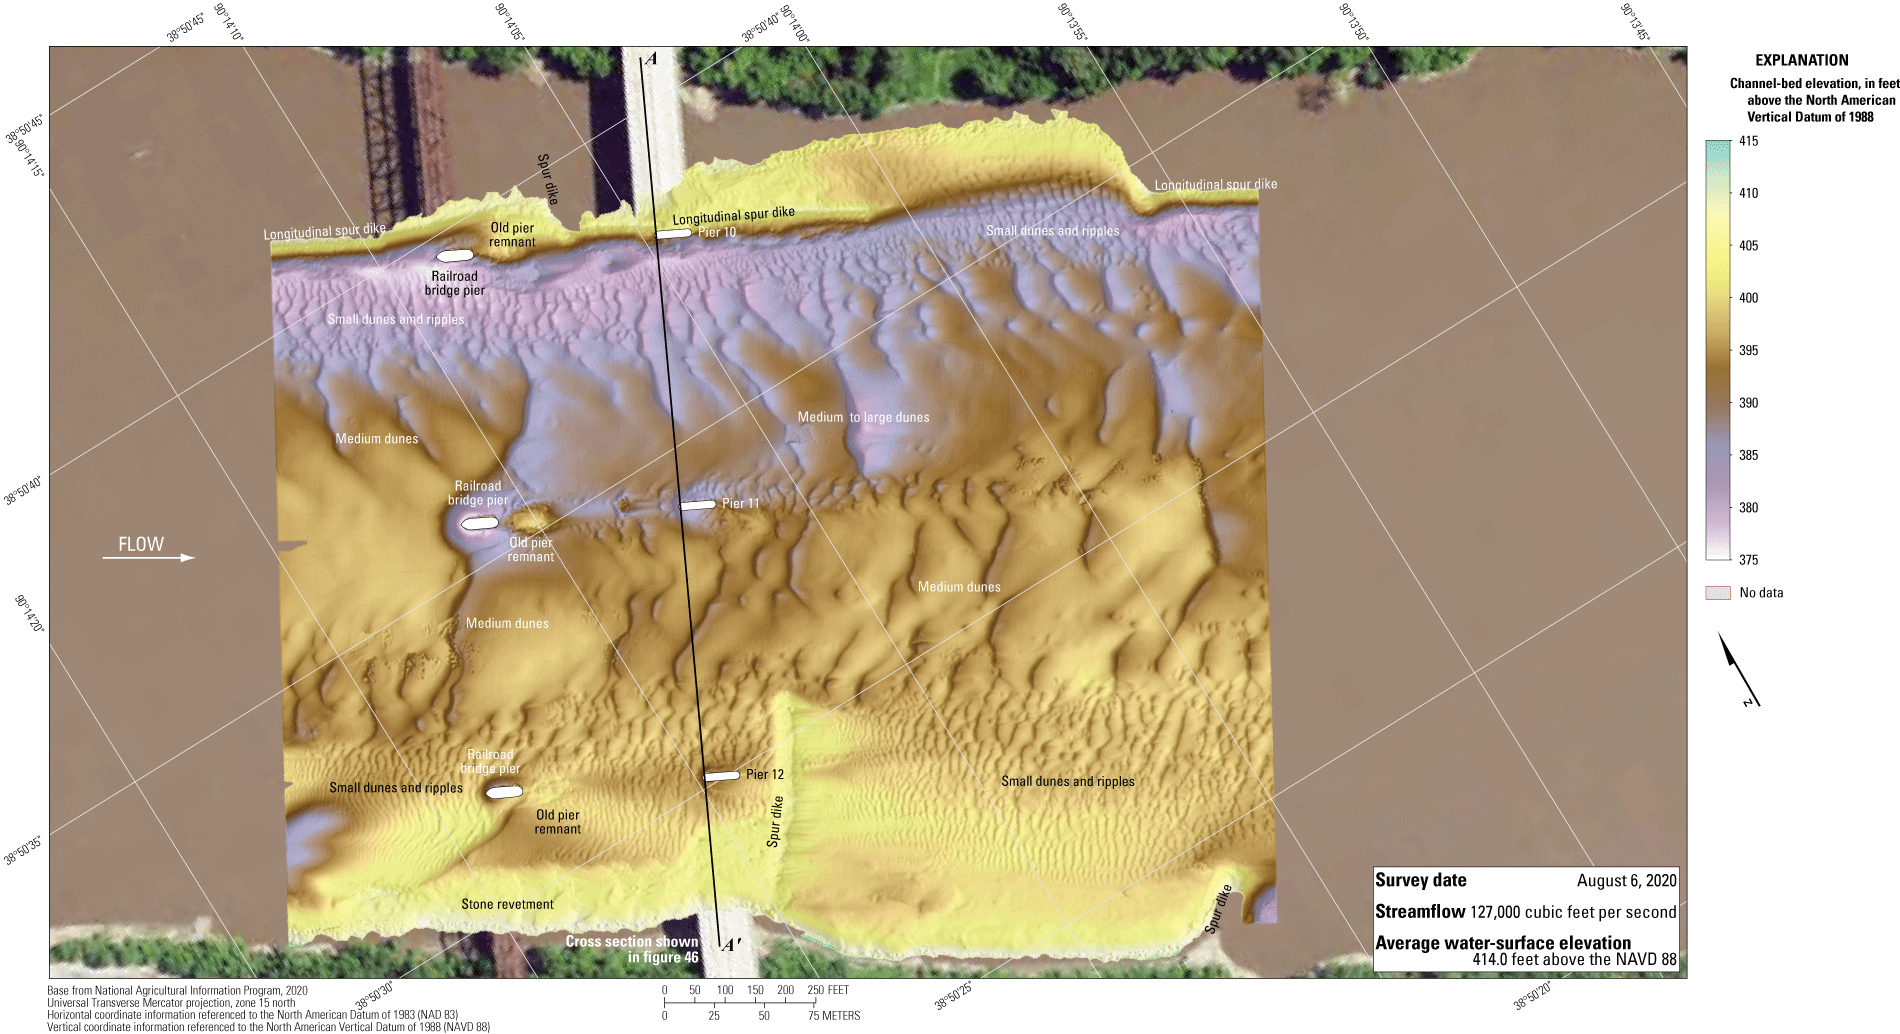
Bathymetric survey of the Missouri River channel near structure A3047 on U.S. Highway 67 near St. Louis, Missouri.
The survey area was about 1,640 ft long and about 1,450 ft wide, extending essentially from bank to bank in the main channel (fig. 44). The survey area extended about 670 ft upstream from the centerline of structure A3047 (fig. 44). The channel-bed elevations ranged from about 384 to 403 ft for most of the surveyed area (5th to 95th percentile range of the bathymetric data; fig. 45; table 6). A deep thalweg on the left (northeast) bank was about 12–15 ft deeper than the middle of the channel (fig. 44). Near the spur dike on the right (southwest) side near the bridge, bed elevations were about 400 ft, and behind the longitudinal spur dike on the left (northeast) side near the bridge, bed elevations were about 407 ft (fig. 44). A series of medium to large dunes were detected throughout the middle of the channel, and a series of small dunes and ripples were along the left and right edges of the channel (fig. 44). Like in previous surveys (Huizinga, 2011, 2012, 2017a), a stone revetment was present on the upstream right (southwest) bank (fig. 44).
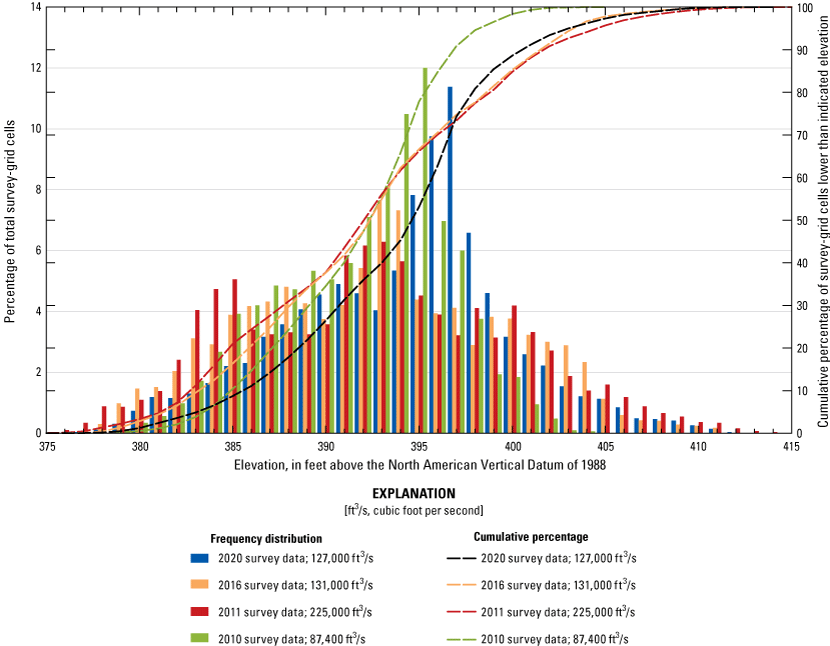
Frequency distribution of bed elevations for bathymetric survey-grid cells in 1-foot elevation bins on the Missouri River near structure A3047 on U.S. Highway 67 near St. Louis, Missouri, on August 6, 2020, compared to previous surveys in 2010, 2011, and 2016 (Huizinga, 2011, 2012, 2017a, respectively).
Small to moderate scour holes were present near the main channel piers, except pier 10 near the longitudinal spur dike on the left (north) side of the channel (figs. 44, 1.6). Near pier 10, the channel thalweg had an approximate minimum channel-bed elevation of about 379 ft (fig. 44; table 7), which is about 32 ft above the bottom of the seal course elevation of 346.50 ft (fig. 46; table 7); however, pier 10 is essentially embedded in the rock of the longitudinal spur dike, which will limit or prevent scour at this pier. At pier 11, the scour hole had an approximate minimum channel-bed elevation of about 381 ft (fig. 46; table 7), about 9 ft below the average channel bed upstream from the scour hole. At pier 12, the scour hole had an approximate minimum channel-bed elevation of about 391 ft (fig. 46; table 7), about 5 ft below the average channel bed upstream from the scour hole.
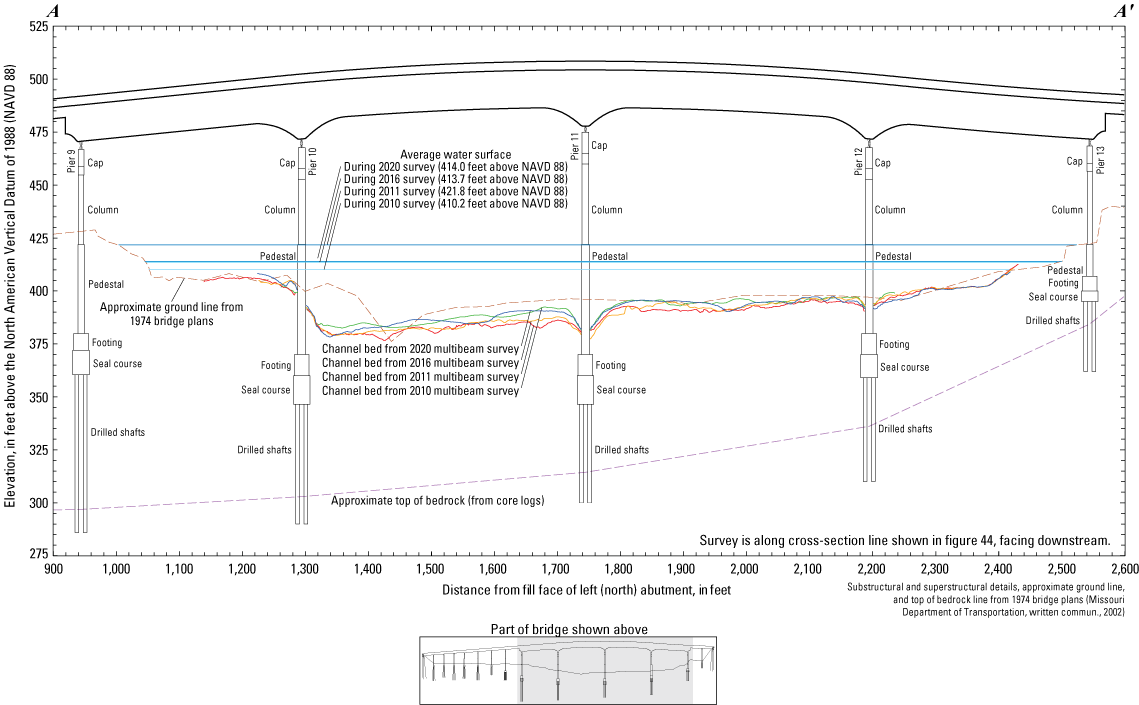
Key features, substructural and superstructural details, and surveyed channel bed of structure A3047 on U.S. Highway 67 crossing the Missouri River near St. Louis, Missouri.
Information from bridge plans indicates that pier 10 is founded on shafts drilled 13 ft into bedrock, and about 76 ft of bed material was present between the channel thalweg and bedrock at the bridge (table 7), and about 85 ft of bed material was present between the bed at the upstream pier face and bedrock (fig. 46; table 7). Pier 11 is founded on shafts drilled 15 ft into bedrock, and about 67 ft of bed material was present between the bottom of the scour hole and bedrock (fig. 46; table 7). Pier 12 is founded on shafts drilled 26 ft into bedrock, and about 55 ft of bed material was present between the bottom of the scour hole and bedrock (fig. 46; table 7).
Scour holes also were observed near the railroad bridge piers upstream from structure A3047. The scour hole near the railroad bridge pier upstream from pier 10 was essentially indistinguishable from the channel thalweg (fig. 44); however, substantial scour holes were present near the railroad bridge piers upstream from piers 11 and 12. Scour near the railroad bridge piers did not seem to affect the piers of structure A3047 (fig. 44). Like in previous surveys (Huizinga, 2011, 2012, 2017a), the remnants of old bridge piers were observed in the channel downstream from the existing railroad bridge piers (fig. 44).
The difference between the survey on August 6, 2020, and the previous survey on May 27, 2016 (fig. 47), indicates about 91 percent of the joint area of interest had detectable change, which means only about 9 percent of the differences in the joint area of interest are equivocal and within the bounds of uncertainty (table 8). Deposition seems dominant throughout most of the reach between 2016 and 2020 in the DoD, except in localized troughs in the medium to large dune features along the thalweg, and along the right (southeast) bank (fig. 47). The average difference between the bathymetric surfaces was +1.43 ft (table 8), indicating moderate channel aggradation between the 2016 and 2020 surveys. The net volume of cut in the reach from 2016 to 2020 was about 46,100 yd3, and the net volume of fill was about 141,600 yd3, resulting in a net gain of about 95,500 yd3 of sediment between 2016 and 2020 (table 8). The cross section from the 2020 survey along the upstream face of the bridge is generally similar to but above the 2016 survey section (fig. 46). The frequency distribution of bed elevations in 2020 is somewhat unique (fig. 45) because it is similar in overall shape to 2016 (and the others) but has a 3–5 ft shift towards higher elevations at the centroid of the elevation distribution. The stone revetment along the right (southeast) bank showed localized signs of minor scour and deposition (fig. 47).
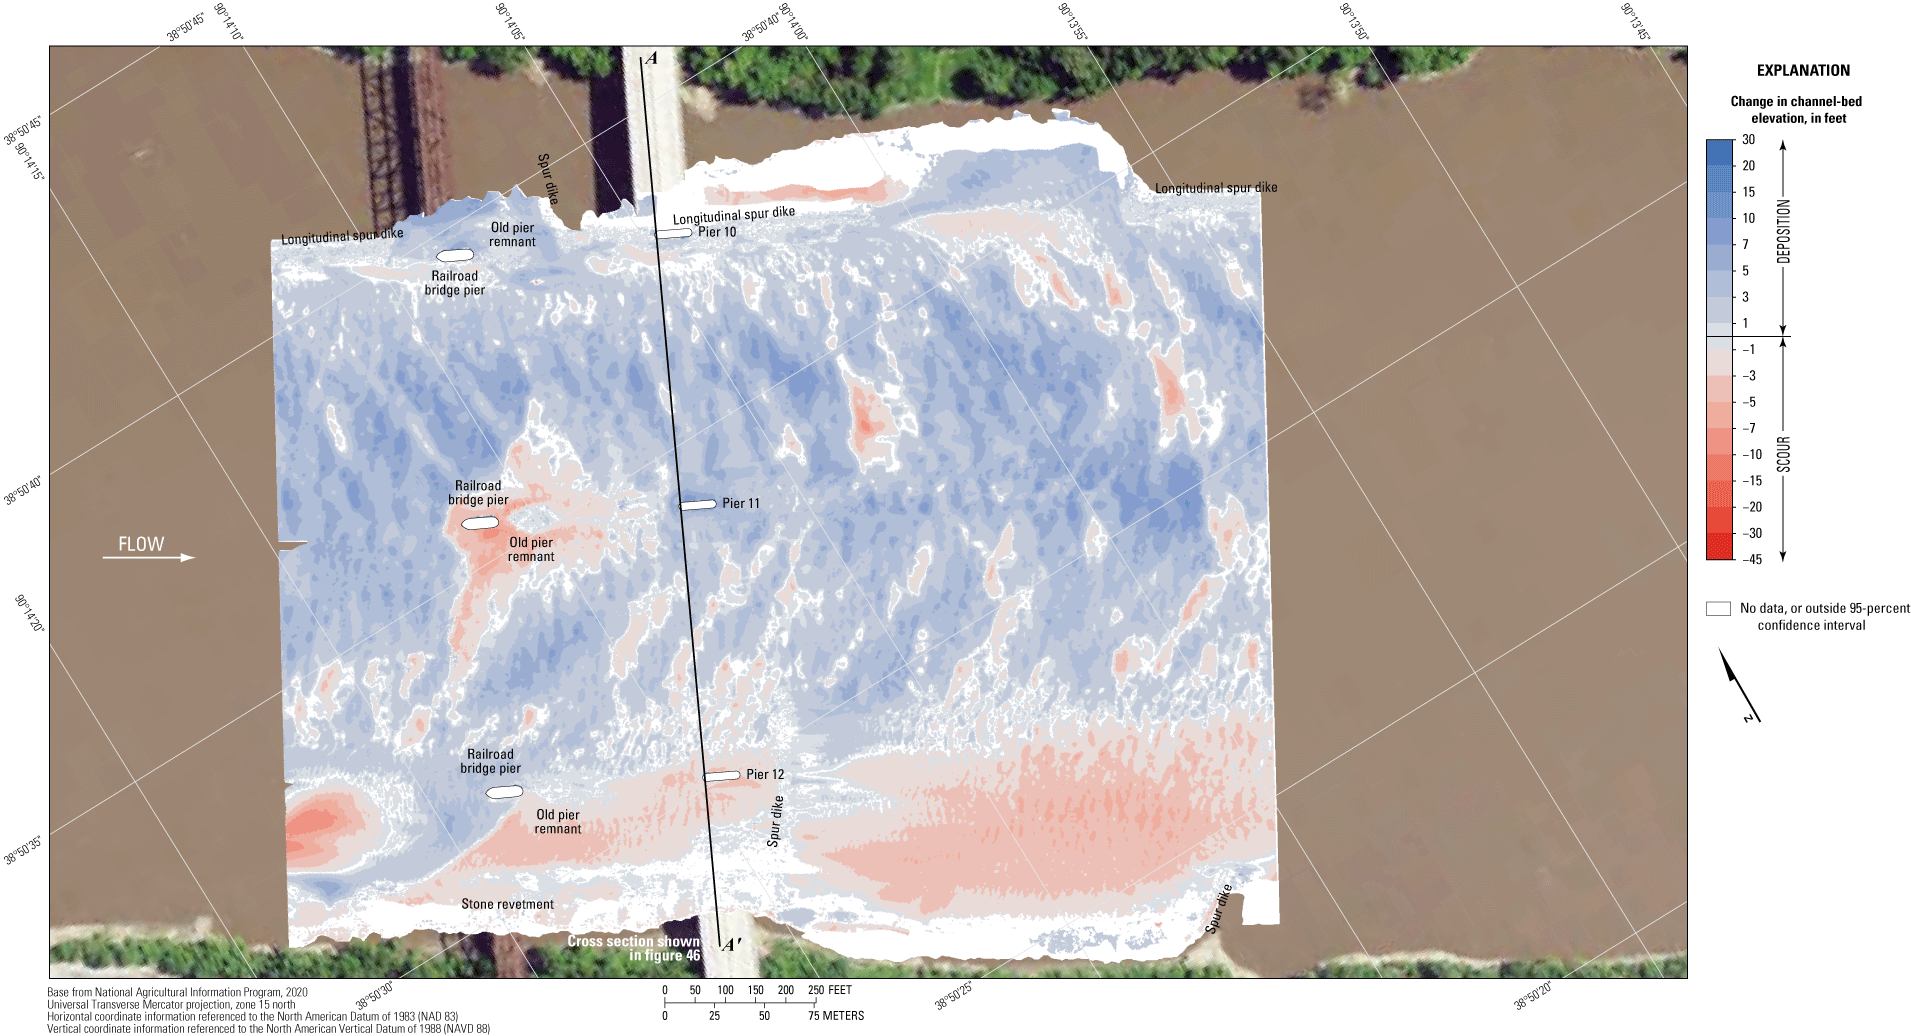
Difference between surfaces created from bathymetric surveys of the Missouri River channel near structure A3047 on U.S. Highway 67 near St. Louis, Missouri, on August 6, 2020, and May 27, 2016, with probabilistic thresholding.
The difference between the survey on August 6, 2020, and the flood survey on August 3, 2011 (fig. 48), indicates about 81 percent of the joint area of interest had detectable change, which means about 19 percent of the differences in the joint area of interest are equivocal and within the bounds of uncertainty (table 8). Deposition again seems dominant throughout most of the reach between 2011 and 2020 in the DoD, except for localized substantial erosion downstream from the spur dike on the upstream left (southeast) bank upstream from the surveyed reach, in the troughs in the medium to large dune features along the thalweg, and along the right (southeast) bank (fig. 48). The average difference between the bathymetric surfaces was +2.61 ft (table 8), which is the largest positive change observed in the 2020 surveys compared to previous surveys. The average difference indicates moderate to substantial channel aggradation between the 2011 and 2020 surveys; the net gain of sediment between 2011 and 2020 was about 159,300 yd3 (table 8). The cross section from the 2020 survey along the upstream face of bridge is generally above the 2011 survey section, except near the right (southeast) bank and near the piers (fig. 46). Like with 2016, the frequency distribution of bed elevations in 2020 has a 3–5 ft shift towards higher elevations at the centroid of the elevation distribution compared to 2011 (fig. 45). The stone revetment along the right (southeast) bank again showed localized signs of scour and deposition, but much of the difference is equivocal (fig. 48).
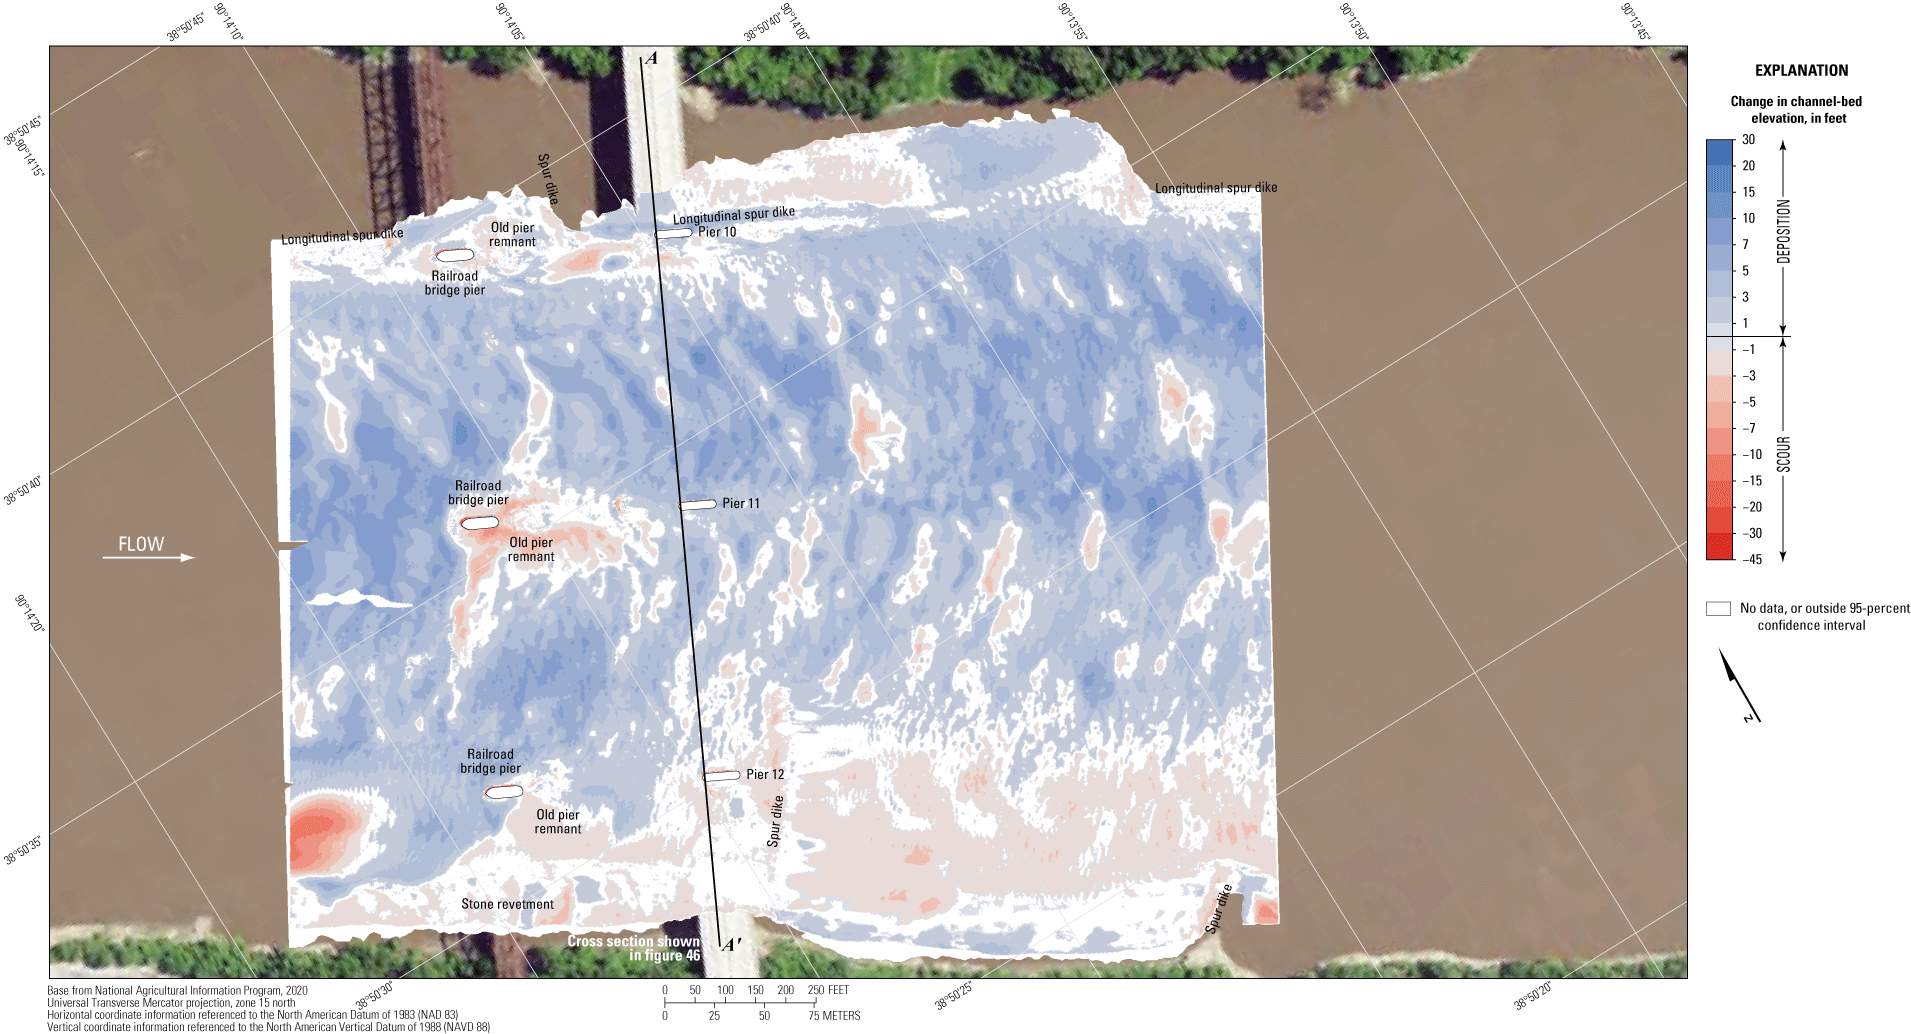
Difference between surfaces created from bathymetric surveys of the Missouri River channel near structure A3047 on U.S. Highway 67 near St. Louis, Missouri, on August 6, 2020, and August 3, 2011, with probabilistic thresholding.
The difference between the survey on August 6, 2020, and the earliest survey on October 25, 2010 (fig. 49), indicates about 82 percent of the joint area of interest had detectable change, which means about 18 percent of the differences in the joint area of interest are equivocal and within the bounds of uncertainty (table 8). Scour and deposition seem nearly balanced and evenly dispersed throughout the reach between 2010 and 2020 in the DoD (fig. 49). The average difference between the bathymetric surfaces was +0.24 ft (table 8), indicating the balance of scour and deposition between the 2010 and 2020 surveys. There was a net gain of sediment between 2010 and 2020 of only about 11,700 yd3, further indicating the balance of scour and deposition between 2010 and 2020 (table 8). The cross section from the 2020 survey along the upstream face of bridge varies above and below the 2010 survey section, except near the right (southeast) bank and near the piers (fig. 46). The frequency distribution of bed elevations in 2020 seems similar in shape to 2010 but with a lower percentage of cells for a given elevation (fig. 45). The difference in the distribution likely is the result of the substantially narrower survey area in 2010 and the general lack of bank information (fig. 49).
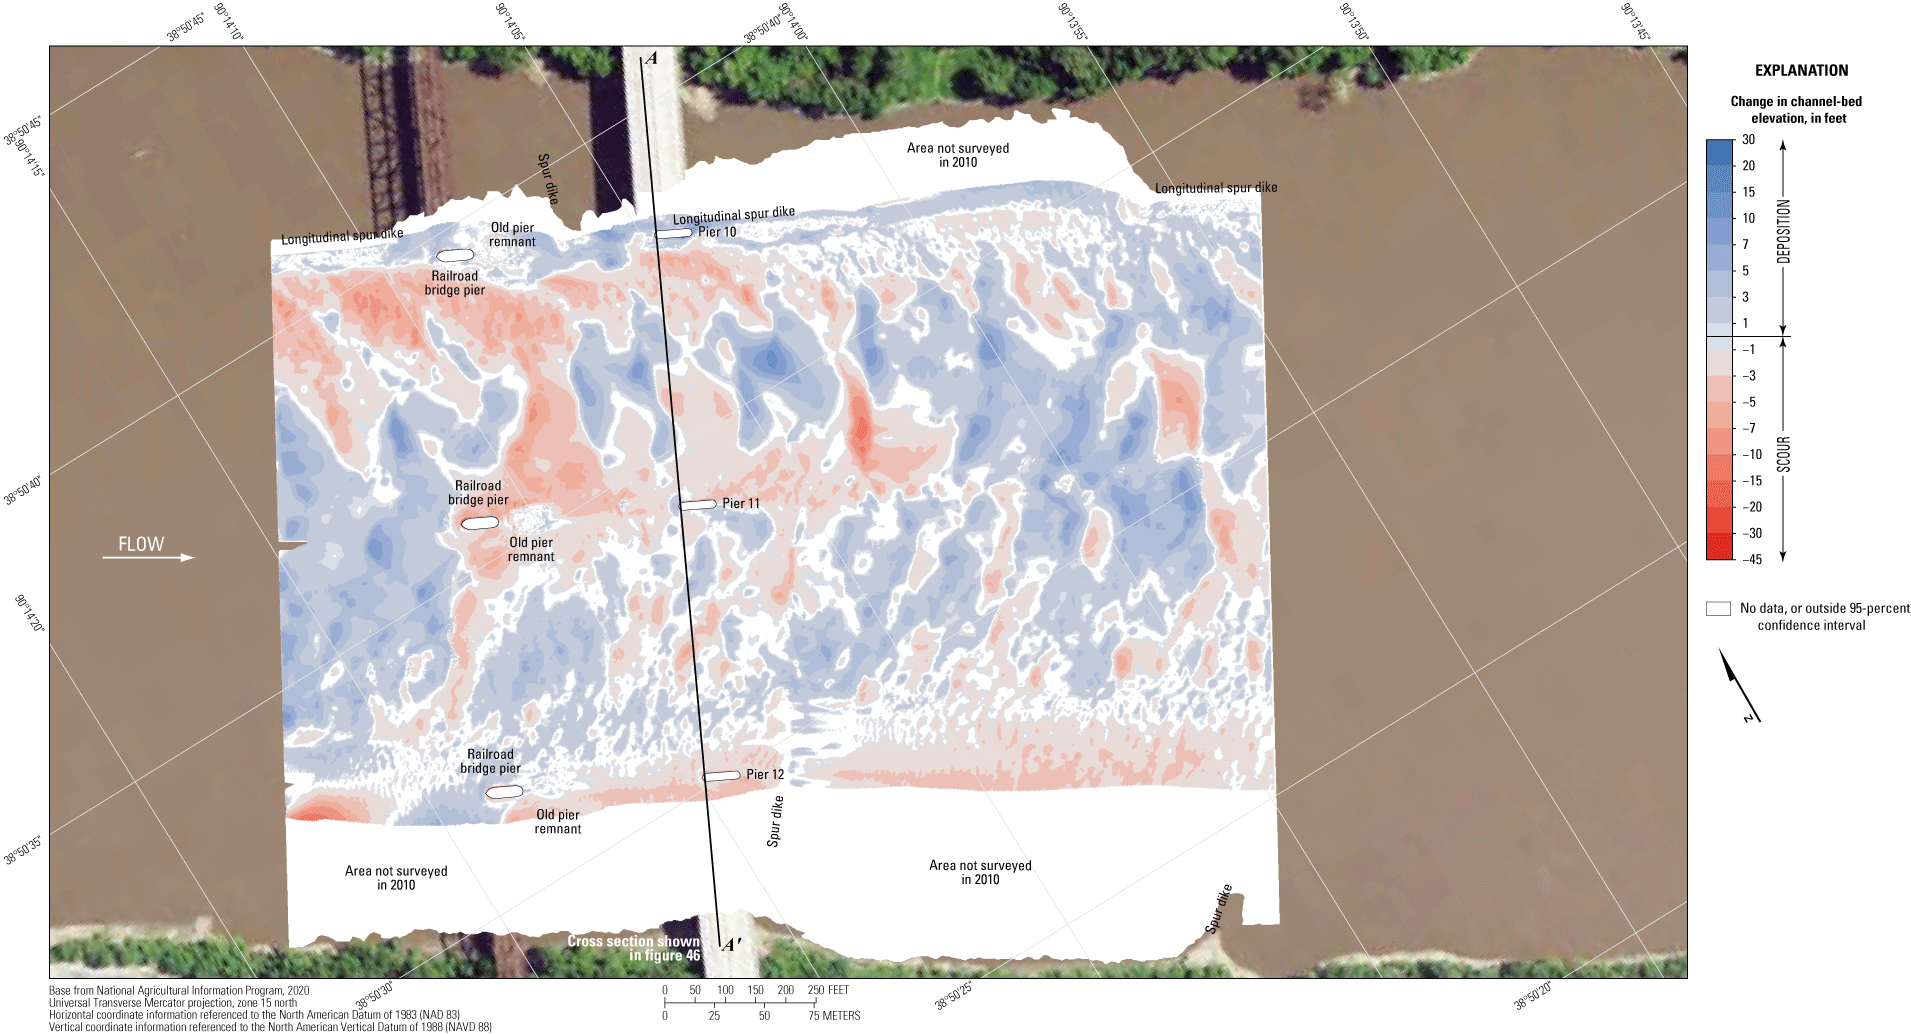
Difference between surfaces created from bathymetric surveys of the Missouri River channel near structure A3047 on U.S. Highway 67 near St. Louis, Missouri, on August 6, 2020, and October 25, 2010, with probabilistic thresholding.
The vertically averaged velocity vectors, which range from about 2 to 9 ft/s, indicate mostly uniform flow throughout the channel (fig. 50). Exceptions to uniform flow include angled flows near the ends of various spur dikes along the banks and minor turbulence downstream from the piers, which are slightly skewed to approach flow (fig. 50).
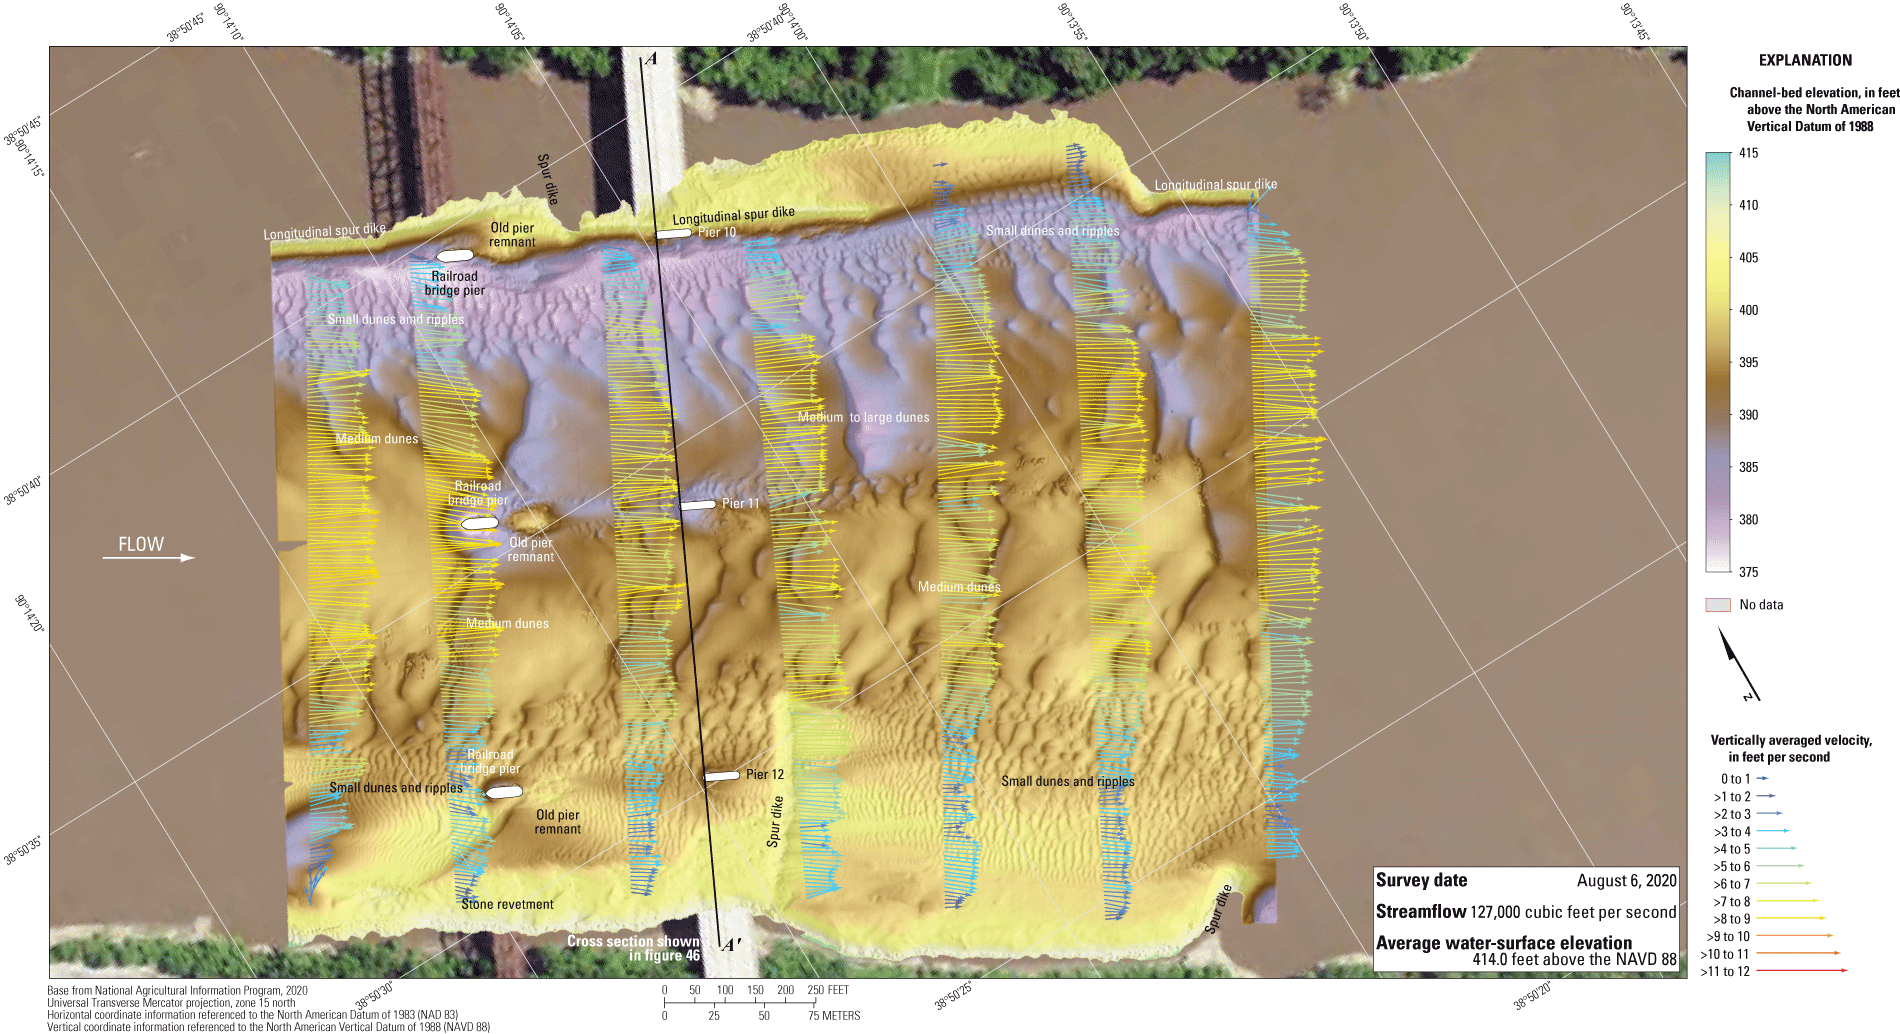
Bathymetry and vertically averaged velocities of the Missouri River channel near structure A3047 on U.S. Highway 67 near St. Louis, Missouri.
Structure A8504 on U.S. Highway 54 at Louisiana, Missouri
Structure A8504 (site 32; table 2) on U.S. Highway 54 crosses the Mississippi River at RM 283.2 at Louisiana, Mo., north of and upstream from St. Louis, Mo. (fig. 1). The site was surveyed on August 6, 2020, when the average water-surface elevation of the river in the survey area, determined by the RTK GNSS tide solution, was 449.2 ft (table 6; fig. 51); and streamflow on the Mississippi River was about 101,000 ft3/s during the survey (table 6). Structure A8504 was built downstream from K0932 (fig. 51), which it replaced in 2019 (table 2).
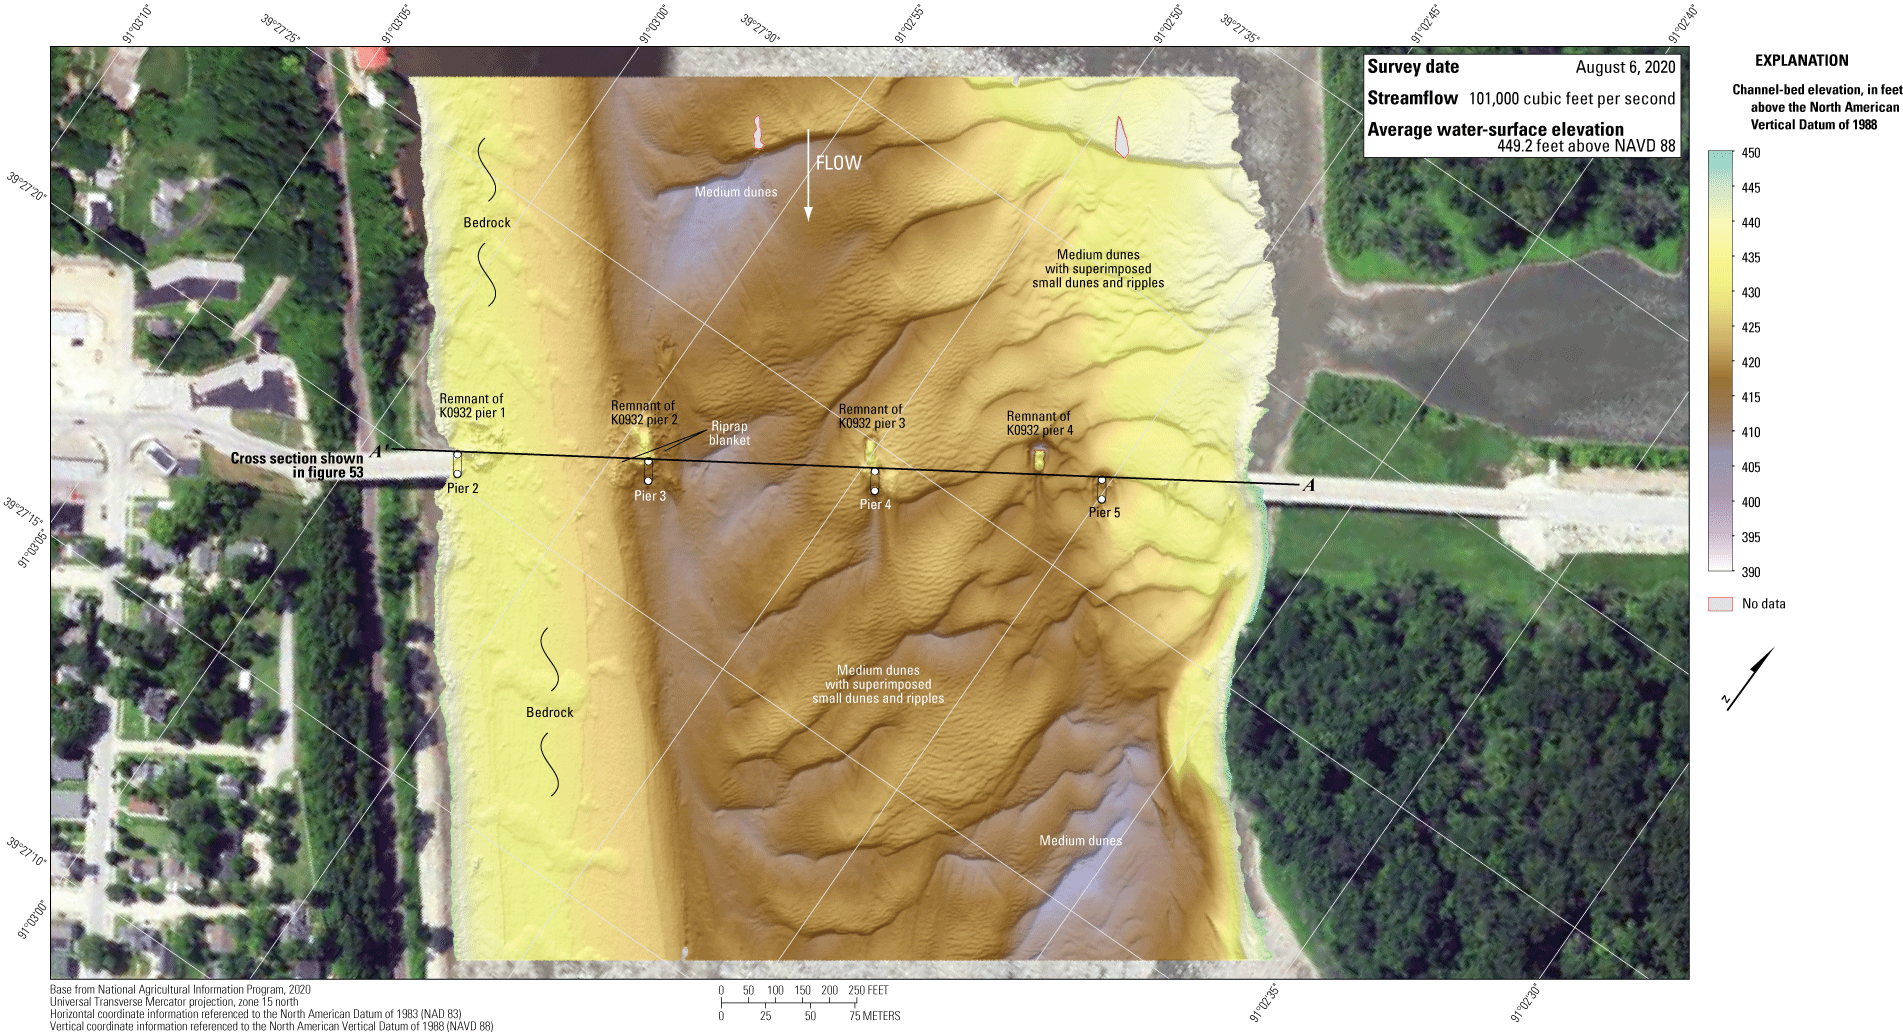
Bathymetric survey of the Mississippi River channel near structure A8504 on U.S. Highway 54 at Louisiana, Missouri.
The survey area was about 1,640 ft long and ranged from about 1,580 ft wide at the upstream end to about 1,440 ft wide at the downstream end, extending across the active channel from the left (northeast) bank to the right (southwest) bank (fig. 51). The survey area extended about 755 ft upstream from the centerline of structure A8504 and included piers 2 through 5, which were in the water during the survey (fig. 51). The channel-bed elevations ranged from about 412 to 438 ft for most of the surveyed area (5th to 95th percentile range of the bathymetric data; fig. 52; table 6), except near the medium dunes in the channel thalweg and downstream from the constriction caused by the left (northeast) bank downstream from the bridge, where the channel minimum elevation of 406 ft occurred (fig. 51; table 6). The channel was filled with medium dune features, and some were with superimposed small dunes and ripples. Like in previous surveys (Huizinga, 2015), a bedrock outcrop was present on the right (southwest) bank throughout the reach (fig. 51).
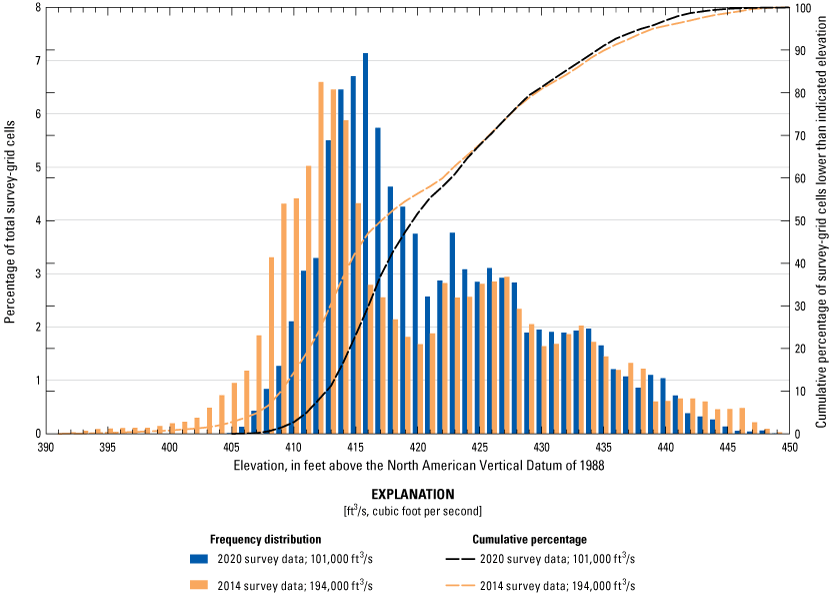
Frequency distribution of bed elevations for bathymetric survey-grid cells in 1-foot elevation bins on the Mississippi River near structure A8504 on U.S. Highway 54 at Louisiana, Missouri, on August 6, 2020, compared to a previous survey in 2014 (Huizinga, 2015).
Whereas no scour hole was observed near pier 2, small scour holes were observed near piers 3 and 4, and a moderate scour hole was observed near pier 5 (fig. 51; fig. 1.7). The scour hole near main channel pier 5 had a minimum channel-bed elevation of about 417 ft (fig. 53; table 9), which is about 9 ft below the average channel-bed elevation immediately upstream from the pier (the “Depth of scour hole from upstream channel bed” in table 9). The scour hole near pier 4 had a minimum channel-bed elevation of about 413 ft, but this elevation was observed downstream from the pier; the minimum elevation near the upstream pier face was about 420 ft, which is about 3 ft below the average channel-bed elevation upstream from the pier (table 9). The scour hole near pier 3 had a minimum elevation near the upstream pier face of about 416 ft, which is about 5 ft below the average channel-bed elevation upstream from that pier (table 9). Information from bridge plans indicate that all the main channel piers of structure A8504 are shafts drilled 16 to 30 ft into bedrock; about 35, 12, and 0 ft of bed material are between the bottom of the scour hole and bedrock at pier 5, pier 4, and piers 2 and 3, respectively, because of the sloping bedrock in the area (fig. 53; “Approximate distance between bottom of scour hole and bedrock” in table 9). Riprap blankets had been placed around piers 2 and 3 of old structure K0932, the remnants of which are partially visible in the 2020 survey (figs. 51, 53, 1.7C–1.7F); the riprap and bedrock near piers 2–4 of structure A8504 and the shape and configuration of the new piers likely will limit or prevent a substantial local scour hole forming near these piers.
Table 9.
Results near piers and bents from surveys on the Mississippi River near St. Louis, Missouri, August 6–10, 2020.[Data are summarized from Huizinga (2022b). Sites are shown on figure 1. All elevations are in feet above the North American Vertical Datum of 1988. MoDOT, Missouri Department of Transportation; --, not known/applicable]
The point of lowest elevation in the scour hole near the bridge pier/bent, not necessarily at the upstream face.
Indicated elevation is the minimum elevation in the area immediately next to the riprap blanket around the pier/bent.
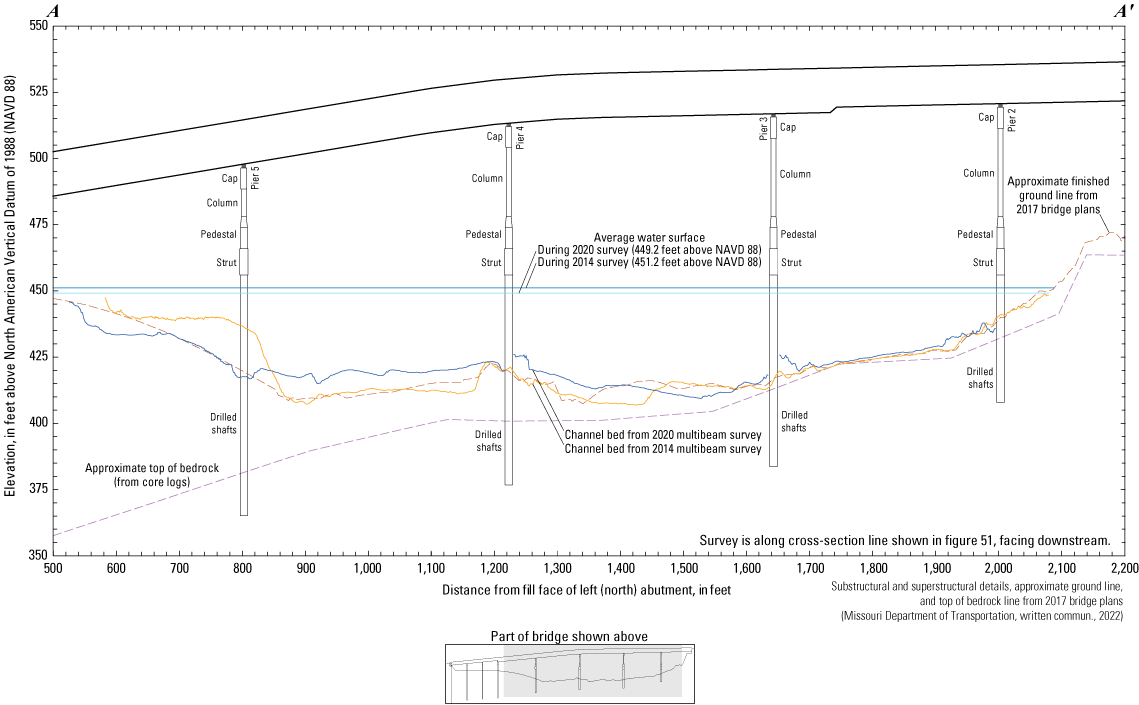
Key features, substructural and superstructural details, and surveyed channel bed of structure A8504 on U.S. Highway 54 crossing the Mississippi River at Louisiana, Missouri.
The difference between the survey on August 6, 2020, and the previous survey on June 6, 2014 (fig. 54), indicates about 89 percent of the joint area of interest had detectable change, which means about 11 percent of the differences in the joint area of interest are equivocal and within the bounds of uncertainty (table 8). Deposition seems dominant throughout most of the reach between 2014 and 2020 in the DoD, except in troughs in the medium dune features in the channel, and in the location of the former spur dike and the constriction on the left (northeast) bank (fig. 54). Removal of the spur dike seems to have altered the flow dynamics along the left (northeast) side of the reach. The average difference between the bathymetric surfaces was +2.41 ft (table 8), indicating moderate to substantial channel aggradation between the 2014 and 2020 surveys. The net volume of cut in the reach from 2014 to 2020 was about 87,900 yd3, and the net volume of fill was about 278,400 yd3, resulting in a net gain of about 190,500 yd3 of sediment between 2014 and 2020 (table 8), the most substantial increase in the surveys detailed in this report. However, the streamflow in 2020 was only about one-half the streamflow in 2014 (tables 6, 8). The cross section from the 2020 survey along the upstream face of the bridge was substantially different from the 2014 survey section, except on the right bank where bedrock constricts the channel (fig. 53), likely as a result of the removal of the spur dike on the left (northeast) bank. The frequency distribution of bed elevations in 2020 is similar in shape to 2014 but has about a 5-ft shift towards higher elevations below about 50 percent accumulation (fig. 52). The substantially lower elevations in the main channel during the 2014 survey may be the result of the streamflow being nearly twice as much compared to in 2020 (tables 6, 8). The stone revetment and bedrock outcrop along the right (southwest) bank showed localized signs of minor scour near pier 2 and general deposition elsewhere (fig. 54); however, the apparent deposition may be the result of minor horizontal positional variances between the surveys (see “Uncertainty Estimation” section).
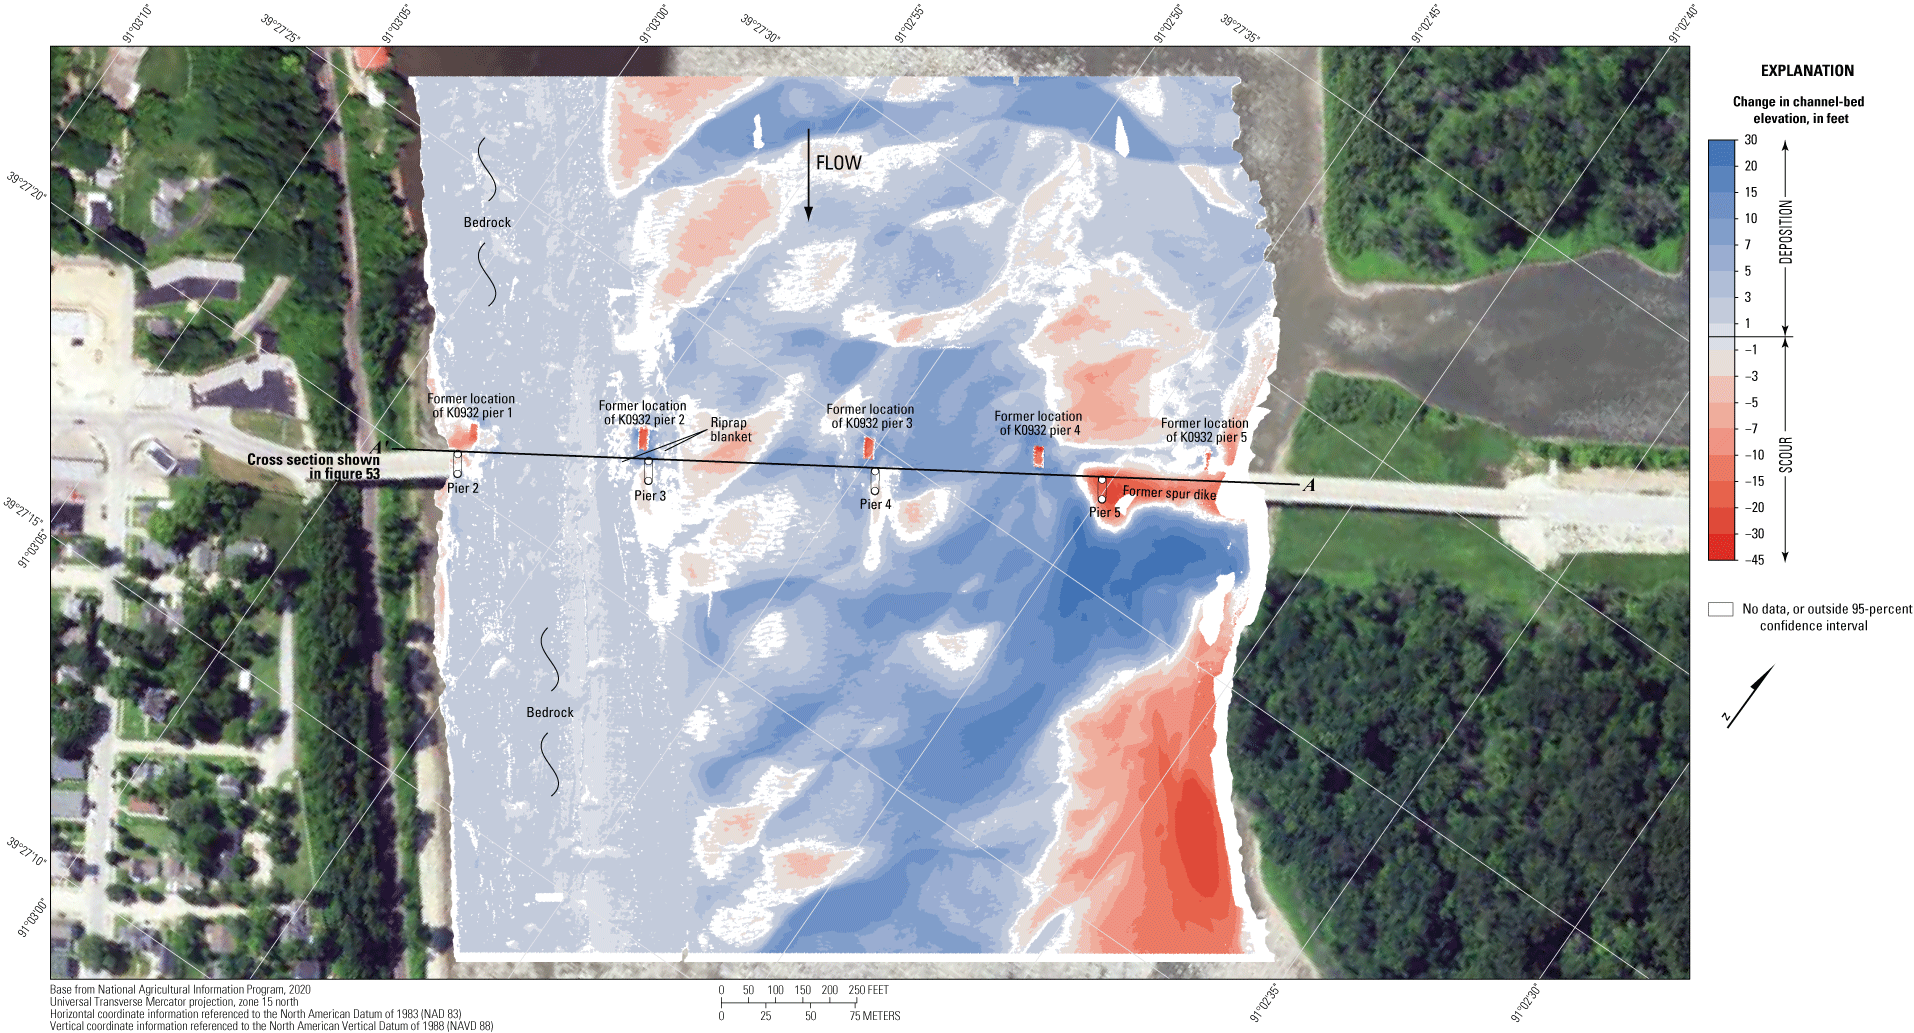
Difference between surfaces created from bathymetric surveys of the Mississippi River channel near structure A8504 on U.S. Highway 54 at Louisiana, Missouri, on August 6, 2020, and June 6, 2014, with probabilistic thresholding.
The vertically averaged velocity vectors, which range from about 2 to 5 ft/s, indicate directionally uniform flow throughout the channel (fig. 55). However, flow velocities seemed unusually variable in all the transects, which may result from upwelling of flow caused by the numerous medium dune features present throughout the channel (Best, 2005; fig. 55). The removal of the spur dike has a defined change on the velocity vectors along the left (northeast) bank (fig. 55; compare to fig. 19 in Huizinga [2015]).
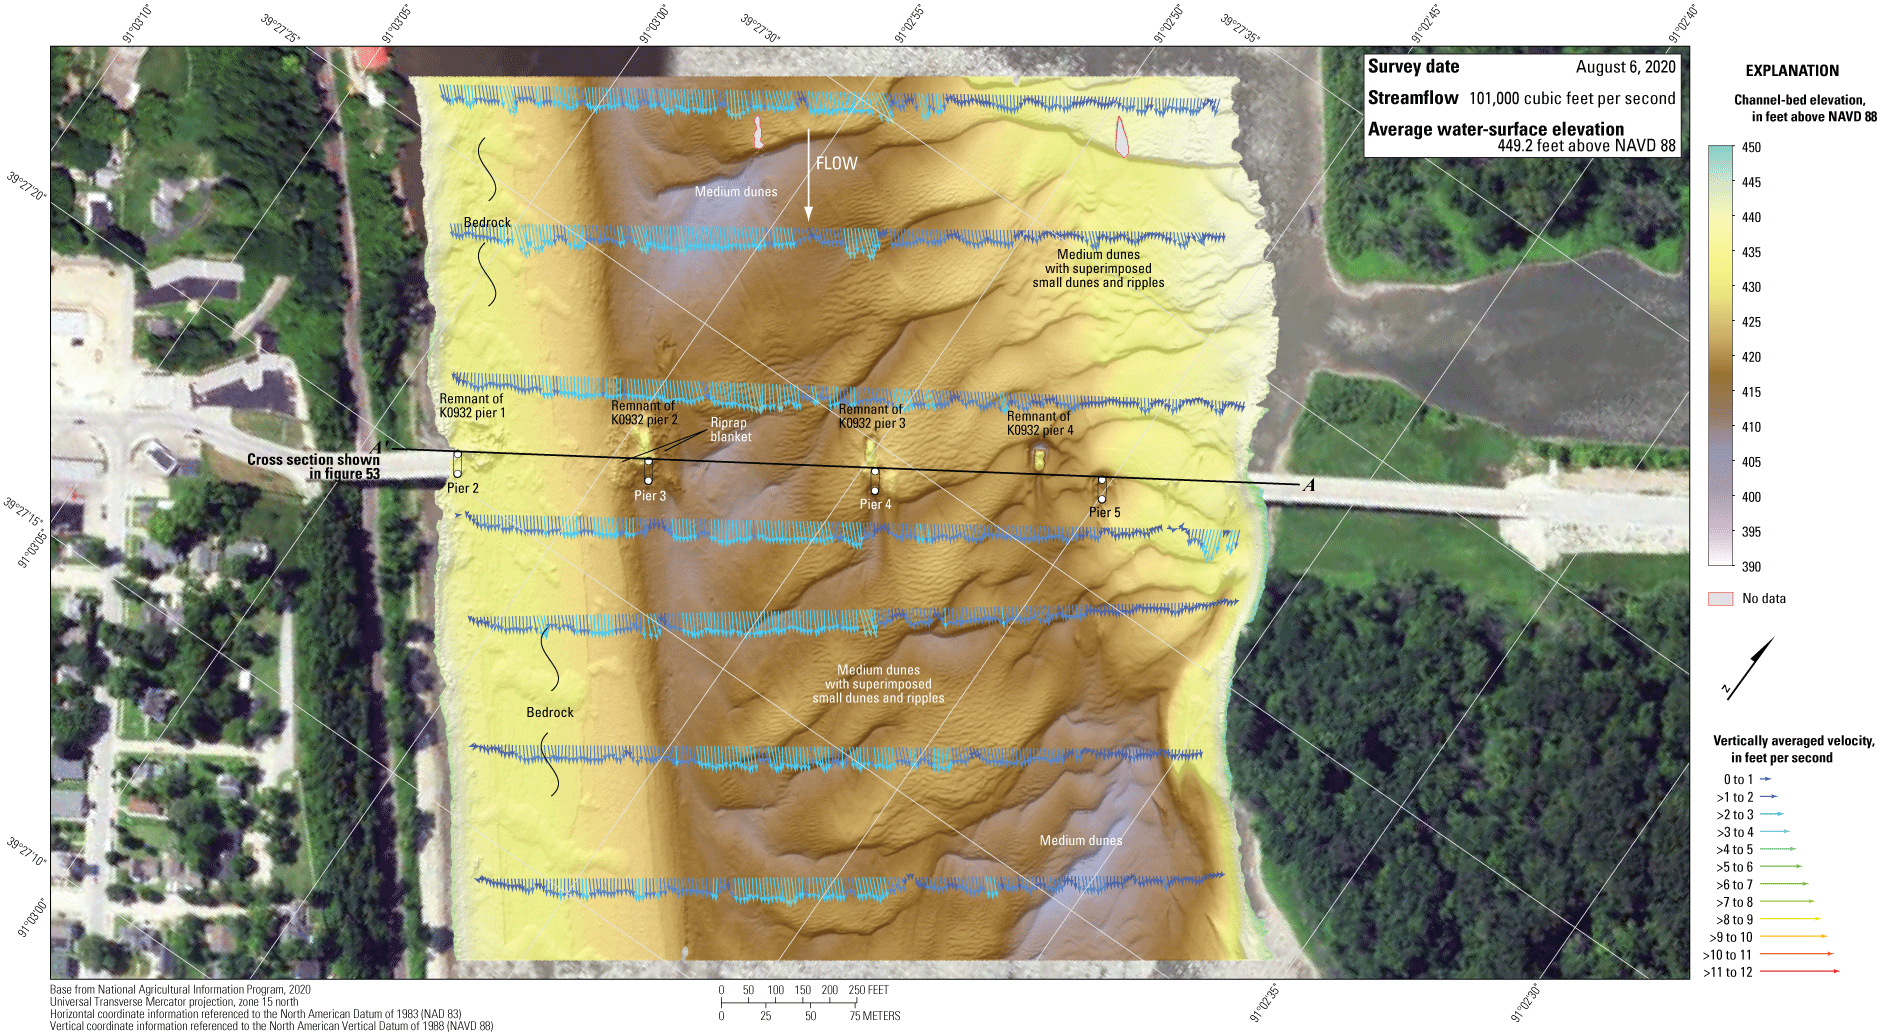
Bathymetry and vertically averaged velocities of the Mississippi River channel near structure A8504 on U.S. Highway 54 at Louisiana, Missouri.
Structure A6500 on Interstate 70
Structure A6500 (site 33; table 2) on Interstate 70 crosses the Mississippi River at RM 181.2, just north of downtown St. Louis, Mo. (fig. 1). The site was surveyed on August 7, 2020, when the average water-surface elevation of the river in the survey area, determined by the RTK GNSS tide solution, was 394.4 ft (table 6; fig. 56); and streamflow on the Mississippi River was about 225,000 ft3/s during the survey (table 6).
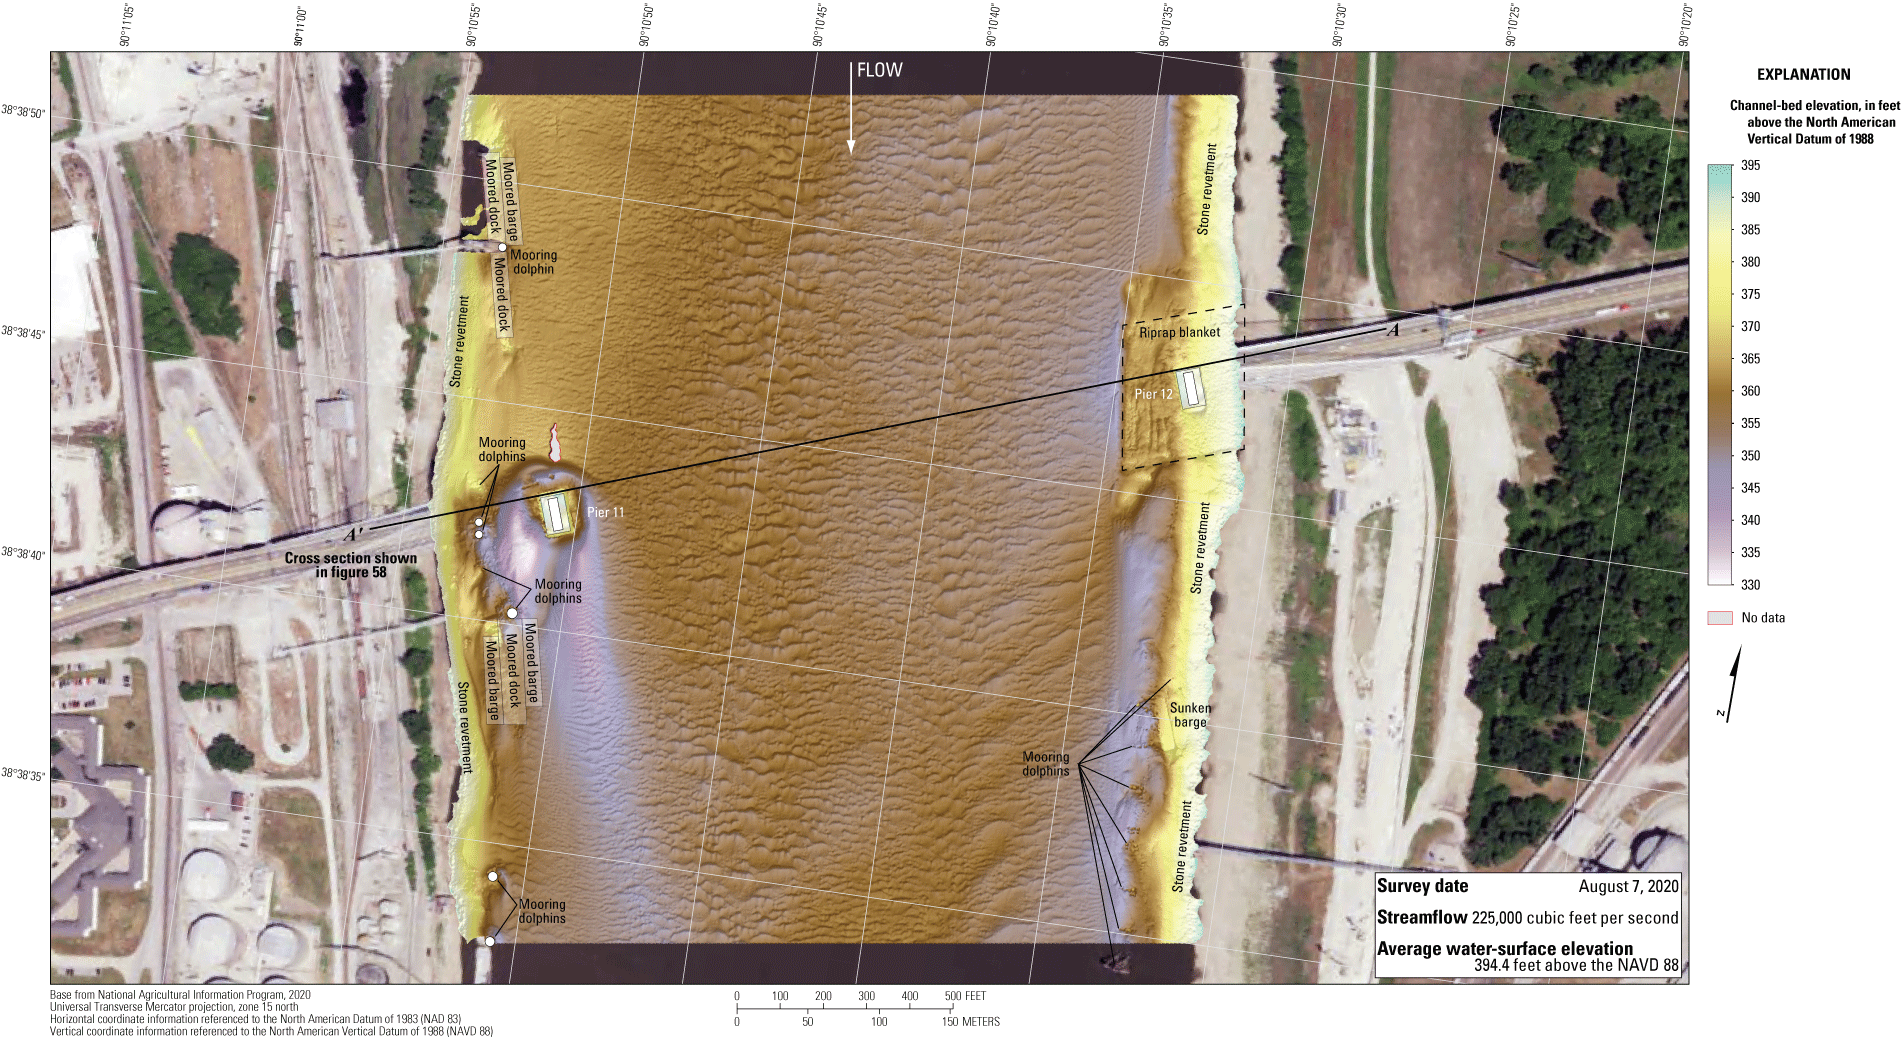
Bathymetric survey of the Mississippi River channel near structure A6500 on Interstate 70 in St. Louis, Missouri.
The survey area was about 1,970 ft long and about 1,800 ft wide, extending from bank to bank in the main channel (fig. 56). The survey area extended about 860 ft upstream from the centerline of structure A6500 (fig. 56). The channel-bed elevations ranged from about 351 to 376 ft for most of the surveyed area (5 to 95 percentile range of the bathymetric data; fig. 57; table 6) except downstream from the right (west) main channel pier, where the overall minimum channel-bed elevation was 333 ft (tables 6, 9; fig. 56). A poorly defined thalweg was present along the left (east) bank throughout the length of the surveyed area. Numerous small dunes and ripples were detected throughout the channel (fig. 56). Like in the previous surveys (Huizinga and others, 2010; Huizinga, 2017a), stone revetment was present on both banks throughout the reach (fig. 56).
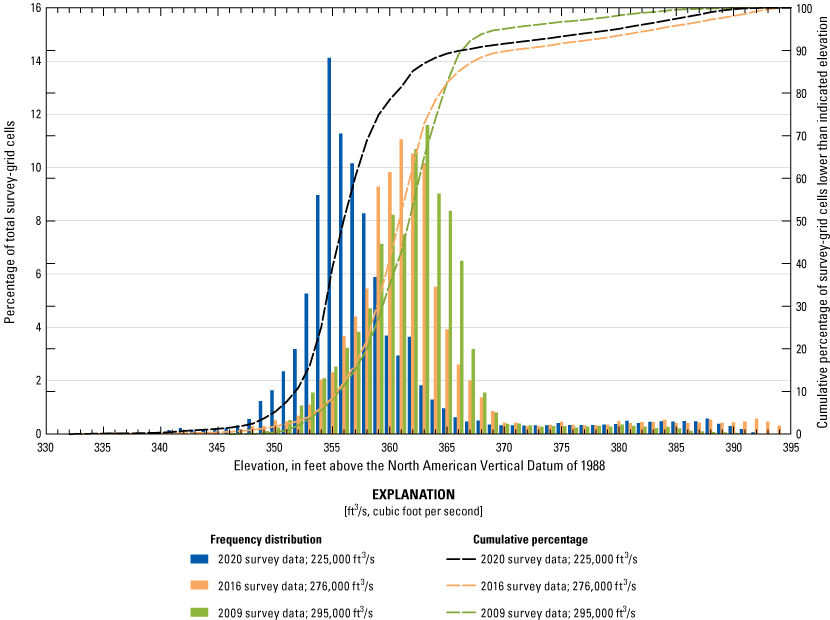
Frequency distribution of bed elevations for bathymetric survey-grid cells in 1-foot elevation bins on the Mississippi River near structure A6500 on Interstate 70 in St. Louis, Missouri, on August 7, 2020, compared to previous surveys in 2009 and 2016 (Huizinga and others, 2010, and Huizinga, 2017a, respectively).
Like in the previous survey (Huizinga, 2017a), a scour hole is not present near the left (east) main channel pier 12 because the pier is surrounded with a riprap blanket (figs. 56, 1.8; table 9). The top of the riprap blanket is slightly higher than the bottom of the pier seal course elevation of 361.50 ft (fig. 58; table 9). Main channel pier 11 seems to be partly surrounded with mounded riprap, but the top of the riprap pile is below the bottom of the seal course elevation on the downstream side of the pier (figs. 58, 1.8; table 9). The approximate elevation of the bottom of the scour hole on the upstream side of the pier is about 343 ft, about 18 ft below the bottom of the seal course (table 9); however, the approximate minimum elevation of the scour hole was about 333 ft, the overall minimum elevation for the survey (table 6; fig. 56), and about 28 ft below the bottom of the seal course (table 9). Information from bridge plans indicates that pier 11 is founded on shafts drilled 22 ft into bedrock, and about 15 ft of bed material were present between the bottom of the scour hole and bedrock (fig. 58; table 9). Like noted in the previous study at this site (Huizinga, 2017a), the seal course seems to be larger than the footing by about 7 ft on each side for both piers (figs. 58, 1.8), which is not indicated in the plans. Also like noted in the previous report at this site (Huizinga, 2017a), the approximate ground line from the 2010 bridge plans was digitized directly from the plans and seems to plot in the correct location relative to the interface between the footings and seal courses according to the plans; however, it is uncertain why this line is more than 20 ft higher than the three bathymetric survey lines (fig. 58).

Key features, substructural and superstructural details, and surveyed channel bed of structure A6500 on Interstate 70 crossing the Mississippi River in St. Louis, Missouri.
The very wide face of the pier 11 footing and seal course (greater than 55 ft wide) would behave as a complex foundation, and the pier being skewed to approach flow (fig. 59) likely further exacerbates scour at pier 11 (Arneson and others, 2012). The scour hole near this pier has a ridge of deposition on the downstream side as might be expected, but the deepest part of the hole also is on the leeward (right, or west) side (fig. 56).
The vertically averaged velocity vectors indicate flow away from the bank downstream and to the right (west) of the pier (fig. 59), which means flow may be deflected towards the right bank off the upstream face of the pier footer and seal course, and then redirected again off the revetement-covered right bank and the minor bank protuberance downstream from the bridge. These combined redirections of flow may worsen the horseshoe vortex turbulence typically observed near piers (Arneson and others, 2012).
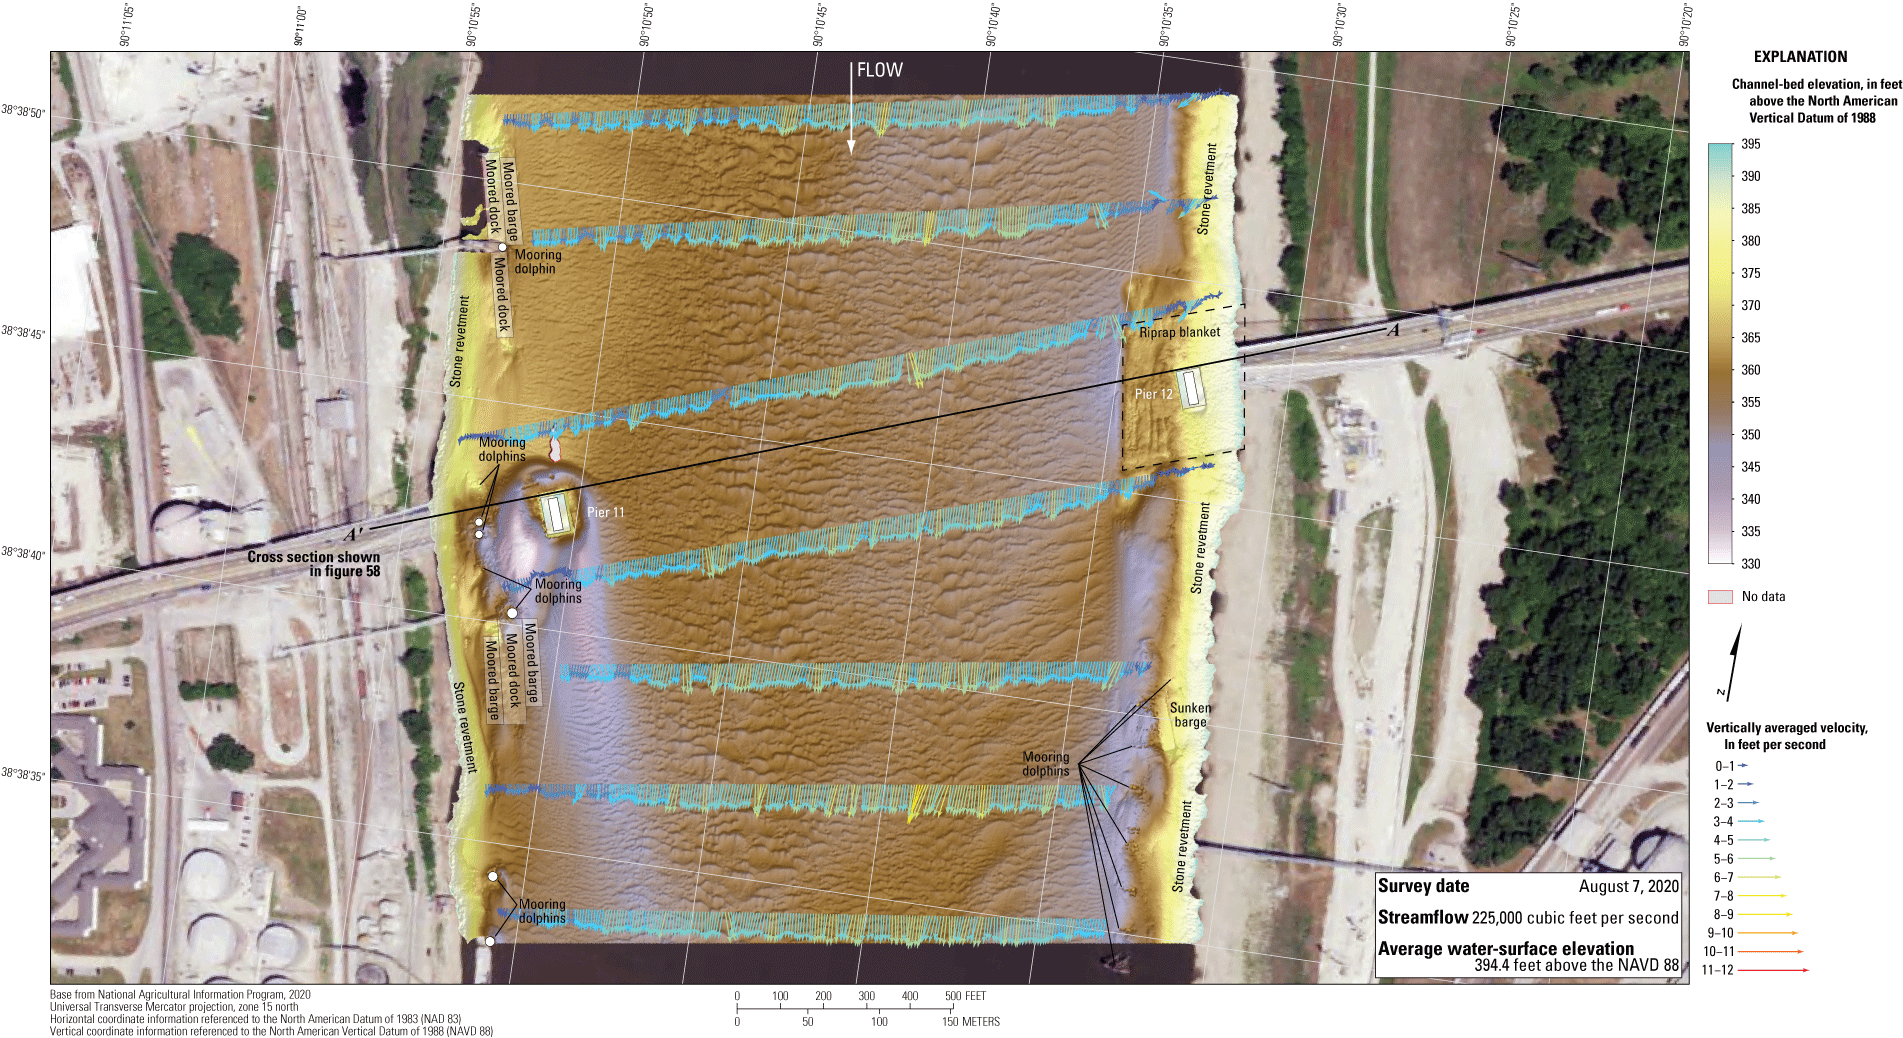
Bathymetry and vertically averaged velocities of the Mississippi River channel near structure A6500 on Interstate 70 in St. Louis, Missouri.
In the rest of the reach, the vertically averaged velocity vectors, which range from 2 to 8 ft/s, seemed variable in direction and magnitude in all the transects (fig. 59). Medium to large dune features were not present that might cause upwelling like at other nearby structures discussed in this report, but some features specific to bridge structure A6500 (bank protuberances, skewed piers, mooring dolphins along the banks, and so on) likely contribute to non-uniform flow at this site (fig. 59).
The difference between the survey on August 7, 2020, and the previous survey on May 25, 2016 (fig. 60), indicates about 93 percent of the joint area of interest had detectable change, which means only about 7 percent of the differences in the joint area of interest are equivocal and within the bounds of uncertainty (table 8). Scour seems dominant throughout most of the reach between 2016 and 2020 in the DoD, except in localized troughs in the medium to large dune features along the left (west) bank in the 2016 survey (fig. 60). The scour hole near pier 11 was wider and deeper in 2020 than in 2016 (fig. 60), despite the lower streamflow (table 8). The average difference between the bathymetric surfaces was –4.02 ft (table 8), indicating moderate to substantial channel degradation between the 2016 and 2020 surveys. The net volume of cut in the reach from 2016 to 2020 was about 492,600 yd3, and the net volume of fill was about 12,900 yd3, resulting in a net loss of about 479,700 yd3 of sediment between 2016 and 2020 (table 8), which is the second-most substantial loss of the surveys detailed in this report. The cross section from the 2020 survey along the upstream face of the bridge is generally similar to but 5–10 ft below the 2016 survey section (fig. 58). The frequency distribution of bed elevations in 2020 is somewhat unique (fig. 57) in that it is similar in overall shape to 2016 (which is similar to 2009) but has a 5–8 ft shift of the centroid towards lower elevations. The stone revetment along the banks showed localized signs of minor scour and deposition (fig. 60); however, the apparent scour or deposition may be the result of minor horizontal positional variances between the surveys (see “Uncertainty Estimation” section).
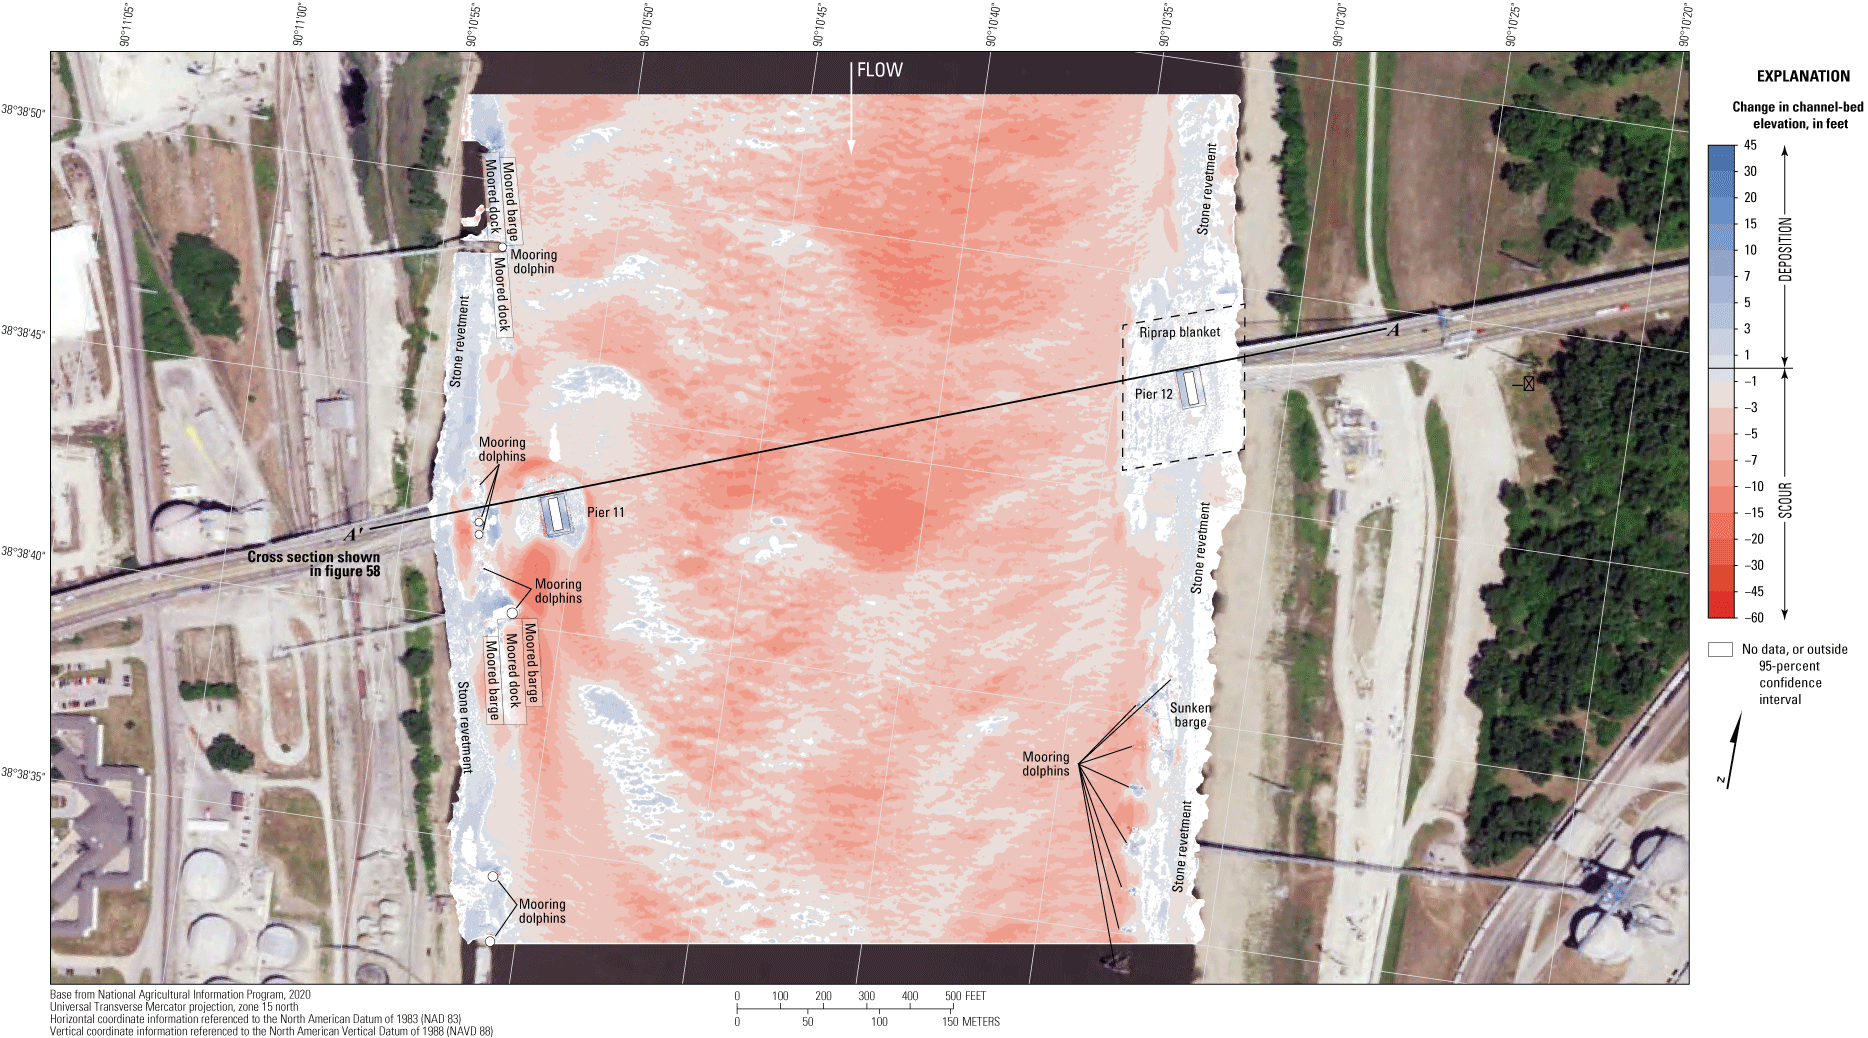
Difference between surfaces created from bathymetric surveys of the Missouri River channel near structure A6500 on Interstate 70 in St. Louis, Missouri, on August 7, 2020, and May 25, 2016, with probabilistic thresholding.
The difference between the survey on August 7, 2020, and the preconstruction habitat assessment survey (Huizinga and others, 2010) on July 7, 2009 (fig. 61), also indicates about 93 percent of the joint area of interest had detectable change, which means only about 7 percent of the differences in the joint area of interest are equivocal and within the bounds of uncertainty (table 8). Scour seems dominant throughout most of the reach between 2009 and 2020 in the DoD, except in localized troughs in the medium to large dune features in the middle of the channel in the 2009 survey (fig. 61). The average difference between the bathymetric surfaces was –5.62 ft (table 8), which is the largest negative change observed in the 2020 surveys compared to previous surveys. The average difference indicates substantial channel degradation between the 2009 and 2020 surveys, and the net loss of sediment between 2009 and 2020 was about 649,400 yd3 (table 8), which is the most substantial loss between the surveys detailed in this report. The cross section from the 2020 survey along the upstream face of the bridge is generally below the 2009 survey section, except near the middle of the channel where they are almost equal (fig. 58). Like previously noted, the frequency distribution of bed elevations in 2020 is somewhat unique (fig. 57) in that it is similar in overall shape to 2009 and 2016 but has a 5–8 ft shift of the centroid towards lower elevations. Apparent scour and deposition of the stone revetment along the banks (fig. 61) likely is the result of minor horizontal positional variances between the surveys (see “Uncertainty Estimation” section) and changes made during bridge construction.
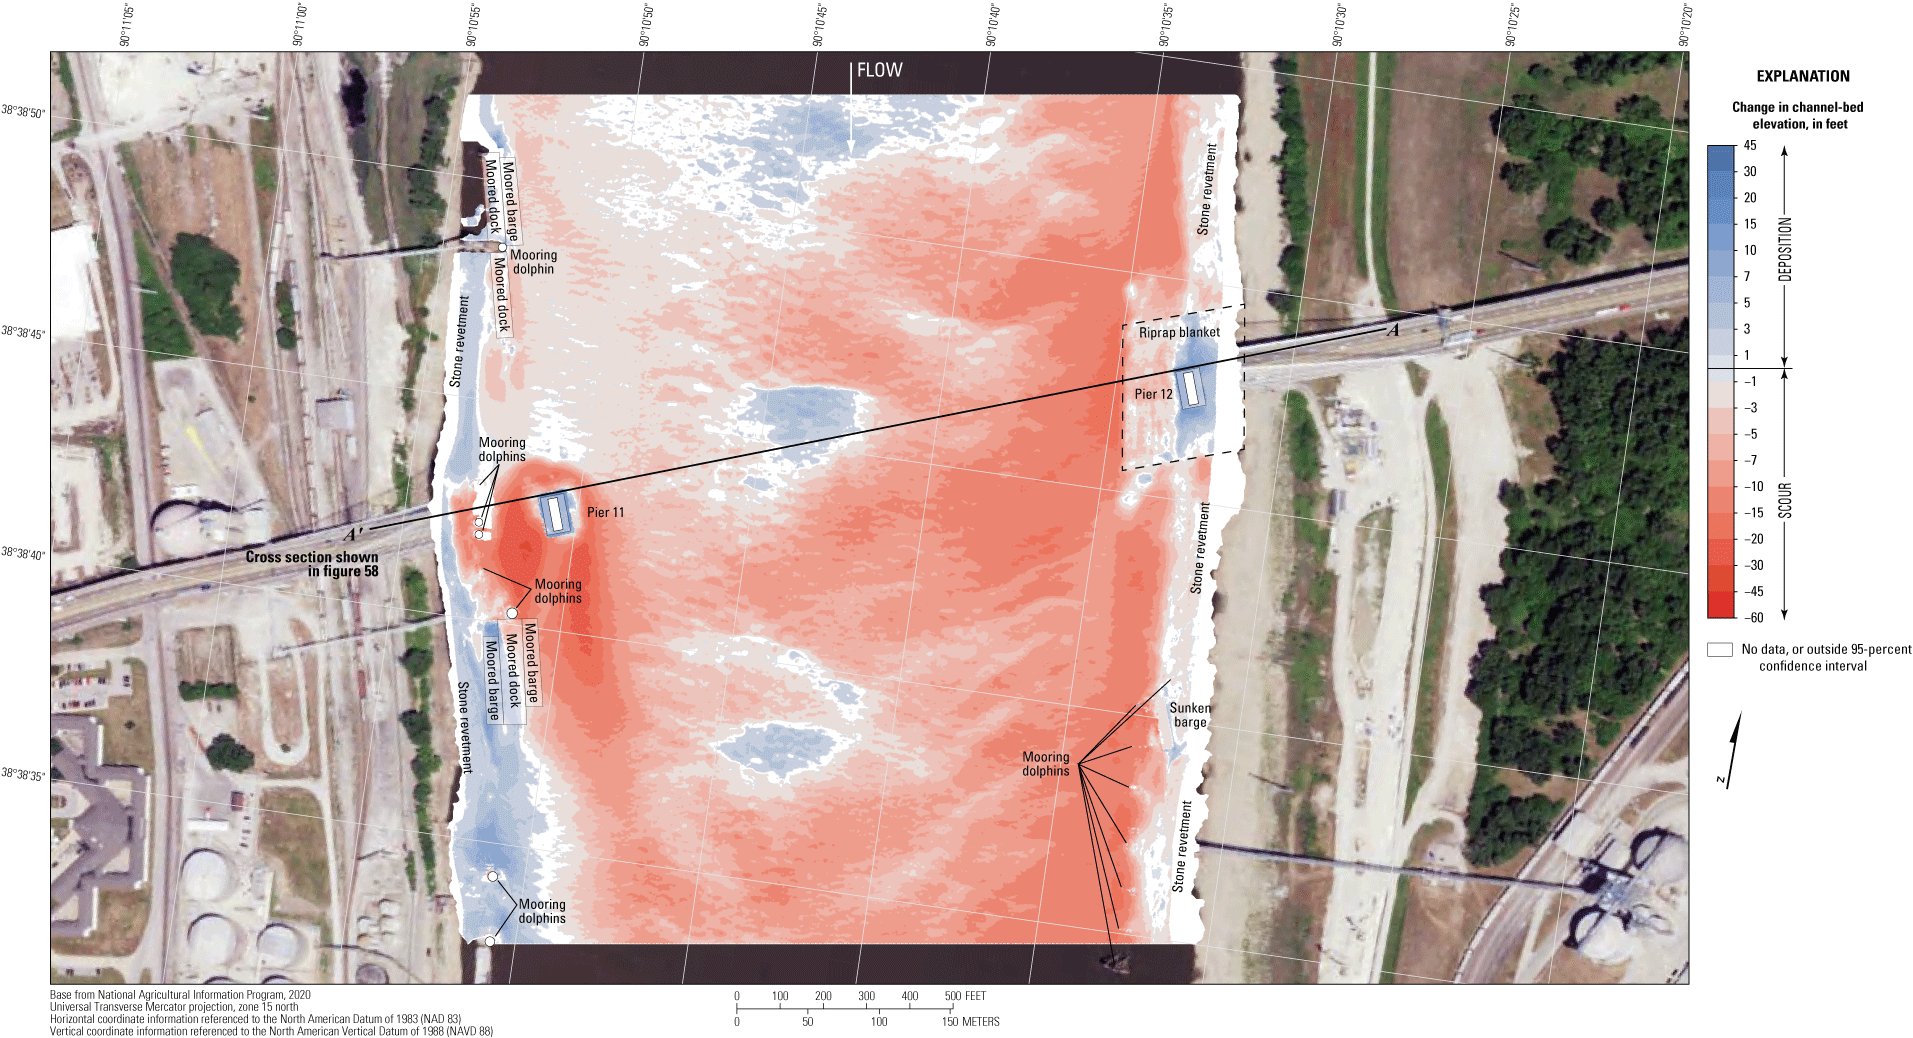
Difference between surfaces created from bathymetric surveys of the Missouri River channel near structure A6500 on Interstate 70 in St. Louis, Missouri, on August 7, 2020, and July 7, 2009, with probabilistic thresholding.
Structure A1500 on Interstate 55
Structure A1500 (site 34; table 2) on Interstate 55 crosses the Mississippi River at RM 179.2, just east of downtown St. Louis, Mo. (fig. 1). The site was surveyed on August 7, 2020, when the average water-surface elevation of the river in the survey area, determined by the RTK GNSS tide solution, was 393.8 ft (table 6; fig. 62); and streamflow on the Mississippi River was about 210,000 ft3/s during the survey (table 6).
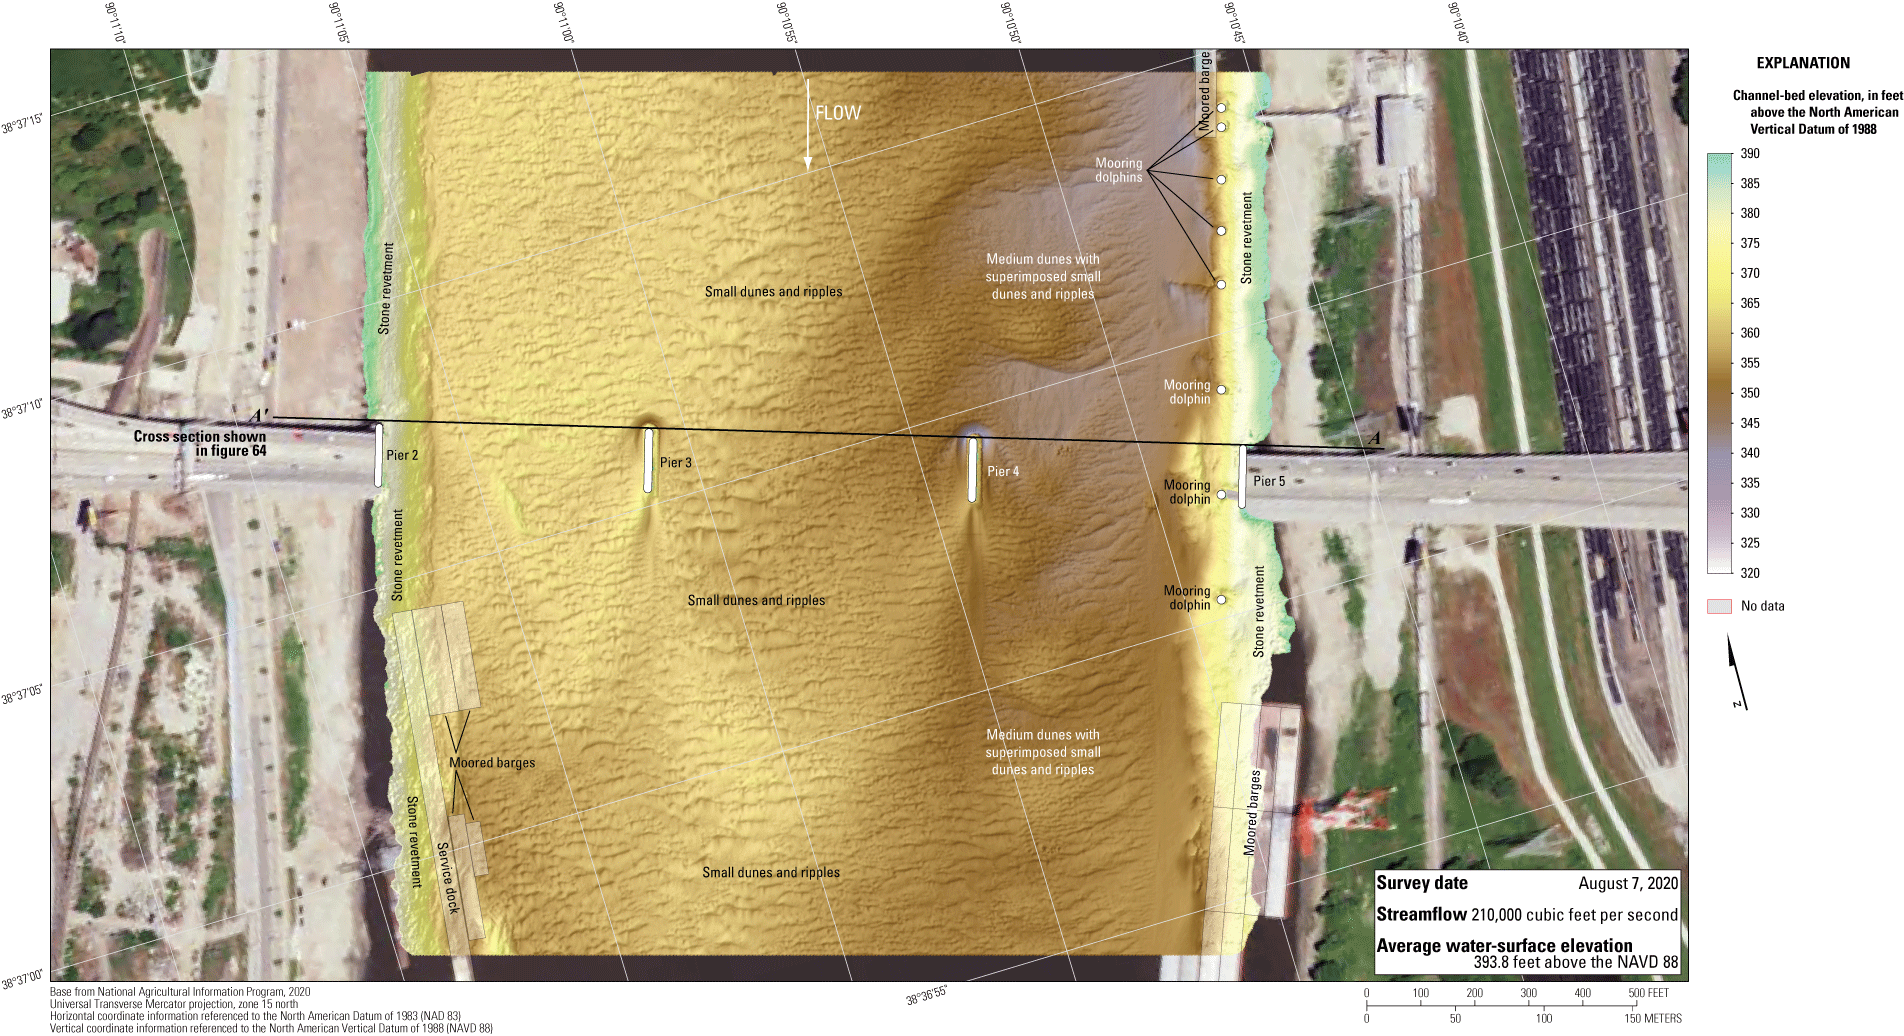
Bathymetric survey of the Mississippi River channel near structure A1500 on Interstate 55 in St. Louis, Missouri.
The survey area was about 1,640 ft long and about 1,650 ft wide, extending from bank to bank in the main channel (fig. 62). The survey area extended about 720 ft upstream from the centerline of structure A1500 (fig. 62). The channel-bed elevations ranged from about 347 to 374 ft for most of the surveyed area (5 to 95 percentile range of the bathymetric data; fig. 63; table 6) except near pier 4, where the overall minimum channel-bed elevation was 338 ft (tables 6, 9) and along the toe of the left (east) bank (fig. 62). The thalweg along the left (east) bank extended throughout the surveyed reach and was about 12–15 ft deeper than the rest of the channel bed (fig. 62). A row of medium dune features with superimposed small dunes and ripples were observed in the left (east) side of the channel, along with numerous small dunes and ripples throughout the rest of the channel (fig. 62). Like in the previous surveys (Huizinga, 2011, 2017a), stone revetments were present on both banks (fig. 62).
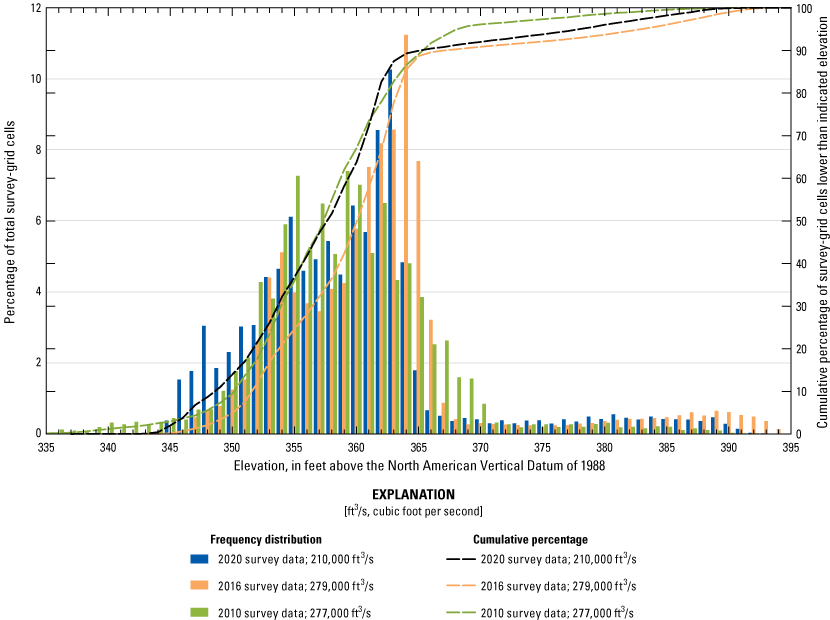
Frequency distribution of bed elevations for bathymetric survey-grid cells in 1-foot elevation bins on the Mississippi River near structure A1500 on Interstate 55 in St. Louis, Missouri, on August 7, 2020, compared to previous surveys in 2010 and 2016 (Huizinga, 2011, 2017a, respectively).
A scour hole was not observed near the left bank pier 5 (figs. 62, 1.9A). The upper left bank is covered with a gravel- and cobble-sized revetment that extends to the toe of the bank and limits or prevents scour at this pier. The channel thalweg at the toe of the left bank had a minimum elevation of about 358 ft immediately downstream from the bridge between piers 4 and 5 (fig. 62), which is about 2 ft above the bottom of the seal course elevation of 356.00 ft (fig. 64; table 9); however, the thalweg is more than 100 ft to the right of the pier (figs. 62, 64). Information from bridge plans indicates that pier 5 is founded on shafts drilled 7 ft into bedrock, and about 71 ft of bed material was present between the channel thalweg and bedrock near the bridge (fig. 64), and about 92 ft of bed material was present between the bed and bedrock at the upstream pier face (fig. 64; difference between “Approximate elevation of scour hole at upstream pier/bent face” and “Approximate elevation of bedrock near pier/bent” in table 9).
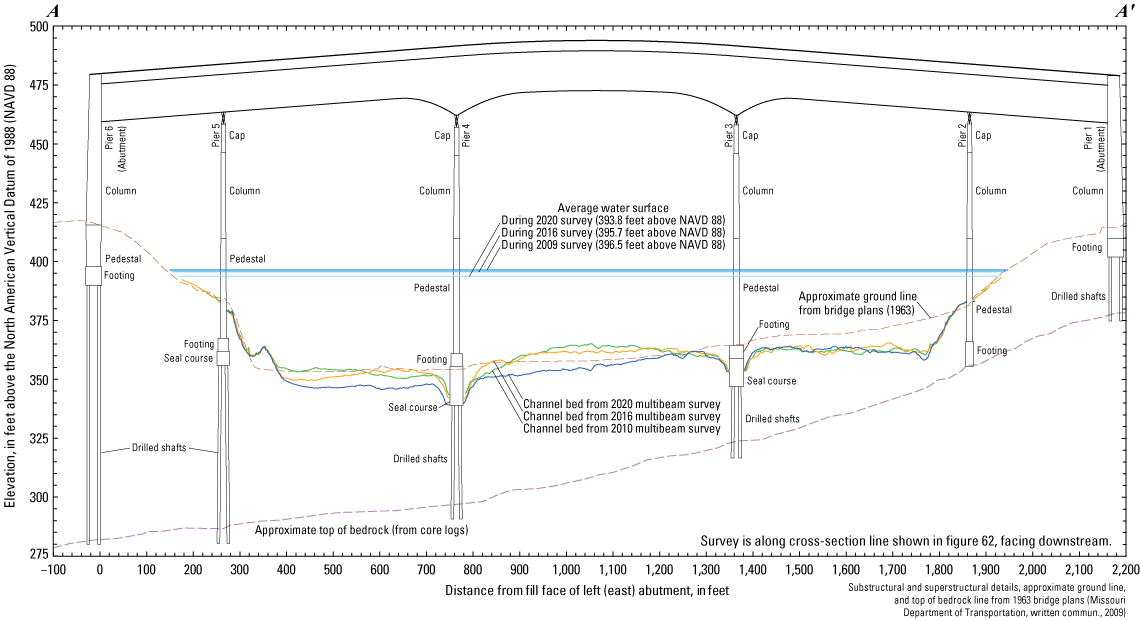
Key features, substructural and superstructural details, and surveyed channel bed of structure A1500 on Interstate 55 crossing the Mississippi River in St. Louis, Missouri.
A moderate scour hole was present near the left main channel pier 4 (figs. 62, 1.9B, 1.9C) with a minimum elevation of about 338 ft, about 12 ft below the average channel bed upstream from the scour hole (fig. 62; table 9), and about 1 ft below the bottom of the seal course elevation (fig. 64; table 9). Information from bridge plans indicates that pier 4 is founded on shafts drilled 7 ft into bedrock, and about 41 ft of bed material was present between the bottom of the scour hole and bedrock (fig. 64; table 9). Similarly, a moderate scour hole was present near the right main channel pier 3 (figs. 62, 1.9D, 1.9E) with a minimum elevation of about 352 ft, about 10 ft below the average channel bed upstream from the scour hole (fig. 62; table 9) and about 5 ft above the bottom of the seal course elevation (fig. 64; table 9). Information from bridge plans indicates that pier 3 also is founded on shafts drilled 7 ft into bedrock, and about 28 ft of bed material were present between the bottom of the scour hole and bedrock (fig. 64; table 9).
Like with the left bank pier, a scour hole was not observable at the right bank pier 2 (figs. 62, 1.9F). The right bank is covered with granite paving stone revetment under the bridge and upstream that extends to the toe of the bank and will limit or prevent scour at this pier. The minimum elevation at the toe of the right bank near pier 2 was about 358 ft (fig. 62), which is about 2 ft above the bottom of the footing elevation of 355.63 ft (fig. 64); however, the toe of the bank is nearly 90 ft to the left from the pier (figs. 62, 64). Information from bridge plans indicates that pier 2 is founded on footings on bedrock, and about 27 ft of bed material were present between the bed and bedrock at the upstream pier face (fig. 64; difference between “Approximate elevation of scour hole at upstream pier/bent face” and “Approximate elevation of bedrock near pier/bent” in table 9).
The difference between the survey on August 7, 2020, and the previous survey on May 25, 2016 (fig. 65), indicates about 86 percent of the joint area of interest had detectable change, which means about 14 percent of the differences in the joint area of interest are equivocal and within the bounds of uncertainty (table 8). Scour seems dominant throughout most of the reach between 2016 and 2020 in the DoD, except in localized troughs near the thalweg and along the right (west) side of the channel (fig. 65). The average difference between the bathymetric surfaces was –2.35 ft (table 8), indicating moderate to substantial channel degradation between the 2016 and 2020 surveys. The scour holes near piers 3 and 4 were slightly wider in 2020 than in 2016. The net volume of cut in the reach from 2016 to 2020 was about 213,000 yd3, and the net volume of fill was about 18,100 yd3, resulting in a net loss of about 194,900 yd3 of sediment between 2016 and 2020 (table 8). The cross section from the 2020 and 2016 surveys along the upstream face of the bridge are generally similar in shape; however, the 2020 survey section is about 5–10 ft below the 2016 survey section, except near the right (west) bank where they are almost equal (fig. 64). The frequency distribution of bed elevations in 2020 is also similar in shape to 2016, but with a 3–5 ft shift towards lower elevations (fig. 63). The stone revetment along the banks showed localized signs of minor scour and deposition (fig. 65); however, the apparent scour or deposition may be the result of minor horizontal positional variances between the surveys, and deposition or scour apparent on opposing faces of the piers are as well (see “Uncertainty Estimation” section).
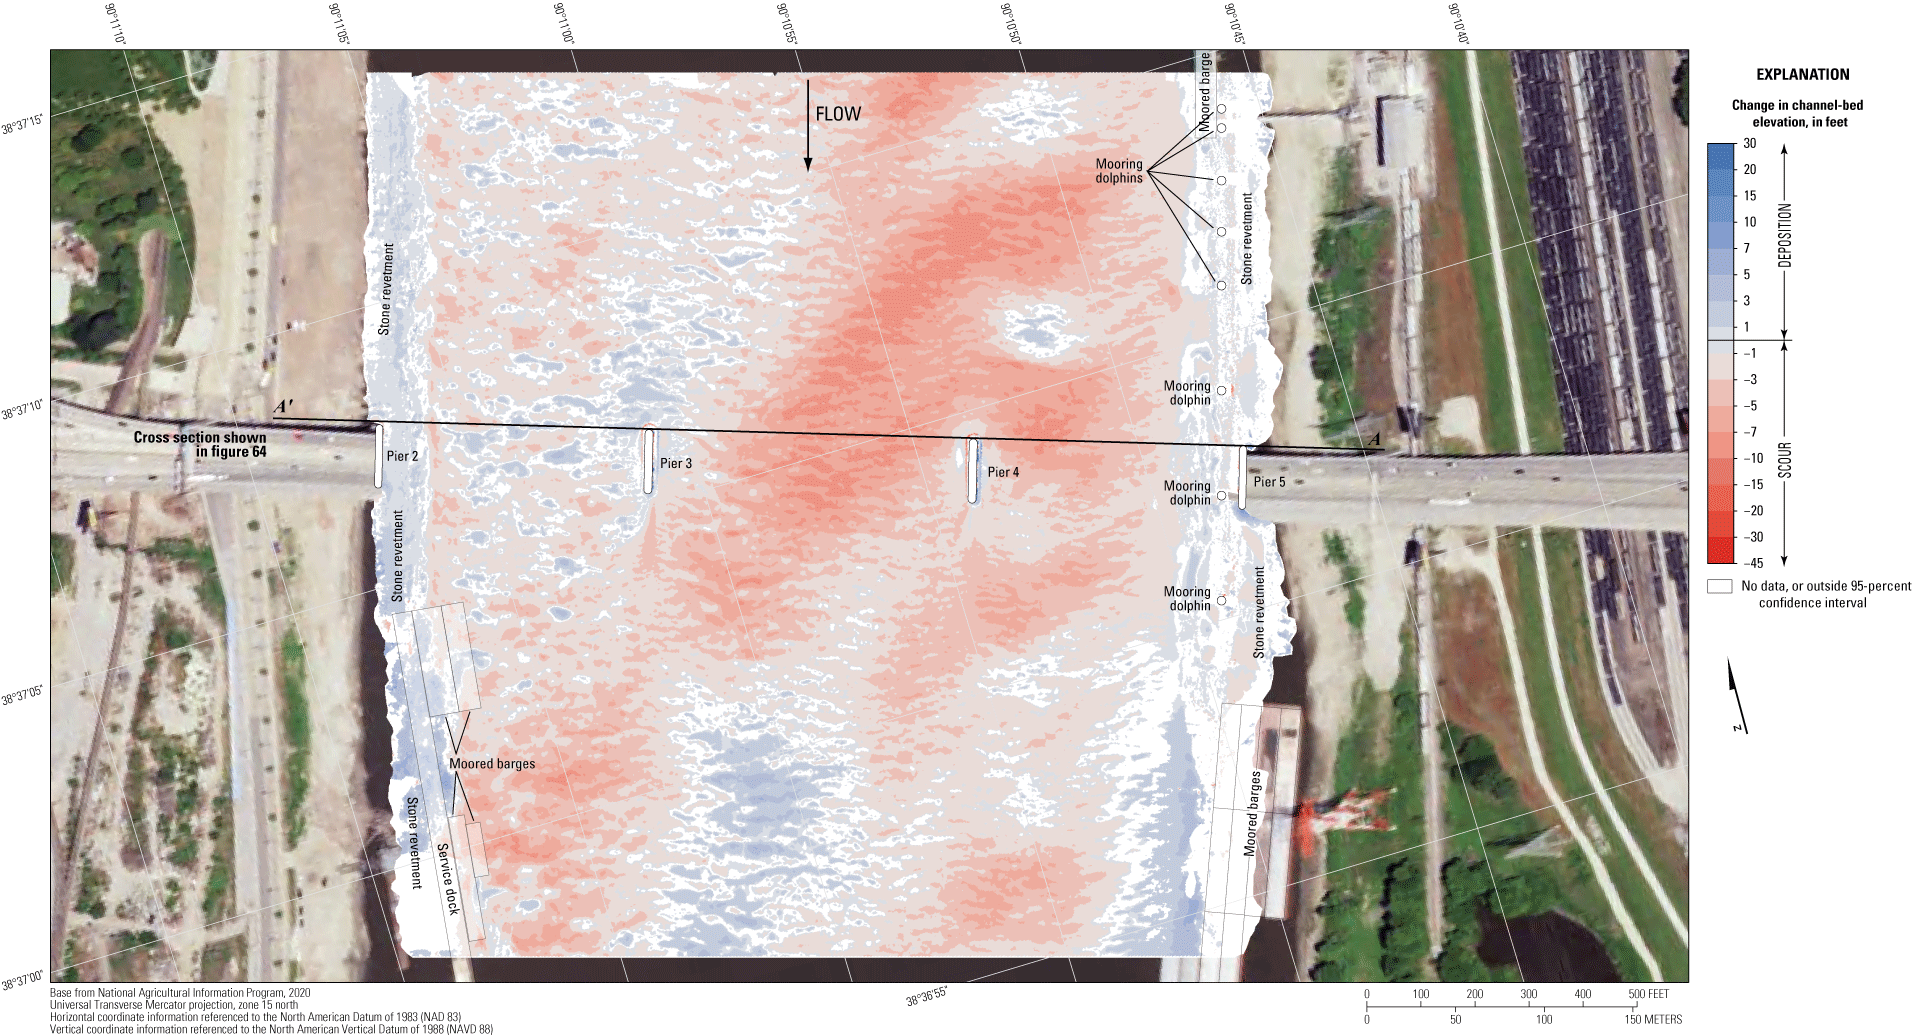
Difference between surfaces created from bathymetric surveys of the Missouri River channel near structure A1500 on Interstate 55 in St. Louis, Missouri, on August 7, 2020, and May 25, 2016, with probabilistic thresholding.
The difference between the survey on August 7, 2020, and the earliest survey on October 20, 2010 (fig. 66), indicates about 85 percent of the joint area of interest had detectable change, which means about 15 percent of the differences in the joint area of interest are equivocal and within the bounds of uncertainty (table 8). Scour again seems dominant throughout most of the reach between 2010 and 2020 in the DoD but with a large area of localized deposition in the middle of the survey reach (fig. 66). The average difference between the bathymetric surfaces was –2.91 ft (table 8), indicating moderate to substantial channel degradation between the 2010 and 2020 surveys, and the net loss of sediment between 2010 and 2020 was about 231,400 yd3 (table 8). The cross section from the 2020 survey along the upstream face of the bridge is generally below the 2010 survey section, except near the right (west) bank where they are almost equal (fig. 64). The frequency distribution of bed elevations in 2020 is remarkably similar to 2010 except for a higher percentage of cells between 345 and 350 ft elevation and a lower percentage of cells between 365 and 370 ft elevation (fig. 63). Minor apparent scour and deposition of the stone revetment along the banks (fig. 66) is likely the result of minor horizontal positional variances between the surveys, and deposition or scour apparent on opposing faces of the piers are as well (see “Uncertainty Estimation” section).
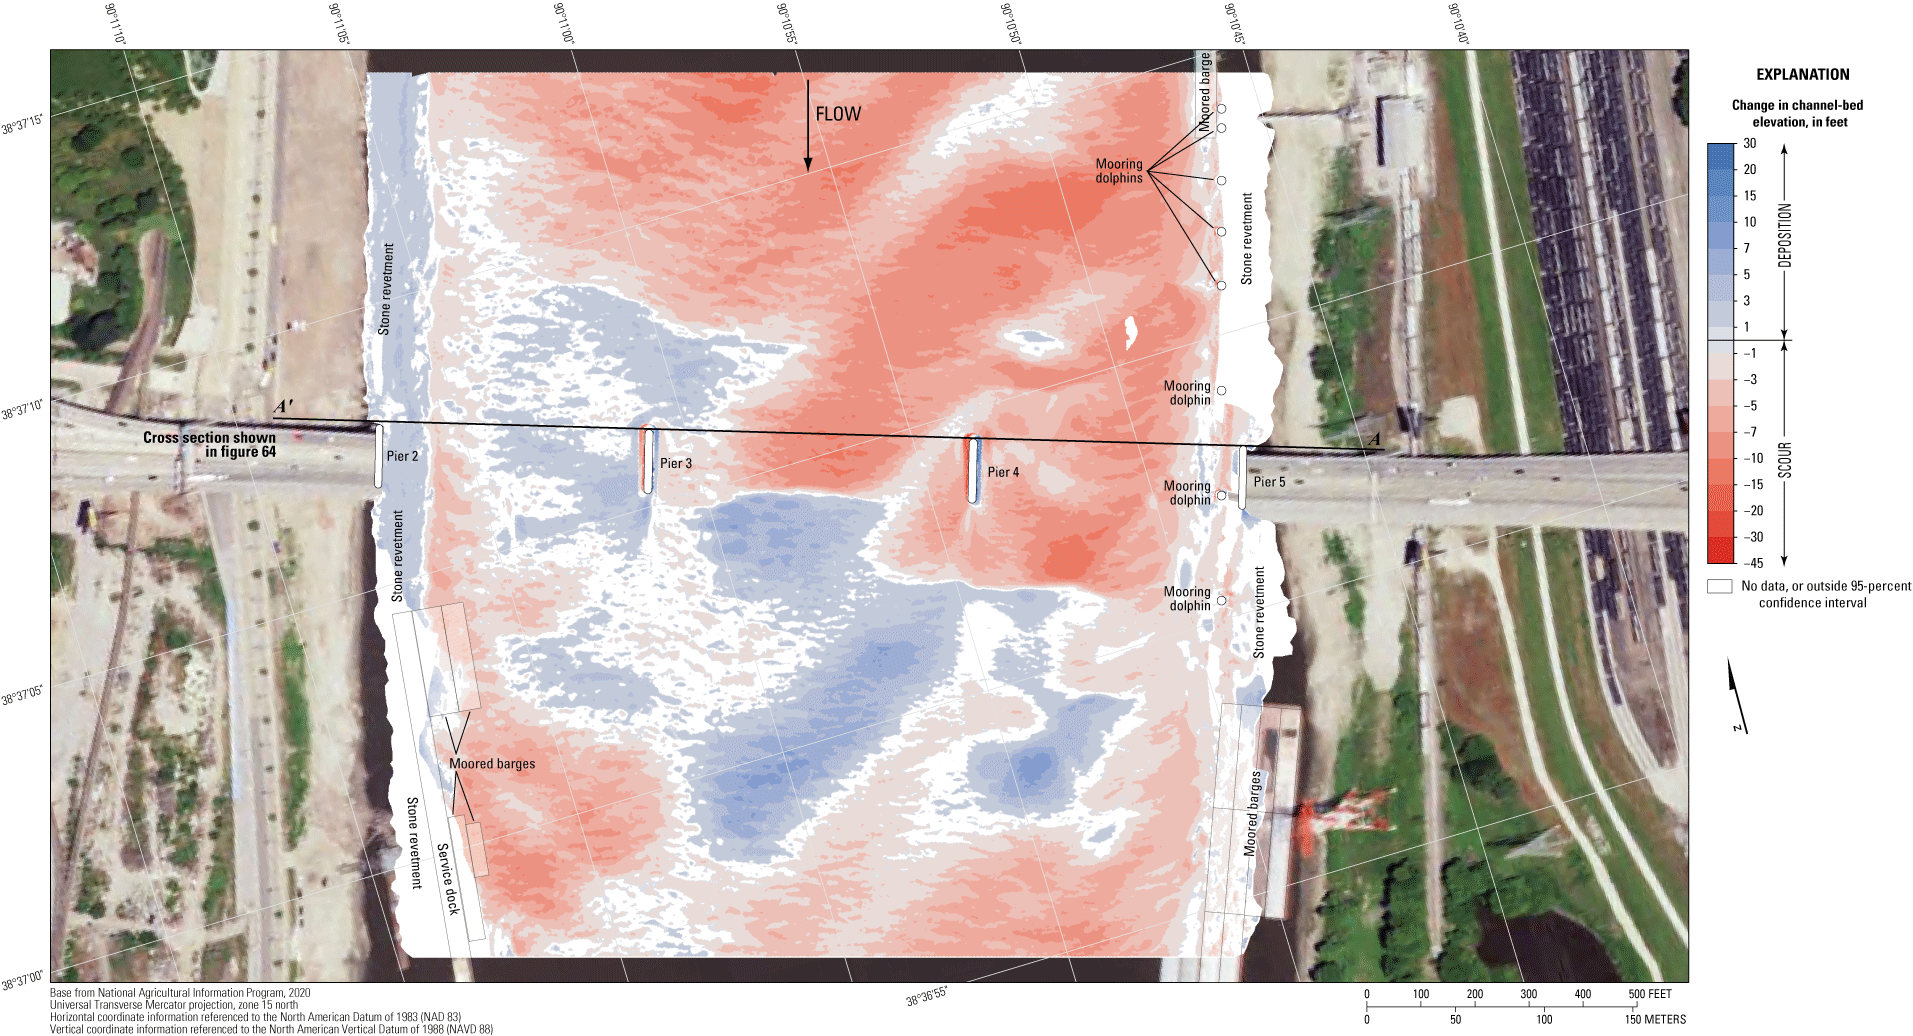
Difference between surfaces created from bathymetric surveys of the Missouri River channel near structure A1500 on Interstate 55 in St. Louis, Missouri, on August 7, 2020, and October 20, 2010, with probabilistic thresholding.
The vertically averaged velocity vectors, which range from about 2 to 7 ft/s, indicate directionally uniform flow throughout the channel (fig. 67). However, flow velocities seemed unusually variable in all the transects, which may result from the medium dune features present on the left (east) side that might cause upwelling (Best, 2005), and other features such as bank protuberances, neighboring bridge piers, and mooring dolphins that might contribute to non-uniform flow at this site (fig. 67). Velocities are generally higher near the left bank where flow is deeper compared to the right bank where flow is shallower.
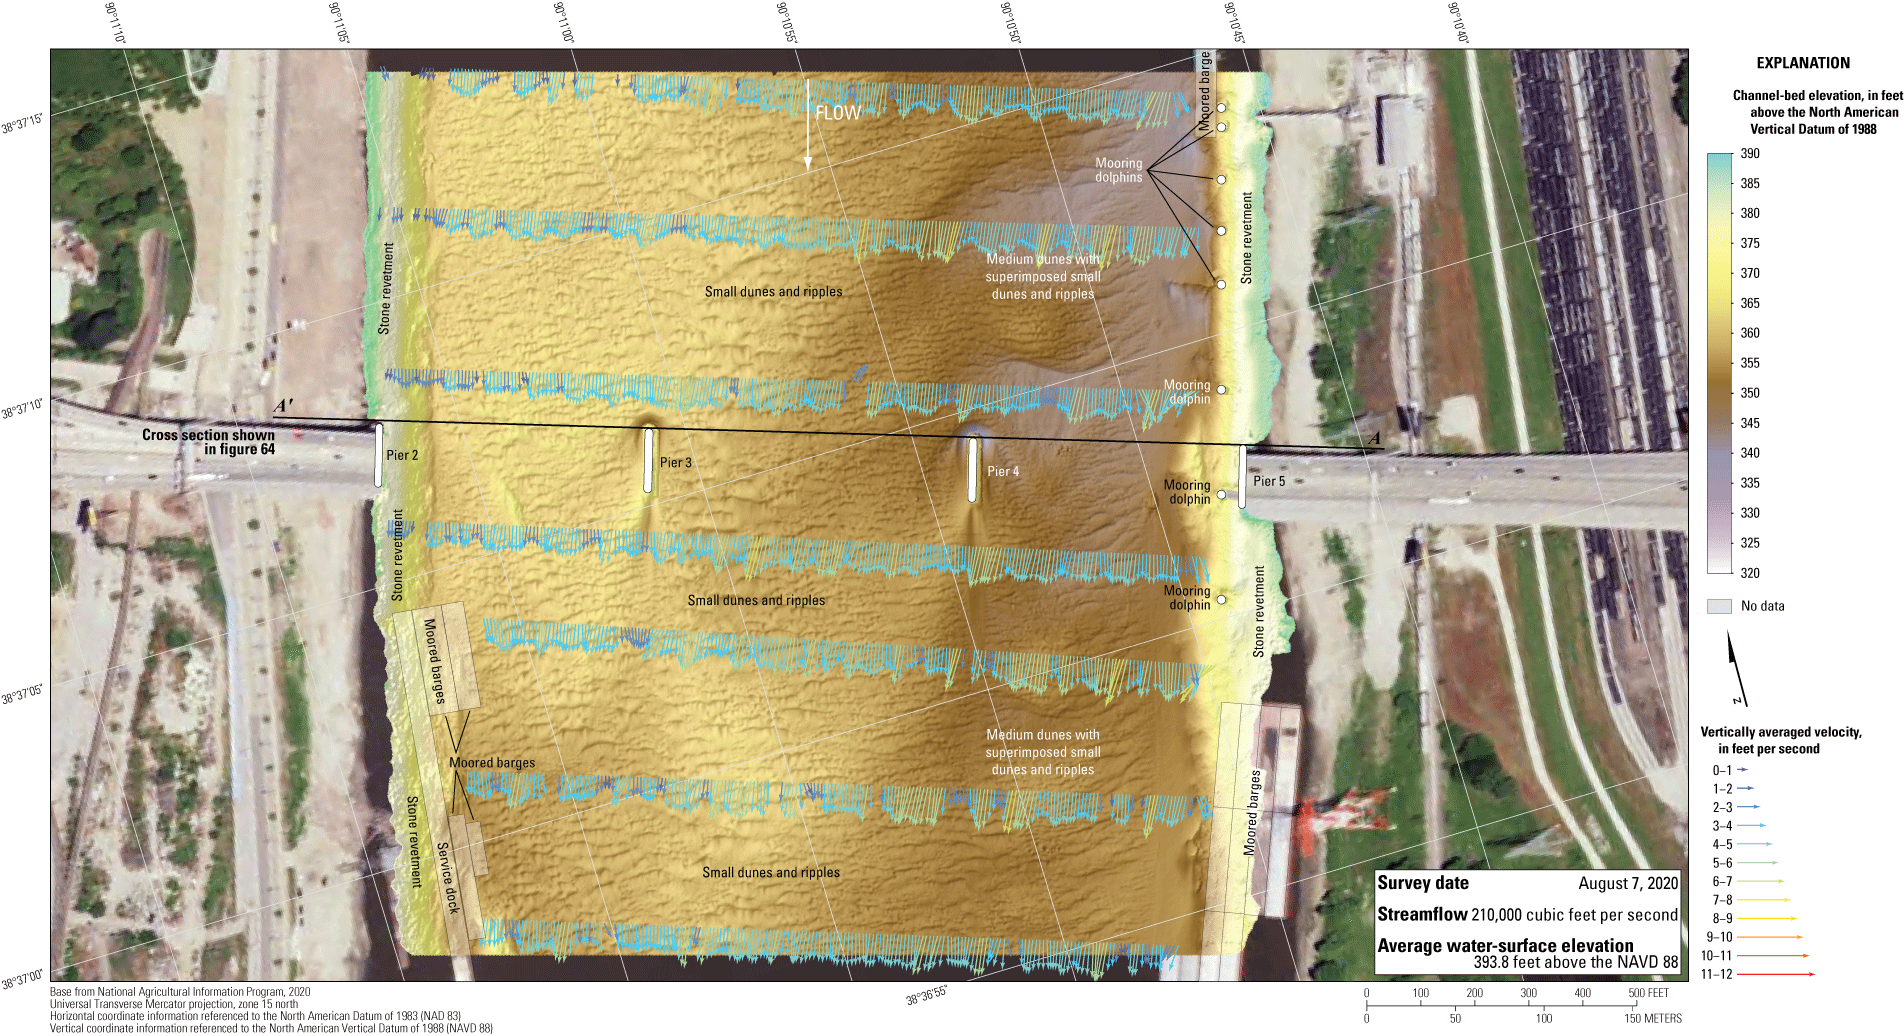
Bathymetry and vertically averaged velocities of the Mississippi River channel near structure A1500 on Interstate 55 in St. Louis, Missouri.
Structures A4936 and A1850 on Interstate 255
Structures A4936 and A1850 (site 35; table 2) are dual bridges on Interstate 255, crossing the Mississippi River at RM 168.8, on the southeastern side of the St. Louis metropolitan area (fig. 1). The site was surveyed on August 10, 2020, when the average water-surface elevation of the river in the survey area, determined by the RTK GNSS tide solution, was 390.6 ft (table 6; fig. 68) and streamflow on the Mississippi River was about 242,000 ft3/s during the survey (table 6).
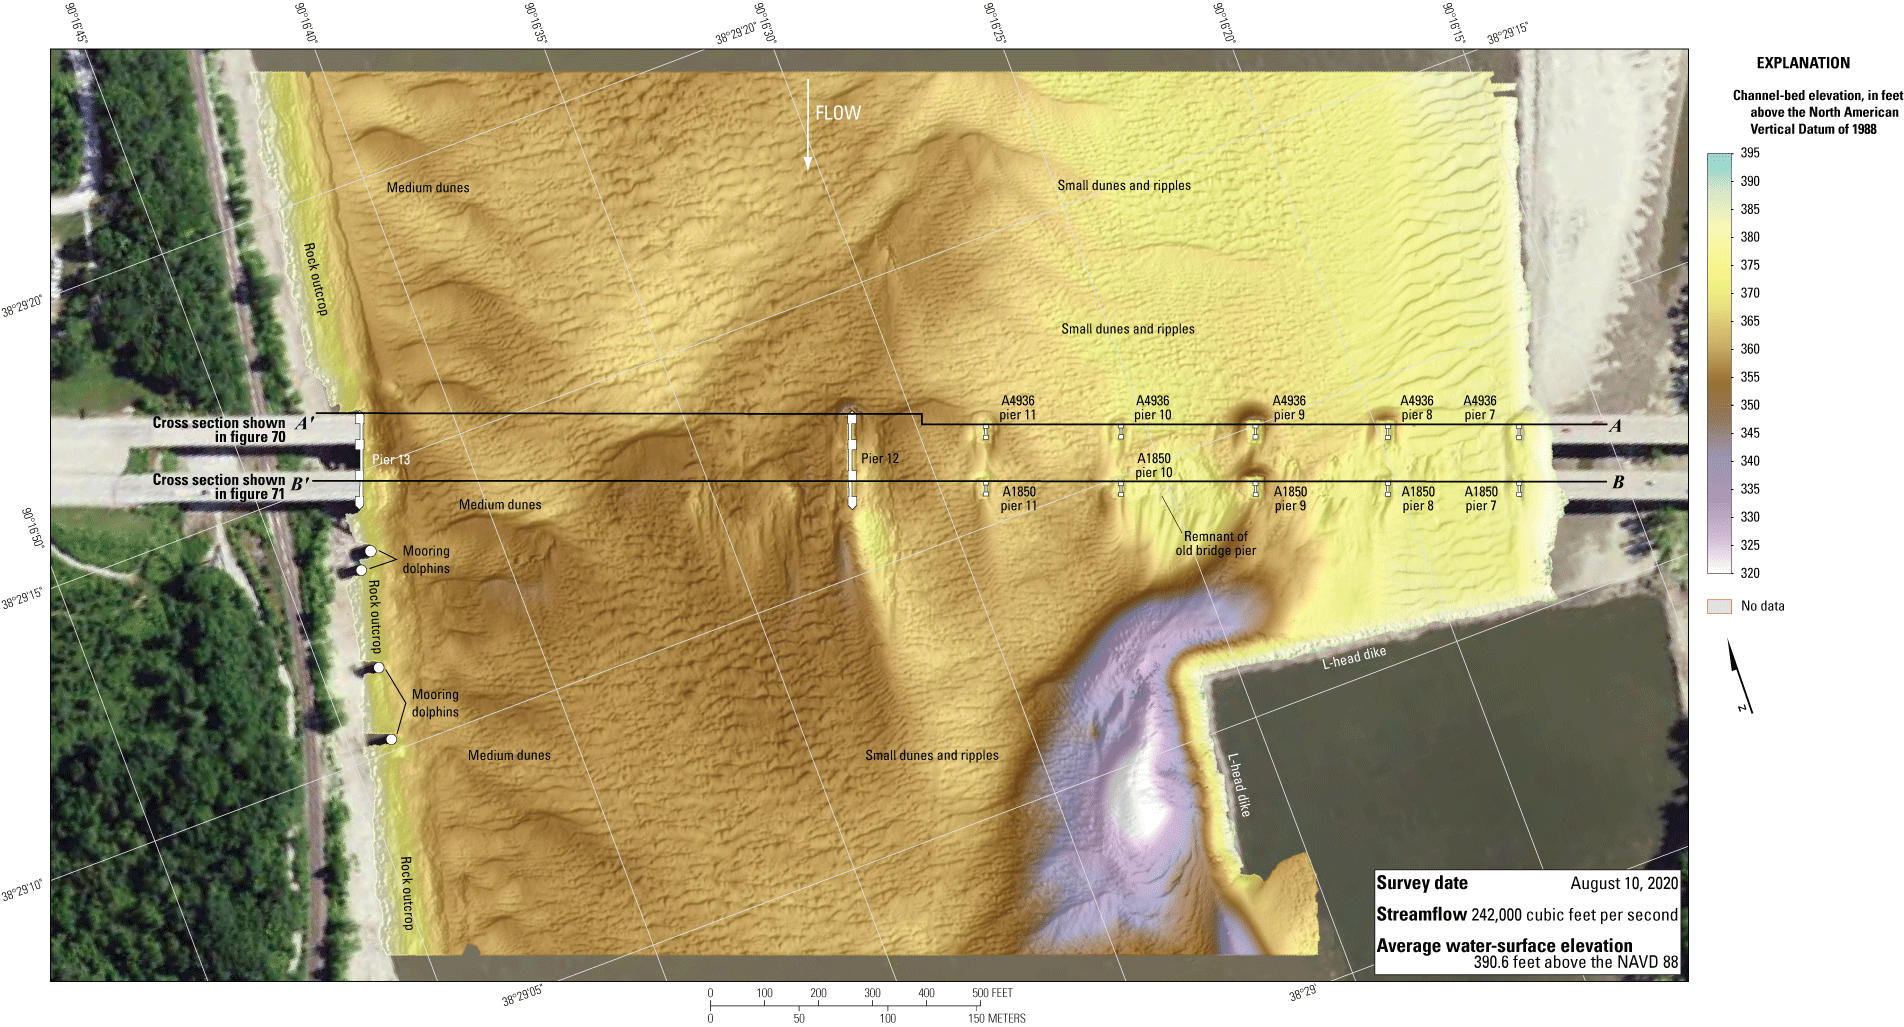
Bathymetric survey of the Mississippi River channel near structures A4936 and A1850 on Interstate 255 near St. Louis, Missouri.
The survey area was about 1,640 ft long and varied in width from about 2,300 ft wide upstream from the L-head dike to about 1,700 ft wide at the downstream end (fig. 68). The survey area extended from bank to bank in the reach upstream from the L-head dike, and from the L-head dike to the right bank in the downstream part of the reach (fig. 68). The survey area extended about 720 ft upstream from the centerline of structures A4936 and A1850 (fig. 68). The channel-bed elevations ranged from about 347 to 375 ft for most of the surveyed area (5th to 95th percentile range of the bathymetric data; fig. 69; table 6), except near the L-head dike (fig. 68). A shallow thalweg was present along the right (west) bank throughout the reach and was about 3 to 7 ft deeper than the channel bed in the middle of the channel (fig. 68). The channel and thalweg deepened downstream from the bridges (fig. 68), likely because of the contraction of the channel caused by the L-head dike on the left bank. On the upstream left (northeast) side, the channel bed reached an elevation of about 375 ft (fig. 68). A line of medium dune features was detected along the toe of the right (west) bank, and numerous smaller dunes and ripples were present throughout the survey reach (fig. 68). A localized deep scour hole at the stream side of the L-head dike on the left bank had an approximate minimum channel-bed elevation of about 315 ft (fig. 68; table 6). Like in previous surveys (Huizinga, 2011, 2017a), a rock outcrop was present on the right (west) bank throughout the reach (fig. 68).
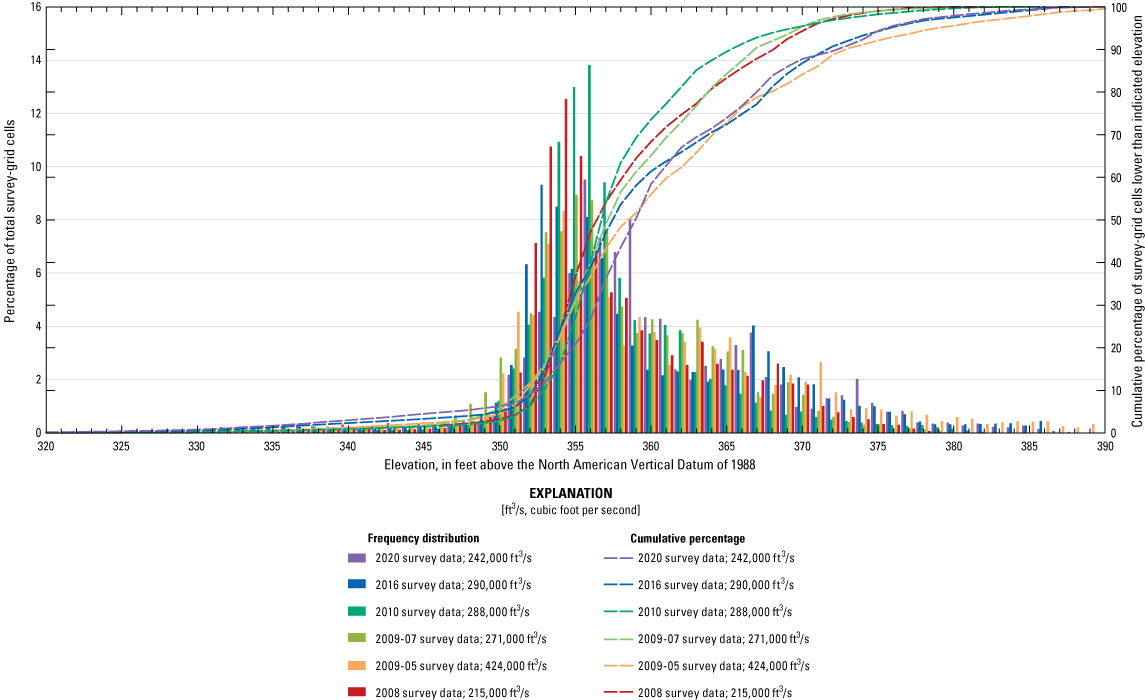
Frequency distribution of bed elevations for bathymetric survey-grid cells in 1-foot elevation bins on the Mississippi River near structures A4936 and A1850 on Interstate 255 near St. Louis, Missouri, on August 10, 2020, compared to previous surveys in 2008, 2009, 2010 and 2016 (Huizinga and others, 2010; Huizinga, 2011, 2017a, respectively).
Minor to moderate scour holes were present near pier 7 of both bridges (figs. 68, 1.10A, 1.10B). Near structure A4936, the scour hole had a minimum elevation of about 372 ft, which is similar to the elevation in the 2016 survey of 373 ft (fig. 70); however, this elevation is only about 4 ft below the average channel bed immediately upstream from the pier and 11 ft above the bottom of the seal course elevation of 361.00 ft (fig. 70; table 9). The scour hole extended downstream around pier 7 of structure A1850 (fig. 68) and had an approximate minimum channel-bed elevation of 372 ft near the pier (fig. 71; table 9). The scour holes did not extend below the bottom of the pedestals at either pier (figs. 70, 71). Information from bridge plans indicate that pier 7 of structures A4936 and A1850 are founded on piles driven to refusal on bedrock at both structures and about 78 ft of bed material was present between the bottom of the scour holes and bedrock (figs. 70, 71; table 9).
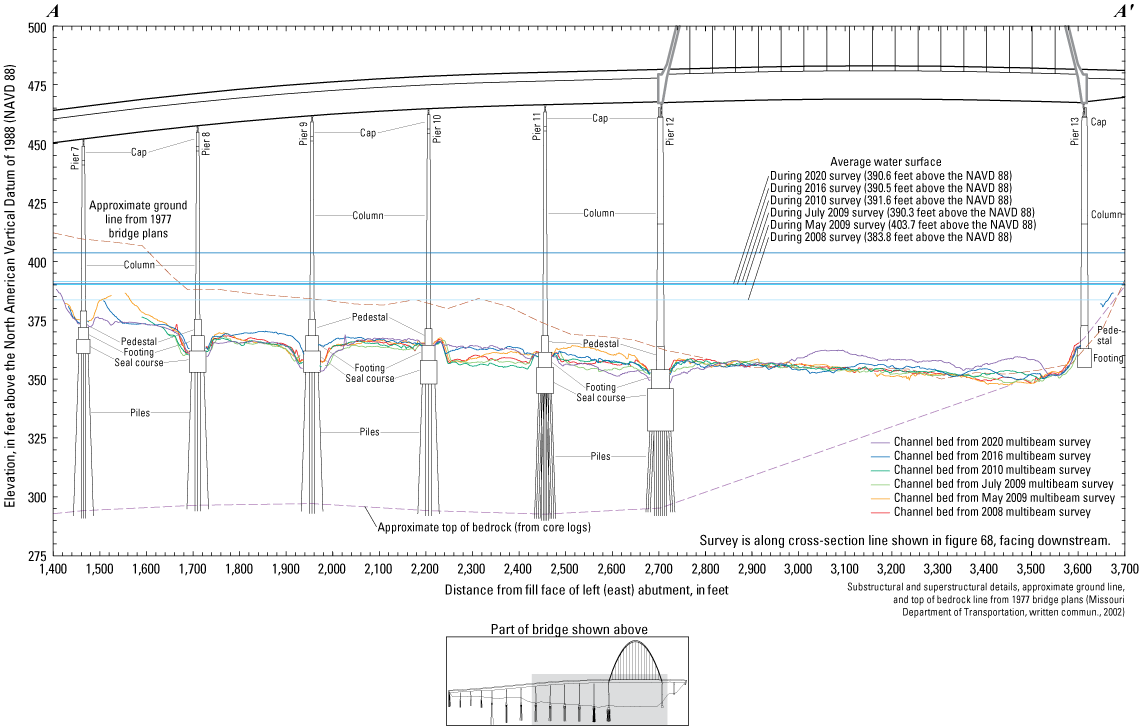
Key features, substructural and superstructural details, and surveyed channel bed of structure A4936 on Interstate 255 crossing the Mississippi River near St. Louis, Missouri.
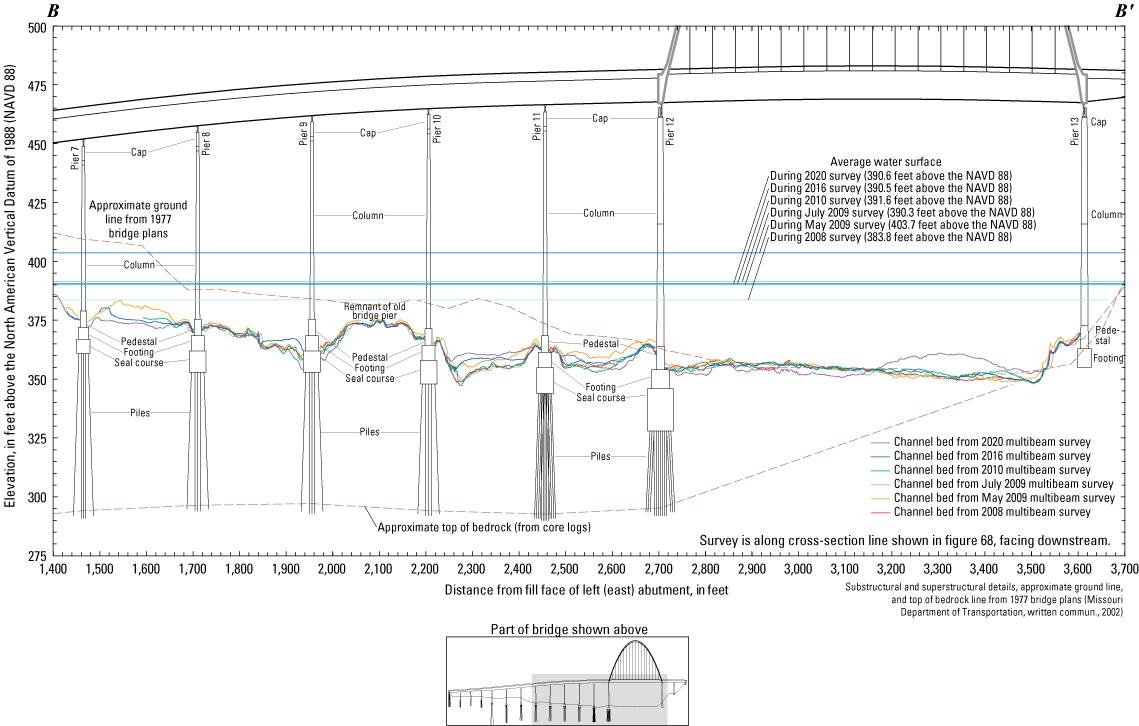
Key features, substructural and superstructural details, and surveyed channel bed of structure A1850 on Interstate 255 crossing the Mississippi River near St. Louis, Missouri.
Moderate to substantial scour holes were present near piers 8 and 9 of both bridges (figs. 68, 1.10C–1.10F). Near pier 8 of structure A4936, the scour hole had an approximate minimum channel-bed elevation of about 356 ft, about 13 ft below the average channel bed upstream from the scour hole and 3 ft above the bottom of the seal course elevation of 353.00 ft (figs. 68, 70; table 9). At structure A1850, the scour hole near pier 8 had an approximate minimum channel-bed elevation of 369 ft, about 5 ft below the average channel bed immediately upstream (fig. 68); however, the scour hole at the upstream pier extended downstream, partly affecting the scour near the downstream pier 8 (figs. 68, 1.10C, 1.10D). Nonetheless, the scour hole at the downstream pier did not seem to extend below the bottom of the pedestal (figs. 71, 1.10C, 1.10D), and about 16 ft of channel-bed material was present above the bottom of the seal course elevation (table 9). Information from bridge plans indicates that pier 8 at structures A4936 and A1850 are founded on piles driven to refusal on bedrock and about 59 to 72 ft of bed material was present between the bottom of the scour holes and bedrock (figs. 70, 71; table 9).
Near pier 9 of structure A4936, the scour hole had an approximate minimum channel-bed elevation of about 349 ft, about 16 ft below the average channel bed immediately upstream from the pier, and about 4 ft below the bottom of the seal course elevation of 353.00 ft (figs. 68, 70, 1.10E, 1.10F; table 9). At structure A1850, the scour hole near pier 9 had a minimum channel-bed elevation of 351 ft, about 13 ft below the average channel bed upstream from the scour hole, and about 2 ft below the bottom of the seal course elevation of 353.00 ft (figs. 68, 70, 71, 1.10E, 1.10F; table 9). Information from bridge plans indicates that pier 9 of structures A4936 and A1850 are founded on piles driven to refusal on bedrock at both structures, and about 52–54 ft of bed material was present between the bottom of the scour holes and bedrock (figs. 70, 71; table 9).
Like in previous surveys (Huizinga, 2011, 2017a), scour holes were not observed upstream from piers 10 and 11 of either structure A4936 or A1850 (fig. 68), because there are indications that riprap or some other scour-resistant material has been piled near the upstream faces of these piers (figs. 70, 71, 1.11A–1.11D). However, the side edges and downstream corners of the footings are apparent at pier 11 of both structures (figs. 1.11C, 1.11D), and a local scour hole with an approximate minimum channel-bed elevation of 357 ft was present near the downstream left corner of pier 11 of structure A1850 (figs. 68, 71; table 9). Like in all previous surveys (Huizinga, 2011, 2017a), the remnant of an old bridge pier was observed between piers 9 and 10 of structure A1850 (figs. 68, 71). Information from bridge plans indicates that piers 10 and 11 are founded on piles driven to refusal on bedrock at both structures and about 62–70 ft of bed material was present between the approximate minimum channel-bed elevation near each pier and bedrock (figs. 70, 71; table 9).
A moderate scour hole was present upstream from pier 12 with a minimum elevation of about 346 ft, about 10 ft below the average channel bed upstream from the scour hole at the upstream end of the pier, but 18 ft above the bottom of the seal course elevation of 328.00 ft (figs. 68, 70, 1.11E, 1.11F; table 9). Information from bridge plans indicates that pier 12 is a continuous substructural element of both structures A4936 and A1850 and is founded on piles driven to refusal on bedrock; about 51 ft of bed material was present between the bottom of the scour hole and bedrock (figs. 70, 71; table 9).
The vertically averaged velocity vectors, which range from about 2 to 8 ft/s, seemed variable in direction and magnitude in all the transects (fig. 72). Flow was angled to the right (west) in the transects immediately upstream and next to the L-head dike because of the constricting effect of the dike (fig. 72). The moderate to substantial variability observed in all the transects may result from the medium dune features present in the channel, which might cause upwelling (Best, 2005). Substantial velocity gradients and flow reversal also were present in the area next to the L-head dike (fig. 72). The piers generally seem to be aligned with flow and do not create noticeable turbulence (fig. 72).
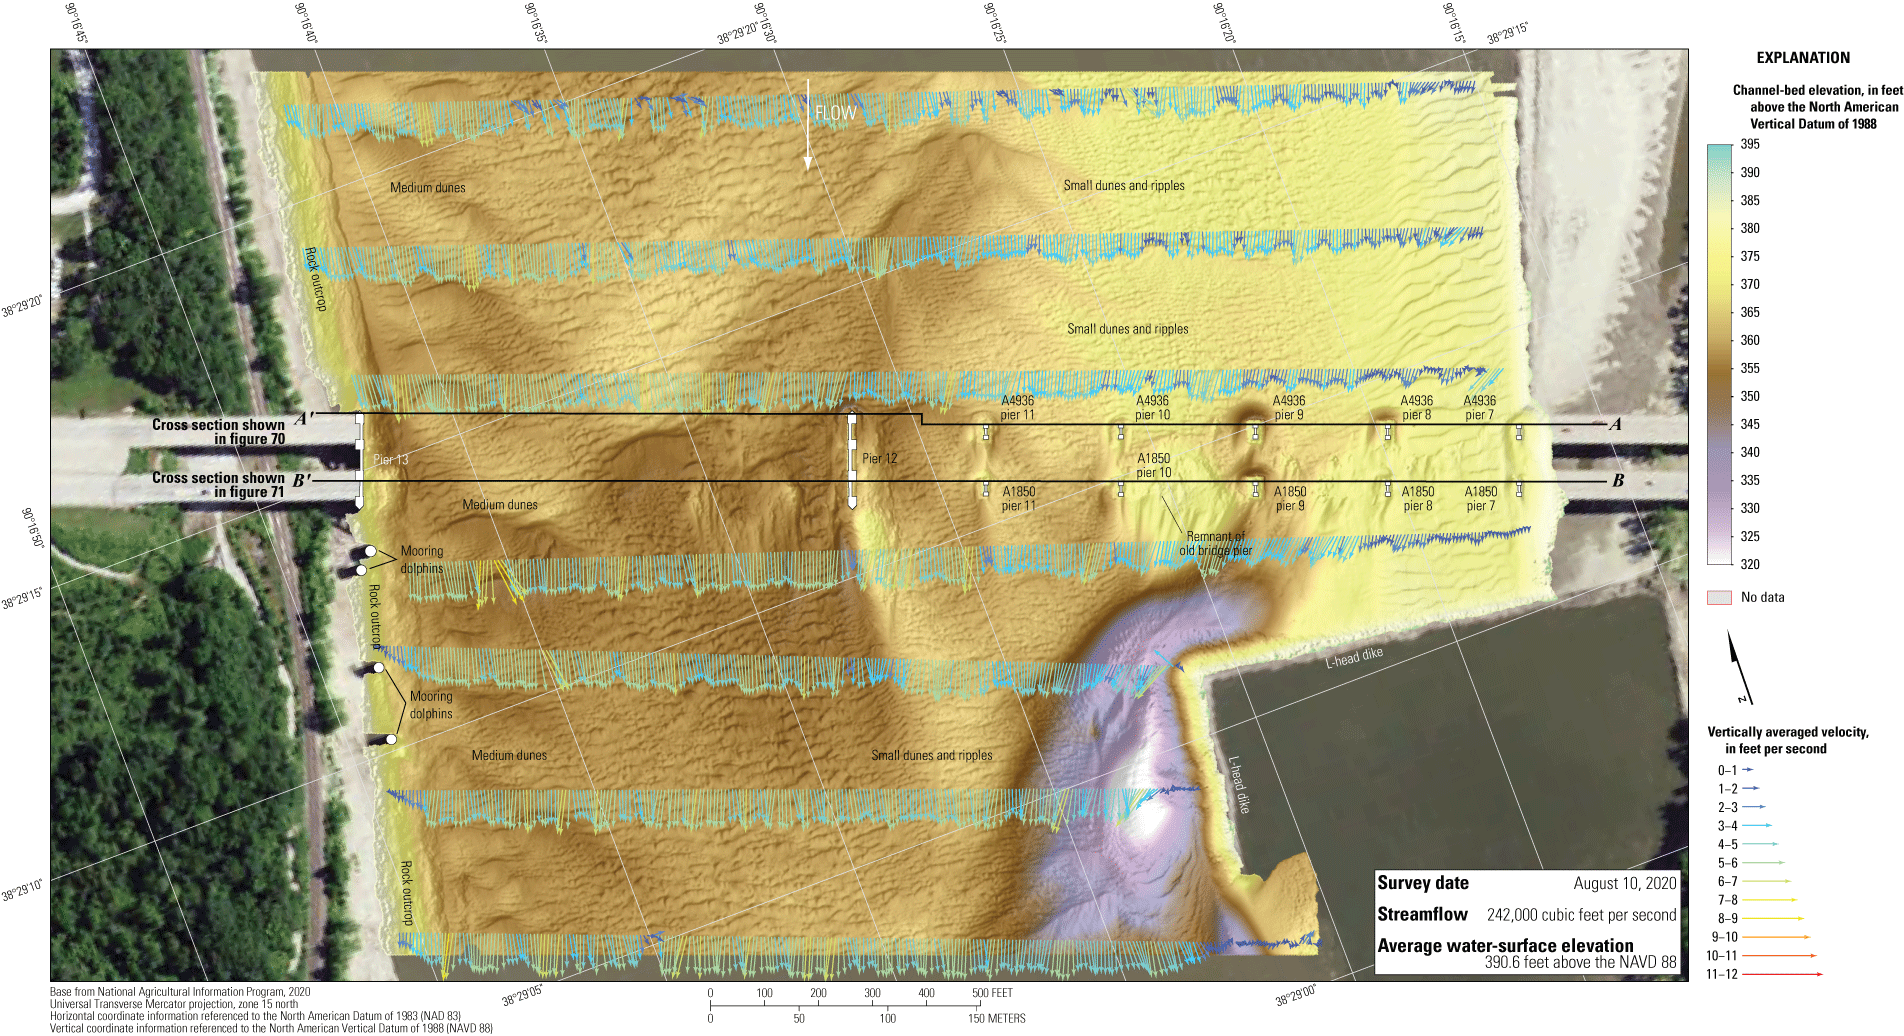
Bathymetry and vertically averaged velocities of the Mississippi River channel near structures A4936 and A1850 on Interstate 255 near St. Louis, Missouri.
The size of the scour holes near piers 8 and 9 perhaps are unexpected, given the lower flow velocities near the left (east) side of the channel. However, as noted in the report from the previous survey at this site (Huizinga, 2017a), velocities upstream from piers 8 and 9 were of sufficiently high magnitude to create a moderate to substantial scour hole in a sand-bed channel like the Mississippi River, dependent upon the cross-sectional size and shape of the pier (Arneson and others, 2012). Furthermore, the area to the left of pier 12 has demonstrated substantial variability through the course of the various surveys at this site (figs. 70, 71), despite the flow conditions being similar in each case (particularly the surveys in July 2009, 2010, 2016, and 2020; table 8). This variability indicates that the fluvial soils in this area deposit and erode readily in the absence of scour-resistant features like riprap or pier remnant detritus. The medium dunes present near the middle of the main channel also are apparent in the cross-sections of the upstream bridge (fig. 70).
The difference between the survey on August 10, 2020, and the previous survey on May 26, 2016 (fig. 73), indicates about 84 percent of the joint area of interest had detectable change, which means about 16 percent of the differences in the joint area of interest are equivocal and within the bounds of uncertainty (table 8). Scour and deposition seem approximately balanced and evenly dispersed throughout the reach between 2016 and 2020 in the DoD, except in localized troughs near the thalweg and along the left (east) side of the channel (fig. 73). The average difference between the bathymetric surfaces was +0.09 ft (table 8), indicating the balance of scour and deposition between the 2016 and 2020 surveys. The net volume of cut in the reach from 2016 to 2020 was about 148,800 yd3, and the net volume of fill was about 157,400 yd3, resulting in a net gain of only about 8,600 yd3 of sediment, further indicating the balance of scour and deposition between 2016 and 2020 (table 8). However, the cross section from the 2020 survey along the upstream face of the bridge varies 5–10 ft above and below the 2016 survey section (figs. 70, 71). The frequency distribution of bed elevations in 2020 is similar in shape to 2016, and the cumulative percentage alternates through the range of elevations (fig. 69). The rock outcrop along the right (west) bank and the surveyed faces of the L-head dike showed localized signs of minor scour and deposition (fig. 73); however, the apparent scour or deposition may be the result of minor horizontal positional variances between the surveys, and deposition or scour apparent on opposing faces of the piers are as well (see “Uncertainty Estimation” section). The upstream left (east) bank has a narrow band of substantial scour, indicating an abrupt rise to a bar along that bank (fig. 73). The scour hole near the L-head dike downstream from the bridge was substantially deeper near the bend than in 2016, and substantially more deposition is near the downstream tip (fig. 73).
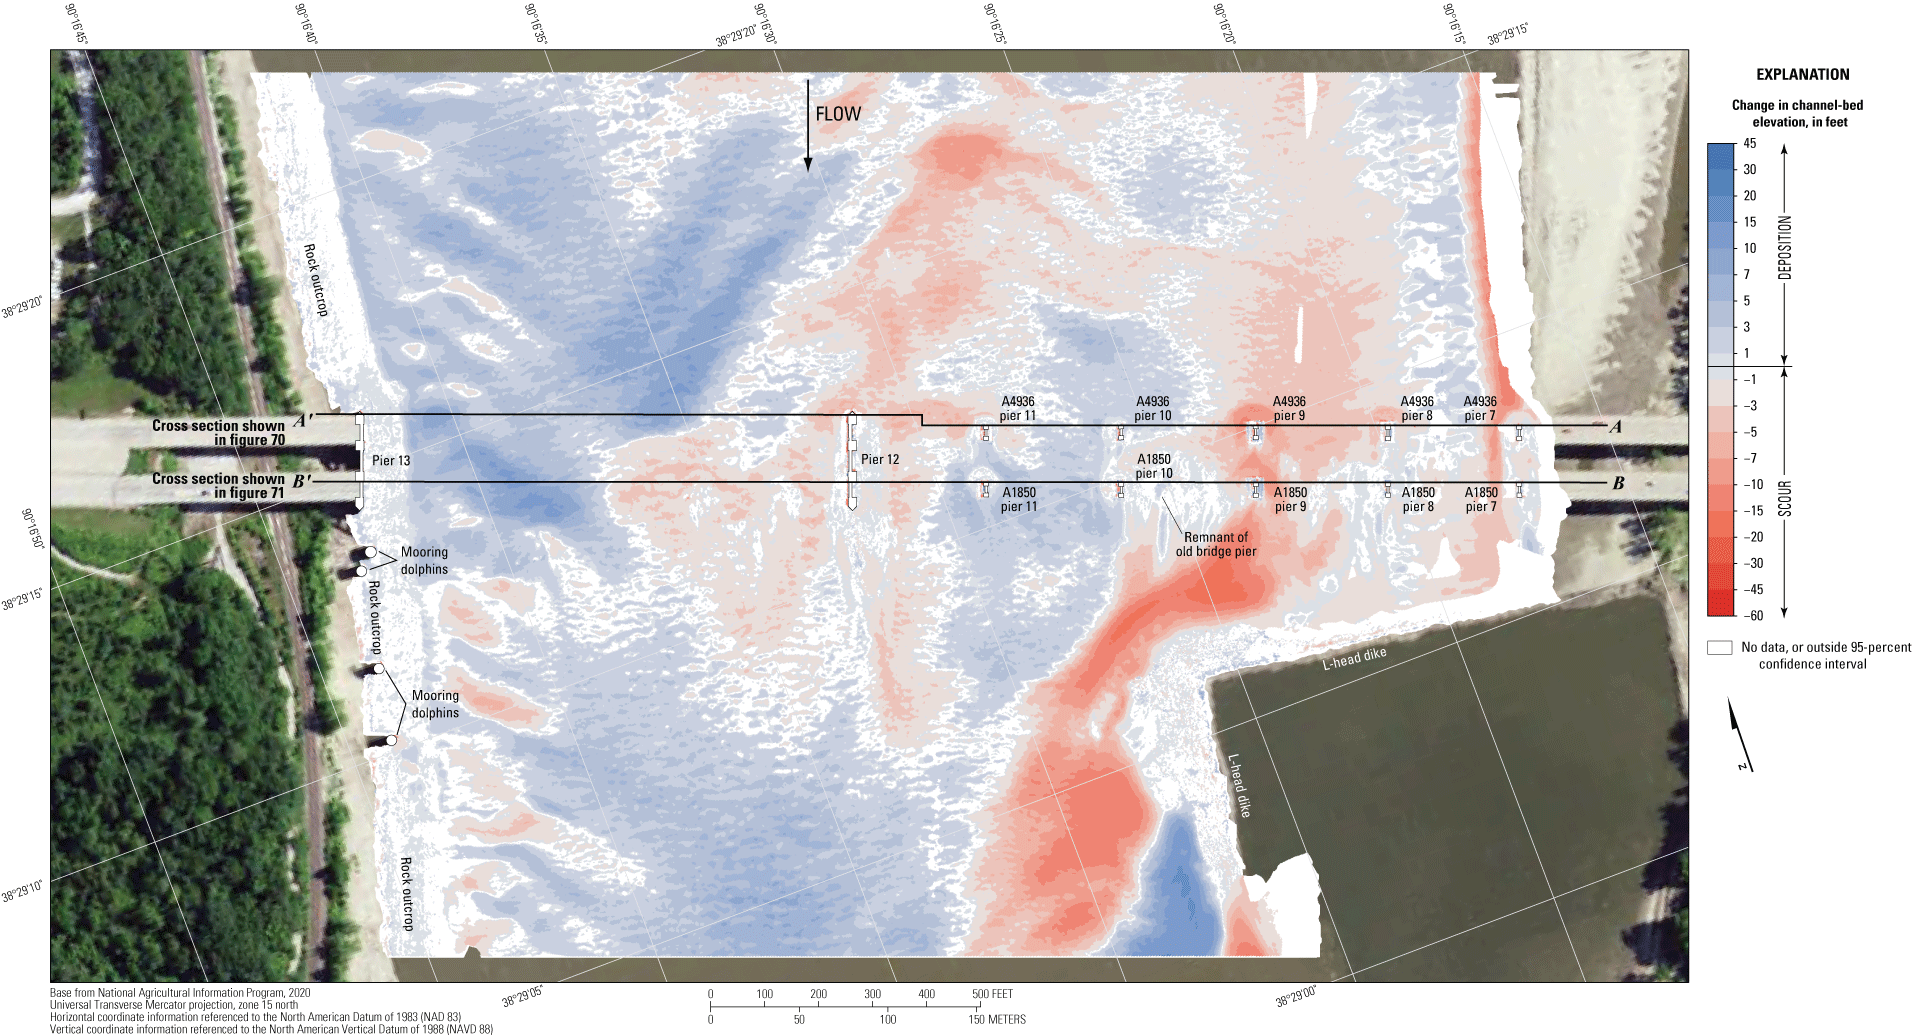
Difference between surfaces created from bathymetric surveys of the Missouri River channel near structures A4936 and A1850 on Interstate 255 near St. Louis, Missouri, on August 10, 2020, and May 26, 2016, with probabilistic thresholding.
The difference between the survey on August 10, 2020, and the survey on October 19, 2010 (fig. 74), indicates about 80 percent of the joint area of interest had detectable change, which means about 20 percent of the differences in the joint area of interest are equivocal and within the bounds of uncertainty (table 8). Deposition seems dominant throughout most of the reach between 2010 and 2020 in the DoD but with a large area of localized scour and deposition near the L-head dike in the middle of the channel (fig. 74). The average difference between the bathymetric surfaces was +1.14 ft (table 8), indicating moderate to substantial channel aggradation between the 2010 and 2020 surveys, and the net gain of sediment between 2010 and 2020 was about 102,000 yd3 (table 8). The frequency distribution of bed elevations in 2020 is similar to 2010 below about 352 ft (just like all the distributions), but the 2010 distribution has the highest percentage of cells between 352 and 365 ft elevation (fig. 69). Minor apparent scour and deposition of the rock outcrop along the right (west) bank and the surveyed faces of the L-head dike (fig. 74) likely is the result of minor horizontal positional variances between the surveys, and deposition or scour apparent on opposing faces of the piers are as well (see “Uncertainty Estimation” section).
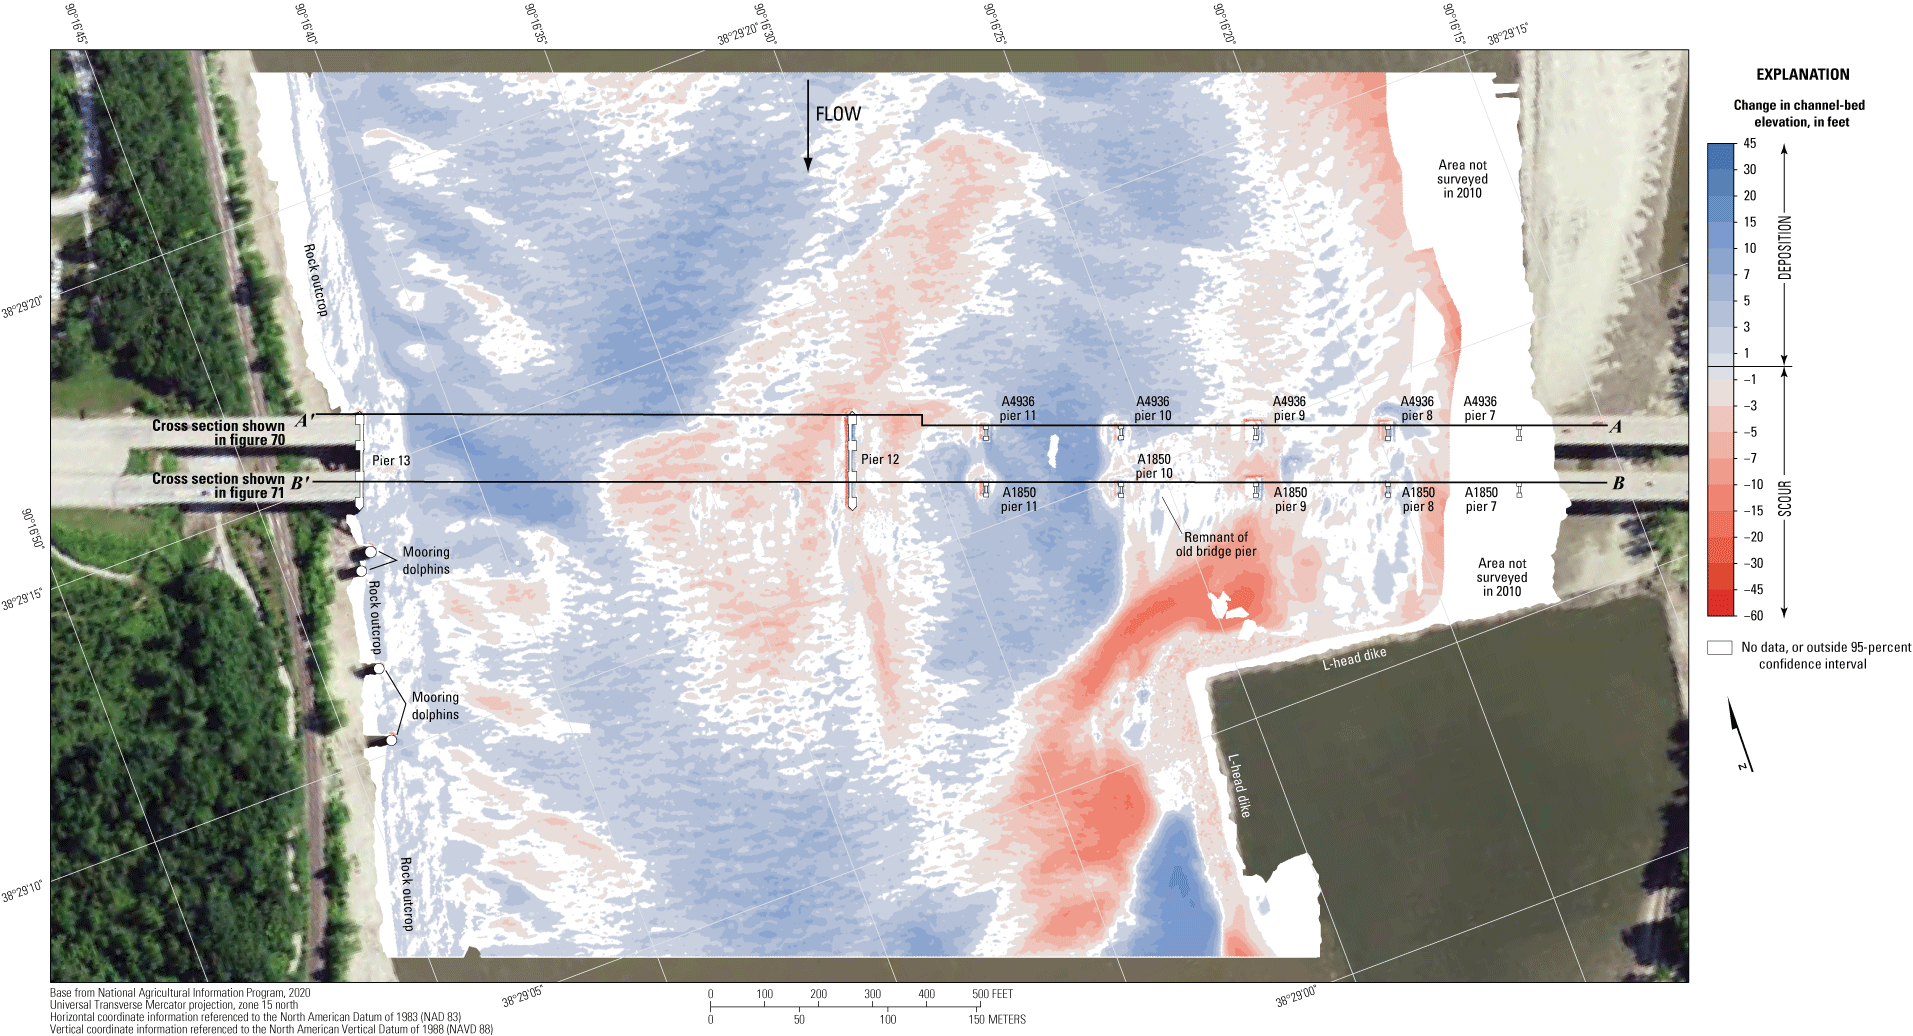
Difference between surfaces created from bathymetric surveys of the Missouri River channel near structures A4936 and A1850 on Interstate 255 near St. Louis, Missouri, on August 10, 2020, and October 19, 2010, with probabilistic thresholding.
The numerical differences between the 2020 survey and the survey in July 2009 are shown in table 8 but are not otherwise discussed herein due to the similarity to other surveys. However, the difference between the survey on August 10, 2020, and a moderate flood survey on May 12–13, 2009 (fig. 75), indicates about 83 percent of the joint area of interest had detectable change, which means about 17 percent of the differences in the joint area of interest are equivocal and within the bounds of uncertainty (table 8). Scour and deposition seem nearly balanced and evenly dispersed throughout the reach between May 2009 and 2020 in the DoD, except along the left (east) side of the channel and a large area of localized scour and deposition near the L-head dike in the middle of the channel (fig. 75). The average difference between the bathymetric surfaces was –0.14 ft (table 8), indicating the balance of scour and deposition between the May 2009 and 2020 surveys, and the net loss of sediment between May 2009 and 2020 was about 14,100 yd3 (table 8). The frequency distribution of bed elevations in 2020 is similar to the May 2009 distribution, as well as the 2016 distribution as noted above (fig. 69). Minor apparent scour and deposition of the rock outcrop along the right (west) bank and substantial scour apparent on the surveyed faces of the L-head dike (fig. 75) likely are the result of minor horizontal and vertical positional variances between the surveys, as is deposition or scour apparent on opposing faces of the piers, particularly for the pre-2010 surveys where POSPac MMS was not used to postprocess the position information (see “Description of Equipment and Basic Processing” and “Uncertainty Estimation” sections above).
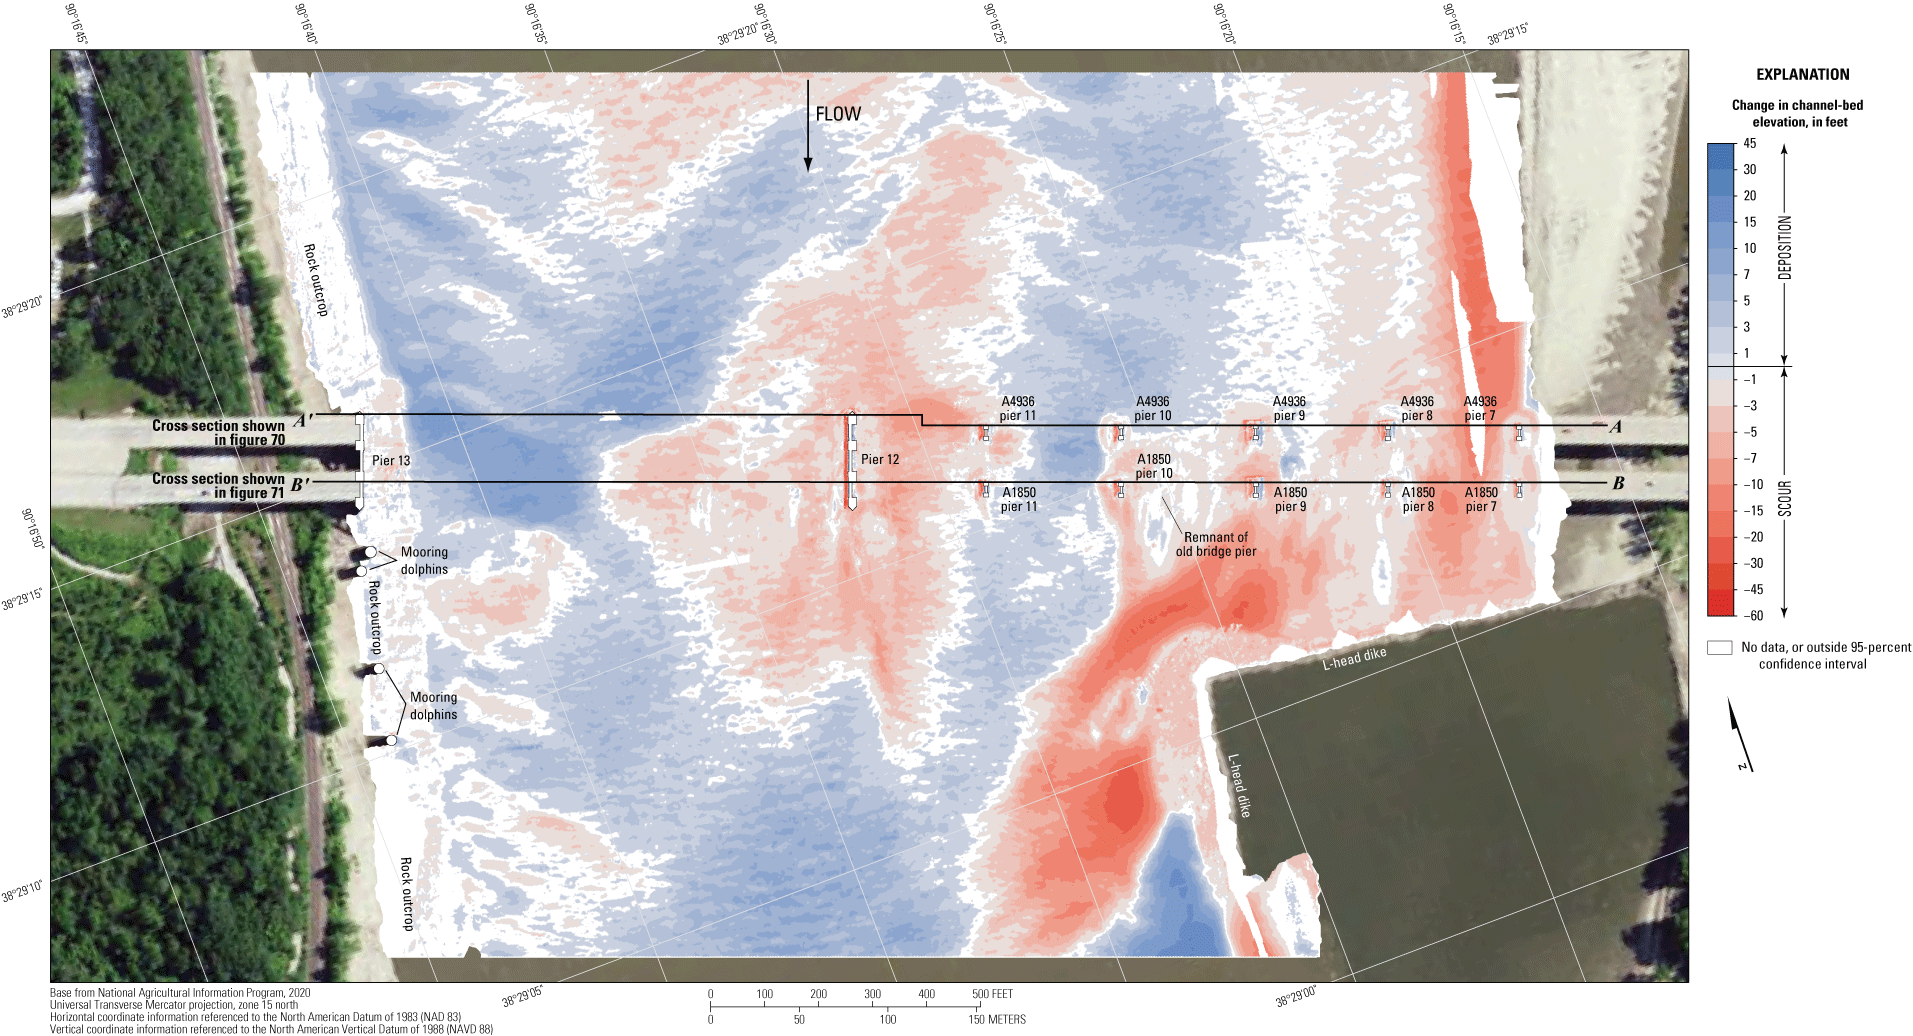
Difference between surfaces created from bathymetric surveys of the Missouri River channel near structures A4936 and A1850 on Interstate 255 near St. Louis, Missouri, on August 10, 2020, and May 12–13, 2009, with probabilistic thresholding.
The difference between the survey on August 10, 2020, and the earliest survey on October 2–3, 2008 (fig. 76), indicates about 82 percent of the joint area of interest had detectable change, which means about 18 percent of the differences in the joint area of interest are equivocal and within the bounds of uncertainty (table 8). Deposition seems dominant throughout most of the reach between 2008 and 2020 in the DoD because substantial deposition in the thalweg along the right (west) side of the channel is mostly balanced by a large area of localized scour near the L-head dike in the middle of the channel (fig. 76). The average difference between the bathymetric surfaces was +0.90 ft (table 8), indicating moderate channel aggradation between the 2008 and 2020 surveys, and the net gain of sediment was about 78,700 yd3 (table 8). The frequency distribution of bed elevations in 2008 is similar to the July 2009 and the 2010 distributions (fig. 69); the 2020 distribution has a lower percentage of cells at higher elevations. Like in previous discussions, moderate apparent scour and deposition of the rock outcrop along the right (west) bank and substantial scour apparent on the surveyed faces of the L-head dike (fig. 76) likely are the result of minor horizontal and vertical positional variances between the surveys, and deposition or scour apparent on opposing faces of the piers are as well, particularly for the pre-2010 surveys where POSPac MMS was not used to postprocess the position information (see “Description of Equipment and Basic Processing” and “Uncertainty Estimation” sections above).
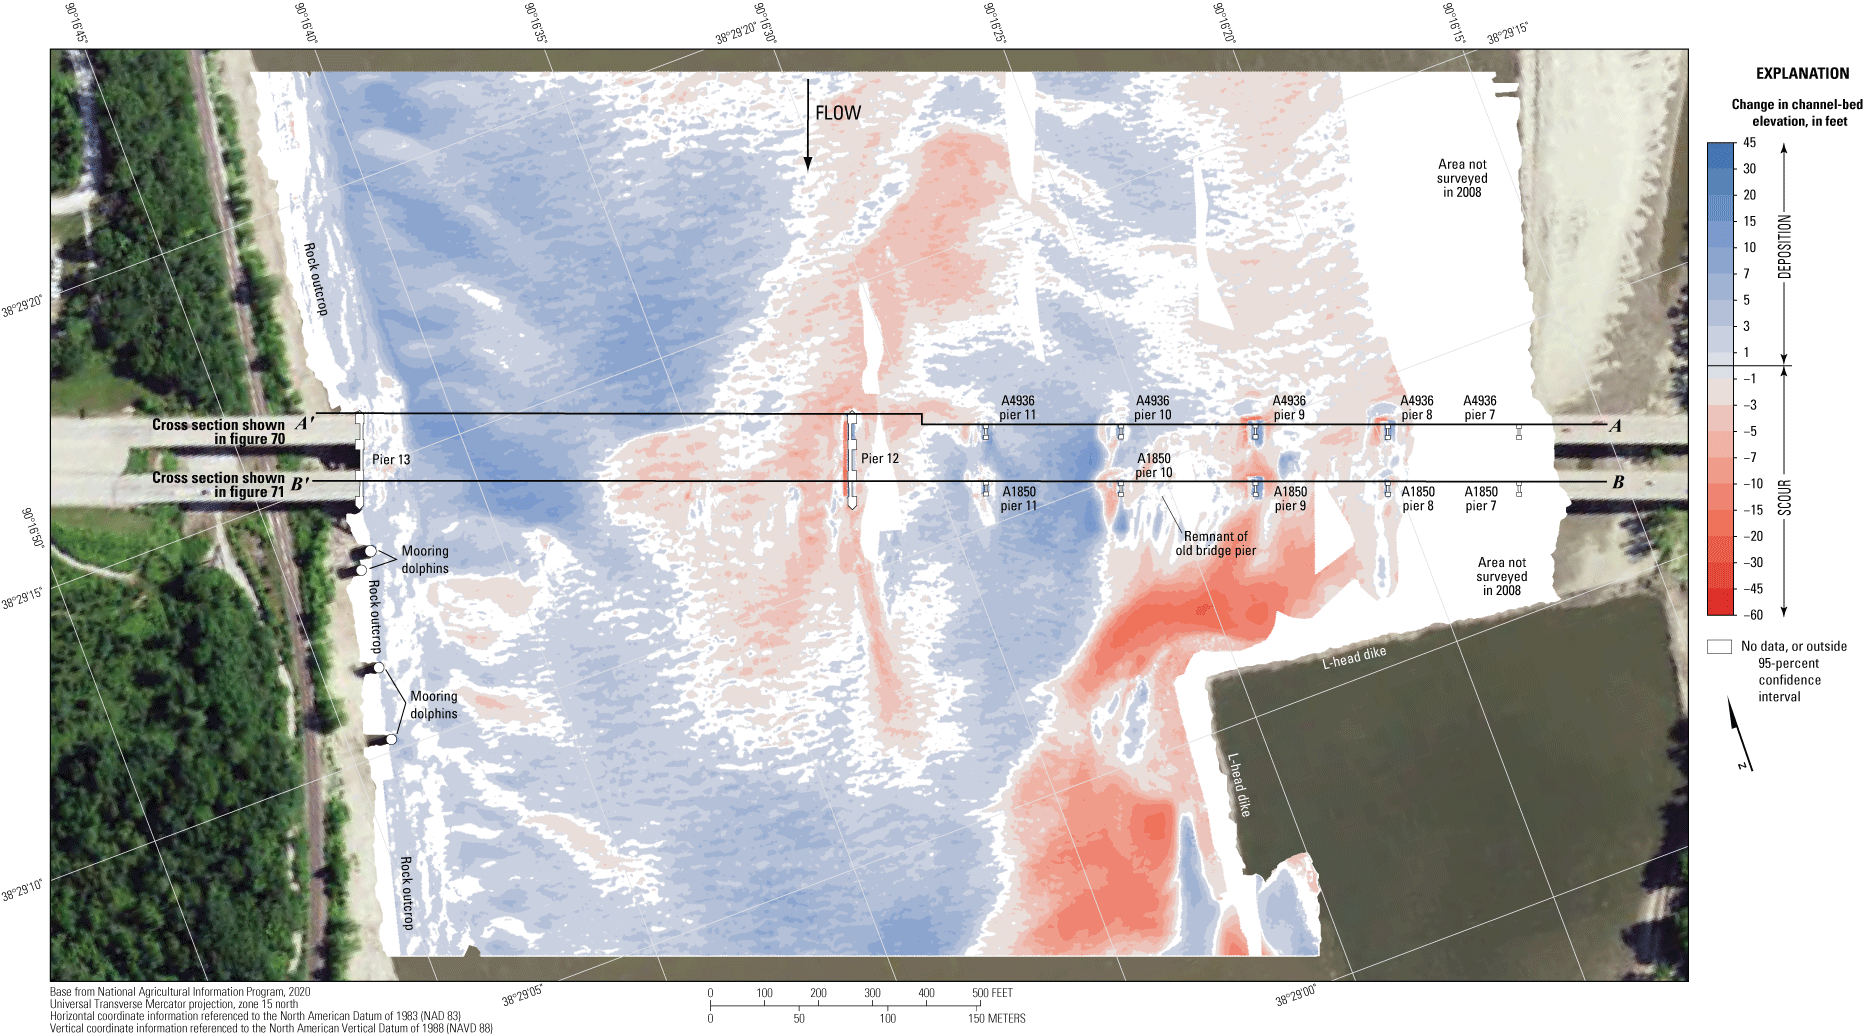
Difference between surfaces created from bathymetric surveys of the Missouri River channel near structures A4936 and A1850 on Interstate 255 near St. Louis, Missouri, on August 10, 2020, and October 2–3, 2008, with probabilistic thresholding.
Summary and Conclusions
Bathymetric and velocimetric data were collected by the U.S. Geological Survey, in cooperation with the Missouri Department of Transportation, near 15 bridges at 10 highway crossings of the Missouri and Mississippi River near Washington, Louisiana, and St. Louis, Missouri, on August 3–10, 2020. A multibeam echosounder mapping system was used to obtain channel-bed elevations for river reaches extending 1,640 to 1,970 feet (ft) longitudinally and generally extending laterally across the active channel from bank to bank during moderate flood-flow conditions. These surveys indicated the channel conditions at the time of the surveys and provided characteristics of scour holes that may be useful in developing predictive guidelines or equations for scour holes. These data also may be useful to the Missouri Department of Transportation as a low to moderate flood-flow assessment of the bridges for stability and integrity issues with respect to bridge scour during floods.
The estimated gridded uncertainty for the bathymetric surface of each survey area was computed as an estimate of the accuracy to be expected for each point with all relevant sources of error taken into account. An analysis of the surveys indicated that more than 99 percent of the bathymetric data at all the sites have a gridded uncertainty of less than 0.50 ft, and more than 96 percent of the channel-bed elevations at the sites have a gridded uncertainty of less than 0.25 ft. The gridded uncertainty of the data has been decreasing with time compared to previous surveys attributed to improvements in data-collection equipment and methods.
A variety of fluvial geomorphic features were detected in the channels, ranging from small ripples to large dunes that indicate moderate transport of bedload were present at all the surveyed bridges. Rock outcrops also were detected along one bank at several sites where the alluvial material of the channel bed had been washed away, consistent with previous surveys. Bathymetric data were collected around every pier that was in water. Scour holes were present at most piers for which bathymetry could be obtained, except those on banks or surrounded by riprap.
All the bridge sites in this study were previously surveyed, including the two new bridge structures at Louisiana and Washington (structures A8141 and A8504, sites 22 and 32). Comparisons between bathymetric surfaces from the previous surveys and those of the current (2020) study do not indicate any consistent correlation in channel-bed elevations with streamflow conditions. Most of the surveys in the current (2020) study were done during a trough between low to moderate flood rises during generally higher summer streamflows. The average difference between the bathymetric surfaces at all the St. Louis metropolitan area bridges varied from 1.51 ft higher to 4.02 ft lower in 2020 than 2016, which corresponds to a gain of 94,100 cubic yards (yd3) and a loss of −479,700 yd3, respectively. The average difference between the bathymetric surfaces at all the St. Louis metropolitan area bridges varied from 1.14 ft higher to 2.91 ft lower in 2020 than 2010, which corresponds to a gain of 102,000 yd3 and a loss of −231,400 yd3, respectively. The average difference between the bathymetric surfaces at all the Missouri River bridges varied from 2.61 ft higher to 1.20 ft lower in 2020 than 2011, which corresponds to a gain of 159,300 yd3 and a loss of −26,500 yd3, respectively. The comparisons of the 2020 surveys to two previous surveys at the new bridge structure A8141 at Washington (site 22) resulted in net erosion of the channel bed in both comparisons, despite the 2020 streamflow being less than either previous survey. Alternatively, the new bridge structure A8504 at Louisiana (site 32) had a net gain of about 190,500 yd3 of sediment between 2014 and 2020, which was the most substantial increase in the surveys detailed in this report; substantially less flow in 2020 than in 2014 or changes to the channel and spur dikes near the bridge may have contributed to the observed sediment gain.
Pier size, nose shape, and skew to approach flow substantially affected the size of the scour hole observed at a given pier. Piers with wide or blunt noses caused by exposed footings, seal courses, or caissons resulted in larger, deeper scour holes at those piers. When a pier was skewed to primary approach flow, generally the scour hole was deeper and longer than at a similar pier without skew. For example, the shape of the scour hole near pier 15 of upstream structure A3292 (site 25) was longer and deeper on the leeward side, contrary to the general shape of scour holes for skewed piers; however, this phenomenon has been observed historically at this site, and is likely exacerbated by debris that has been observed at the pier nose and the effects of the angled flow near the left main channel piers caused by the constriction downstream. At new bridge structures A8141 at Washington (site 22) and A8504 at Louisiana (site 32), the smaller cross-sectional area and configuration of the piers of the new bridges resulted in substantially less scour than with the wider old piers.
A substantial scour hole was observed near pier 11 of structure A6500 (site 33), which was deeper than in the 2016 survey. The scour hole has some of the typical characteristics of a hole at a skewed pier; however, the wide, square nose of the pier, a mild constriction downstream from the pier, and additional scour from adjacent mooring dolphins downstream likely have exacerbated the scour on the leeward side of the pier by increasing local turbulence and pulling sediment into suspension. The scour holes observed at pier 17 of structure L0561 (site 25) and piers 3 and 4 of structure A1500 (site 34) also were slightly deeper and wider in 2020 than in 2016.
A riprap blanket surrounds pier 12 of structure A6500 (site 33) and limits scour near that pier as noted in the previous survey in 2016. The remnants of riprap blankets placed around the piers of old structure K0932 near new structure A8504 (site 32), and the shape and configuration of the new piers of structure A8504 likely will limit or prevent a substantial local scour hole forming near these piers.
References Cited
Arneson, L.A., Zevenbergen, L.W., Lagasse, P.F., and Clopper, P.E., 2012, Evaluating scour at bridges (5th ed.): U.S. Federal Highway Administration Publication FHWA–HIF–12–003, Hydraulic Engineering Circular no. 18, 340 p., accessed September 30, 2022, at https://www.fhwa.dot.gov/engineering/hydraulics/pubs/hif12003.pdf.
Becker, L.D., 1994, Investigation of bridge scour at selected sites on Missouri streams: U.S. Geological Survey Water-Resources Investigations Report 94–4200, 40 p., accessed September 30, 2022, at https://doi.org/10.3133/wri944200.
Best, J., 2005, The fluid dynamics of river dunes—A review and some future research directions: Journal of Geophysical Research, v. 110, F4, F04S02, accessed September 8, 2022, at https://doi.org/10.1029/2004JF000218.
Calder, B.R., and Mayer, L.A., 2003, Automatic processing of high-rate, high-density multibeam echosounder data: Geochemistry, Geophysics, Geosystems (G3), v. 4, no. 6, 22 p. [Also available at https://doi.org/10.1029/2002GC000486.]
Densmore, B.K., Strauch, K.R., and Dietsch, B.J., 2013, Hydrographic surveys of the Missouri and Yellowstone Rivers at selected bridges and through Bismarck, North Dakota, during the 2011 flood: U.S. Geological Survey Scientific Investigations Report 2013–5087, 59 p., accessed September 30, 2022, at https://doi.org/10.3133/sir20135087.
Dietsch, B.J., Densmore, B.K., and Strauch, K.R., 2014, Repeated multibeam echosounder hydrographic surveys of 15 selected bridge crossings along the Missouri River from Niobrara to Rulo, Nebraska, during the flood of 2011: U.S. Geological Survey Scientific Investigations Report 2014–5062, 53 p., accessed September 30, 2022, at https://doi.org/10.3133/sir20145062.
Esri, 2022, Resources for ArcMap (ver. 10.8): Esri, accessed August 29, 2022, at https://www.esri.com/en-us/arcgis/products/arcgis-desktop/resources.
Gilbert, G.K., and Murphy, E.C., 1914, The transportation of debris by running water: U.S. Geological Survey Professional Paper 86, 263 p., accessed September 30, 2022, at https://doi.org/10.3133/pp86.
Hughes-Clarke, J.E., Mayer, L.A., and Wells, D.E., 1996, Shallow-water imaging multibeam sonars—A new tool for investigating seafloor processes in the coastal zone and on the continental shelf: Marine Geophysical Researches, v. 18, no. 6, p. 607–629, accessed November 29, 2022, at https://doi.org/10.1007/BF00313877.
Huizinga, R.J., 2010, Bathymetric surveys at highway bridges crossing the Missouri River in Kansas City, Missouri, using a multibeam echo sounder, 2010: U.S. Geological Survey Scientific Investigations Report 2010–5207, 61 p., accessed September 30, 2022, at https://doi.org/10.3133/sir20105207.
Huizinga, R.J., 2011, Bathymetric surveys at highway bridges crossing the Missouri and Mississippi Rivers near St. Louis, Missouri, 2010: U.S. Geological Survey Scientific Investigations Report 2011–5170, 75 p., accessed September 30, 2022, at https://doi.org/10.3133/sir20115170.
Huizinga, R.J., 2012, Bathymetric and velocimetric surveys at highway bridges crossing the Missouri River in and into Missouri during summer flooding, July–August 2011: U.S. Geological Survey Scientific Investigations Report 2012–5204, 166 p., accessed September 30, 2022, at https://doi.org/10.3133/sir20125204.
Huizinga, R.J., 2014, Bathymetric and velocimetric surveys at highway bridges crossing the Missouri River between Kansas City and St. Louis, Missouri, April–May, 2013: U.S. Geological Survey Scientific Investigations Report 2014–5116, 79 p., accessed September 30, 2022, at https://doi.org/10.3133/sir20145116.
Huizinga, R.J., 2015, Bathymetric and velocimetric surveys at highway bridges crossing the Missouri and Mississippi Rivers on the periphery of Missouri, June 2014: U.S. Geological Survey Scientific Investigations Report 2015–5048, 81 p., accessed September 30, 2022, at https://doi.org/10.3133/sir20155048.
Huizinga, R.J., 2016, Bathymetric and velocimetric surveys at highway bridges crossing the Missouri River near Kansas City, Missouri, June 2–4, 2015: U.S. Geological Survey Scientific Investigations Report 2016–5061, 93 p., accessed September 30, 2022, at https://doi.org/10.3133/sir20165061.
Huizinga, R.J., 2017a, Bathymetric and velocimetric surveys at highway bridges crossing the Missouri and Mississippi Rivers near St. Louis, Missouri, May 23–27, 2016: U.S. Geological Survey Scientific Investigations Report 2017–5076, 102 p., accessed September 30, 2022, at https://doi.org/10.3133/sir20175076.
Huizinga, R.J., 2017b, Bathymetry and velocity data from surveys at highway bridges crossing the Missouri and Mississippi Rivers near St. Louis, Missouri, October 2008 through May 2016: U.S. Geological Survey data release, accessed September 30, 2022, at https://doi.org/10.5066/F71C1VCC.
Huizinga, R.J., 2020a, Bathymetric and velocimetric surveys at highway bridges crossing the Missouri River between Kansas City and St. Louis, Missouri, May 22–31, 2017: U.S. Geological Survey Scientific Investigations Report 2020–5018, 104 p., accessed September 30, 2022, at https://doi.org/10.3133/sir20205018.
Huizinga, R.J., 2020b, Bathymetry and velocity data from surveys at highway bridges crossing the Missouri River in Kansas City, Missouri, March 2010 through May 2017: U.S. Geological Survey data release, accessed September 30, 2022, at https://doi.org/10.5066/P9L6GW57.
Huizinga, R.J., 2020c, Bathymetry and velocity data from surveys at highway bridges crossing the Missouri River between Kansas City and St. Louis, Missouri, January 2010 through May 2017: U.S. Geological Survey data release, accessed September 30, 2022, at https://doi.org/10.5066/P94M4US7.
Huizinga, R.J., 2020d, Bathymetry and velocity data from surveys at highway bridges crossing the Missouri and Mississippi Rivers on the periphery of Missouri, December 2008 through August 2018: U.S. Geological Survey data release, accessed September 30, 2022, at https://doi.org/10.5066/P9WDI9YF.
Huizinga, R.J., 2020e, Bathymetric and velocimetric surveys at highway bridges crossing the Missouri and Mississippi Rivers on the periphery of Missouri, July–August 2018: U.S. Geological Survey Scientific Investigations Report 2020–5088, 100 p., accessed September 30, 2022, at https://doi.org/10.3133/sir20205088.
Huizinga, R.J., 2021, Bathymetry and velocity data from surveys at highway bridges crossing the Missouri River in Kansas City, Missouri, in August 2019, August 2020, and October 2020: U.S. Geological Survey data release, accessed September 30, 2022, at https://doi.org/10.5066/P96TX8AE.
Huizinga, R.J., 2022a, Bathymetric and velocimetric surveys at highway bridges crossing the Missouri River near Kansas City, Missouri, August 2019, August 2020, and October 2020: U.S. Geological Survey Scientific Investigations Report 2021–5098, 112 p., accessed September 30, 2022, at https://doi.org/10.3133/sir20215098.
Huizinga, R.J., 2022b, Bathymetry and velocity data from surveys at highway bridges crossing the Missouri and Mississippi Rivers near St. Louis, Missouri, August 3–10, 2020: U.S. Geological Survey data release, accessed March 31, 2023, at https://doi.org/10.5066/P9F04JC5.
Huizinga, R.J., Elliott, C.M., and Jacobson, R.B., 2010, Bathymetric and velocimetric survey and assessment of habitat for pallid sturgeon on the Mississippi River in the vicinity of the proposed Interstate 70 Bridge at St. Louis, Missouri: U.S. Geological Survey Scientific Investigations Report 2010–5017, 28 p., accessed September 30, 2022, at https://doi.org/10.3133/sir20105017.
Huizinga, R.J., and Rydlund, P.H., Jr., 2004, Potential-scour assessments and estimates of scour depth using different techniques at selected bridge sites in Missouri: U.S. Geological Survey Scientific Investigations Report 2004–5213, 42 p., accessed September 30, 2022, at https://doi.org/10.3133/sir20045213.
HYPACK, Inc., 2020, HYPACK User Manual: Middletown, Conn., HYPACK, Inc., 2,602 p., accessed June 28, 2022, at https://www.hypack.com/File%20Library/Resource%20Library/Manuals/2020/2020-HYPACK-User-Manual.pdf.
International Hydrographic Organization [IHO], 2020, IHO standards for hydrographic surveys (6th ed.): Monaco, International Hydrographic Bureau, Special publication no. 44, 41 p., accessed January 2022 at https://iho.int/uploads/user/pubs/standards/s-44/S-44_Edition_6.0.0_EN.pdf.
Mueller, D.S., Wagner, C.R., Rehmel, M.S., Oberg, K.A., and Rainville, F., 2013, Measuring discharge with acoustic Doppler current profilers from a moving boat (ver. 2.0, December 2013): U.S. Geological Survey Techniques and Methods, book 3, chap. A22, 95 p., accessed September 30, 2022, at https://doi.org/10.3133/tm3A22.
Parsons, D.R., Jackson, P.R., Czuba, J.A., Engel, F.L., Rhoads, B.L., Oberg, K.A., Best, J.L., Mueller, D.S., Johnson, K.K., and Riley, J.D., 2013, Velocity Mapping Toolbox (VMT)—A processing and visualization suite for moving-vessel ADCP measurements: Earth Surface Processes and Landforms, v. 38, no. 11, p. 1244–1260. [Also available at https://doi.org/10.1002/esp.3367.]
Riverscapes Consortium, 2022, Geomorphic change detection software: Riverscapes Consortium, accessed February 17, 2023 at http://gcd.riverscapes.net/.
Rydlund, P.H., Jr., 2009, Real-time river channel-bed monitoring at the Chariton and Mississippi Rivers in Missouri, 2007–09: U.S. Geological Survey Scientific Investigations Report 2009–5254, 27 p., accessed September 30, 2022, at https://doi.org/10.3133/sir20095254.
Simons, D.B., and Richardson, E.V., 1966, Resistance to flow in alluvial channels: U.S. Geological Survey Professional Paper 422–J, 61 p. [Also available at https://doi.org/10.3133/pp422J.]
U.S. Army Corps of Engineers [USACE], 2003a, Upper Mississippi River System flow frequency study, appendix D: Rock Island, Ill., U.S. Army Corps of Engineers, accessed September 2022 at https://www.mvr.usace.army.mil/Portals/48/docs/FRM/UpperMissFlowFreq/App.%20D%20St.%20Louis%20Dist.%20Hydrology_Hydraulics.pdf.
U.S. Army Corps of Engineers [USACE], 2003b, Upper Mississippi River System flow frequency study, appendix E: Rock Island, Ill., U.S. Army Corps of Engineers, accessed April 2017 at https://www.mvr.usace.army.mil/Portals/48/docs/FRM/UpperMissFlowFreq/App.%20E%20Kansas%20City%20Dist.%20Hydrology_Hydraulics.pdf.
U.S. Army Corps of Engineers [USACE], 2013, Engineering and design—Hydrographic surveying: Washington D.C., U.S. Army Corps of Engineers, manual no. EM 1110–2–1003,560 p. [Also available at https://www.publications.usace.army.mil/Portals/76/Publications/EngineerManuals/EM_1110-2-1003.pdf?ver=gDGVUj_0XR2sXHiIpQZv2Q%3d%3d.]
U.S. Geological Survey [USGS], 2022a, USGS water data for the Nation: U.S. Geological Survey National Water Information System database, accessed May 2022 at https://doi.org/10.5066/F7P55KJN.
U.S. Geological Survey [USGS], 2022b, USGS streamgage statistics for station 06935965: U.S. Geological Survey WaterWatch toolkit, accessed May 2022 at https://waterwatch.usgs.gov/index.php?sno=06935965&ds=dv01d_por&btnGo=GO&m=sitempnn.
U.S. Geological Survey [USGS], 2022c, USGS streamgage statistics for station 07010000: U.S. Geological Survey WaterWatch toolkit, accessed May 2022 at https://waterwatch.usgs.gov/index.php?sno=07010000&ds=dv01d_por&btnGo=GO&m=sitempnn.
Glossary
- bent
A vertical, load-bearing, intermediate bridge substructure unit between the ends of a bridge used to support the bridge at intermediate intervals, typically consisting of two or more piles (referred to as a “pile bent”) or columns, each supported by an individual footing, pile, or drilled shaft.
- caisson
An older type of bridge foundation consisting of a watertight retaining structure used as the foundation of a bridge pier, constructed in such a way that the water can be pumped out, keeping the work environment dry while the ground under the caisson is excavated and the caisson “sunk” into final position below the ground line. Upon reaching its final position, the caisson is backfilled with sand or gravel for added weight and stability.
- cap
The upper or bearing part of a bridge pier or bent, usually made of concrete or hard stone and designed to distribute concentrated loads from the bridge superstructure evenly over the columns of the pier or bent.
- cofferdam
A temporary retaining structure used in pier and pylon construction to retain water and support the sides of an excavation where water is present. A cofferdam generally consists of vertical sheet piling around the perimeter of a bracing system and a bottom seal course. Once sealed, the water can be pumped out, keeping the work environment dry while the footing, columns, and other substructural elements are built.
- column
The primary part of a bridge bent, pier, or pylon used to convey the load of the bridge superstructure to the foundation.
- dolphin
An isolated structure for berthing and mooring of vessels away from the river bank. A dolphin generally consists of a group of piles, or a cylinder of sheet piling filled with gravel or concrete, and sometimes is used in conjunction with a moored service or loading dock.
- drilled shaft
A cylindrical shaft that is drilled into the ground as a bridge foundation, typically extending through the alluvial material into underlying rock and filled with reinforced concrete.
- footing
A part of the foundation of a bridge bent, pier, or pylon used to transmit the load from the column to the ground, either directly or indirectly through piles or drilled shafts.
- L-head dike
A special kind of stone spur dike that projects from a river bank but includes a distinctive bend and continues along the channel in a downstream direction.
- pedestal
A transitional element occasionally used in a bridge pier or pylon, typically found between the column and a footing or caisson.
- pier
A vertical, load bearing, intermediate bridge substructure unit between the ends of a bridge used to support the bridge at intermediate intervals, consisting of a single column or shaft, or multiple columns connected with a strut or solid web, and generally supported by a single footing.
- pile
A long, narrow cylinder or beam made of wood, metal, or concrete used as part of the foundation of a bridge, typically driven into the ground from above and integrated into a seal course or footing of a pier, or the cap of a pile bent. Groups of piles also are used as mooring dolphins.
- pylon
A tower-like vertical, load bearing substructural unit that usually supports the cables of a suspension bridge or a cable-stayed bridge. A pylon typically extends above the bridge superstructure.
- seal course
The base of a newer type of bridge foundation, created when a cofferdam used to build the foundation is “sealed” with concrete at the underwater ground level to prevent water from entering the cofferdam from below.
- spur dike
A linear structure usually constructed of piled stone projecting from the bank in a river to redirect the river's own energy to protect the bank from erosion and to direct the axis of flow.
- stone revetment
A facing of stone, concrete units, or slabs built to protect a bank or other feature against erosion by wave action, currents, and surges.
- strut
A horizontal intermediate bridge substructure unit used to connect and brace two or more columns or shafts of a pier.
- substructure
The part of a bridge that supports the superstructure and transmits the load of the superstructure and deck to the ground through the foundations.
- superstructure
The part of a bridge that supports the bridge deck, and connects one substructural element to another and thereby transmits the load of the deck and anything on the deck to the substructure.
- water year
A continuous 12-month period selected to present data relative to hydrologic or meteorological phenomena during which a complete annual hydrologic cycle normally occurs. The water year used by the U.S. Geological Survey runs from October 1 through September 30 and is designated by the year in which it ends.
Appendix 1. Shaded Triangulated Irregular Network Images of the Channel and Side of Pier for Each Surveyed Pier
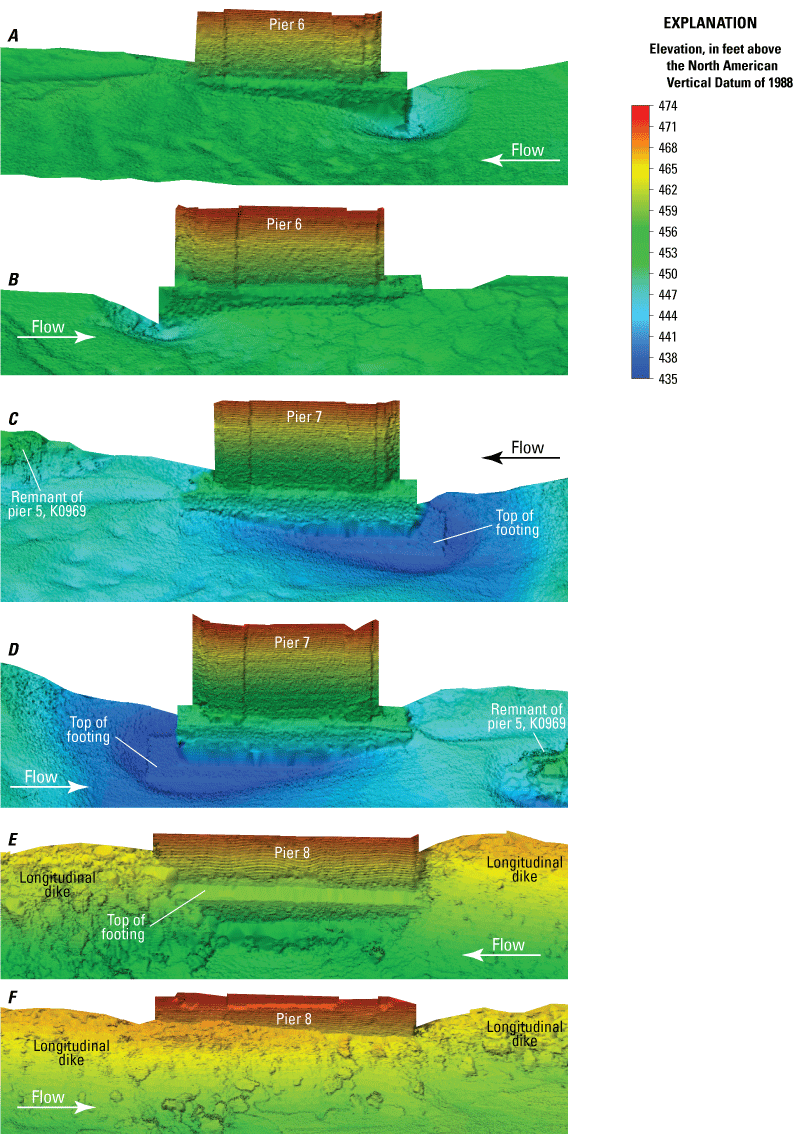
Shaded triangulated irregular network visualization of the channel bed and piers of structure A8141 on State Highway 47 over the Missouri River at Washington, Missouri. A, left (north) side of pier 6. B, right (south) side of pier 6. C, left (north) side of pier 7. D, right (south) side of pier 7. E, left (north) side of pier 8. F, right (south) side of pier 8.
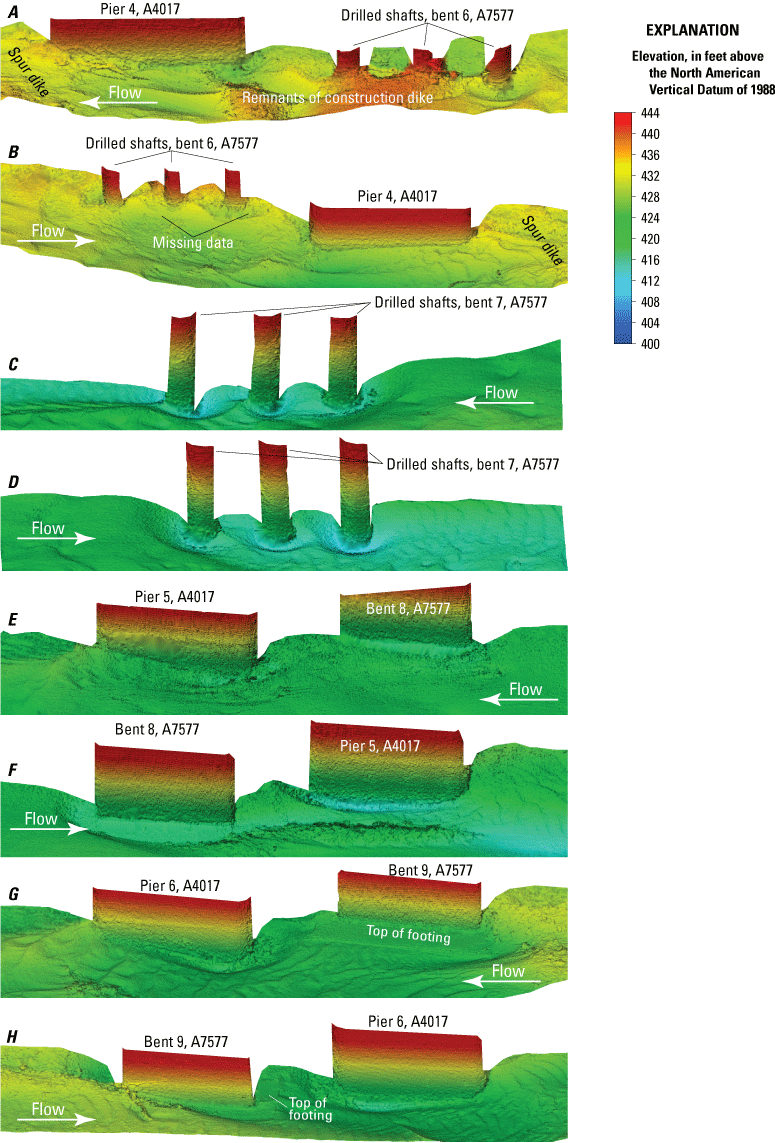
Shaded triangulated irregular network visualization of the channel bed and bents and piers of structures A7577 and A4017 on Interstate 64 over the Missouri River near St. Louis, Missouri. A, left (north side of bent 6 and pier 4. B, right (south) side of bent 6 and pier 4. C, left (north) side of bent 7. D, right (south) side of bent 7. E, left (north) side of bent 8 and pier 5. F, right (south) side of bent 8 and pier 5. G, left (north) side of bent 9 and pier 6. H, right (south) side of bent 9 and pier 6.
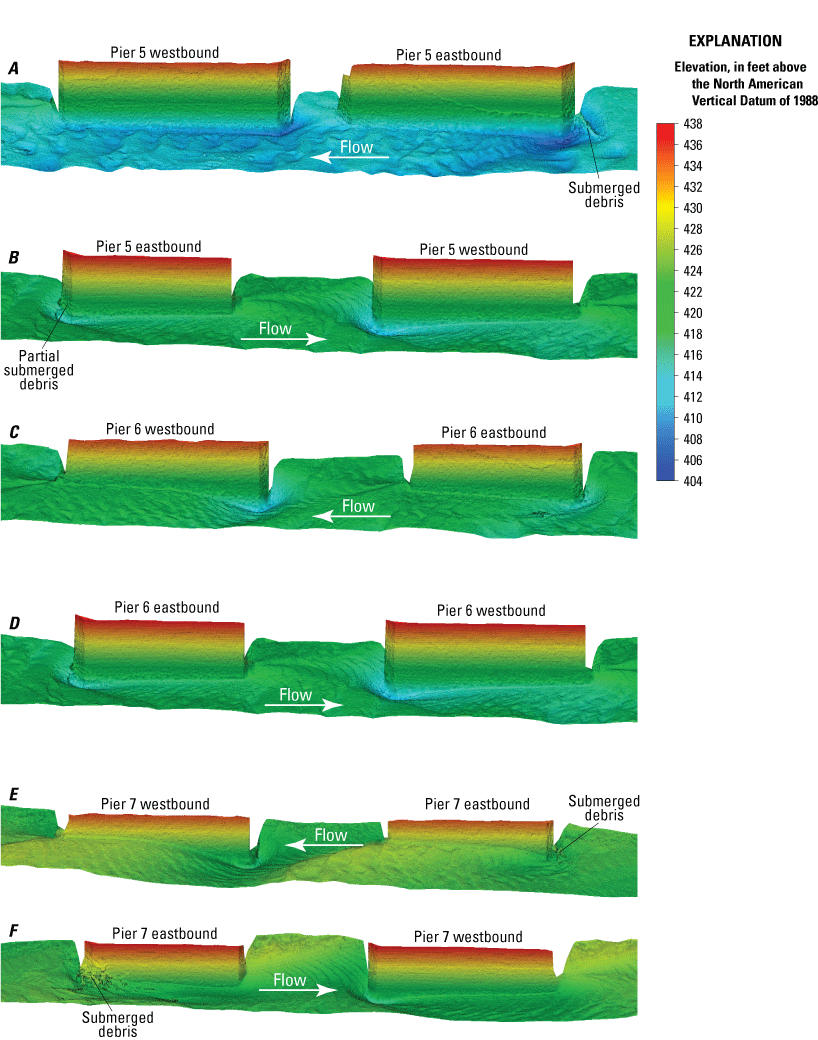
Shaded triangulated irregular network visualization of the channel bed and piers of dual bridge structure A5585 on State Highway 364 over the Missouri River near St. Louis, Missouri. A, left (north) side of pier 5. B, right (south) side of pier 5. C, left (north) side of pier 6. D, right (south) side of pier 6. E, left (north) side of pier 7. F, right (south) side of pier 7.
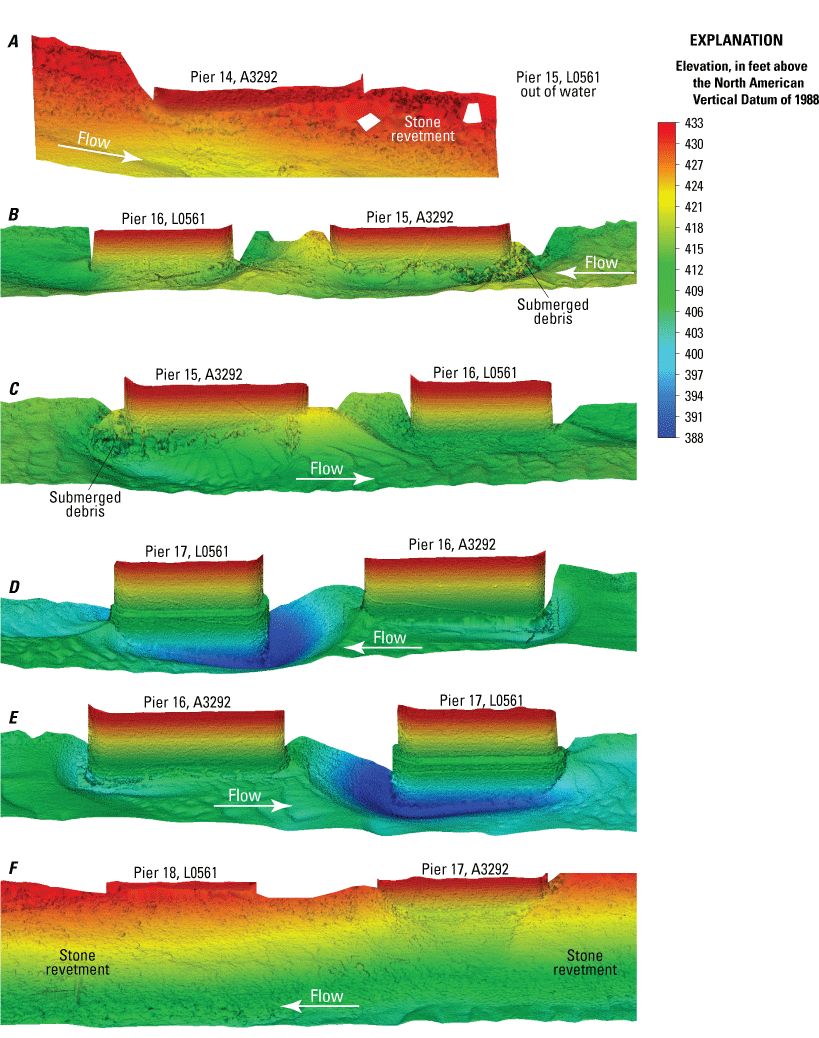
Shaded triangulated irregular network visualization of the channel bed and piers of structures A3292 and L0561 on Interstate 70 over the Missouri River near St. Louis, Missouri. A, right (southeast) side of piers 14 and 15. B, left (northwest) side of piers 15 and 16. C, right (southeast) side of piers 15 and 16. D, left (northwest) side of piers 16 and 17. E, right (southeast) side of piers 16 and 17. F, left (northwest) side of piers 17 and 18.
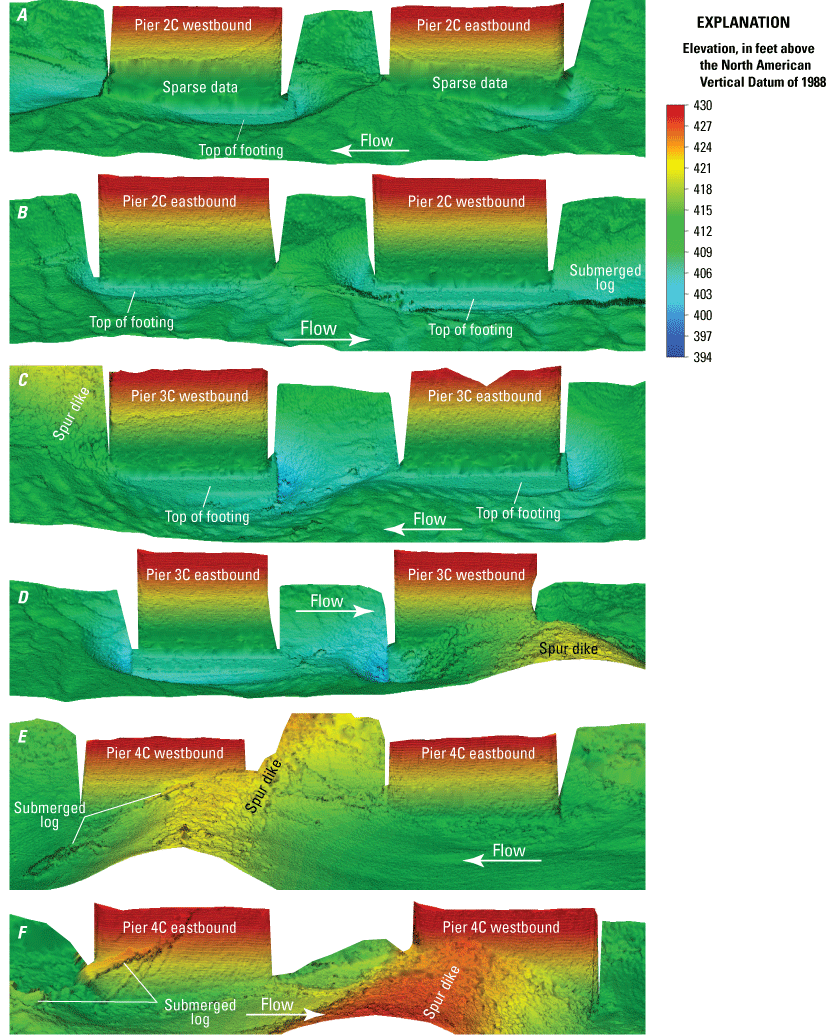
Shaded triangulated irregular network visualization of the channel bed and piers of dual bridge structure A4557 on State Highway 370 over the Missouri River near St. Louis, Missouri. A, left (northwest) side of pier 2C. B, right (southeast) side of pier 2C. C, left (northwest) side of pier 3C. D, right (southeast) side of pier 3C. E, left (northwest) side of pier 4C. F, right (southeast) side of pier 4C.
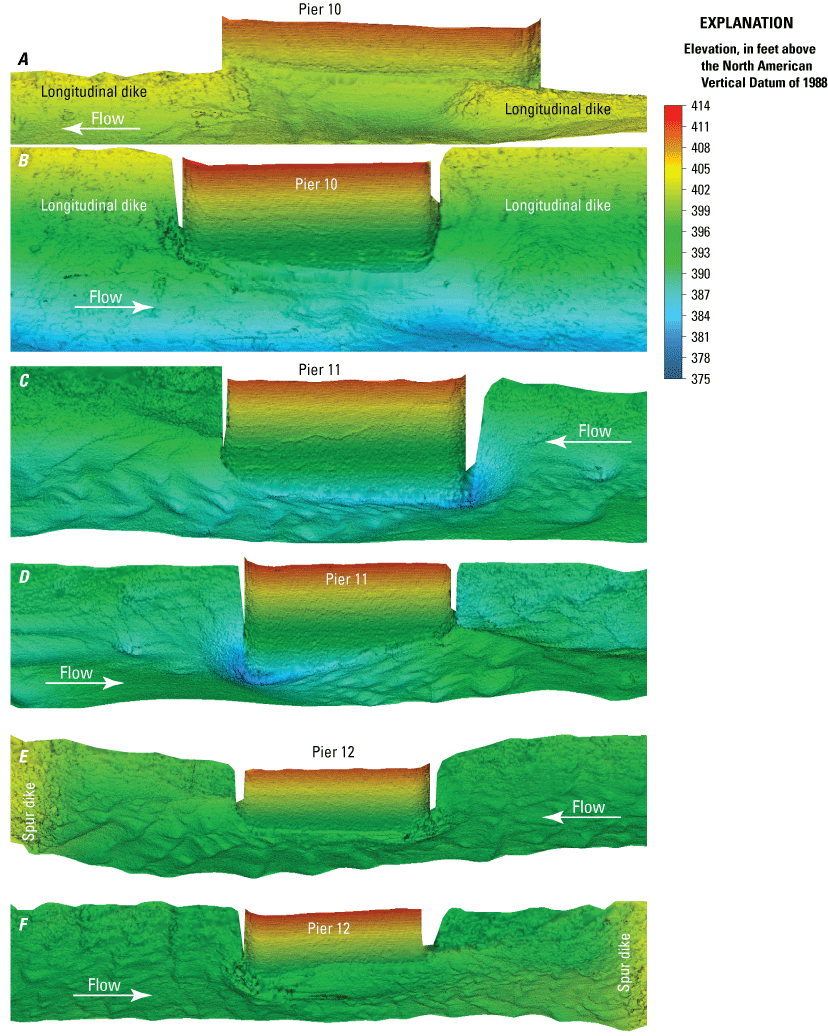
Shaded triangulated irregular network visualization of the channel bed and piers of structure A3047 on U.S. Highway 67 over the Missouri River near St. Louis, Missouri. A, left (north) side of pier 10. B, right (south) side of pier 10. C, left (north) side of pier 11. D, right (south) side of pier 11. E, left (north) side of pier 12. F, right (south) side of pier 12.
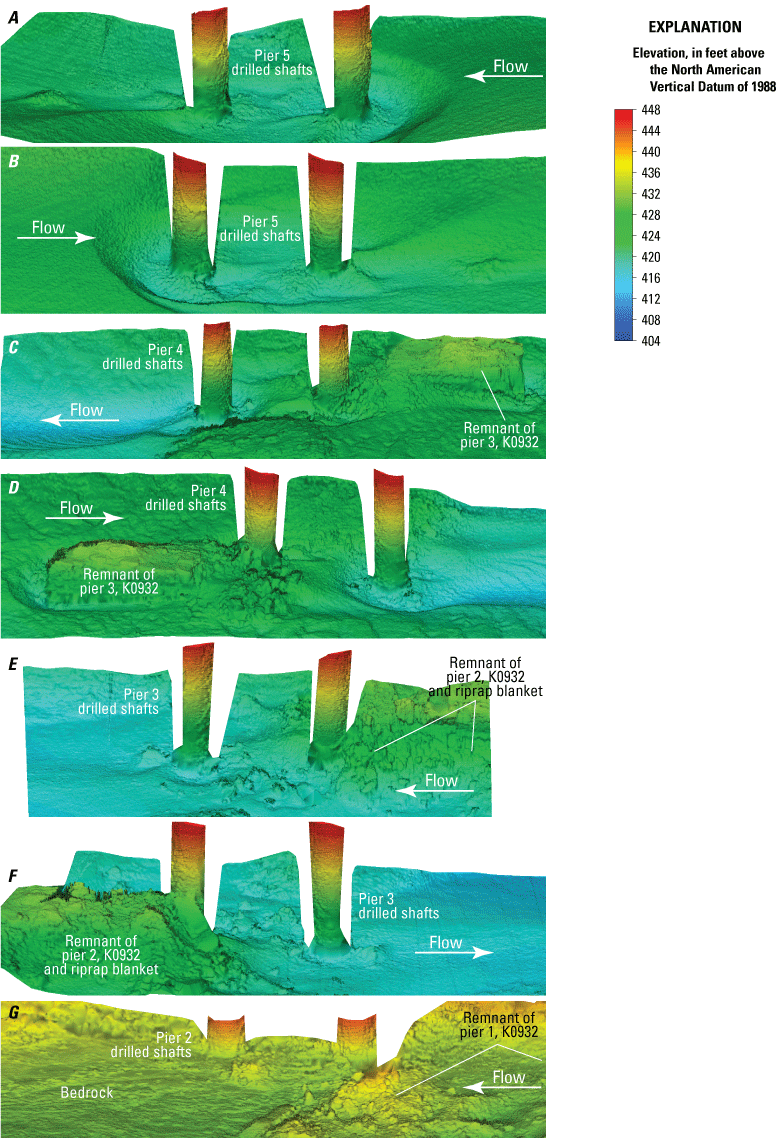
Shaded triangulated irregular network visualization of the channel bed and piers of structure A8504 on U.S. Highway 54 over the Mississippi River at Louisiana, Missouri. A, left (northeast) side of pier. B, right (southwest) side of pier 5. C, left (northeast) side of pier 4. D, right (southwest) side of pier 4. E, left (northeast) side of pier 3. F, right (southwest) side of pier 3. G, left (northeast) side of pier 2.
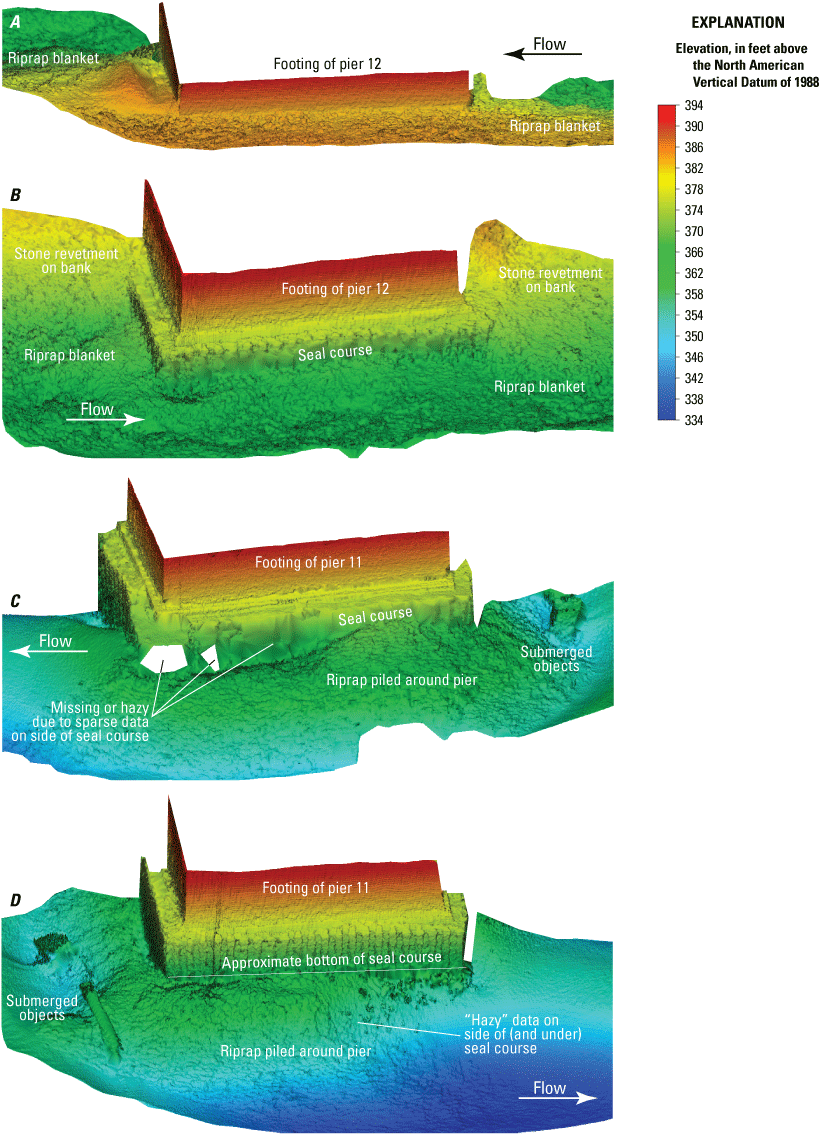
Shaded triangulated irregular network visualization of the channel bed and piers of structure A6500 on Interstate 70 over the Mississippi River in St. Louis, Missouri. A, left (east) side of pier 12. B, right (west) side of pier 12. C, left (east) side of pier 11. D, right (west) side of pier 11.
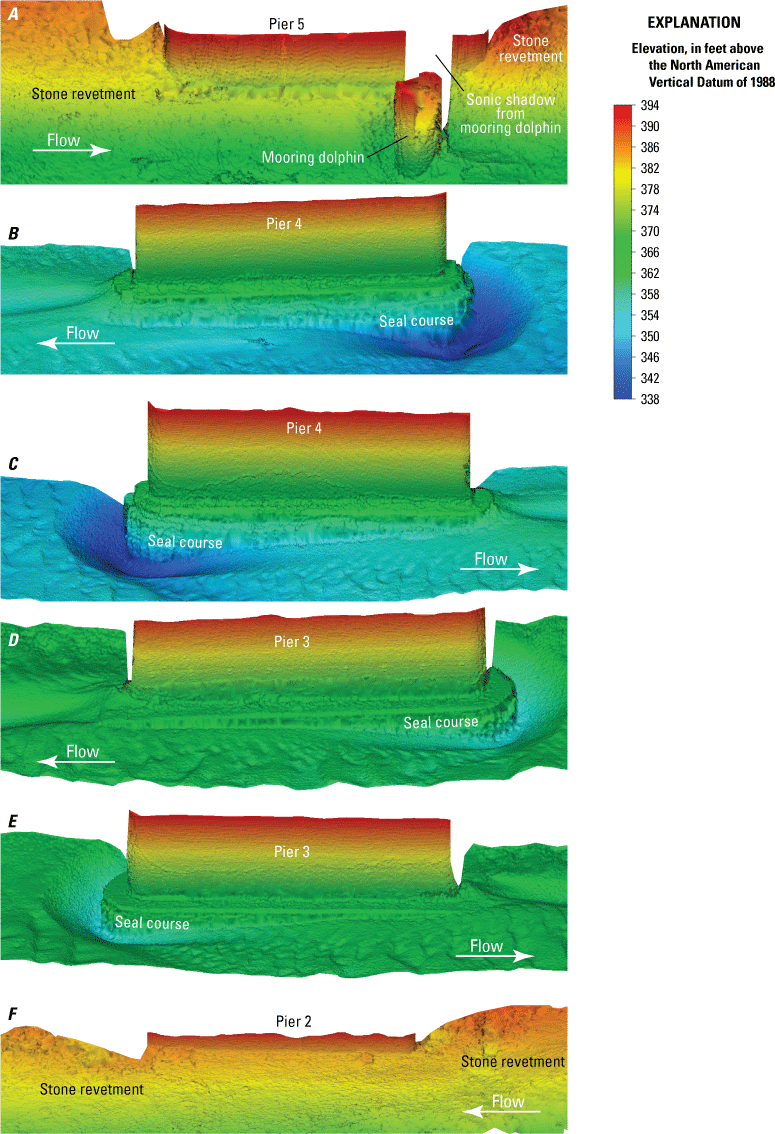
Shaded triangulated irregular network visualization of the channel bed and piers of structure A1500 on Interstate 55 over the Mississippi River in St. Louis, Missouri. A, right (west) side of pier 5. B, left (east) side of pier 4. C, right (west) side of pier 4. D, left (east) side of pier 3. E, right (west) side of pier 3. F, left (east) side of pier 2.
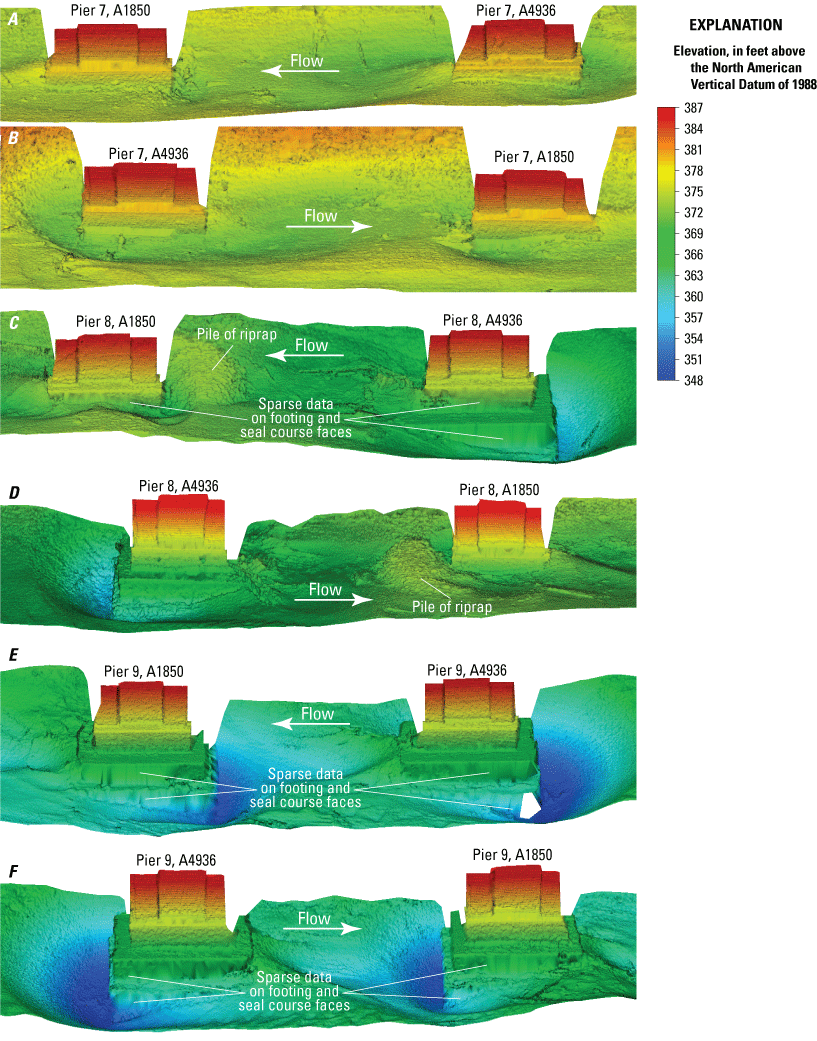
Shaded triangulated irregular network visualization of the channel bed and piers of structures A4936 and A1850 on Interstate 255 over the Mississippi River near St. Louis, Missouri. A, left (east) side of pier 7. B, right (west) side of pier 7. C, left (east) side of pier 8. D, right (west) side of pier 8. E, left (east) side of pier 9. F, right (west) side of pier 9.
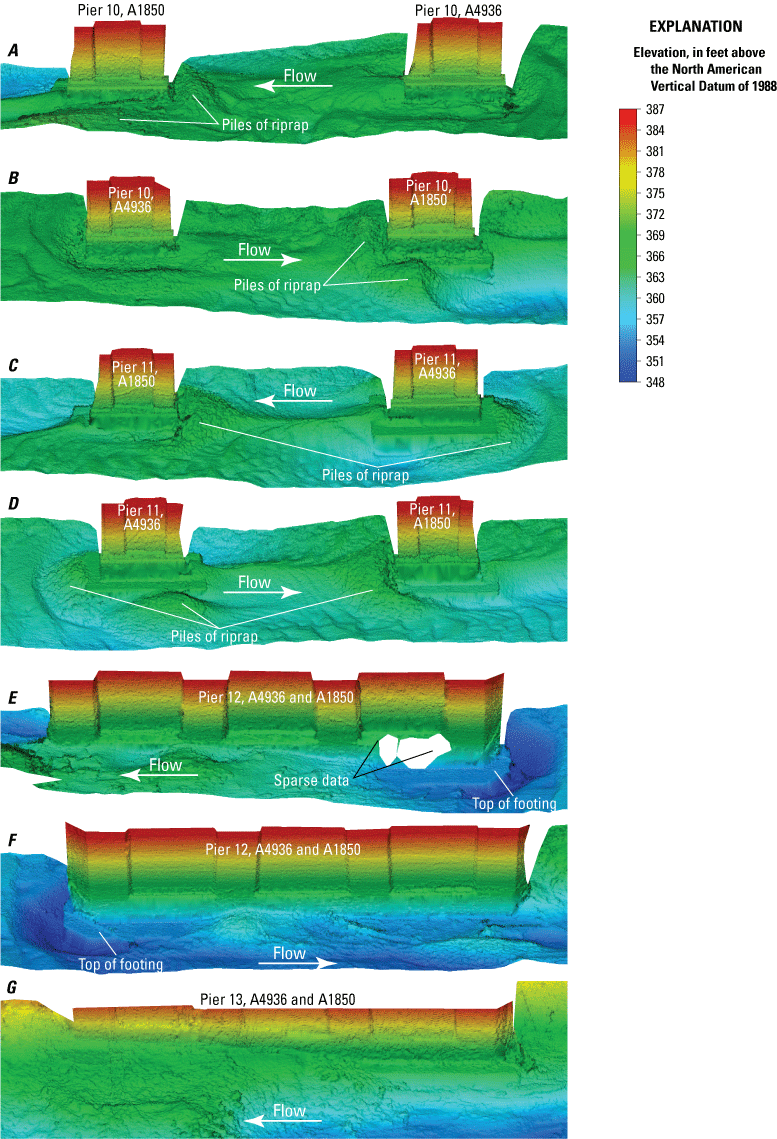
Shaded triangulated irregular network visualization of the channel bed and piers of structures A4936 and A1850 on Interstate 255 over the Mississippi River near St. Louis, Missouri. A, left (east) side of pier 10. B, right (west) side of pier 10. C, left (east) side of pier 11. D, right (west) side of pier 11. E, left (east) side of pier 12. F, right (west) side of pier 12. G, left (east) side of pier 13.
Datums
Vertical coordinate information is referenced to the North American Vertical Datum of 1988 (NAVD 88).
Horizontal coordinate information is referenced to the North American Datum of 1983 (NAD 83).
Supplemental Information
In this report, the words “left” and “right” refer to directions that would be reported by an observer facing downstream.
Distance on the Missouri River is given in river miles (RM) upstream from river mile 0 at the confluence with the Mississippi River at St. Louis, Missouri, at river mile 195.2 of the Upper Mississippi River.
Distance on the Mississippi River is given in river miles (RM) upstream from river mile 0 at the confluence with the Ohio River at Cairo, Illinois, at river mile 953.5 of the Lower Mississippi River.
Frequency is given in kilohertz (kHz).
Data were collected, processed, and output in the International System of Units, and converted to U.S. customary units for presentation in the maps at the request and for the convenience of the cooperator.
Abbreviations
[Some abbreviations are used only once but are used and included here at the convenience of the cooperator and end users, who often are more familiar with the abbreviation than the definition]
ADCP
acoustic Doppler current profiler
CUBE
Combined Uncertainty and Bathymetry Estimator
DEM
digital elevation model
DoD
digital elevation model of difference
GCD
Geomorphic Change Detection
GNSS
Global Navigation Satellite System
IHO
International Hydrographic Organization
IMU
inertial measurement unit
INS
inertial navigation system
MBES
multibeam echosounder
MBMS
multibeam mapping system
MMS
Mobile Mapping Suite
MoDOT
Missouri Department of Transportation
POS MV
Position Orientation Solution for Marine Vessels
RM
river mile
RTK
real-time kinematic
SBET
smoothed best estimate of trajectory
TIN
triangulated irregular network
USACE
U.S. Army Corps of Engineers
USGS
U.S. Geological Survey
For more information about this publication, contact:
Director, USGS Central Midwest Water Science Center
1400 Independence Road
Rolla, MO 65401
573–308–3667
For additional information, visit: https://www.usgs.gov/centers/cmwater
Publishing support provided by the Rolla Publishing Service Center
Disclaimers
Any use of trade, firm, or product names is for descriptive purposes only and does not imply endorsement by the U.S. Government.
Although this information product, for the most part, is in the public domain, it also may contain copyrighted materials as noted in the text. Permission to reproduce copyrighted items must be secured from the copyright owner.
Suggested Citation
Huizinga, R.J., 2023, Bathymetric and velocimetric surveys at highway bridges crossing the Missouri and Mississippi Rivers near St. Louis, Missouri, August 3–10, 2020 (ver. 1.1, June 2023): U.S. Geological Survey Scientific Investigations Report 2023–5050, 129 p., https://doi.org/10.3133/sir20235050.
ISSN: 2328-0328 (online)
Study Area
| Publication type | Report |
|---|---|
| Publication Subtype | USGS Numbered Series |
| Title | Bathymetric and velocimetric surveys at highway bridges crossing the Missouri and Mississippi Rivers near St. Louis, Missouri, August 3–10, 2020 |
| Series title | Scientific Investigations Report |
| Series number | 2023-5050 |
| DOI | 10.3133/sir20235050 |
| Edition | Version 1.0: May 25, 2023; Version 1.1: June 1, 2023 |
| Publication Date | May 25, 2023 |
| Year Published | 2023 |
| Language | English |
| Publisher | U.S. Geological Survey |
| Publisher location | Reston, VA |
| Contributing office(s) | Central Midwest Water Science Center |
| Description | Report: xii, 129 p.; 4 Data Releases |
| Country | United States |
| State | Illinois, Missouri |
| Online Only (Y/N) | Y |