

Compressional-Wave Seismic Velocity, Bulk Density, and their Empirical Relations for Geophysical Modeling of the Midcontinent Rift System in the Lake Superior Region
Links
- Document: Report (4.53 MB pdf) , HTML , XML
- NGMDB Index Page: National Geologic Map Database Index Page (html)
- Download citation as: RIS | Dublin Core
Acknowledgments
I thank Mark Jirsa (Minnesota Geological Survey, retired) who supplied the original illustration of regional geology, Esther Stewart (Wisconsin Geological and Natural History Survey) who provided expert descriptions of and guidance on locating boreholes in Wisconsin, and Val Chandler (Minnesota Geological Survey, retired) who gave generously of his time and knowledge. I am indebted to U.S. Geological Survey (USGS) colleagues Tom Brocher, Bill Cannon, and Ben Drenth, who provided reviews that substantively improved the manuscript, and Laurel Woodruff and Paul Bedrosian, who offered helpful suggestions. Special recognition goes to Uri Ten Brink (USGS), whose insightful comments on the seismic velocities of basalt motivated me to undertake this compilation.
Abstract
Compressional-wave seismic velocity (velocity) and bulk density (density) data were compiled from published sources for rock suites and earth materials that are significant for geophysical modeling of the Mesoproterozoic Midcontinent Rift System in the Lake Superior region. The data include laboratory measurements of outcrop and drill core samples, seismic refraction studies, and a sonic log from a 1.5-kilometer-deep exploration well. Rock suites of the Midcontinent Rift System include basalts of the Mesoproterozoic Keweenawan Supergroup, Oronto Group sedimentary rocks (divided into arenaceous versus argillaceous units), and several sedimentary formations overlying the Oronto Group that have been correlated across the area. Intrusive units include diabase, gabbro, and felsic igneous rocks. Other geologic units important for geophysical modeling in the Lake Superior region include Archean crystalline crust, Paleoproterozoic metasedimentary and crystalline rocks, lower Mesoproterozoic sedimentary rocks, and Holocene to Pleistocene surficial deposits.
Empirical velocity-density relations for each rock suite were determined by comparing the compiled data to published relations, such as the Nafe-Drake curve, Gardner’s relation, and best-fit equations developed for different rock types from laboratory studies. Graphical representations of these velocity-density relations provide a way to easily understand how velocity and density differ between tectonic settings and by rock type. Overlaps in velocity and density ranges for different geologic units are significant and have especially important implications for geologic interpretation of seismic data. Important examples include similar velocities but differing densities for argillaceous Oronto Group versus units overlying the Oronto Group and arenaceous Oronto Group versus basalt of the Keweenawan Supergroup. Similar densities but differing velocities were found for diabase versus gabbro. In addition, expected velocity ranges by rock type show that high-velocity intervals (6.9–7.1 kilometers per second) interpreted as basalt in previous seismic-reflection studies more likely indicate diabase or gabbro, suggesting that these interpretations may warrant additional consideration.
Introduction
The 1.1 giga-annum (Ga) Midcontinent Rift System is a major magmatic continental rift that stretches approximately 2,200 kilometers (km) from Kansas northeast to the Lake Superior region, where it curves southward and is inferred to extend into lower Michigan (fig. 1; Hinze and Chandler, 2020). The extent of the Midcontinent Rift System is defined mainly from regional gravity data because much of it lies beneath Phanerozoic sedimentary rocks and surficial cover. The gravity expression reflects the thick accumulation (tens of kilometers) of rift basalts overlain by an equally substantial clastic sedimentary section (Van Schmus and Hinze, 1985; Hinze and others, 1997; Ojakangas and others, 2001a). In the Lake Superior region, these rift basins are thickest beneath the present-day lake (Cannon and others, 1989). Magma associated with the basalts intruded a preexisting craton that had already experienced multiple Archean and Paleoproterozoic orogenies associated with active margin tectonism (Van Schmus, 1992; Morey, 1996; Percival and others, 2012). Despite extensive magmatism similar to that commonly associated with continental breakup, the Midcontinent Rift System did not result in complete separation of the crust. As a consequence, the Lake Superior region holds a record of continental rifting that was only partially attained. This record is mostly covered by widespread surficial deposits onshore (Soller and others, 2012) and is submerged offshore (fig. 1).
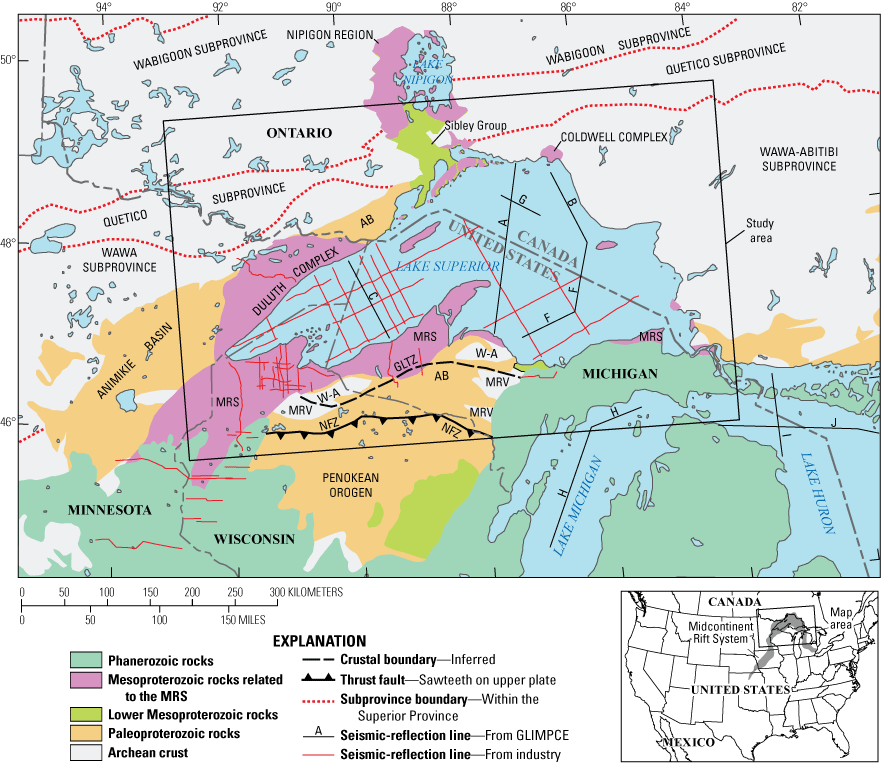
Regional geologic setting of the Lake Superior region and study area. Map area is located with respect to the Midcontinent Rift System (MRS), as defined by regional gravity data (Hinze and Chandler, 2020; inset). Base map of bedrock geology provided courtesy of Mark Jirsa (Minnesota Geological Survey). Additional modifications follow Sims and Day (1993), Schulz and Cannon (2007), and Percival and others (2012). Seismic-reflection lines labeled A, B, F, and G in eastern Lake Superior; C in western Lake Superior; and H–J in Lakes Michigan and Huron, are from the Great Lakes International Multidisciplinary Program on Crustal Evolution (GLIMPCE). Other seismic-reflection lines are proprietary industry lines (Dickas, 1999). AB, Animikie basin and related cratonic margin rocks of the Penokean orogen; GLTZ, Great Lakes Tectonic Zone; MRV, Minnesota River Valley subprovince; NFZ, Niagara fault zone; W-A, Wawa-Abitibi subprovince.
After more than a century of geoscientific investigation driven by mineral exploration, academic study, and, for a brief time, hydrocarbon exploration, a complete understanding of the Midcontinent Rift System beneath Lake Superior is still emerging. Extensive cover overlying the Midcontinent Rift System limits outcrops, and thus workers have commonly used geophysical methods to investigate the nature and extent of the rift. Most of the gravity, seismic-reflection, and seismic-refraction data for the Lake Superior region were collected prior to 1990 (Hinze and others, 1997). Gravity and aeromagnetic data acquired prior to 2000 were compiled for the Lake Superior region in digital form by Anderson and Grauch (2018). More recently, aeromagnetic, electromagnetic, and passive seismic data were collected in the surrounding area (Shen and others, 2013; Bedrosian, 2016; Pollitz and Mooney, 2016; Zhang and others, 2016; Bedrosian, 2019; Drenth and others, 2021).
Seismic-reflection data collected by industry and by the Great Lakes International Multidisciplinary Program on Crustal Evolution (GLIMPCE) in the late 1980s (fig. 1) remain some of the most important data for understanding the Midcontinent Rift System beneath Lake Superior. Many previous workers have used the seismic-reflection time-sections as a constraint on gravity modeling to investigate the nature of the Midcontinent Rift System (fig. 2; Hinze and others, 1990; Hutchinson and others, 1990; Allen, 1994; Mariano and Hinze, 1994; Sexton and Henson, 1994; Allen and others, 1997; Stein and others, 2015). To use seismic-reflection time sections as constraints, these workers first interpreted geologic units from the reflection geometry or seismic stratigraphy of a seismic-reflection time section. Depths to the interpreted geologic contacts were estimated from two-way travel time combined with simple assumptions about the velocities of the rocks. Densities typical of measured values for each geologic unit were then appropriately assigned to construct a gravity model. In a related approach, Tréhu and others (1991) and Shay and Tréhu (1993) used geometries interpreted from the seismic-reflection profiles to constrain their refraction velocity model. Velocities from the model were then considered to represent velocities of the geologic unit that was interpreted from the reflection section. Densities for an accompanying gravity model were assigned independently for each of the interpreted geologic units using typical measured values.
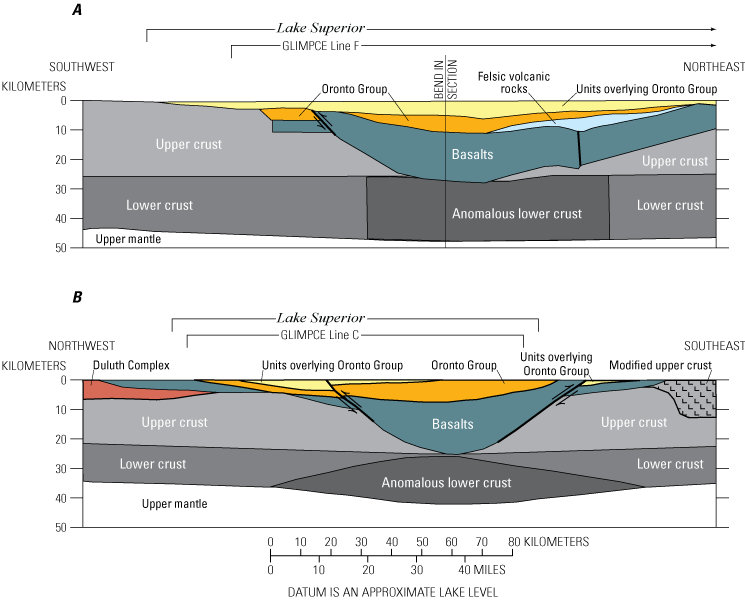
Profile models of the Midcontinent Rift System across Lake Superior illustrating rift basins filled with basalt from the Keweenawan Supergroup overlain by thick clastic sedimentary sections (Oronto Group and overlying units). The cross-sections were developed from two-dimensional gravity modeling constrained by interpreted seismic-reflection profiles, aeromagnetic data, and mapped geology. A, Profile model following Great Lakes International Multidisciplinary Program on Crustal Evolution (GLIMPCE) Line F in the eastern side of the lake (fig. 1) is modified from Mariano and Hinze (1994). Note the bend in the section. B, Profile model following GLIMPCE Line C in the western side of the lake (fig. 1) is modified from Hinze and others (1992). The area labeled “modified upper crust” is a region that is denser than the surrounding crust, presumably representing deformed rocks.
The interpretations and models previously derived from seismic-reflection profiles differ from those developed from earlier seismic refraction work, where geologic interpretation was based primarily on velocity findings (Smith and others, 1966; Steinhart and Smith, 1966; Halls and West, 1971; Ocola and Meyer, 1973; Luetgert and Meyer, 1982). A significant difference involves the interpretation of gabbro versus basalt. Authors of these earlier studies considered high-refraction velocities of 6.4–7.1 kilometers per second (km/s) versus more moderate velocities of 4.7–6.2 km/s as indications of gabbro versus basalt, respectively. In contrast, velocities for intervals interpreted as basalt of the Keweenawan Supergroup from the seismic-reflection profiles are commonly chosen between 6.3 and 6.5 km/s (Hinze and others, 1990; Hutchinson and others, 1990; Allen, 1994), a velocity range closer to that of gabbro according to the earlier refraction studies. In early interpretations of GLIMPCE lines (fig. 1), Green and others (1989) and Cannon and others (1989) linked the high velocities from the earlier refraction studies (as high as 6.9 km/s) with intervals interpreted as basalt. Shay and Tréhu (1993) considered intervals with refraction velocities ranging from 5.2 to 7.2 km/s to be basalt of the Keweenawan Supergroup. This scope spans both basalt and gabbro velocity ranges from the earlier studies.
Another difference between the two previous approaches involves how densities were determined for gravity modeling. In the approach based on the interpretation of the seismic-reflection profiles, densities were chosen separately for each interpreted geologic unit based on typical measured values. In the approach focused on interpreting velocity ranges from refraction results, densities were computed from measured refraction velocities using linear equations relating velocity to density (Smith and others, 1966; Steinhart and Smith, 1966; Luetgert and Meyer, 1982) or a combination of linear equation and empirical relations from the literature (Ocola and Meyer, 1973). The equations were obtained by solving for velocity-density relations that satisfy both observed first-arrival times and gravity models from the Lake Superior studies and were commonly applied similarly for all rock types.
The present study was motivated by a desire to reconcile the differences between the previous works and to gain a sound understanding of how to handle velocity and density in geophysical modeling and interpretation of the Midcontinent Rift System in the Lake Superior region. This study’s strategy is to synthesize existing velocity and density information, investigate observed velocity-density relations, and organize the information into a form that can be easily used for geologic interpretation of geophysical models. To investigate velocity-density relations, various established correlations from the literature are inspected to find which provide the most accurate fit to the empirical relations observed for each geologic unit or rock suite related to modeling of the Midcontinent Rift System (fig. 2). Where measurements from the Lake Superior region are unavailable, data for similar rock types from other regions are used as a guide. The results are presented in a summary illustration, which provides a way to easily understand how velocity and density differ between the rock suites.
Geologic Setting
The 1.1 Ga Midcontinent Rift System is characterized by voluminous, basaltic magmatism driven by a mantle plume, followed by thick accumulations of sediments (fig. 2; Van Schmus and Hinze, 1985; Hinze and others, 1997; Ojakangas and others, 2001a). Despite extensive magmatism, similar to that commonly associated with continental breakup, complete separation of the continental crust was never achieved. Instead, as magmatism waned, the rift transitioned to a sedimentary regime, with clastic sedimentation attributed to post-rifting thermal subsidence. Faulting within a compressional regime heralded by the Grenville orogeny to the southeast (in current coordinates) created the geometry of the rift still preserved today (Cannon, 1994). Only minor tectonic activity, marine incursions, glaciation, and erosion have followed in the subsequent 1 billion years (Huber, 1975).
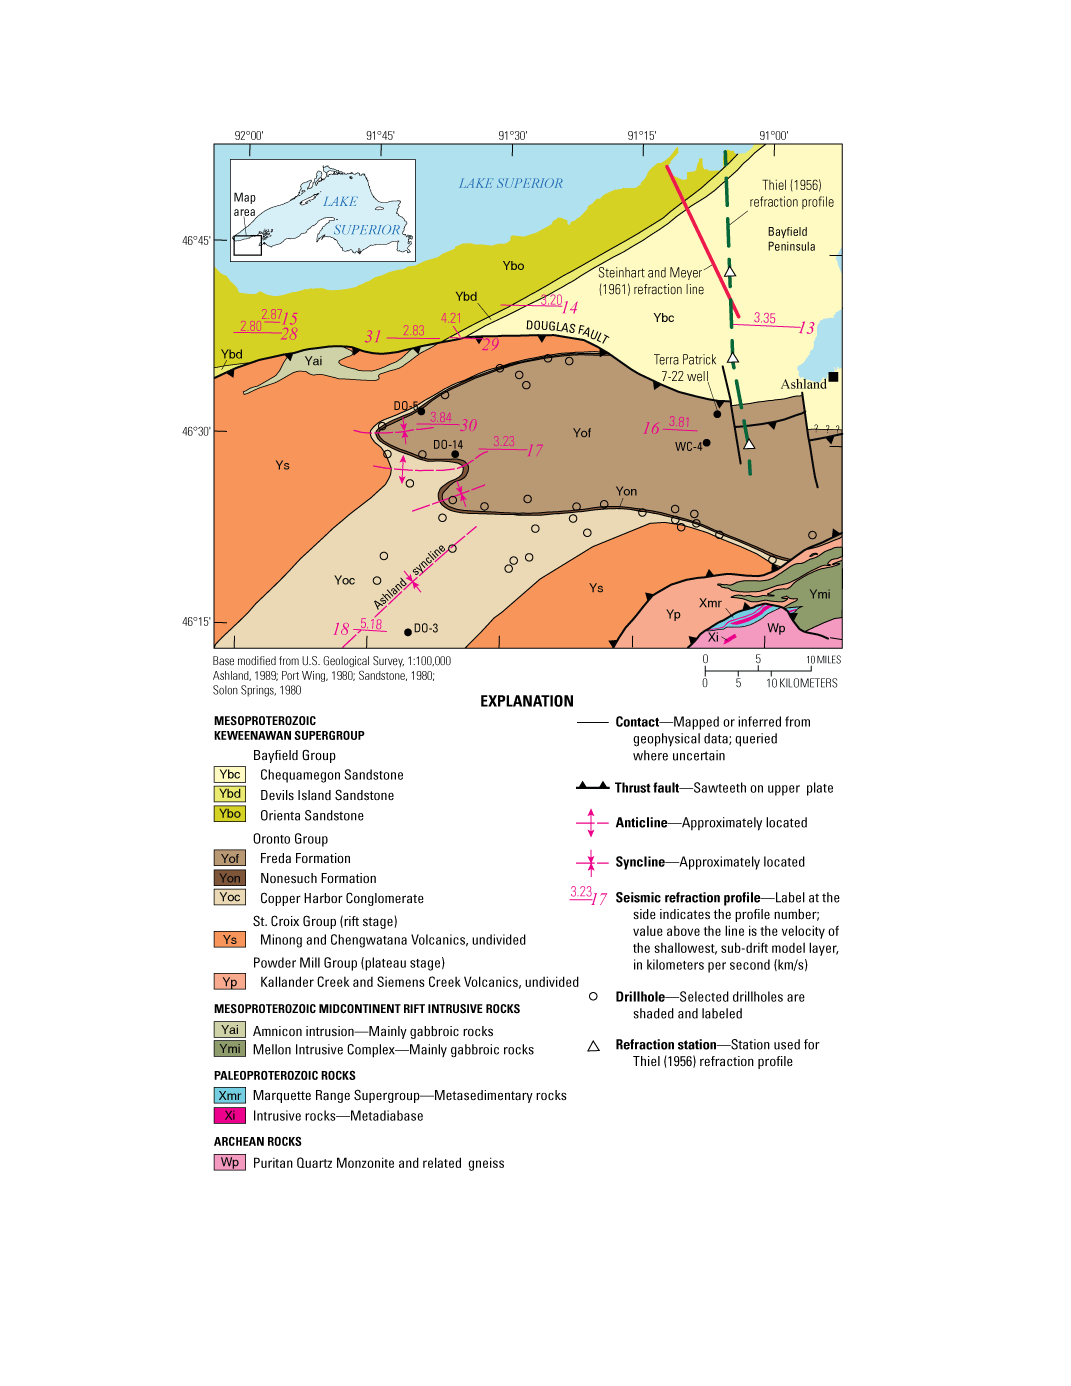
Figure 3 shows a generalized bedrock geologic map of the study area. The following descriptions focus on lithostratigraphy of major units, their thicknesses or volume within the crust, and their geographic distribution. The purpose is to provide the reader with an idea of what rock types are likely to be hidden in the subsurface and how rock suites were correlated for this study rather than a discussion of geologic history.
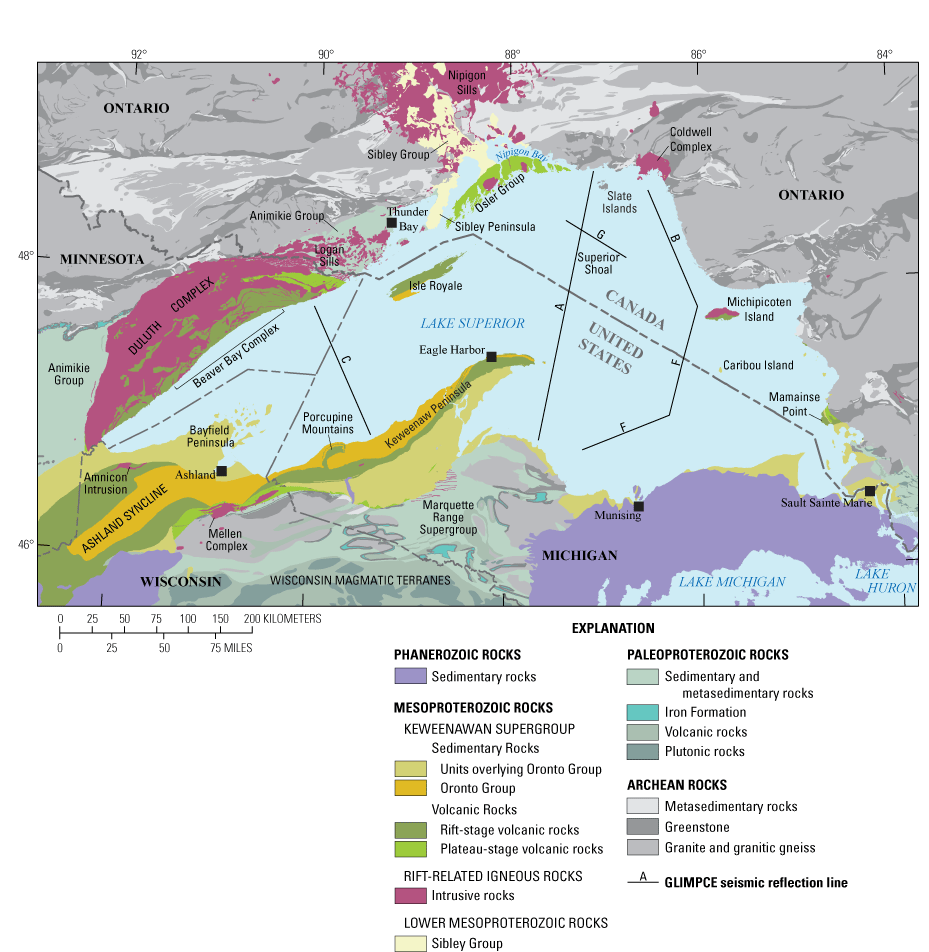
Bedrock geology of the study area. Generalized units are from E. Anderson, who derived them from a digital compilation of published geologic maps (C. Dicken, U.S. Geological Survey, written commun., 2018). Seismic-reflection lines labeled A–C and F–G are from the Great Lakes International Multidisciplinary Program on Crustal Evolution (GLIMPCE).
Archean Crust
The Lake Superior region is largely underlain by Archean rocks of the Superior Province, except in the Penokean orogen in Michigan and Wisconsin and in areas where the crust was intruded by magma of the Midcontinent Rift System (fig. 1). The Superior Province is divided into subprovinces based on distinctive rock types and tectonic setting (Card, 1990; Percival and others, 2012). Located in the Lake Superior region are the Wawa-Abitibi, Minnesota River Valley, Quetico, and Wabigoon subprovinces (fig. 1).
The Wawa-Abitibi subprovince in Ontario, Canada, and northern Minnesota is a granite-greenstone terrane, comprising several distinct greenstone belts contained within a widespread region of metamorphosed granitic plutonic rocks (Williams and others, 1991; Jirsa and others, 2012). The granitic rocks range in composition from metamorphosed tonalite to granodiorite, are foliated to gneissic, and are commonly intruded by more potassic, granitoid rocks. The greenstone belts are composed of metamorphosed volcanic packages and associated metasedimentary rocks.
North of the Great Lakes tectonic zone in Michigan (fig. 1), Archean granitic rocks containing greenstone belts are correlated to the Wawa-Abitibi subprovince in Ontario (Sims and Day, 1993; Southwick, 1996; Bickford and others, 2007). Between the Niagara fault and the Great Lakes tectonic zone, exposures of Archean granitic gneiss are characteristic of the Minnesota River Valley subprovince (Sims and Day, 1993; Sims, 1996). The principal part of the Minnesota River Valley subprovince is located outside of the study area in southwestern Minnesota (Sims, 1996; Jirsa and others, 2012).
The Quetico subprovince in Ontario and northern Minnesota is predominantly metasedimentary. In Ontario, the major rock type is feldspathic metagraywacke, with lesser volumes of metamorphosed iron formation, conglomerate, and ultramafic graywacke and siltstone (Williams, 1991). In northern Minnesota, graywacke metamorphosed to biotite-plagioclase schist is accompanied by granitoid intrusions and migmatite (Jirsa and others, 2012).
The Wabigoon subprovince, divided in the study area into the Winnipeg River and Marmion terranes by Percival and others (2012) on the basis of age, consists mainly of tonalitic gneiss interspersed with greenstone belts. Rock types are similar to those of the Wawa-Abitibi subprovince.
Paleoproterozoic Rocks
The Niagara fault zone (labeled “NFZ” in fig. 1) represents the north-verging collision zone at the southern margin of the Superior Province that developed during the Paleoproterozoic Penokean orogeny (Sims and Schulz, 1996; Schulz and Cannon, 2007). The fault zone divides the Wisconsin magmatic terranes on the south from a domain of deformed Paleoproterozoic supracrustal rocks overlying Archean crust to the north (fig. 1, Schulz and Cannon, 2007; Drenth and others, 2021). Within the study area, the Wisconsin magmatic terranes consist mainly of volcanic and plutonic rocks of oceanic island arc affinity (Sims and Schulz, 1996; Schulz and Cannon, 2007). Rocks north of the Niagara fault zone record multiple episodes of sedimentary deposition and deformation that reflect an active continental margin tectonic regime (Schulz and Cannon, 2007; Craddock and others, 2013; Cannon and others, 2018, 2019; Drenth and others, 2021). The section includes graywackes, shales, argillites, quartzites, dolomite, iron formations, and lesser volumes of volcanic and intrusive rocks (Ojakangas and others, 2001b, Schulz and Cannon, 2007). Although the banded iron formations, for which the Lake Superior region is famous, cover a wide region (fig. 3), they are volumetrically small compared to the other Paleoproterozoic rocks.
Thick successions of unmetamorphosed to metamorphosed sandstones, graywackes, and shales form the upper part and greatest volume of the Paleoproterozoic sedimentary section (Morey, 1996; Ojakangas and others, 2001b; Schulz and Cannon, 2007; Craddock and others, 2013). These rocks include the Animikie Group (which is preserved southwest and northeast of the Duluth Complex in Minnesota and Ontario) and metasedimentary rocks in the Marquette Range Supergroup in Michigan and Wisconsin (fig. 3; Schulz and Cannon, 2007). These rocks were once part of the same Penokean basin system that extended over a large region that includes present-day Lake Superior (Schulz and Cannon, 2007; Craddock and others, 2013).
Several episodes of post-Penokean collisional events affected the region before the onset of magmatism related to the Midcontinent Rift System (Schulz and Cannon, 2007; Drenth and others, 2021). Both Archean and Paleoproterozoic rocks were metamorphosed and faulted.
Mesoproterozoic Sibley Group
The lower Mesoproterozoic Sibley Group is a roughly 1-km thick package of mainly siliciclastic sedimentary rocks exposed in the Nipigon region in the northern part of the study area (figs. 1, 3). Only about 300 meters (m) of the basal Sibley Group is preserved on land; a much thicker upper portion was discovered through drilling in Nipigon Bay (fig. 3; Rogala and others, 2007). The lower half of the section is dominated by fine-grained clastic rocks deposited in lacustrine and fluvial environments, whereas the upper half is dominated by sandstone deposited in eolian and fluvial environments (Rogala and others, 2007). Carbonate units are present near the base but compose only a small percentage of the section.
The Sibley Group has a small exposed footprint and is largely confined by faults or hidden by water. Its original extent is unknown, but evidence of a significant change in provenance and depositional environment in the middle of the stratigraphic section implies that these rocks have greater tectonic importance than previously realized (Rogala and others, 2007). Moreover, recent seismic interpretation indicating a sedimentary basin intruded by sills in northern Lake Superior (Grauch and others, 2020) opens the possibility that a greater thickness of the Sibley Group, possibly overlying Paleoproterozoic sedimentary rocks, is preserved under the lake.
Keweenawan Supergroup and Related Igneous Rocks
The Keweenawan Supergroup refers to layered volcanic and sedimentary rocks that formed as part of the 1.1 Ga Midcontinent Rift System and lie unconformably over much older Proterozoic and Archean rocks (fig. 4). Following the terminology adopted by Woodruff and others (2020), the history of the Midcontinent Rift System can be visualized as five transitional stages: initial widespread, plateau-stage eruptions over basal sandstones; voluminous basaltic magmatism of the rift stage; a transition between magmatism and clastic sedimentation of the late stage; thick accumulations of sediments of the post-rift stage of thermal subsidence; and a final transition to a compressional stage as sedimentation waned (Cannon and Hinze, 1992; Hinze and others, 1997; Ojakangas and others, 2001a; Woodruff and others, 2020). Ojakangas and others (2001a) consider the basal sandstones and quartzites as a record of the initiation of rifting, but they are relatively thin (roughly 100 m) across the region, so they are not considered further in this study.
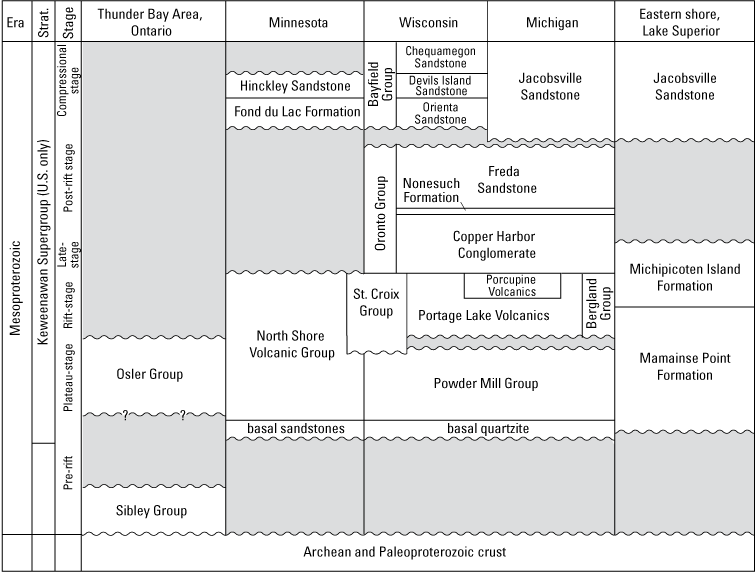
Correlation chart for geologic units of interest in the Lake Superior region. Cannon and Nicholson (1992 and 1996) consider the Keweenawan Supergroup to include all the Mesoproterozoic units shown except the Sibley Group. Modified from Dickas (1986), Cannon and Nicholson (1996), Ojakangas and others (2001a), Nicholson and others (2006), and L. Woodruff (USGS, written commun., 2021). Addition of Sibley Group from Rogala and others (2007). Recent dating by Hodgin and others (2022) suggest that deposition of the Jacobsville Sandstone continued into the Neoproterozoic era. The stages are terms used for the evolution of the Midcontinent Rift System by Woodruff and others (2020). Strat., stratigraphic name.
Igneous Rocks
The earliest plateau stage of volcanism was characterized by subaerial basalts that erupted in overlapping flows from widely distributed fissures and low-angle shield volcanoes, resulting in a broad volcanic plateau as much as 7 km thick (Green, 1983). These rocks are preserved in narrow areas surrounding Lake Superior, including local occurrences near the western tip of the lake at the edge of the Duluth Complex, near the northern shore at the Slate Islands, and on the far eastern shore at Mamainse Point (fig. 3). The plateau-stage volcanic rocks are mainly tholeiitic basalt and basaltic andesite, with minor intermediate-composition rocks, rhyolite, and interflow clastic sedimentary rocks (Green, 1989; Lightfoot and others, 1991; Nicholson and others, 1997).
Rift-stage magmatism (fig. 4) was characterized by voluminous, subaerial basalt flows that accumulated over the plateau-stage basalts within rapidly subsiding basins concentrated in present-day Lake Superior (fig. 2; White, 1960; Green, 1982; Allen and others, 1997). Extrusive rocks of this stage constitute the largest percentage of the basalt section underlying Lake Superior. Rift-stage volcanic rocks are mainly tholeiitic and basaltic andesite. Interflow conglomerates and sandstones are relatively rare but can be traced laterally for tens of kilometers as units tens of meters thick (Butler and Burbank, 1929; Merk and Jirsa, 1982). Significant accumulations of intermediate-composition and felsic flows were erupted locally, including the Porcupine Volcanics in Michigan (fig. 4; Hubbard, 1975; Cannon and others, 1995) and locally abundant rhyolite and icelandite flows within the North Shore Volcanic Group (Green and Fitz, 1993).
Magmatism waned significantly as sedimentation increased during the late rift stage (Woodruff and others, 2020). Volcanism was local, evidenced in the western lake by thin tholeiitic basalts that compose the uppermost sequence of the North Shore Volcanic Group (Miller and others, 2001; Green, 2002) and basaltic andesite to andesite flows that are interspersed with clastic rocks in several places along the northern shore of the Keweenaw Peninsula and in the Porcupine Mountains (Hubbard, 1975; Cannon and others, 1995; Cannon and Nicholson, 2001). In the eastern lake, late felsic volcanic rocks are found locally at Michipicoten Island as part of the Michipicoten Island Formation (Annells, 1974) and inferred nearby from geophysical modeling (Mariano and Hinze, 1994). Rhyolite was encountered in the St. Amour borehole near Munising, Michigan (Ojakangas and Dickas, 2002).
Mafic and ultramafic intrusions associated with both plateau- and rift-stage volcanism are exposed throughout the Lake Superior region (fig. 3). The largest of these are the Coldwell Complex at the northeastern lake shore in Ontario and the Duluth Complex and related rocks in Minnesota. The Coldwell Complex is a series of superimposed, ring-like alkalic intrusive centers composed mainly of gabbroic and syenitic rocks (Sage, 1991; MacTavish and others, 2019). The complex and nearby much smaller ultra-mafic and carbonatite intrusions are located on a north-south structural trend that has been interpreted to extend southward into the lake (Sage, 1991). The bulk of the Duluth Complex consists of layered gabbroic, troctolitic, and anorthositic intrusions and granophyre (Miller and Severson, 2002). The complex overlies rocks of the Archean Superior Province and Paleoproterozoic Animikie Group and underlies related rocks of the North Shore Volcanic Group (Weiblen, 1982; Peterson and Severson, 2002). The Duluth Complex is estimated to be as much as 13–28 km thick from geophysical modeling (Allen and others, 1997; Chandler and Jirsa, 2021; Peterson and others, 2021). Several satellite bodies of tholeiitic diabase to granophyre, as well as gabbroic to dioritic rocks of the slightly younger Beaver Bay Complex, are related to the Duluth Complex (Miller and Green, 2002). The Beaver Bay Complex consists of multiple magma conduits that fed voluminous lava outpourings (Miller and Chandler, 1997).
Other mafic intrusions are the Mellen Complex and Amnicon intrusion located on either side of the Ashland syncline in Wisconsin (fig. 3). The Mellen Complex consists of gabbroic intrusions (some of which are layered) and less extensive granitic rocks (Weiblen, 1982; Cannon and others, 1996). Layered parts of the complex are 4.5–6 km thick (Weiblen, 1982). The Amnicon intrusion consists of gabbroic and granophyric intrusive rocks (Nicholson and others, 2006). Small mafic to ultramafic intrusions, not apparent on figure 3, are scattered throughout the Lake Superior region (Green, 1982; Weiblen, 1982). Some are only known from drilling or are inferred from geophysics (Cannon and Nicholson, 2001; Nicholson and others, 2006).
Numerous mafic to ultramafic sills are mapped over wide areas in the Nipigon region (Nipigon sills) and from Thunder Bay southwest to the Duluth Complex (Logan sills; fig. 3). Although they cover a wide map area, most of the sills are little more than 250 m at maximum thickness (Miller and others, 2001; Hart and MacDonald, 2007; Hollings and others, 2007). The sills are generally flat-lying and were emplaced along stratigraphic layers of preexisting sedimentary basins during plateau-stage volcanism (Hart and MacDonald, 2007; Hollings and others, 2010). Diabase dikes are also abundant surrounding Lake Superior, but they are not depicted on figure 3 except near the contact between post-Oronto Group and Paleoproterozoic rocks in Michigan. Dikes tend to occur in swarms and commonly occur in cross-cutting relations representing several episodes of emplacement (Weiblen, 1982; Green and others, 1987).
The abundance of outcrops of mafic igneous rocks in the Lake Superior region in various forms of emplacement provides ample evidence of the voluminous magmatism associated with the Midcontinent Rift System. Hutchinson and others (1990) used the GLIMPCE seismic lines to estimate that 854,000 cubic kilometers (km3) of basalt underlie Lake Superior. They also argued that magmatic underplating left a large volume of mafic intrusive rock preserved near the base of the crust.
Sedimentary Rocks
The transition from voluminous magmatism to widespread sedimentation was gradual (White, 1972). Thick accumulations of immature, predominantly redbed sediments of the Oronto Group were laid down early in the post-rift stage, followed by deposition of distinctly more mature sediments dominated by sandstones during the later post-rift stage and extending into the compressional stage (fig. 4; White, 1966a; Dickas, 1986; Ojakangas and others, 2001a; Woodruff and others, 2020). The Oronto Group comprises the Copper Harbor Conglomerate, Nonesuch Formation, and Freda Sandstone. The Oronto Group records a generally upward increase in sedimentary maturity within fluctuating environments of alluvial-fan, lacustrine, and fluvial deposition (Daniels, 1982; Dickas, 1986). A maximum thickness of 5–6 km is documented onshore from outcrop and drillholes (White, 1966a; Daniels, 1982; Dickas, 1986); a maximum thickness of 9 km is estimated from interpretation of seismic reflection sections in the lake (Allen and others, 1997; Ojakangas and others, 2001a).
The oldest formation of the Oronto Group, the Copper Harbor Conglomerate, is a fining-upward sequence of pebble to boulder conglomerates and medium- to coarse-grained sandstones with a maximum thickness observed in outcrop of approximately 2 km (Daniels, 1982). The formation also fines toward the center of the lake from both the north and the south, suggesting that most of the Copper Harbor Conglomerate in the deepest part of the Lake Superior basin is composed of fine-grained sandstone (White, 1966a; Halls, 1969; Huber, 1975). Composition varies with grain size, although fragments of mafic volcanic rocks consistently represent the largest component, with smaller proportions of quartz and feldspars (Daniels, 1982).
The Nonesuch Formation of the Oronto Group is composed of fine-grained, organic-rich sedimentary rocks that were widely deposited within a lacustrine or marine environment (Daniels, 1982; Dickas, 1986; Suszek, 1997; Stewart and Mauk, 2017). It represents a chronostratigraphic marker within the Oronto Group, but with an average thickness of 180 m (Daniels, 1982), it makes up less than 4 percent of the thickness of the entire Oronto Group section. This relatively minor, although unique, interval within the much thicker clastic sedimentary section of the Oronto Group is a negligible factor for geophysical modeling at basin-wide scales.
The Freda Sandstone, the youngest formation of the Oronto Group, is also the thickest, reaching more than 3.6 km estimated from outcrop (Daniels, 1982; Ojakangas and others, 2001a). It is a generally fining-upward sequence of immature shales, siltstones, and sandstones. Sandstones are generally very fine grained. More than 10 percent of the formation is siltstone, despite the formation name. Clasts are dominantly intermediate volcanic rock fragments and quartz; the matrix is dominantly clay (Daniels, 1982). The Solor Church Formation in southeastern Minnesota has been correlated to the Freda Sandstone and Nonesuch Formation (Morey, 1977; Dickas, 1986), but is outside the study area.
Units overlying the Oronto Group are composed mainly of sandstone and are distinguished from the Oronto Group by their increased maturity. Several formations of this age and similar lithology occur across the Lake Superior region (fig. 4), including the Bayfield Group in northwestern Wisconsin, Jacobsville Sandstone in Michigan and on islands of the eastern lake in Ontario, and the Hinckley Sandstone and Fond du Lac Formation in Minnesota. The Bayfield Group has an estimated maximum thickness of 1–2 km (White, 1966a; Dickas, 1986; Allen and others, 1997) and is divided into three formations (fig. 4). The Orienta Sandstone and Chequamegon Sandstone and the Orienta-equivalent Fond du Lac formation are litho-feldspathic fluvial sandstone-siltstone-shale units composed predominantly of quartz (Dickas, 1986; Ojakangas and others, 2001a). The relatively thin intervening Devils Island and equivalent Hinckley Sandstone are quartz sandstone, possibly representing a more eolian environment (Ojakangas and others, 2001a).
The Jacobsville Sandstone is a sequence of fluvial feldspathic and quartzose sandstones, conglomerates, siltstones, and shales (Kalliokoski, 1982). It reaches more than 1 km in thickness in boreholes and is estimated from geophysics to be as thick as 3 km adjacent to the Keweenaw fault, which runs the length of the Keweenaw Peninsula and into Wisconsin (fig. 3; Bacon, 1966; Kalliokoski, 1982). Most workers agree that the Jacobsville Sandstone is time equivalent to the Bayfield Group (fig. 4). Baumann and others (2016) more specifically correlated the Orienta, Devils Island, and Chequamegon Sandstones to specific intervals within the Jacobsville Sandstone, proposing that Jacobsville Sandstone be elevated to Jacobsville Group.
From considerations of physical-property measurements, the Keweenawan sedimentary section can be divided into three groups (Halls, 1969): argillaceous Oronto Group, arenaceous Oronto Group, and undivided units overlying the Oronto Group. The argillaceous Oronto Group includes rocks of the Nonesuch Formation, which is dominated by siltstone and mudstone, and rocks of the Freda Sandstone that have a significant quantity of clay and silt incorporated with fine-grained sandstone. The arenaceous Oronto Group includes dominantly fine- to coarse-grained sandstone of the Freda Sandstone and Copper Harbor Conglomerate. The undivided units overlying the Oronto Group include Bayfield Group, Jacobsville Sandstone, Hinckley Sandstone, and Fond du Lac Formation, which are all mainly composed of sandstone. Although Halls (1969) divides the units overlying the Oronto Group according to degree of induration, the author describes rocks of the Bayfield Group and Jacobsville Sandstone as generally “rather friable, medium-grained quartzose to feldspathic sandstone” throughout the Lake Superior region, suggesting that the well-cemented samples are not representative.
Phanerozoic Rocks
Cambrian and Ordovician sedimentary rocks overlie the older rocks of interest for modeling of the Midcontinent Rift System in the eastern Upper Peninsula of Michigan (fig. 1 and fig. 3). About 200 m of these Paleozoic rocks were encountered in two boreholes near Munising, Michigan (Ojakangas and Dickas, 2002); the rocks consist of Ordovician sandy dolomite overlying friable Cambrian quartz arenite. No bedrock younger than Proterozoic has been found within the lake (Johnson, 1980). Examination of the sources of till in sediment cores suggests that bedrock underlying Lake Superior is mainly composed of Mesoproterozoic Jacobsville Sandstone and Bayfield Group (Dell, 1975; Wold and others, 1982).
Pleistocene and Holocene surficial deposits cover most of the Lake Superior region. These deposits are typically less than 60 m thick onshore, but are more than 100 m thick in many areas of Lake Superior and reach more than 500 m thickness adjacent to the northwestern shore (Wold and others, 1982; Soller, 1998; Soller and others, 2012). Onshore deposits consist mainly of sandy glacial till except on the Bayfield Peninsula, Wisconsin, and in the area of the Ashland syncline (fig. 3), where stratified coarse-grained deposits predominate (Soller, 1992). Lake Superior sediments are characterized by sandy or clayey tills overlain by as much as 30–60 m of glaciolacustrine and postglacial sediments, which vary from interbedded sand, silt, and clay to mostly clay (Lineback and others, 1979; Wold and others, 1982). The tills fill the deep troughs. The deepest troughs (more than 200 m) extend from the north side of Isle Royale all along the north shore of Minnesota (Johnson, 1980; Wold and others, 1982).
Velocity, Density, and their Relations
Compressional-wave (or P-wave) seismic velocity and bulk density are physical properties of Earth materials that underpin principles of seismic and gravity methods, respectively. Compressional-wave velocity (hereafter called velocity) is the speed at which a seismic wave propagates in a series of compressional motions through a rock. Bulk density (hereafter called density) is the mass-per-unit volume of rock, including pore spaces filled with air or fluid. Seismic refraction studies measure how velocity changes across interfaces in the subsurface and use velocity to interpret geology. Seismic reflection studies develop a picture of these interfaces as a function of two-way travel time and use velocity to convert the time sections to depth. Gravity models commonly use polygonal shapes of different densities to represent geologic units. In all cases, knowledge of the physical properties that are characteristic of rock units of interest is required to arrive at a final interpretation of geology as a function of depth.
Both velocity and density of rocks vary as a function of mineralogy, degree of induration, porosity, temperature, degree of fracturing, and compaction (Schön, 2015a, b), which in turn vary as a function of depth of burial. For porous rocks, such as sedimentary rocks, variations in density with depth are primarily a function of decreasing porosity due to compaction. Variations in velocity are affected by porosity as well as the presence of microcracks. Both the effects of porosity and microcracks are minimized with increasing depth and fluid saturation (Mavko and others, 2020). For nonporous rocks, such as most igneous and metamorphic rocks, variations in density and velocity at depth are primarily a function of mineralogy and the amount of fracturing that has occurred (Schön, 2015a, b).
Velocity and several related seismic attributes are a function of density (Schön, 2015b; Mavko and others, 2020), so velocity and density are correlated. Seismic refraction studies commonly rely on gravity models to demonstrate the reliability of their velocity models (Christensen and Mooney, 1995). Seismic-reflection time sections can be used as constraints for gravity modeling if velocities can be translated to density. Crustal models commonly include conversions of velocity to density or vice versa to better understand crustal composition (Magistrale and others, 2000; Brocher, 2005; Mooney and Kaban, 2010; Boyd, 2020).
Thus, knowledge of both the velocity and density of geologic units in a study area are important. However, density is commonly measured at surface conditions, whereas most seismic studies investigate velocity at depth. A common solution is to predict density from velocity measurements or vice versa. In a seminal paper, Birch (1961) demonstrated that velocity and density at a given temperature and pressure are linearly related for a given mean atomic weight (known as Birch’s law), which in turn is linked to mineralogy. However, accurate assessment of the mean atomic weight of a large volume of rock is difficult, so velocity-density relations are commonly investigated empirically (Gardner and others, 1974; Christensen and Salisbury, 1975; Mavko and others, 2020) or from models (Christensen and Mooney, 1995; Sowers and Boyd, 2019). Several equations describing velocity-density relations from previous studies have become widely used to predict density from velocity in a variety of settings.
This section focuses on previously established empirical and model-based velocity-density relations that pertain to rock types likely to occupy the subsurface of the Lake Superior region, including clastic sedimentary rocks, basalts, and crystalline crust. Velocity-density equations focused solely on intrusive igneous rocks are not apparent in the literature. Instead, these rock types are scrutinized individually in comparison to velocity-density measurements of similar rock types elsewhere.
Empirical Velocity-Density Relations
Several studies have used large numbers of velocity and density measurements of rocks at various depths to solve for equations that give the best fit between the two variables. Advantages to this approach are that (1) the natural variability of mineralogy and other physical parameters are accommodated, (2) there is no need to separately consider variations of the physical properties with depth, and (3) the relations can be used in similar tectonic terranes where samples have not been collected. The disadvantage is that one empirical curve is commonly used to represent velocity versus density, which implies that velocity and density have a one-to-one correspondence that does not adequately represent the wide scatter of the data.
The most widely used velocity-density relations for sediments and sedimentary rocks are the Nafe-Drake curve (Talwani and others, 1959; Nafe and Drake, 1963; Ludwig and others, 1970) and Gardner’s relation (Gardner and others, 1974). The Nafe-Drake curve was originally presented as a polyline drawn to fit through a plot of a large number of widely scattered, measured velocity-density points from marine sediments and sedimentary rocks. The data were supplemented to include metamorphic and igneous rock types by Ludwig and others (1970). The data and the polyline fit to the data were originally in graphical form, later tabulated by others (for example, Barton, 1986), and more recently characterized by way of two different equations as follows. One equation is by Onizawa and others (2002) for velocities between 3 and 6 km/s. Their equation, recast with density as a function of velocity, is shown as equation 1 and is designated as the Nafe-Drake curve of Onizawa and others.
whereThe other equation is by Brocher (2005) for velocities between 1.5 and 8.5 km/s. It is designated as the Nafe-Drake curve of Brocher and is shown as equation 2.
whereGardner’s relation is based on measurements of rocks in sedimentary basins (Gardner and others, 1974). It is given in equation 3.
whereThis equation is valid for velocities between 1.5 and 6.1 km/s. Castagna and others (1993) refined Gardner’s relation by promoting use of equations based on different lithologic types. The equations for shale and sandstone are applicable to the Lake Superior region. The equation for shale gives density as shown in equation 4.
whereThe equation for sandstone gives density as shown in equation 5.
whereBoth equations are valid for velocities between 1.5 and 5.0 km/s.
Velocity-density relations for oceanic basalts were investigated by Christensen and Salisbury (1975) using a large quantity of dredge and core samples from various sites within ocean basins. In particular, they tested the velocity-density relations from 77 tholeiitic basalt samples obtained from the Deep-Sea Drilling Project (DSDP), which represent the composition of the top 1 km of the igneous oceanic crust. They did not provide the range of velocities for these 77 samples. Equation 6 shows their linear density equation, derived by comparing velocities measured at 100 megapascals (MPa) to saturated bulk density for the DSDP samples.
whereVelocity-density relations for Icelandic basalts differ somewhat from those for the oceanic basalts, which were collected closer to the Mid-Atlantic Ridge. Icelandic basalts were examined by Christensen and Wilkens (1982) from more than a hundred samples of tholeiitic basalt flows and tholeiitic, basaltic to andesitic dikes from 1.9 km of core. They found that a regression equation relating compressional velocity measurements at 100 MPa to saturated bulk density gave equation 7.
whereThis equation is valid for the velocity range of 3.6 to 6.7 km/s. Velocity-density data for these flows and dikes show considerable overlap, so this equation can apply to both basalt and diabase.
The Nafe-Drake curve is commonly used to represent crystalline crust (as well as its sedimentary cover) in conjunction with continent-scale earth models, including some for North America (Magistrale and others, 2000; Musacchio and others, 2004). Brocher (2005) judged the Nafe-Drake curve (eq. 2) as representative of velocity-density relations for continental crust by comparing data from northern California and considered the results to be widely applicable. Barton (1986) discussed the shortcomings of using the Nafe-Drake curve for developing gravity models in general. Maceira and Ammon (2009) used the Nafe-Drake curve of Onizawa and others (eq. 1) to represent sedimentary rocks and sediments of low density. Additionally, Maceira and Ammon (2009) used a form of Birch’s law to represent denser and deeper rocks for input to a joint inversion model of sedimentary basins underlain by Proterozoic and Archean rocks in central Asia.
Velocity-Density Relations from Models
Another approach to developing velocity-density equations is based on models that incorporate laboratory measurements of specific rock types (Christensen and Fountain, 1975; Christensen and Mooney, 1995). Velocity-density equations are developed by examining the data for specific rock types that are considered to represent a particular crustal depth or tectonic setting. Christensen and Mooney (1995) compiled a large set of velocity and density measurements for 29 rock types. These measurements were calibrated to different depths and temperatures; the authors then fit regression curves to the average values of various combinations of these rock types to represent continental crust in different settings. Their linear equation developed for crystalline crust that excludes volcanic and monomineralic rock types and assumes an average crustal heat flow at 10 km depth is the most widely used equation among contemporary geophysicists to represent the velocity and density relations within the crust (Brocher, 2005). It is designated as the global crustal line and is shown as equation 8.
whereThe equation is valid for velocities between 5.5 and 7.5 km/s.
In developing the crustal model LITH05 for the Canadian shield regions, Perry and others (2002) adopted a crustal model of average petrology proposed by Christensen and Mooney (1995) but the model was not reported with an associated equation. Assuming a mixture of five different rock types that varies with depth (fig. 5), Christensen and Mooney (1995) used their laboratory results for each rock type to develop velocity and density curves plotted against depth. Plotting velocity versus density yields a nonlinear velocity-density relation (fig. 5B), which is estimated from a second-order polynomial regression. This regression, shown in equation 9, represents velocity-density relations for a crust of average petrology.
where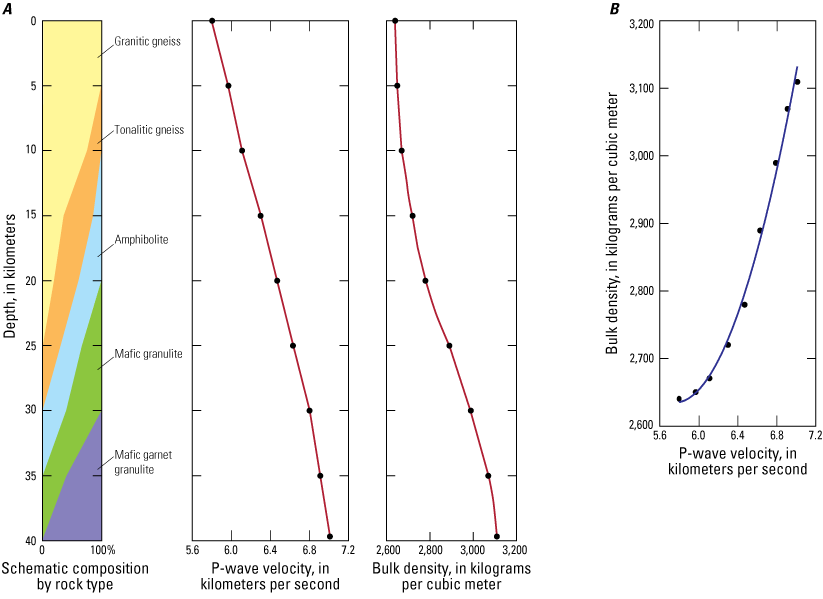
Velocity and density plots for the model of average crustal petrology from Christensen and Mooney (1995). A shows their model of gradually changing composition using five common rock types and corresponding plots of velocity and density from laboratory measurements for the mixture of these rock types versus depth. Solid circles result from summing the appropriate proportions of the averages for each rock type at the depth interval shown, assuming average heat flow. Uncertainties for each average are listed in Christensen and Mooney (1995). In B, velocity versus density is plotted for the data at each depth interval. The solid line shows the least-squares regression to find a second-order polynomial fit to these data (eq. 9).
Velocity-density relations derived from rock-type assumptions have been used in conjunction with other approaches to develop continent-scale or global crustal models. Mooney and Kaban (2010) used the velocity-density equations of Christensen and Mooney (1995) to compute the gravity effects of crystalline crust from velocities compiled from seismic studies. Musacchio and others (2004) used a combination of measured surface densities, Nafe-Drake relations, and a linear equation developed for granulite facies rocks (Christensen and Fountain, 1975) to find the best-fit crustal model for seismic and gravity data in the Superior Province north of Lake Superior. Nitescu and others (2006) used both the Nafe-Drake curve and the linear equation of Christensen and Mooney (1995) for crystalline crust (the global crustal line of eq. 8) to investigate density contrasts predicted by velocity discontinuities found from seismic data in the Superior Province.
An additional approach to investigating density and velocity relations involves using petrophysical modeling to directly calculate the physical properties from presumed mineralogy and estimated pressure-temperature conditions (Tassara, 2006; Sowers and Boyd, 2019; Boyd, 2020). In this approach, mineral assemblages and their physical properties are calculated by rock type at specified pressure and temperature conditions. Sowers and Boyd (2019) used velocities and densities computed from mineral assemblages representing several common rock types at standard temperature and pressure (0 °C and 0.1 MPa) to compare the Nafe-Drake curve of Brocher (eq. 2). They found that their results were consistent with Brocher’s (2005) assessment of the scatter exhibited by field and laboratory measurements about the Nafe-Drake curve. The advantage of both model-based approaches is that physical properties can be predicted at depths where they cannot be measured. The disadvantage is the subjectivity of the models themselves.
Velocity Data
Velocity can be measured from rock samples in the laboratory, sonic logs in boreholes, seismic refraction studies, or travel times in seismic-reflection profiles where depths to geologic contacts are known. Each method provides a different scale of measurement, from a hand sample that may not be representative of an entire geologic unit to refraction velocities that may represent an average of several geologic units.
Velocity data for this study were compiled for the Lake Superior region from previous work. The previous studies are described briefly by method in the following subsections, and velocity values summarized only for sedimentary units. Velocities for igneous and metamorphic rocks are discussed in combination with their densities in the “Velocity-Density Relations for the Lake Superior Region” section.
Laboratory Studies of Seismic Velocity
Velocity is commonly determined in the laboratory by measuring the time it takes an input pulse to travel through a rock core in comparison to the travel time of a similar pulse through a standard medium, such as mercury (Birch, 1960). The temperature and confining pressure—or both—of fluid surrounding the rock core is varied to simulate conditions at depths that are appropriate for understanding seismic surveys of the Earth (Christensen and Mooney, 1995). The reader is referred to the original studies for detailed descriptions of the procedures and measurement uncertainties.
Velocity and density were measured from hand and core samples representing different rock types in the Lake Superior region by Halls (1969), Lippus (1988), and Allen (1994). Halls (1969) included measurements from a wide spectrum of sedimentary and igneous rock types as well as analysis of velocity-density and velocity-porosity relations and velocity variations with depth. The author considered the precision of the velocity measurements for all the rock types analyzed to be on the order of 1 percent for pressures over 100 MPa. Lippus (1988) measured velocities and densities for basalt samples from boreholes located in the northern Keweenaw Peninsula (fig. 3) to investigate variations in velocity and velocity-density relations with stratigraphic position. From hysteresis analysis, the author showed a typical reproducibility error on the order of 0.1 km/s for the lowest pressure (20 MPa) and errors less than 0.01 km/s for the highest pressures (200 and 220 MPa). Allen (1994) measured velocities and densities of core samples from a deep natural gas test well (Minnesota unique well number 207022), which was drilled through a thick section of Keweenawan basalt near the city of Osseo in southeastern Minnesota (Allen and Chandler, 1993). The original velocity and density values plotted by Allen (1994) were not available, so the data are reproduced from digitized figures from the author’s thesis. The samples were measured from the interiors of basalt flows at approximate depths of 300–1,220 m in the borehole. Allen considered the velocities (reported only for a confining pressure of 200 MPa) to represent basalt velocities at depth below Lake Superior (Allen and others, 1997). Velocities and densities for a few samples of mafic igneous rocks from the Lake Superior region were also included in early rock-property studies by Hughes and Maurette (1957) and Birch (1960). As for most of the early studies, details and location information about the rock samples are lacking.
All the laboratory studies that included samples from the Lake Superior region (except the one by Allen, 1994) systematically measured velocities at intervals of increasing confining pressures to simulate conditions at different depths. However, densities were only measured at atmospheric conditions. This practice does not properly sample the relations between the physical properties at greater pressures. The earlier laboratory studies also did not account for changes in sample volume caused by increasing pressure (Christensen and Mooney, 1995). These shortcomings represent a significant problem for measuring porous clastic rocks, which compact with increasing pressure, but the studies’ oversights are not as important for measurements of less porous crystalline rocks (Schön, 2015b). For this reason, velocity measurements of sedimentary rocks are discussed further here, whereas laboratory results for velocity and density of igneous rocks are considered together in the section “Velocity-Density Relations for the Lake Superior Region.”
Plots of velocity versus confining pressure allow for investigations of uncertainty and variability of the data. Such plots for Keweenawan sedimentary rocks from the Halls study (fig. 6) show moderately well-behaved correlations and consistent variations between samples for pressures greater than 100 MPa. The sharp increases and inconsistencies of the data observed for pressures less than 50 MPa are likely caused by experimental problems, which were described by Birch (1960) for the laboratory set-up that Halls (1969) used. Velocity curves for three samples are inconsistent with the other sample curves: sample BJ1 of Jacobsville Sandstone (fig. 6A) and mudstone samples CF22 and CF23 of Freda Sandstone (fig. 6B). An explanation for the problem with sample BJ1 for pressures less than 150 MPa is not obvious from Halls (1969, supplemental data therein), but the pattern suggests that the sample was not saturated before measurement, despite how it was reported. If so, the constant differences between measured values for BJ1 and BJ2 at pressures greater than 150 MPa suggest that the results for sample BJ1 may be valid at these pressures. Both samples BJ1 and BJ2 were collected from Caribou Island, Ontario (fig. 3). A likely explanation for the problems with samples CF22 and CF23 is that they were not saturated before measurement, unlike the other mudstone samples (Halls, 1969, his supplemental data). These samples are not considered in subsequent analysis because they are inconsistent with the velocities for the other mudstone samples even at the highest pressures measured. None of the samples of Copper Harbor Conglomerate were saturated before measurement, but the values show consistent, nearly level values at pressures greater than 100 MPa (fig. 6B).
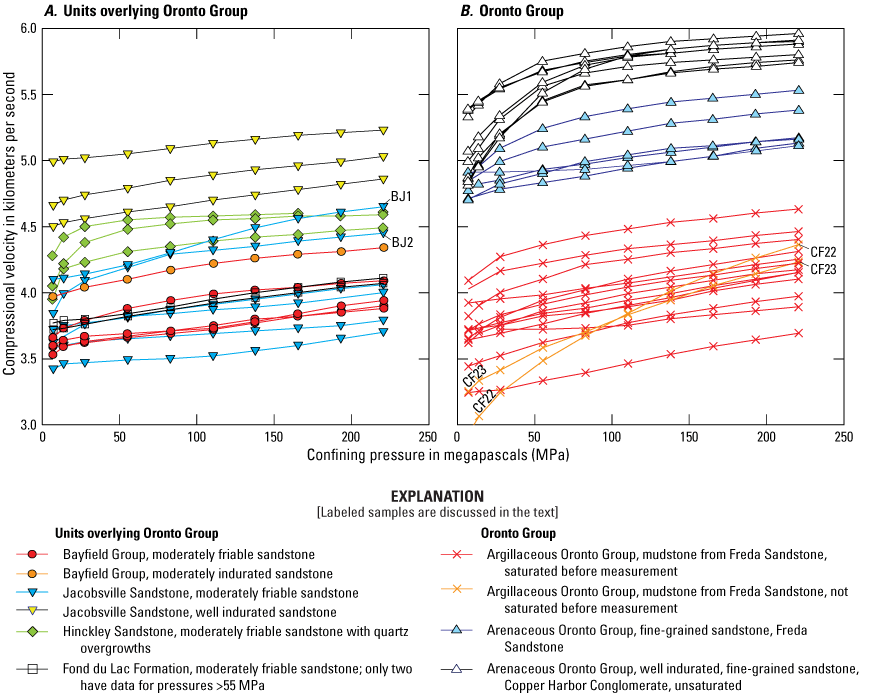
Variation of velocity measured at differing pressures for Keweenawan sedimentary rocks from Halls (1969) for A, units overlying the Oronto Group and B, the Oronto Group. The author considered these pressures to simulate depths of 0.2 to 8.0 kilometers. Little significance should be attached to data for pressures less than 50 megapascals (MPa). Two of the four samples of Fond du Lac Formation do not have data for pressures greater than 55 MPa. Data for samples BJ1 and BJ2 of Jacobsville Sandstone and unsaturated samples CF22 and CF23 of Freda Sandstone are discussed in the text. >, greater than.
Although the data from figure 6 show a wide range in values for all samples, there are general trends that can be distinguished between groups. For the units overlying the Oronto Group (fig. 6A), well indurated Jacobsville Sandstone samples have the highest velocities, moderately friable sandstone samples that do not have quartz overgrowths have the lowest velocities, and samples intermediate between these two types (except for samples BJ1 and BJ2) have velocities in between. For Oronto Group samples (fig. 6B), arenaceous and argillaceous samples show a significant difference in ranges of velocities measured, although the ranges for both groups are large. These relations are revisited in the “Velocity-Density Relations for the Lake Superior Region” section.
Sonic Log from Terra-Patrick 7–22 Borehole
Only a few deep-exploration boreholes (more than 1.5 km total depth) have been drilled in the region covered by figure 1: the Terra-Patrick 7–22 borehole near Ashland, Wisconsin (Dickas and Mudrey, 1999) and the St. Amour and Hickey Creek boreholes near Munising, Michigan (Ojakangas and Dickas, 2002; fig. 3). Sonic logs are available only for the Terra-Patrick borehole from the Wisconsin Geological and Natural History Survey (WGNHS, 2019), which was drilled through 1,425 m of Oronto Group in the Ashland Syncline located about 19 km west of Ashland, Wisconsin (fig. 3). Although numerous shallower boreholes (less than 1.5 km total depth) have been drilled in the region for mineral exploration and development, sonic logs were typically not acquired.
Compressional-wave velocities were measured for the Terra-Patrick 7–22 borehole using both compensated short-spaced and long-spaced sonic tools. Figure 7 shows the sonic log from the long-spaced tool. With transmitter-to-receiver spacings of 2.4, 3.1, and 3.7 m, the long-spaced tool allows for wider investigation of the borehole walls than can be achieved with the short-spaced tool, which uses spacings of 1.0 and 1.5 m (Lindblom, 1999). The sonic-log data are noisy in places, especially where hole rugosity was extreme, as indicated by the abrupt and wide variations in caliper spread (fig. 7).
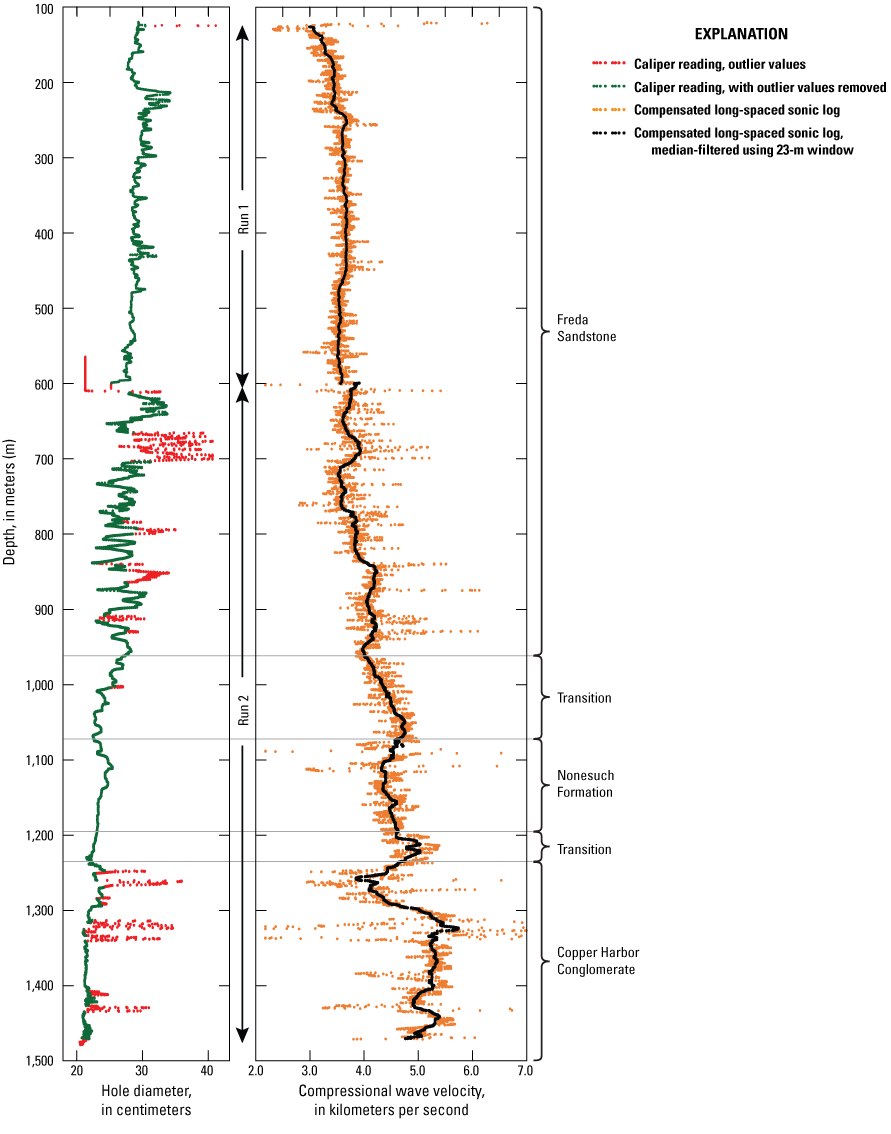
Sonic and caliper logs from the Terra Patrick 7–22 borehole. Data, which were compiled from two sequential runs of the logging tools down the well, are from Wisconsin Geological and Natural History Survey (WGNHS, 2019). Lithologic picks are from Daniels (1999) and WGNHS (2019).
The sonic log was recorded from 600 to 1,500 m depth through Freda Sandstone, Nonesuch Formation, and Copper Harbor Conglomerate, as picked by Daniels (1999). Daniels also identified transition zones between the Nonesuch Formation and the overlying and underlying formations. Although all three formations of the Oronto Group were drilled, the top 2.7 km of Freda Sandstone was missing from the section and the borehole penetrated only 260 m of Copper Harbor Conglomerate, which was estimated to be almost twice this thickness from predrilling seismic interpretations (Dickas and Mudrey, 1999).
A median filter was applied to the noisy log data (fig. 7) before computing statistics for each of the geologic units defined by Daniels (1999; table 1). The data are divided following the lithologic division of arenaceous versus argillaceous Oronto Group described in the “Geologic Setting” section. The Freda Sandstone has velocity values that remain fairly close to 3.60 km/s in the top 600 m of the borehole. Below this, velocity gradually increases, reaching approximately 4.50 km/s for the Nonesuch Formation below 1,000 m. Below depths of 1,200 m, the transitional interval and Copper Harbor Conglomerate show large velocity fluctuations, which are likely an expression of the heterogeneity of grain size in these units when compared with the overlying rocks.
Table 1.
Velocity data summarized from the Terra-Patrick 7–22 sonic log (fig. 7) by geologic unit and lithology.[Picks of the geologic units and their predominant lithologies are from Daniels (1999). Porosities are not provided for all intervals because the data may be unreliable (Lindblom, 1999). Depths are relative to 268 m elevation above mean sea level; 3.96 m above the ground surface. The sonic log spans two runs, which did not measure the whole borehole: one from depths of 0.120 to 0.620 km and the other from 0.607 to 1.471 km (fig. 7). The top of the Freda Sandstone is picked at 0.088 km depth and the hole bottomed in Copper Harbor Conglomerate at 1.514 km. Statistics were computed within the depth intervals indicated from compensated long-spaced sonic log values after outliers were removed and a median filter was applied using a moving window of 23 m. km/s, kilometers per second; km, kilometers; m, meters; %, percent]
Seismic Refraction Studies of Seismic Velocity
Seismic refraction studies examine the arrival times of seismic waves that are refracted at interfaces to determine velocities above and below the interfaces and the depth to the interface. First and second arrivals of refracted waves are recorded by receivers that are located along profiles and separated from shot locations at distances commensurate with depths that are to be investigated. Many seismic refraction surveys have been conducted in the Lake Superior region, reported by Ocola and Meyer (1973) and Perry and others (2002). Several surveys were conducted along long-range profiles extending for hundreds of kilometers, which are best for investigating properties of the crust and mantle. Others used shorter profiles (5–25 km) in comparison to mapped geology to investigate the velocities of rocks within the top 5–15 km of the crust (Thiel, 1956; Steinhart and Meyer, 1961; Mooney and others, 1970a; theses described in Ocola and Meyer, 1973). Some studies used other constraints on the refraction velocities to interpret subsurface geology, such as physical-property information (Halls and West, 1971; Luetgert and Meyer, 1982) or seismic-reflection profiles (Tréhu and others, 1991; Shay and Tréhu, 1993). These multiple studies, conducted over a large span of time using a wide range of technology and a variety of approaches, differ in the uncertainty of their results that is dependent upon details of the study. On the other hand, the largest errors for all the surveys are likely caused by the three-dimensional nature of the subsurface that is difficult to represent using linear refraction profiles.
Several short-range refraction studies conducted in areas where geology is well known provide velocity information about bedrock lying just under cover. In separate studies, Thiel (1956) and Steinhart and Meyer (1961) determined the velocities of Bayfield Group sandstones on the Bayfield Peninsula (fig. 8) from shallow explosions and from examination of short-range recordings from a long-range profile, respectively. Steinhart and Meyer (1961) also examined short-range recordings offshore of the northern tip of the Keweenaw Peninsula (fig. 3), where Copper Harbor Conglomerate dips gently into the lake (Cannon and Nicholson, 2001). Results from the short-range investigations by Steinhart and Meyer (1961) are described in both Halls (1969) and Ocola and Meyer (1973). Ocola and Meyer (1973) also characterized the velocities of geologic units from analysis of several published and unpublished short-range surveys from the Lake Superior region.
Bedrock geologic map of northern Bayfield County, Wisconsin, and Ashland syncline area with borehole locations and information from seismic refraction profiles. Geology compiled from Cannon and others (1996) and Nicholson and others (2006). Short-range seismic refraction profiles (magenta colors) are from Mooney and others (1970b); profiles from Thiel (1956) and Steinhart and Meyer (1961) are labeled separately. See figure 9 for detailed comparisons of selected refraction models from Mooney and others (1970b) to nearby wells. Except for the Terra Patrick 7–22 well (Dickas and Mudrey, 1999), all boreholes were drilled by Bear Creek Mining Company in the 1950s. Cores are stored at Wisconsin Geological and Natural History Survey (WGNHS); drilling information is available from WGNHS (2009).
Mooney and others (1970a, 1970b) provide the most extensive study of short-range refraction profiles to characterize geologic units by velocity, but their geologic correlations require updates before their data can be included in modern velocity compilations. They analyzed 10 profiles in the Lake Superior region (fig. 8) and 23 more to the southwest, tracking the geophysical expression of the Midcontinent Rift. They relied on pre-1970 geologic maps for their analysis and did not have access to exploration cores drilled in the late 1950s within the Ashland syncline (fig. 8), which are now stored at the WGNHS (WGNHS, 2009).
The work contained in Mooney and others (1970a, 1970b) can be updated by comparing the refraction models to the now-available exploration cores and modern geologic maps. The locations of 10 refraction-model profiles in the Lake Superior region from their study and the shallowest sub-drift velocities derived from them are presented with respect to mapped geology on figure 8. Figure 9 compares the velocities of the entire depth range of four of these profile models to the lithologic picks for nearby cores and the Terra-Patrick 7–22 well. As described earlier, the Freda Sandstone in this well is generally argillaceous because of the considerable siltstone content. The Freda Sandstone in cores DO–5 and DO–14 is also mainly argillaceous because of the large proportion of fine material that is incorporated with the sandstone, mostly in the form of flaser bedding and mud drapes (E. Stewart, WGNHS, written commun., 2021). The Copper Harbor Conglomerate in well DO–3 is arenaceous. It is composed of medium- to very coarse-grained sandstone with carbonate cement (E. Stewart, WGNHS, written commun., 2021).
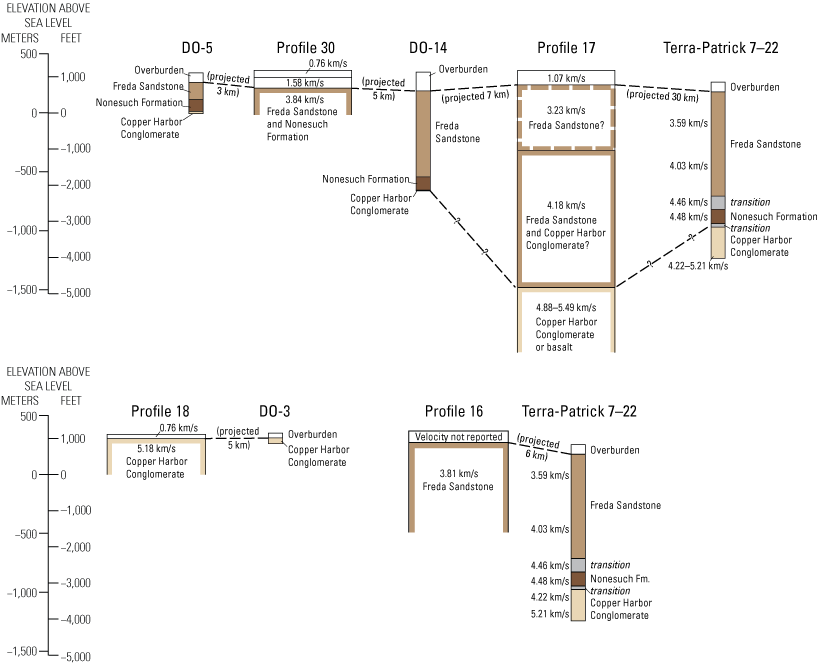
Comparisons of refraction models of Mooney and others (1970a, 1970b) to lithologies in selected wells from figure 8. Lithologies and average velocities for the Terra Patrick 7–22 well are from figure 7, table 1, and Wisconsin Geology and Natural History Survey (WGNHS, 2019). Lithologic picks for other wells are from WGNHS (2009). Projection lines between wells not to scale. km/s, kilometers per second; km, kilometers; Fm., Formation.
Velocities for profiles 16 and 30, previously correlated by Mooney and others (1970b) to the Freda Sandstone, properly match the depths to the top of the Freda Sandstone encountered in nearby cores (fig. 9), but interpretations for profiles 17 and 18 require some revision. The low velocity (3.23 km/s) determined for the top 550 m of bedrock on profile 17 was tentatively interpreted as Orienta Sandstone of the Bayfield Group by Mooney and others (1970b), based on comparisons to low velocities for Orienta Sandstone elsewhere. The location of profile 17 falls in an area of no outcrop inferred as Oronto Group—not Bayfield Group—by White (1966b) and Nicholson and others (2006). If the 3.23 km/s velocity layer corresponds to Freda Sandstone, it is significantly lower than velocities of 3.81–3.84 km/s for profiles 16 and 30 that are well correlated to Freda Sandstone in nearby wells, and also lower than averages of 3.59 and 4.03 km/s found for two intervals of Freda Sandstone in the Terra-Patrick 7–22 well (table 1). A velocity of 3.23 km/s for Freda Sandstone is plausible, however, given the velocities of 3.0–3.5 km/s for this unit at depths shallower than 250 m in the well (fig. 7). Thus, the model for profile 17 below 122 m of overburden could either represent Bayfield Group preserved over folded Freda Sandstone in the core of the Ashland syncline or Freda Sandstone that has lower velocity than expected in the top 550 m. The latter interpretation is preferred because preliminary resistivity images from an airborne electromagnetic survey about 7 km to the northeast, within a deeper part of the Ashland syncline, show a moderately resistive unit overlying a conductive unit at depths of 200–400 m. This relation is consistent with the interpretation of 200–400 m of overburden directly overlying Freda Sandstone (P. Bedrosian, USGS, written commun., 2021).
The high velocity (5.18 km/s) correlated to the Copper Harbor Conglomerate on profile 18 (fig. 9) was previously interpreted to indicate basalt by Mooney and others (1970b). The new correlation is substantiated by Copper Harbor Conglomerate in nearby well DO–3 and the profile’s location within the axis of the Ashland Syncline (fig. 8), where Oronto Group thickens above the basalt. This new velocity interpretation for the Copper Harbor Conglomerate supports the conclusions of Halls (1969), who called attention to overlapping, measured velocity ranges for Copper Harbor Conglomerate and unmetamorphosed basalt flows.
Velocity Data Compiled for Sedimentary Rocks
Velocities are compiled for units overlying the Oronto Group in table 2, divided by formation, if known. Laboratory measurements of velocity for all units overlying the Oronto Group vary widely, which is also demonstrated in the velocity versus pressure plots (fig. 6A). Laboratory measurements for the Bayfield Group are generally higher (more than 3.6 km/s) than those determined from refraction studies (less than 3.6 km/s). The difference does not appear to depend on which formation of the Bayfield Group was sampled (table 2), suggesting that velocities for the Bayfield Group are in the general range of 3–4 km/s but are highly variable. Velocities for the other units overlying the Oronto Group, which are only represented by laboratory measurements, are largely higher than those of the Bayfield Group and are also highly variable. They fall in the general range of 4.0–4.5 km/s, except for well indurated Jacobsville Sandstone, which has a higher range of 4.5–5.0 km/s.
Table 2.
Compressional-wave velocities compiled for units overlying the Oronto Group in the Lake Superior region.[Units overlying the Oronto Group include Bayfield Group, Jacobsville Sandstone, Hinckley Sandstone, and Fond du Lac Formation (fig. 4). Formations sampled from the Bayfield Group for the Halls study were determined by comparing the geologic map of Cannon and others (1996) to sample location descriptions (Halls, 1969). Halls (1969) measurements, reported for confining pressures of 55 MPa and 193 MPa, are from the supplemental data in that report. Samples measured in the laboratory were saturated beforehand unless otherwise noted. Averages were not computed for less than 5 measurements. Computing average values is not applicable for the seismic refraction method. Significant digits of all reported values match those reported in the original data source. Refer to figure 3 for geographic references. km/s, kilometers per second; MPa, megapascals; —, not computed]
| Geologic unit | Average velocity (km/s) | Velocity range (km/s) | Data type | Data source | Comments |
|---|---|---|---|---|---|
| Bayfield Group, Chequamegon and Orienta Sandstones | 3.80 at 55 MPa; 4.00 at 193 MPa |
3.66–4.10 at 55 MPa; 3.85–4.31 at 193 MPa | Laboratory study of 5 samples measured at 55 MPa and 193 MPa | Halls (1969) | 4 samples described as “moderately friable” and 1 as “less friable” from 5 different sites in Wisconsin |
| Jacobsville Sandstone | 3.86 at 55 MPa; 4.09 at 193 MPa |
3.49–4.21 at 55 MPa; 3.65–4.61 at 193 MPa | Laboratory study of 6 samples measured at 55 MPa and 5 samples at 193 MPa | Halls (1969) | Samples described as “moderately friable” collected from 4 sites in Michigan and 1 site on Caribou Island, Ontario |
| Fond du Lac Formation | — | 3.75–4.13 at 55 MPa; 4.04–4.08 at 193 MPa | Laboratory study of 4 samples measured at 55 MPa and 2 samples at 193 MPa | Halls (1969) | Samples described as “moderately friable” collected from 3 sites in Minnesota |
| Hinckley Sandstone | — | 4.31–4.55 at 55 MPa; 4.47–4.58 at 193 MPa | Laboratory study of 3 samples measured at 55 MPa and 2 samples at 193 MPa | Halls (1969) | Samples described as “moderately friable” collected from 3 sites in Minnesota |
| Jacobsville Sandstone | — | 4.61–5.05 at 55 MPa; 4.82–5.21 at 193 MPa | Laboratory study of 3 unsaturated samples measured at 55 MPa and 193 MPa | Halls (1969) | Samples described as “well cemented” collected along the river near Sault Ste. Marie, Ontario |
| Bayfield Group, Orienta Sandstone | — | 2.80–2.87 | Refraction velocities correlated to mapped geology | Mooney and others (1970b) | Velocities from lines located over mapped Bayfield Group (fig. 8) |
| Bayfield Group, likely Chequamegon Sandstone | — | 3.35 | Refraction velocity correlated to mapped geology | Mooney and others (1970b) | Velocities from lines located over mapped Bayfield Group (fig. 8) |
| Bayfield Group, likely Chequamegon Sandstone | — | 3.44 | Refraction velocity correlated to mapped geology | Thiel (1956) | Refraction profile crossing Bayfield Peninsula (fig. 8) |
| Bayfield Group, likely Chequamegon Sandstone | — | 3.5 | Refraction velocities correlated to mapped geology | Steinhart and Meyer (1961) | Analysis of short-range refraction profile across Bayfield Peninsula (fig. 8) |
| Bayfield Group and Jacobsville Sandstone | — | 3.5 | Refraction velocities correlated to mapped geology | Ocola and Meyer (1973) | Analysis of several short-range refraction profiles located near the shores surrounding the Keweenaw and Bayfield Peninsulas |
Velocities are compiled for the Oronto Group in table 3, divided between argillaceous and arenaceous rock types. Velocities for the argillaceous and arenaceous groups are generally 3.3–4.5 km/s and 4.5–5.9 km/s, respectively, showing a significant separation in range as was evident on the velocity-pressure plots (fig. 6B). The velocity range of 3.3–4.5 km/s for the argillaceous rocks falls well within the total range determined for all the units overlying the Oronto Group (3–5 km/s). This overlap was noted earlier by Halls (1969).
Table 3.
Compressional-wave velocities for Oronto Group rocks compiled for the Lake Superior region.[Oronto Group formations are divided by lithology according to table 1. Nonsandstone units are considered to be similar to the argillaceous units as defined in table 1. Halls (1969) measurements, reported for confining pressures of 55 MPa and 193 MPa, are from the supplemental data in that report. Samples measured in the laboratory were saturated beforehand. Averages were not computed for less than 5 measurements. A common velocity was estimated subjectively to represent the refraction model correlations of figures 8 and 9 for Freda Sandstone. Significant digits of all reported values match those reported in the original data source. Refer to figure 3 for geographic references. —, not computed; km/s, kilometers per second; MPa, megapascals; Mich., Michigan]
| Geologic unit | Average velocity (km/s) | Velocity range (km/s) | Data type | Data source | Comments |
|---|---|---|---|---|---|
| Freda Sandstone | 3.88 at 55 MPa; 4.15 at 193 MPa | 3.33–4.36 at 55 MPa; 3.64–4.60 at 193 MPa | Laboratory study of 13 samples measured at 55 MPa and 12 samples at 193 MPa | Halls (1969) | Mudstone samples from 3 drill cores from Wisconsin. Only the saturated samples are included |
| Nonesuch Formation and Freda Sandstone | 3.86 | 2.99–4.76 | Borehole sonic log | Table 1 | All argillaceous intervals from Terra-Patrick 7–22 sonic log |
| Freda Sandstone | Common velocity: 3.85 | 3.23–4.18 | Refraction velocities correlated to mapped geology | Figure 8 and figure 9 | If the 3.23 km/s model layer on profile 17 (fig. 9) is other than Freda Sandstone, the minimum of the range would be 3.81 km/s instead |
| Freda Sandstone | 4.99 at 55 MPa; 5.22 at 193 MPa |
4.83–5.24 at 55 MPa; 5.07–5.50 at 193 MPa |
Laboratory study of 6 samples measured at 55 MPa and 193 MPa | Halls (1969) | Fine-grained sandstone samples from 2 drill cores and 1 location in Wisconsin |
| Copper Harbor Conglomerate | 5.58 at 55 MPa; 5.83 at 193 MPa | 5.44–5.75 at 55 MPa; 5.71–5.94 at 193 MPa | Laboratory study of 8 samples measured at 55 MPa and 193 MPa | Halls (1969) | Well indurated, fine-grained sandstone samples from 1 site on Isle Royale |
| Copper Harbor Conglomerate | 5.01 | 3.85–5.74 | Borehole sonic log | Table 1 | All arenaceous intervals from Terra-Patrick 7–22 sonic log |
| Copper Harbor Conglomerate | — | 4.61 | Refraction velocity correlated to mapped geology | Steinhart and Meyer (1961); Halls (1969) | From short-range recordings of a series of shots fired offshore of Copper Harbor, Mich., where rocks are likely coarse-grained sandstone |
| Lower part of Oronto Group, likely Copper Harbor Conglomerate | — | 4.7 | Refraction velocity correlated to mapped geology | Ocola and Meyer (1973) | Analysis of several short-range refraction profiles located near the shores surrounding the Keweenaw and Bayfield Peninsulas |
Velocity measurements for the Paleozoic sandstones and dolomites in the Lake Superior region are not apparent from published data. Typical velocities of Paleozoic sandstones and dolomites range from 2.0 to 6.0 km/s and 2.5 to 6.5 km/s, respectively (Kearey and Brooks, 1991).
Velocities for unconsolidated deposits in the Lake Superior region and analogous regions nearby are summarized in table 4. The velocities vary widely and are mainly dependent on porosity and degree of saturation (Silver and Lineback, 1972; Kearey and Brooks, 1991). Shallow refraction data over unconsolidated deposits from Minnesota (Petersen, 2001) show that materials above the water table have the lowest velocities (on the order of 0.2–1.0 km/s) and those below have the highest (on the order of 1.5–2.3 km/s). At similar saturations, velocities for clay are generally higher than those for sand. Velocities of unconsolidated lake sediments commonly are 4–6 percent faster or slower than the velocity of lake water (Silver and Lineback, 1972; Johnson, 1980). The velocity of Lake Superior water is approximately 1.42 km/s (Halls and West, 1971). Glacial tills generally have somewhat higher velocities, on the order of 1.6–1.8 km/s (table 4). Wold and others (1982) estimated the velocity for unconsolidated sediments in the central part of Lake Superior at 5,000 feet per second, or ~1.5 km/s, which is likely a reasonable representation of the velocity of a combination of lacustrine sediments and glacial till.
Table 4.
Compressional-wave velocities for unconsolidated materials compiled for the Lake Superior and nearby regions.[Averages were not computed for less than 5 measurements. Only the velocity ranges for each type of material were available from the Silver and Lineback (1972) study. km/s, kilometers per second; Minn., Minnesota; —, not computed or not available]
| Type of material | Average velocity (km/s) | Velocity range (km/s) | Data type | Data source | Comment |
|---|---|---|---|---|---|
| Unsaturated glacial materials | 0.837 | 0.396–1.707 | Refraction velocities from 27 profiles | Mooney and others (1970b) | Profiles located over the Midcontinent Rift System from Lake Superior to Saint Paul, Minn.. Sediment type from V. Chandler and R. Lively, written commun., 2013 |
| Saturated glacial materials | 1.700 | 1.067–2.347 | Refraction velocities from 42 profiles | Mooney and others (1970b) | Profiles located over the Midcontinent Rift System from Lake Superior to Saint Paul, Minn. Sediment type from V. Chandler and R. Lively, written commun., 2013 |
| Saturated unconsolidated materials | 1.927 | 1.452–2.472 | Refraction velocities from 33 profiles | Chandler and Lively (2021) | Shallow refraction studies from onshore Lake Superior region |
| Saturated coarse-grained materials | — | 1.673 | Refraction velocity from 1 profile | Thiel (1956) | Profile across Bayfield Peninsula (fig. 8). Sediment type from Soller and others (2012) |
| Lake sediments and glacial materials | — | 1.524 | Seismic experiment from a boat | Wold and others (1982) | Measurement of travel time over a lake core site with known depth to bedrock |
| Lacustrine soft silts and clays | — | 1.348–1.488 | Study of acoustic measurements from 15 lake cores | Silver and Lineback (1972) | Lake cores from southern Lake Michigan, considered to be similar in sediment type to Lake Superior sediments (Johnson, 1980). Velocity of water measured as 1.428 km/s |
| Glacial-lacustrine clay | — | 1.360–1.529 | Study of acoustic measurements from 15 lake cores | Silver and Lineback (1972) | Lake cores from southern Lake Michigan, considered to be similar in sediment type to Lake Superior sediments (Johnson, 1980). Velocity of water measured as 1.428 km/s |
| Compacted glacial till within the lake | — | 1.550 | Study of acoustic measurements from 15 lake cores | Silver and Lineback (1972) | Lake cores from southern Lake Michigan, considered to be similar in sediment type to Lake Superior sediments (Johnson, 1980). Velocity of water measured as 1.428 km/s |
| Lacustrine silts and clays | 1.57 | 1.40–2.27 | Study of acoustic measurements from 68 lake cores | Morgan (1969) | Lake cores from Lake Erie. Average velocity of water measured as 1.53 km/s |
Density Data
Although density can be determined using a variety of methods (Kearey and Brooks, 1991), only laboratory measurements of rock samples are available for the Lake Superior region. Density logs are accessible for the Terra-Patrick 7–22 well, but the readings are unreasonably high, likely due to the influence of the drilling mud (Lindblom, 1999). Previous studies that include density data for the Lake Superior region are described briefly and summarized for sedimentary units and other crustal rocks in the subsequent sub-sections. Density data for mafic igneous rocks are discussed in combination with their velocities in the section on “Velocity-Density Relations.”
Laboratory Studies of Density
Density is determined in the laboratory by dividing the measured mass of the sample by its volume. Mass and volume were determined in a variety of ways, as described in the original references. For porous rocks, such as clastic sedimentary samples, it is important to saturate the rock with water before measuring. This practice simulates the conditions of rocks located below the water table.
Campaigns to measure density from rock samples in the Lake Superior region date as far back as 1896 (Dutch and others, 1995). The most recent are published as databases of numerous density measurements for Minnesota (Chandler and Lively, 2021), the Iron Mountain-Menominee region in Michigan and Wisconsin (Anderson and others, 2020), and specific gravity measurements for Ontario (Rainsford and others, 2018). Specific gravity is the unitless ratio of the rock’s bulk density to that of water, whereas bulk density is an absolute quantity that takes the density of water into account. Assuming a density of 1.0 gram per cubic centimeter (g/cm3) for water, the specific gravity values can be equated to bulk density in units of g/cm3 and then converted to kg/m3 by multiplying by 1,000. Densities from these or preliminary versions of these more recent databases are summarized for specific regions in Minnesota by Chandler (2002) and Chandler and others (2007), in Michigan and Wisconsin by Drenth and others (2021), and in southern Ontario by Musacchio and others (2004).
Most of the samples measured for density were taken from outcrops (Thiel, 1956; Bacon, 1966; Klasner and others, 1979; Dutch and others, 1995; Rainsford and others, 2018; Anderson and others, 2020); some also include samples from core or mines (Birch, 1954; Halls, 1969; Lippus, 1988; Allen, 1994; Chandler and Lively, 2021). Thomas and Teskey (1994) included bedrock samples dredged from the lake bottom. With the exception of the modern compilations (Rainsford and others, 2018; Anderson and others, 2020; Chandler and Lively, 2021), the densities for particular formations are reported without details of the sampling method or sample location.
Density Data Compiled for Sedimentary Rocks
Densities are compiled for units overlying the Oronto Group in table 5, divided by formation and lithology (if known). The measurements for these units are fairly well clustered. The general ranges (rounded to the nearest 50 kg/m3) are 2,150–2,450 kg/m3 for the Bayfield Group and 2,300–2,550 kg/m3 for both the Fond du Lac and Hinckley Formations. The Jacobsville Sandstone samples show the widest variation, with densities of roughly 2,550 kg/m3 for the well-indurated samples and a range of 2,150–2,400 kg/m3 (rounded to the nearest 50 kg/m3) for the saturated samples. Bacon (1966) found an average value of 2,250 kg/m3 for density measurements compiled from multiple studies. However, the author considered this average too low to represent the Jacobsville Sandstone for gravity modeling and used a density of 2,400 kg/m3 instead. If valid, this supposition also brings into question the average value of 2,150 kg/m3 reported by Birch (1954). The low values from Birch’s study might be explained by the failure to saturate the samples before measurement.
Table 5.
Bulk densities for units overlying the Oronto Group compiled for the Lake Superior region.[Units overlying the Oronto Group include Bayfield Group, Jacobsville Sandstone, Hinckley Sandstone, and Fond du Lac Formation (fig. 4). Formations sampled from the Bayfield Group were determined by comparing the geologic map of Cannon and others (1996) to sample location descriptions (Halls, 1969). Data for the Halls (1969) study are from the supplemental data for that report. Averages were not computed for less than 5 measurements. Bacon (1966) reported only an average value. Samples were saturated before measurement unless otherwise noted. Refer to figure 3 for geographic references. kg/m3, kilograms per cubic meter; —, not computed; Wis., Wisconsin]
| Geologic unit1 | Average density (kg/m3) | Density range (kg/m3) | Data type | Data source | Comment |
|---|---|---|---|---|---|
| Bayfield Group, Chequamegon and Orienta Sandstones | 2,328 | 2,250–2,440 | Laboratory study of 5 samples | Halls (1969) | 4 samples described as “moderately friable” and 1 as “less friable” from 5 different sites in Wisconsin |
| Jacobsville Sandstone | 2,317 | 2,180–2,400 | Laboratory study of 6 samples | Halls (1969) | Samples described as “moderately friable” collected from 3 sites in Minnesota |
| Fond du Lac Formation | — | 2,330–2,360 | Laboratory study of 4 samples | Halls (1969) | Samples described as “moderately friable” collected from 3 sites in Minnesota |
| Hinckley Sandstone | — | 2,330–2,350 | Laboratory study of 3 samples | Halls (1969) | Samples described as “moderately friable” collected from 3 sites in Minnesota |
| Jacobsville Sandstone | — | 2,540–2,590 | Laboratory study of 3 unsaturated samples | Halls (1969) | Samples described as “well cemented” collected along the river near Sault Ste. Marie, Ontario |
| Bayfield Group | 2,300 | 2,140–2,350 | Laboratory study of 20 samples | Thiel (1956) | Samples collected from the Bayfield Peninsula, Wis., described as 99% sandstone, 1% shale |
| Bayfield Group, likely Chequamegon Sandstone | — | 2,210–2,240 | Laboratory study of 3 samples | Dutch and others (1995) | Samples collected on Madeline Island, approximately 25 km northeast of Ashland, Wis. |
| Jacobsville Sandstone | — | 2,160–2,290 | Laboratory study of 4 samples | Dutch and others (1995) | Samples collected from 3 sites in Michigan |
| Jacobsville Sandstone | 2,370 | 2,340–2,400 | Laboratory study of 12 samples | Thomas and Teskey (1994) | Samples collected from Superior Shoal, northern Lake Superior, Ontario |
| Jacobsville Sandstone | 2,150 | 2,010–2,290 | Laboratory study of 8 unsaturated samples | Birch (1954) | Samples collected from northern Keweenaw Peninsula, Mich. |
| Jacobsville Sandstone | 2,250 | Not reported | Laboratory study of 74 samples | Bacon (1966) | Samples collected from northern Keweenaw Peninsula, Mich. Bacon considered these densities to be too low and not representative of the Jacobsville Sandstone |
| Fond du Lac Formation | 2,373 | 2,270–2,530 | Laboratory study of 6 crushed hand samples | Chandler and Lively (2021) | Samples collected from different sites in Minnesota |
| Hinckley Sandstone | 2,360 | 2,270–2,530 | Laboratory study of 6 crushed hand samples | Chandler and Lively (2021) | Samples collected from different sites in Minnesota |
Densities are summarized for the Oronto Group in table 6, divided by lithologic type following table 1 if known. The range of average densities for argillaceous rock types is approximately 2,350–2,550 kg/m3. The range for arenaceous rock types is approximately 2,600–2,700 kg/m3 if the study by Birch (1954) is discounted. This omission is justified because (1) the measured values in this study are much lower than the those of the other studies, and (2) the author acknowledged difficulties in obtaining representative samples for measuring the conglomerates.
Table 6.
Bulk densities for Oronto Group compiled for the Lake Superior region.[Oronto Group formations are divided by lithology according to table 1. Averages were not computed for less than 5 measurements. Data for the Halls (1969) study are from the supplemental data for that report. Bacon (1966) reported only an average value. Samples were saturated before measurement unless otherwise noted. Refer to figure 3 for geographic references. —, not computed; kg/m3, kilograms per cubic meter.]
| Geologic unit | Average density (kg/m3) | Density range (kg/m3) | Data type | Data source | Comments |
|---|---|---|---|---|---|
| Freda Sandstone | 2,541 | 2,360–2,660 | Laboratory study of 13 samples | Halls (1969) | Mudstone samples from 3 drill cores from Wisconsin. Only the saturated samples are included |
| Freda Sandstone | 2,540 | 2,493–2,587 | Laboratory study of 8 dry samples | Birch (1954) | Siltstone and fine-grained sandstone, with very minor coarse sandstone and conglomerate, collected in northern Keweenaw Peninsula |
| Oronto Group, likely Freda Sandstone | 2,360 | 2,241–2,479 | Laboratory study of 8 samples | Thiel (1956) | 60% shale, 40% sandstone collected around Lake Superior |
| Nonesuch Shale | — | 2,522–2,538 | Laboratory study of 4 dry samples | Birch (1954) | Predominantly gray siltstone, collected in northern Keweenaw Peninsula |
| Freda Sandstone | 2,622 | 2,530–2,680 | Laboratory study of 6 samples | Halls (1969) | Fine-grained sandstone samples from 2 drill cores and 1 location in Wisconsin |
| Copper Harbor Conglomerate | 2,674 | 2,640–2,740 | Laboratory study of 8 samples | Halls (1969) | Well indurated, fine-grained sandstone samples from 1 site on Isle Royale |
| Sandstone and conglomerate of Keweenawan Supergroup | 2,650 | 2,360–2,890 | Laboratory studies of 29 samples | Dutch and others (1995) | Samples compiled from multiple sources and several sites in Michigan, Minnesota, and Wisconsin |
| Copper Harbor Conglomerate | 2,420 | 2,279–2,579 | Laboratory study of 30 dry samples | Birch (1954) | Pebble conglomerate with subordinate sandstone collected in northern Keweenaw Peninsula; Birch discussed difficulties with measuring densities of conglomerate |
| Freda Sandstone | 2,660 | — | Laboratory study of 16 samples | Bacon (1966) | No information on sample lithology or location. |
Density measurements for the Paleozoic sandstones and dolomites in the Lake Superior region are not apparent from published data. Typical densities measured for saturated Paleozoic sandstones and dolomites have ranges of 2,350–2,550 kg/m3 and 2,280–2,900 kg/m3, respectively (Kearey and Brooks, 1991).
Densities for unconsolidated materials are difficult to measure from hand samples. Those reported by Chandler and Lively (2021) for Minnesota are inferred from seismic refraction velocities using Gardner’s relation (eq. 3) rather than measured. Densities reported for saturated sand and clay elsewhere are on the order of 1,500–2,500 kg/m3 (Kearey and Brooks, 1991). Densities obtained for unconsolidated materials in cores from Lake Erie, which may be similar to those of Lake Superior, are generally in the range 1,250–2,100 kg/m3 (Morgan, 1969).
Density Data Compiled for Felsic Igneous Rocks
Only limited density data are available for rhyolites and felsic intrusions related to the Midcontinent Rift System, despite their significance within the Duluth Complex and North Shore Volcanic Group (Green, 2002) and their abundance within volcanic centers in the Porcupine Mountains (Hubbard, 1975; Cannon and others, 1995) and on Michipicoten Island (Annells, 1974). Felsic rocks of unknown origin, which are commonly described as “felsite” in the older literature, compose a significant fraction of the pebbles contained within the Copper Harbor conglomerate (Daniels, 1982), suggesting that these rocks were once widespread across the area and have been eroded away. Although data are sparse, densities compiled in table 7 mainly fall in the range of 2,600–2,800 kg/m3; these values are consistent with densities determined for felsic rock types elsewhere (Kearey and Brooks, 1991).
Table 7.
Bulk densities for felsic igneous rocks compiled for the Lake Superior region.[Felsic rocks of unknown origin are commonly described as “felsite” in the older literature. Averages were not computed for less than 5 measurements. Bacon (1966) reported only an average value. kg/m3, kilograms per cubic meter; —, not computed or not available]
| Rock type | Average density (kg/m3) | Density range (kg/m3) | Data type | Data source | Comments |
|---|---|---|---|---|---|
| Felsite pebbles | 2,680 | — | Laboratory measurements of 30 samples | Bacon (1966) | No location information or population statistics given |
| Felsite | — | 2,630–2,670 | Laboratory measurements of 4 samples | Bacon (1966) | Range of averages of 3 samples from the northern Keweenaw Peninsula and 1 sample from the Porcupine Mountains, Mich. |
| Felsic lavas of the North Shore Volcanic Group | 2,596 | 2,410–2,750 | Laboratory measurements of 10 samples | Chandler (2002) | 10 samples from northeastern Minnesota |
| Granitic and granophyric rocks | 2,629 | 2,520–2,830 | Laboratory measurements of 10 samples | Chandler (2002) | 10 samples from the Duluth Complex, northeastern Minnesota |
Density Compiled for Rocks Older than the Midcontinent Rift System
A large number of density measurements for rocks older than the Midcontinent Rift System in the Lake Superior region, mainly on hand samples of igneous and metamorphic rocks, have been reported in the literature and collected in databases. These data are compiled in appendix 1, table 1.1 by rock type and region. Paleoproterozoic iron formations are excluded from the compilation, even though they commonly have high densities (more than 3,100 kg/m3; Klasner and Cannon, 1974; Dutch and others, 1995; Chandler and others, 2007; Drenth and others, 2021). The small volumes of the Paleoproterozoic iron formations relative to other Paleoproterozoic rocks makes them important only for geophysical modeling where they are present onshore. For geophysical models focused on the sections under the lake, their gravity effects would be negligible at the depths they would be expected to occur. Densities for the older metasedimentary and sedimentary rocks are discussed in the section “Velocity-Density Relations for the Lake Superior Region.” Densities for crystalline rocks from table 1.1 show that general variations mainly correlate with silica content. Felsic rocks are the least dense and mafic and ultramafic rocks are the densest, a common observation noted worldwide (Kearey and Brooks, 1991; Schön, 2015a).
Compiling densities by terrane rather than by rock type is a more useful exercise to understand density variations for use with gravity models of the heterogeneous crystalline crust. The modern databases for Ontario (Rainsford and others, 2018), Minnesota (Chandler and Lively, 2021), and a limited area near the Michigan-Wisconsin border (Anderson and others, 2020) contain sufficiently large sample populations to allow such statistical comparisons, shown in figure 10. The three histograms for rock densities for the Superior Province (fig. 10A, B, C) all display wide variability that is somewhat bimodal, with dominant peaks in the ranges 2,620–2,720 kg/m3 and 2,900–3,050 kg/m3 representing felsic and mafic rocks, respectively. The felsic range includes 2,700 kg/m3, which is commonly used for gravity modeling of the Archean crust (Bacon, 1966; Hutchinson and others, 1990; Hinze and others 1990, 1997; Mariano and Hinze, 1994; Thomas and Teskey, 1994; Allen and others, 1997; Chandler and Lively, 1998; and Drenth and others, 2021). The asymmetric, bimodal character of densities measured for the Superior Province in Ontario (fig. 10A) likely reflects the mixture of felsic and mafic rocks of the granite-greenstone terrane. The larger peaks in the felsic versus mafic ranges for the Superior Province in Minnesota, Wisconsin, and Michigan (fig. 10B) indicate a greater predominance of granitic rocks. The histogram for densities sampled from Paleoproterozoic crystalline rocks in Wisconsin and Michigan (fig. 10C), which are mostly from the Wisconsin magmatic terranes, also shows a separation in density ranges between felsic and mafic rocks, with the felsic range dominant. The bimodal and broad distribution of density values displayed by the histograms emphasize the importance of examining the dominant rock types of the terrane that is to be modeled rather than using one average density value for all crystalline crust.
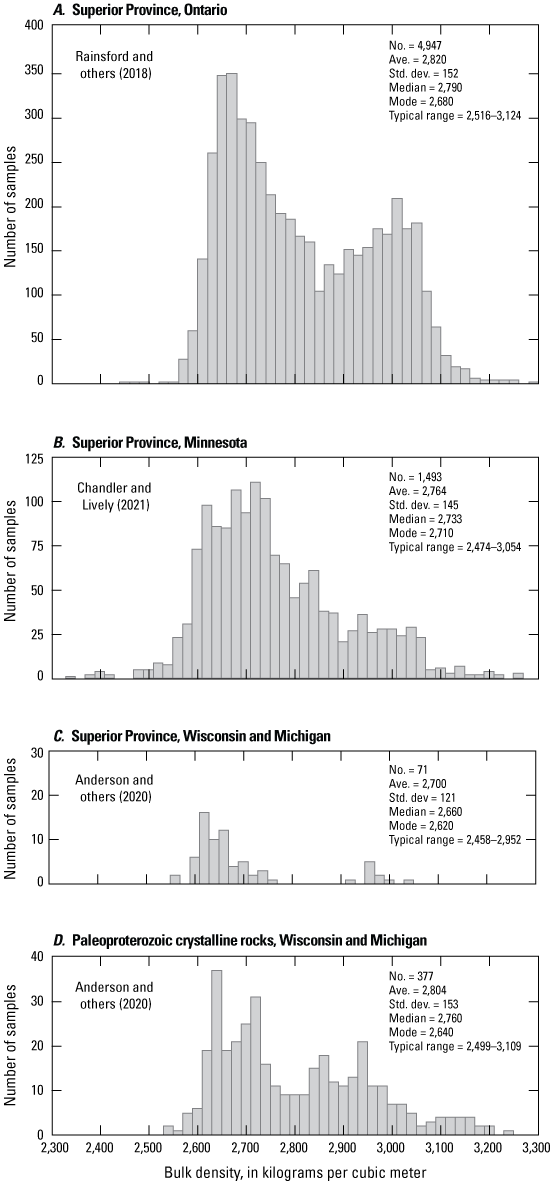
Histograms of density measurements for crystalline rocks from the Superior Province and Paleoproterozoic Penokean orogen (fig. 1). Histograms, statistics, and sources of data come from within the study area for the Superior Province of A, Ontario; B, Minnesota; and C, Wisconsin and Michigan; and for D, the Penokean orogen of Wisconsin and Michigan. The Paleoproterozoic crystalline rocks from Wisconsin and Michigan (D) are mainly from the Wisconsin magmatic terranes (fig. 3). Table 1.2 specifies the rock types selected from the databases and the outliers that were removed before statistical analysis. Typical range is determined from the average plus and minus two standard deviations. Ave., average; No., number of samples used for statistics; Std. dev., standard deviation.
Velocity-Density Relations for the Lake Superior Region
Velocity-density equations first developed for the Lake Superior region were based on the assumption that one linear equation was sufficient to describe the velocity-density relations for the whole region. Steinhart and Smith (1966) determined a linear relation between velocities that matched observed travel times from seismic studies and densities for models that gave a good fit to observed gravity anomalies. Their linear relation is given by equation 10.
whereThese authors supported their velocity-density equation by plotting its line against ranges of measured densities and velocities for Bayfield Group, Oronto Group, basement rocks in Wisconsin, and diabase as a proxy for basalts at depth. Whereas their figure appears to confirm the application of one linear equation for all these rock types, the study by Halls (1969) and additional density and velocity data compiled herein suggest that separate velocity-density equations may be warranted.
This section evaluates previously established equations presented in the section on “Velocity, Density, and their Relations” in comparison to velocity and density data for sedimentary rocks and igneous rocks related to the Midcontinent Rift System, Archean and Paleoproterozoic crystalline crust, and metasedimentary and sedimentary rocks that predate the Midcontinent Rift System in the Lake Superior region. The objective is to choose the equation that most accurately represents the empirical velocity-density relations for each group. In some cases, there is enough data to evaluate the existing equations. In the absence of data for comparison, an equation can still be chosen based on similarity of geologic settings or rock types.
Keweenawan Sedimentary Rocks
The only measurements of both velocity and density for the same samples of Keweenawan sedimentary rocks come from Halls (1969). Velocity data from this study for the Oronto Group and overlying units at confining pressure of 55 MPa are plotted against density in figure 11A. Velocities measured at 55 MPa (to simulate a depth of 1–2 km) from Halls’ study provide the best data (fig. 6) that most closely match the Earth’s surface conditions represented by the density measurements. Matching the measurement pressures as closely as possible is important for sedimentary rocks because both velocity and density vary greatly with depth.
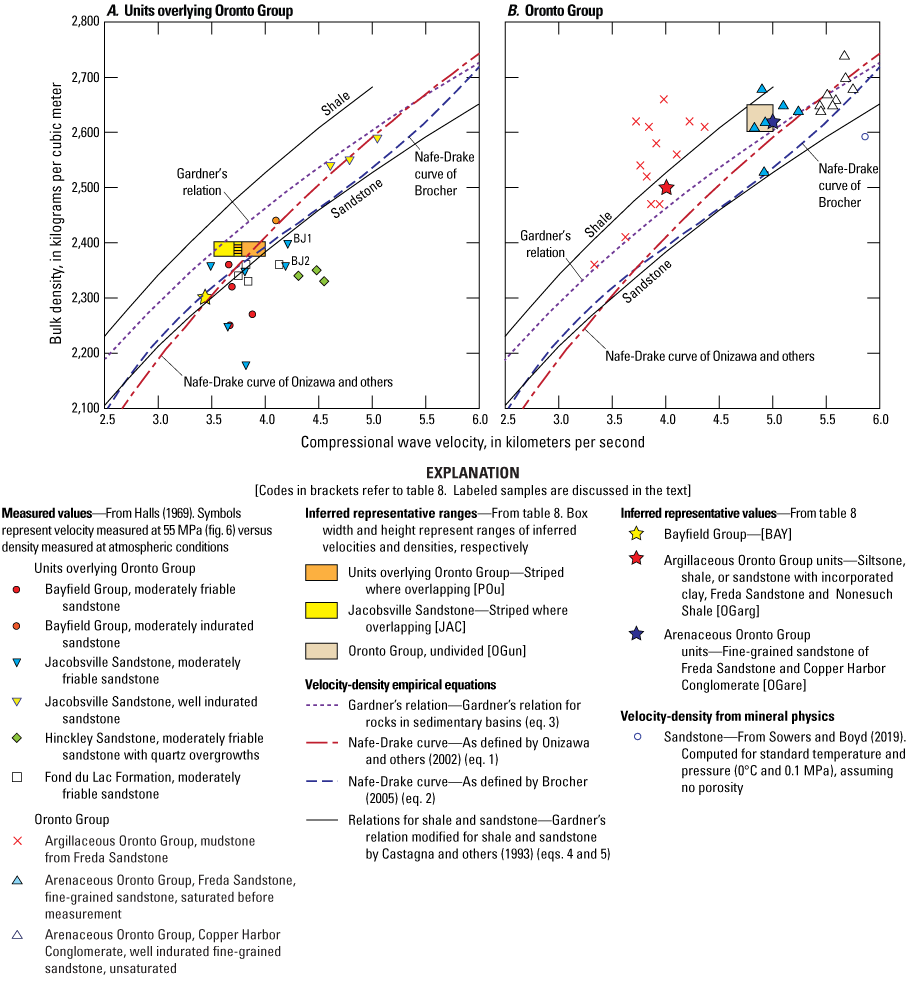
Velocity-density data for Keweenawan sedimentary rocks from Halls (1969) compared to previously established velocity-density curves. A, Units overlying the Oronto Group are plotted individually; and B, Oronto Group rocks are divided by lithologic type. Samples BJ1 and BJ2 are discussed in the text. Inferred representative ranges and values are coded in the explanation and described in table 8. MPa, megapascals.
In figure 11, the velocity-density data points from Halls (1969) are compared to the established velocity-density equations commonly used for sedimentary rocks: Gardner’s relation (eq. 3), the two versions of the Nafe-Drake curve (eqs. 1 and 2), and relations for shale and sandstone (eqs. 4 and 5). The shale and sandstone curves are purported to generally bracket the range of velocity-density relations expected for clastic rocks in sedimentary basins (Castagna and others, 1993). These rock types should be comparable to the Keweenawan sedimentary rocks. The scatter of the Halls data in relation to these curves points out the variability and possible problems with the data, issues with using a single curve to represent empirical relations that are variable, and difficulties in using limited data for determining representative velocities and densities and their relations.
The three well indurated Jacobsville Sandstone samples are anomalous compared to the other samples from the units overlying the Oronto Group; they plot closer to samples from the arenaceous Oronto Group (fig. 11A). These samples are all from one location near Sault Ste. Marie, Ontario (Halls, 1969), indicating that (1) the rocks in this location have anomalous lithologies compared to other areas, (2) Jacobsville Sandstone physical properties have much wider variation than the values from the other localities imply, or (3) the rocks should be correlated with the older Oronto Group. These possibilities suggest that velocity and density relations may differ among the units overlying the Oronto Group, but there is not enough data available to examine these differences.
Geophysical analyses from previous work can help address the problem of limited velocity-density data. Table 8 pairs velocities and densities that others have separately considered representative of particular geologic units or lithologies at some depth below Lake Superior to help understand velocity-density relations. For example, Thiel (1956) constructed density-depth curves from surface measurements and theoretical considerations of compaction versus lithology for Bayfield and Oronto Group units to best represent these densities in the subsurface of the lake. These values at depths of 1,500 m for Bayfield Group and 5,000 m for Oronto Group can be compared to velocities of the same lithologies available from Thiel’s refraction results from the same area (fig. 8) and measurements of similar argillaceous Oronto Group rocks from Halls (1969). Other inferred, representative velocity-density pairs were derived from one or more authors who provided the reasoning behind their choices of representative velocity or density for particular rock types. For example, White (1966a) used both detailed geophysical analysis and geologic considerations to derive representative lithologies and related subsurface densities for the Keweenawan sedimentary units. Halls (1969) developed theoretical curves of velocity versus depth for different lithologies found for these same rocks. Both Halls (1969) and White (1966a) reasoned that rocks of Freda Sandstone and Copper Harbor Conglomerate below the lake would likely be dominated by fine-grained sandstone. From this conclusion, an inferred, representative velocity-density pair can be formed from two separate sources. As another example, Allen (1994) provided detailed analysis on his development of velocity-density pairs for converting seismic-reflection profiles to depth (reported with less detail in Allen and others, 1997). Because this analysis included evaluation of velocities and densities measured by others, the results are naturally similar to several other authors.
Table 8.
Inferred representative velocity-density pairs for sedimentary rocks related to the Midcontinent Rift System.[Velocities and densities considered representative of the different rock suites from previous work are paired and coded for comparison to measured values in figure 11. See text for further explanation. Units overlying the Oronto Group include Bayfield Group, Jacobsville Sandstone, Hinckley Sandstone, and Fond du Lac Formation (fig. 4). Argillaceous versus arenaceous Oronto Group are divided following table 1. km/s, kilometers per second; kg/m3, kilograms per cubic meter]
| Code (fig. 11) | Geologic unit | Velocity (km/s) | Density (kg/m3) | Data source(s) for velocities | Data source(s) for densities |
|---|---|---|---|---|---|
| JAC | Jacobsville Sandstone | 3.61–3.77 | 2,370–2,400 | Bacon (1966) | Analysis (not measurements) from Bacon (1966); White (1966a) |
| BAY | Bayfield Group | 3.44 | 2,300 | Thiel (1956) | Thiel (1956) |
| POu | Units overlying the Oronto Group, undivided | 3.70–4.00 | 2,370–2,400 | Halls (1969); Hinze and others (1990); Allen (1994) | White (1966a); Hinze and others (1982); Allen (1994); Allen and others (1997) |
| OGarg | Argillaceous Oronto Group | 4.00 | 2,500 | Halls (1969) | Thiel (1956) |
| OGare | Arenaceous Oronto Group | 5.00 | 2,620 | Halls (1969) | White (1966a) |
| OGun | Oronto Group, undivided | 4.75–5.00 | 2,600–2,650 | Ocola and Meyer (1973); Allen (1994) | White (1966a), Hinze and others (1982), Allen (1994); Allen and others (1997) |
The inferred, representative velocity-density pairs and ranges plot near the measured data points for their corresponding Keweenawan sedimentary units and within the two endmember curves for sandstone and shale (fig. 11). They provide additional evidence for comparing the observed data to the established velocity-density curves to see which most closely matches each rock suite. Both representations of the Nafe-Drake curve pass near the cluster of data points, inferred ranges, and inferred point for the units overlying the Oronto Group for velocities less than 4.5 km/s (fig. 11A), suggesting that the Nafe-Drake curve best represents this rock suite. The anomalous, well indurated Jacobsville Sandstone data points fall closer to the Nafe-Drake curve of Onizawa and others (2002) and Gardner’s relation at velocities greater than 4.5 km/s. Despite the sparse data at these velocities, the Nafe-Drake curve of Onizawa and others (2002) is chosen to represent this rock suite to maintain consistency between all the units overlying the Oronto Group. However, this choice remains tentative and could change if more data were available for the Jacobsville Sandstone. Gardner’s relation is chosen to represent the Oronto Group because this curve passes closer to the mudstone data compared to the other curves and provides a seamless way to represent the transition from argillaceous to arenaceous Oronto Group rocks (fig. 11B).
Igneous Rocks Related to the Midcontinent Rift System
Previous workers have investigated velocity-density relations sufficiently for basalts, diabase, and gabbro related to the Midcontinent Rift System in the Lake Superior region to present these properties together in this section. These data are compiled along with measurements for other rock types known or suspected to be related to the Midcontinent Rift System in table 9. Associated felsic intrusions may be present at depth, as evidenced by rhyolite flows and rhyolite breccias exposed at the surface (see the “Geologic Setting” section). Although only limited data are available for these rocks, they are included for completeness. Anorthosite may also be present at depth, because large xenolithic blocks of anorthosite are included in diabase related to the Beaver Bay Complex on the north shore of Minnesota (fig. 3; Morrison and others, 1983; Miller and Chandler, 1997). Although a paucity of density data and no velocity data are available for anorthosite in the Lake Superior region, other geophysical observations led Grauch and Heller (2021) to speculate that a considerable volume of these rocks might be present at depth in western Lake Superior. Therefore, velocity and density data for this rock type compiled from elsewhere are included here for comparison.
Table 9.
Measured and inferred velocity-density values for igneous rocks related to the Midcontinent Rift System.[Laboratory measurements of velocity are reported for a confining pressure of approximately 200 megapascals (MPa). Densities were measured with no confining pressure. Significant digits match those reported by the reference cited. Relations inferred from previous work are included for comparison. km/s, kilometers per second; kg/m3, kilograms per cubic meter; >, greater than]
| Geologic unit | Velocity (km/s) | Density (kg/m3) | Description |
|---|---|---|---|
| Basalt, St. Croix horst, from southwest of the study area | 6.07–6.75 | 2,950 | Range of velocity values for 7 core samples and average density for 32 core samples from the Northern Natural Gas well near Osseo, Minn. (Allen and Chandler, 1993). |
| Basalt, Keweenawan Supergroup | 5.08–6.76 | 2,660–3,020 | Typical ranges estimated for 55 samples from Halls (1969; table 1.3) |
| Basalt, Portage Lake Volcanics | 5.50–6.20 | 2,670–2,900 | Range of averages from measurements of basalt cores from 3 drill holes, total of 42 measurements, from Lippus (1988) |
| Diabase related to the Midcontinent Rift System | 5.87–6.64 | 2,860–3,030 | 3 samples from various locations in the Lake Superior region (Halls, 1969) |
| Diabase related to the Midcontinent Rift System | 6.74–6.84 | 2,999–3,006 | Range of measurements from 3 specimens near Sudbury, Ontario (Birch, 1960) |
| Gabbro, Mellen Intrusive Complex | 7.09 | 2,931 | One sample from near Mellen, Wis. (Halls, 1969) |
| Gabbro, Mellen Intrusive Complex | 6.97–7.25 | 2,917–2,948 | Range of measurements from 3 specimens near Mellen, Wis. (Birch, 1960) |
| Gabbro, Duluth Complex | 6.96 | 2,900 | One sample measured from near Duluth, Minn. (Halls, 1969) |
| Bytownite gabbro, Duluth Complex | 6.68 | 2,885 | Measured from 1 specimen at 100 °C (Hughes and Maurette, 1957) |
| Felsic flow or intrusion related to the Midcontinent Rift System | 6.00 | 2,620 | Measurement of 1 rhyolite or felsic intrusive sample from Porcupine Mountains, Mich. (Halls, 1969) |
| Basalt, Keweenawan Supergroup | 6.5 | 2,950 | Velocity-density relations used to convert times to depths from seismic-reflection profiles (Allen, 1994) |
| Gabbro, Mellen Intrusive Complex | 6.9 | 3,080 | Extrapolation of velocity measurements to pressures >100 MPa; densities inferred from velocity-density relations and gravity modeling (Ocola and Meyer, 1973) |
| Gabbro, Duluth Complex | 6.4 | 2,940 | Extrapolation of velocity measurements to pressures >100 MPa; densities inferred from velocity-density relations and gravity modeling (Ocola and Meyer, 1973) |
The laboratory studies of Halls (1969) and Lippus (1988) provide the best data to examine velocity-density relations for basalts of the Keweenawan Supergroup. Halls (1969) includes samples from a variety of basalts around the region (table 1.3), whereas Lippus (1988) thoroughly sampled a section of Portage Lake Volcanics near Eagle Harbor at the northern tip of the Keweenaw Peninsula (fig. 3). Both Halls (1969) and Lippus (1988) reported velocity measurements for individual samples at increasing confining pressures to a maximum of approximately 220 MPa. Density is plotted versus velocity at low (55–60 MPa) and high (193–200 MPa) confining pressures for both datasets (fig. 12) to demonstrate the scatter of the velocity data. As explained earlier, velocity measured at 55 MPa is the most reliable data that most closely matches the conditions of the density measurements. However, comparing density measurements at low pressures to velocity at higher pressures is not as problematic for crystalline rocks as these comparisons are for sedimentary rocks because the densities and velocities of crystalline rocks do not vary as much with depth (Schön, 2015a, b). Moreover, velocity is commonly measured and discussed for a confining pressure of 200 MPa in other rock property studies (Hughes and Maurette, 1957; Birch, 1960; Allen, 1994), which provides the impetus for plotting velocity at this pressure versus density in subsequent figures.
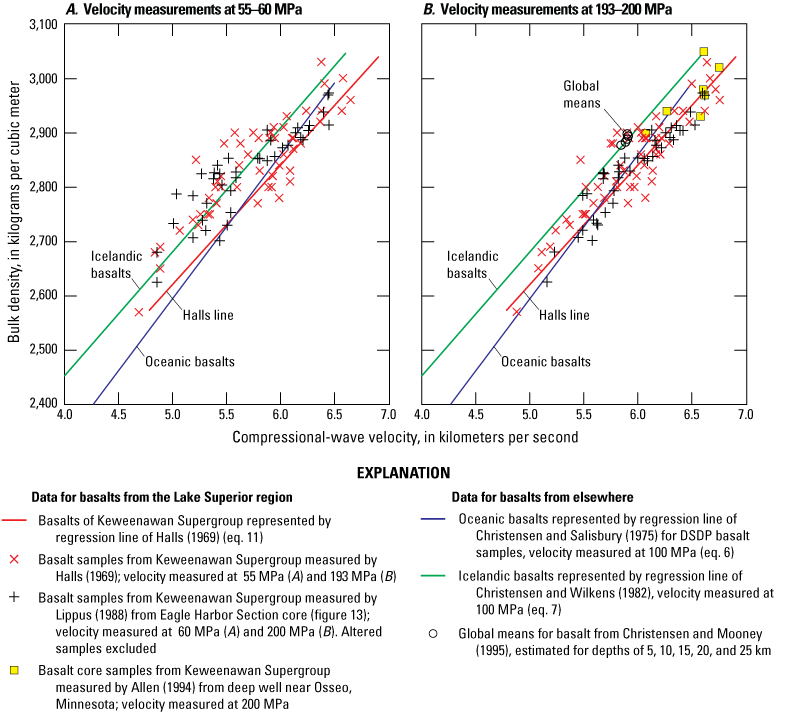
Velocity-density plot of data for basalts of the Keweenawan Supergroup at different confining pressures in comparison to data for basalts from elsewhere. A, data at low pressure (55–60 megapascals [MPa]) are from Halls (1969) and Lippus (1988). B, data at high pressure (193–200 MPa) are from Halls (1969), Lippus (1988), and Allen (1994). Data from elsewhere are compared as regression lines and mean values for basalts compiled globally. DSDP, Deep-Sea Drilling Program; km, kilometers.
Velocity-density relations for all the basalts measured at 193–200 MPa show a similar relation to equation 11 (fig. 12B). The tighter clustering of the velocity-density points about the Halls line for the higher confining pressure suggests that the line is a suitable representation of relations as deep as 7–8 km below the subsurface, which is estimated considering depth versus overburden pressure (Halls, 1969; Lippus, 1988; Castagna and others, 1993). Thus, for simplicity, the Halls line (eq. 11) is shown in subsequent figures as a proxy for basalts of the Keweenawan Supergroup rather than plotting the individual data points.
Figure 12 shows that the Halls line representing basalts of the Keweenawan Supergroup is similar to the one for oceanic basalts sampled by the DSDP (Christensen and Salisbury, 1975; eq. 6) and has a slope that matches the one for Icelandic basalts (Christensen and Wilkens, 1982; eq. 7). Christensen and Wilkens (1982) attribute the difference between the velocity-density relations from DSDP and Iceland to greater iron content in the basalts from Iceland. Velocity versus density data compiled for basalt by Christensen and Mooney (1995; fig. 12B) plot on the line for the Icelandic basalts and do not capture the variability of basalt data that is demonstrated by Christensen and Wilkens (1982), although they do acknowledge that a wide range of velocities in basalt is expected as a function of glass content, porosity, and secondary alteration.
Velocities and densities for basalts of the Keweenawan Supergroup include higher velocities (more than 6.0 km/s) and densities (more than 2,900 kg/m3) than those reported by Christensen and Mooney (1995). The basalts from the borehole near Osseo (Allen and Chandler, 1993; Allen, 1994) provide an example of these high values (fig. 12B), with measured averages for velocity and density of 6.5 km/s and 2,950 kg/m3, respectively. These samples were obtained from the interiors of flows at about 1 km depth. Allen (1994) and Allen and others (1997) considered these samples to represent the conditions of basalts of the Keweenawan Supergroup in the subsurface because the high porosities of flow tops are reduced at depth.
Halls (1969) found that velocity and density generally varied in concert as a function of mineralogy and porosity. Amphibole-rich, diabasic, and fresh basalt samples have the highest densities and velocities (generally more than 2,900 kg/m3 and more than 6.5 km/s, respectively), whereas samples with high porosity have the lowest densities and velocities (generally less than 2,500 kg/m3 and less than 5.3 km/s, respectively).
Velocity and density data from Lippus (1988), plotted in figure 13, provide an interesting test of how velocity and density increase with depth within a thick section of Portage Lake Volcanics. Samples were obtained from three drillholes that collectively represent different stratigraphic levels within the 4.8-km thick basalt section near Eagle Harbor in the northern Keweenaw Peninsula (fig. 3). Both velocity and density increase down section, as seen from the progression of data points from the top, middle, and base of the section (fig. 13; drillholes EH2, C27, and D57, respectively). Lippus (1988) argued that the increase in both velocity and density at lower stratigraphic levels is explained by intensifying metamorphic grade, although the author did not investigate the mineralogy of the samples in detail.
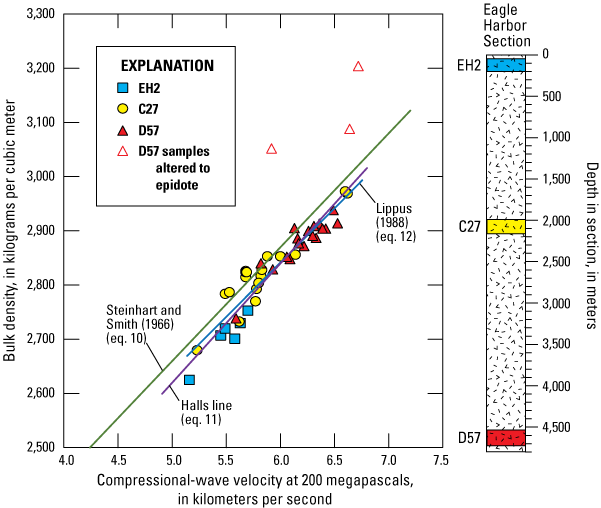
Velocity-density plot for basalt at different stratigraphic levels of Portage Lake Volcanics using data from three boreholes, modified from Lippus (1988). Densities and velocities were measured for core samples from EH2, C27, and D57, drilled near Eagle Harbor at the northern tip of the Keweenaw Peninsula (fig. 3). Each borehole represents a different stratigraphic level within the section (shown schematically). A general increase in both velocity and density can be observed from top (EH2) to bottom (D57) of the section. A best-fit regression line from these data (eq. 12) are compared to the velocity-density equations of Steinhart and Smith (1966; eq. 10) and the Halls line (eq. 11). Data from three samples in borehole D57 that were altered to epidote were not used in the regression calculation. Velocity data shown were measured at a confining pressure of 200 megapascals (MPa).
The velocity-density data from Lippus (1988), using the velocity measured at 200 MPa, cluster well about a linear regression line (R2 of 0.88) corresponding to equation 12.
where (Note that the velocity-density equation reported by Lippus [1988] as a representation of his 200 MPa data is actually derived from his measurements at 220 MPa). Equation 12 is similar to the Halls line (eq. 11) as well as to equation 10 derived from Steinhart and Smith (1966). From an inspection of figure 13, the Halls line can reasonably represent both the Halls (1969) and Lippus (1988) datasets and is preferable because it is derived from diverse samples. The Halls line is also preferable to equation 10 derived from Steinhart and Smith (1966), which does not fit the Lippus data as well (fig. 13).In figure 14, the Halls line representing basalt of the Keweenawan Supergroup is compared to data for other igneous rocks related to the Midcontinent Rift System and to velocity-density data or model computations for similar rock types from other studies. The Christensen and Mooney (1995) data are plotted for multiple depths to demonstrate variability at deeper conditions than what can be achieved from the limited range of pressures used for measuring velocity from the Halls (1969) and Lippus (1988) studies. Their study also has the advantage that densities and velocities were measured at matching confining pressures.
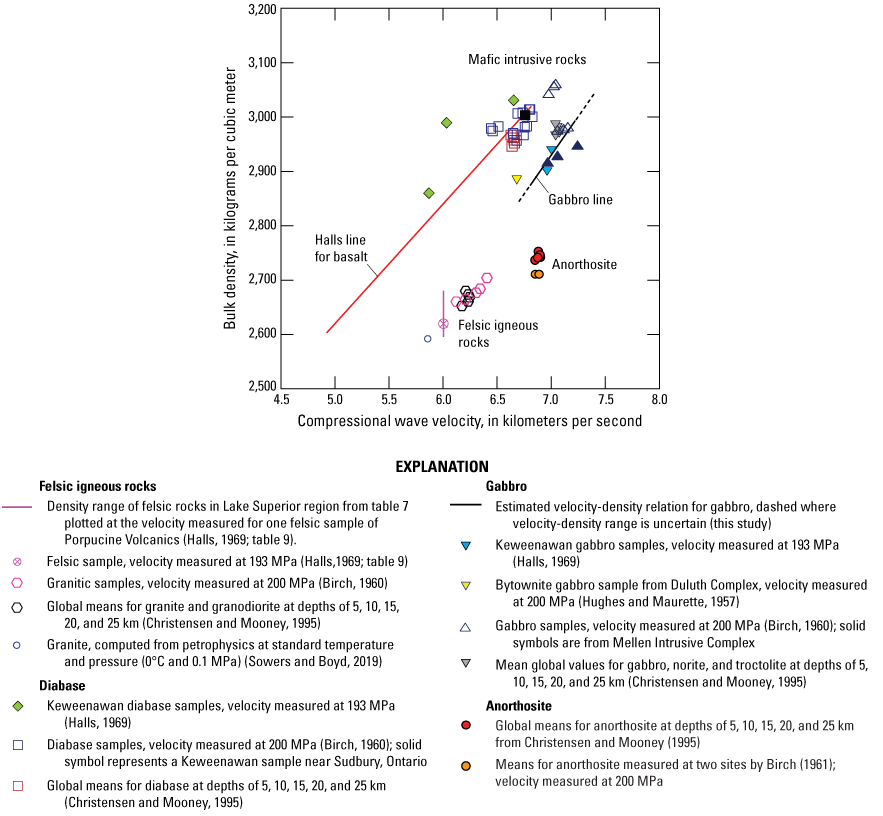
Velocity-density relations for igneous rocks related to the Midcontinent Rift System compared to data for similar rock types from elsewhere. The Halls line is shown as a proxy for basalts of the Keweenawan Supergroup. The gabbro line (eq. 13) represents a trend observed from the data for most of the gabbro samples that is separate from that for basalt and diabase. Where confining pressure is specified for the velocity measurements in the explanation, density was measured at atmospheric conditions. Values plotted for multiple depths or confining pressures are shown to demonstrate the modest variability of velocity and density with depth for these rock types. MPa, megapascals; km, kilometers.
Plots for diabase samples generally follow the Halls line for velocities greater than 6.5 km/s (fig. 14). The wide scatter of two of the Halls (1969) diabase samples compared to the tight clusters from the other studies suggests additional investigation is required. In contrast, velocity and density values for most of the gabbro samples plot significantly away from the Halls line, including the six samples of gabbro related to the Midcontinent Rift System from the Mellen Intrusive and Duluth Complexes (fig. 14). The similar densities for diabase and gabbro yet higher velocity for gabbro have been noted in previous rock physics studies (Birch, 1961; Christensen and Mooney, 1995). Christensen and Mooney (1995) attribute the difference to higher olivine content in gabbro. The similarity in densities for diabase and gabbro of the Midcontinent Rift System is corroborated by histograms of density measured on these two rock types from the Duluth Complex and related rocks that show comparable populations and median values both close to 2,920 kg/m3 (fig. 15). Although high-density outliers do exist (with averages greater than 3,000 kg/m3), they likely represent distinct gabbro intrusions (Chandler, 2002). Thus, the velocity-density plots indicate that a separate velocity-density equation is required to represent the bulk of gabbros in the Midcontinent Rift System. A line qualitatively honoring the gabbro data points that plot away from the Halls line is designated as the gabbro line and is shown as equation 13.
where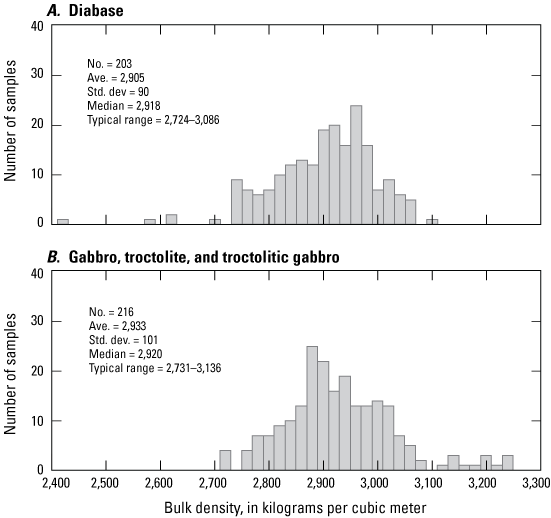
Frequency histograms of density measured for samples of A, diabase versus B, gabbro and related rocks of the Midcontinent Rift in northeastern Minnesota showing similar populations. Data are from Chandler and Lively (2021). Table 1.2 specifies the rock units selected from the database and outliers that were removed before statistical analysis. Typical range was determined from the average plus and minus two standard deviations. Ave., average; No., number of samples used for statistics; Std. dev., standard deviation.
Only one sample of felsic rock related to the Midcontinent Rift System has been measured for both velocity and density (table 9). The single velocity-density point is plotted on figure 14 in combination with the range of density measurements for various felsic igneous rocks from table 7. The data for this sample fall in between those for granitic rocks compiled globally (Birch, 1960; Christensen and Mooney, 1995) and the density and velocity values for granite computed from mineral physics (Sowers and Boyd, 2019), which provide support for using the data from these other studies as a guide for what to expect for felsic igneous rocks related to the Midcontinent Rift System.
As explained at the beginning of this section, velocity-density data for anorthosite from the Lake Superior region are not plotted in figure 14 owing to lack of information. As seen from the plots from other geologic settings, anorthosite has unique properties compared to other igneous rock types, with relatively low densities and high velocities. Two samples of anorthosite xenoliths from the Duluth Complex yield measured densities of 2,640 and 2,680 kg/m3 (Chandler and Lively, 2021; Grauch and Heller, 2021). These densities are substantially lower than what is shown in figure 14, suggesting that further study of the Lake Superior anorthosites may be warranted.
Crystalline Crust
Because geophysical modeling of the Midcontinent Rift System must also deal with the crystalline country rock (fig. 2), developing velocity-density relations for rock types of the Archean and Paleoproterozoic crust is also important. The general rock types that immediately surround and possibly underlie large parts of Lake Superior, in order of regional extent, include Archean crystalline rocks of the Superior Province, Paleoproterozoic crystalline and metasedimentary rocks, and lower Mesoproterozoic sedimentary rocks (figs. 1, 3). The metasedimentary and sedimentary rocks are considered in the section “Older Metasedimentary and Sedimentary Rocks.”
Velocity-density relations for geophysical modeling of Archean and Proterozoic crystalline crust in the Lake Superior region can be examined by way of crustal models for North America, gravity and long-range refraction models for the region, and rock physics studies that measure relevant rock types. Values for these models are compiled for upper, middle, and lower crust and upper mantle in table 10 and plotted against various previously established equations for crystalline crust in figure 16, as well as points for relevant rock types from laboratory studies (Birch, 1961; Christensen and Mooney, 1995).
Table 10.
Velocity and density values for lithospheric layers of the Superior Province, estimated from crustal models.[Depth range generalized from information provided by the reference(s) cited. Depth ranges were too variable to generalize for multiple references and are not applicable for the Mooney and Kaban (2010) and Griffin and others (2003) studies. —, no data; km, kilometers; km/s, kilometers per second; kg/m3, kilograms per cubic meter; >, greater than; °C, degrees Celsius]
| Depth Range (km) | Velocity (km/s) | Density (kg/m3) | Reference(s) | Comment |
|---|---|---|---|---|
| — | — | 2,650–2,750 | Bacon (1966); Hutchinson and others (1990); Hinze and others (1990, 1997); Thomas and Teskey (1994); Mariano and Hinze (1994); Allen and others (1997); Chandler and Lively (1998); Drenth and others (2021) | Range of densities from multiple gravity models or analyses assuming Archean granitic gneiss is representative of the upper crust. Density range is substantiated by measured densities for felsic igneous and metamorphic rocks (table 1.1; fig. 10) |
| 2–15 | 6.2–6.4 | — | Mooney and others, 2002 | Global model for Archean continental crust |
| 0–12 | 6.2 | — | Perry and others, 2002 | LITH5.0 crustal model for Canada near Lake Superior |
| 0–14 | 5.95–6.25 | — | Tesauro and others, 2014 | NACr14 crustal model for Superior Province |
| 0–15 | — | 2,730–2,750 | Kaban and others, 2014 | Estimated for Lake Superior region from their figure showing 3-D model |
| 15–27 | 6.4–6.8 | — | Mooney and others, 2002 | Global model for Archean continents |
| 14–28 | 6.35–6.65 | — | Tesauro and others, 2014 | NACr14 crustal model for Superior Province |
| 15–30 | — | 2,850–2,880 | Kaban and others, 2014 | Estimated for Lake Superior region from their figure showing 3-D model |
| — | — | 2,900–2,920 | Hutchinson and others (1990); Hinze and others (1992, 1997); Mariano and Hinze (1994) | Range of densities from multiple gravity models |
| 27–39 | 6.8–7.2 | — | Mooney and others, 2002 | Global model for Archean continental crust |
| 12–26 | 7.1 | — | Perry and others, 2002 | LITH5.0 crustal model for Canada near Lake Superior |
| 28–42 | 6.60–7.25 | — | Tesauro and others, 2014 | NACr14 crustal model for Superior Craton |
| 30–45 | — | 3,020–3,060 | Kaban and others, 2014 | Estimated for Lake Superior region from their figure showing 3-D model |
| >34 | — | 3,300–3,330 | Hutchinson and others (1990); Hinze and others (1992, 1997); Mariano and Hinze (1994) | Range of densities and depths from multiple gravity models |
| >39 | 7.95–8.32 | — | Mooney and others, 2002 | Global model for Archean continental crust |
| — | — | 3,350 | Mooney and Kaban, 2010 | Average density, from global model |
| >26 | 8.1 | — | Perry and others, 2002 | LITH5.0 crustal model for Canada near Lake Superior |
| >38 | 8.03–8.17 | — | Smith and others, 1966 | Refraction surveys in north-central Wisconsin and upper Michigan |
| — | 8.18–8.34 | 3,310 | Griffin and others, 2003 | Computed from typical Archean sublithospheric mantle mineral compositions. Velocity range represents conditions at the Earth’s surface (8.34) and at depth of 100 km and 700 °C (8.18) |
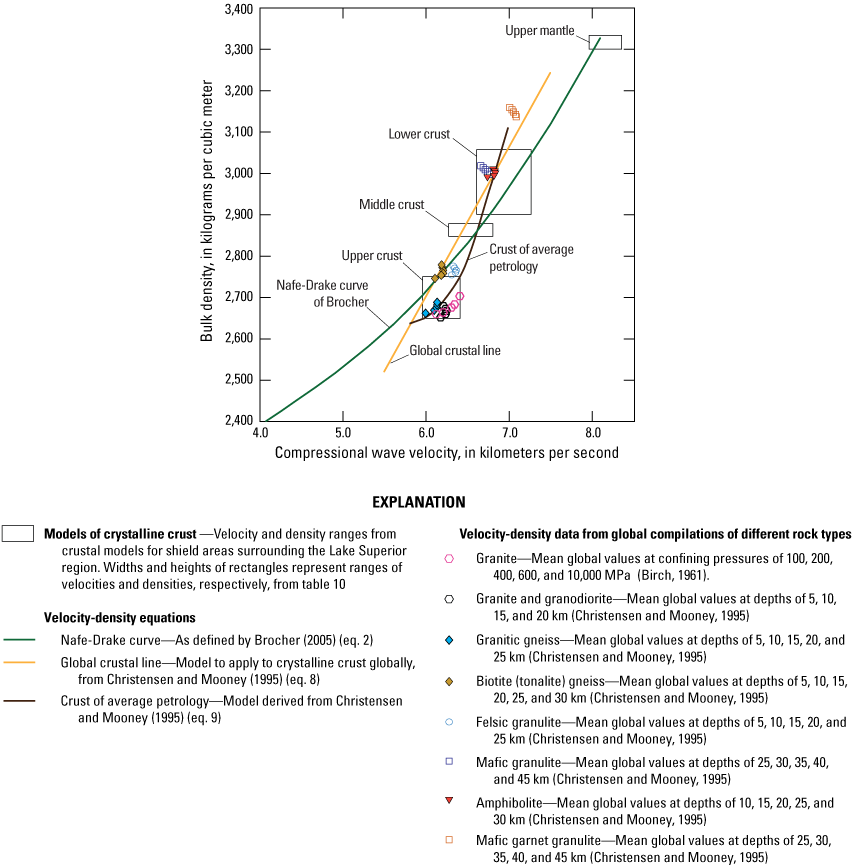
Comparison of velocity-density relations for crustal models considered for use with Archean and Paleoproterozoic crystalline crust in the Lake Superior region. Curves show several previously established empirical and model-based velocity-density relations commonly used to represent crystalline crust. Velocity-density range boxes are from table 10. Also plotted are mean values measured from other studies for various rock types that are expected to occupy different levels of the crust and upper mantle. MPa, megapascals; km, kilometers.
All the previously established velocity-density equations for crystalline crust pass through the rectangles representing the ranges of velocity and density values from the crustal models (fig. 16). However, the one that best matches both the upper and middle crust is equation 9 that was developed for the crust of average petrology from Christensen and Mooney (1995). This curve is also the only one that matches velocity-density points for granitic rocks, which most previous workers consider as representative of the upper Archean crust in the Lake Superior area (for example, Thomas and Teskey, 1994; Hinze and others, 1997; Drenth and others, 2021). Moreover, Perry and others (2002) considered the average petrology model as representative in predicting densities for a crustal model of the Canadian shield.
On the other hand, a simple crustal model that uses single densities for the upper, middle, and lower crust may be preferred where velocity information is unknown or poorly constrained. This approach has worked successfully in multiple gravity models for the Lake Superior region (references cited in table 10). From an inspection of table 10, figure 10, figure 16, and in consideration of the previous gravity models, a reasonable approach is to assign densities of 2,700 kg/m3 to the upper crust, 2,870 kg/m3 to the middle crust, 3,000 kg/m3 to the lower crust, and 3,310 kg/m3 to the upper mantle, with the depths between these layers determined subjectively or from seismic interpretation. Several passive seismic studies provide updated models of the crust and shallow mantle (Shen and others, 2013; Pollitz and Mooney, 2016; Zhang and others, 2016).
Older Metasedimentary and Sedimentary Rocks
Establishing velocity-density relations for metasedimentary rocks that predate the initiation of the Midcontinent Rift System is important to consider separately from the crystalline crust because (1) metasedimentary rock types are likely to have different physical properties than crystalline rocks, and (2) the foreland basins associated with the Penokean orogeny were regional-scale features that are preserved on either side of Lake Superior and presumably underlie the lake as well (fig. 1; Schulz and Cannon, 2007).
Investigating velocity-density relations for these older rocks is difficult because of the lack of velocity data and the heterogeneity of rock types. Figure 17 compares histograms of density data for rocks from the Lake Superior region (fig. 17A) to velocity-density data for similar rock types from elsewhere and the Nafe-Drake curve of Brocher (eq. 2; fig. 17B). A histogram of density measurements for sandstones and siltstones of the lower Mesoproterozoic Sibley Group are included for completeness (fig. 17A), although the volumetric significance of these rocks is unclear. The velocity-density plots for three rock types relevant to the Lake Superior region (metagraywacke, slate, and quartzite) on figure 17B are from the global compilation of Christensen and Mooney (1995). One inferred velocity-density point representing rocks of the Animikie Group comes from Halls and West (1971; fig. 17B). They estimated a typical density of 2,700 kg/m3 for Animikie Group metasedimentary rocks and reported velocities for two samples of slate and graywacke of 5.8 and 6.0 km/s at 30 MPa, respectively, which is represented by a value of 5.9 km/s on figure 17B.
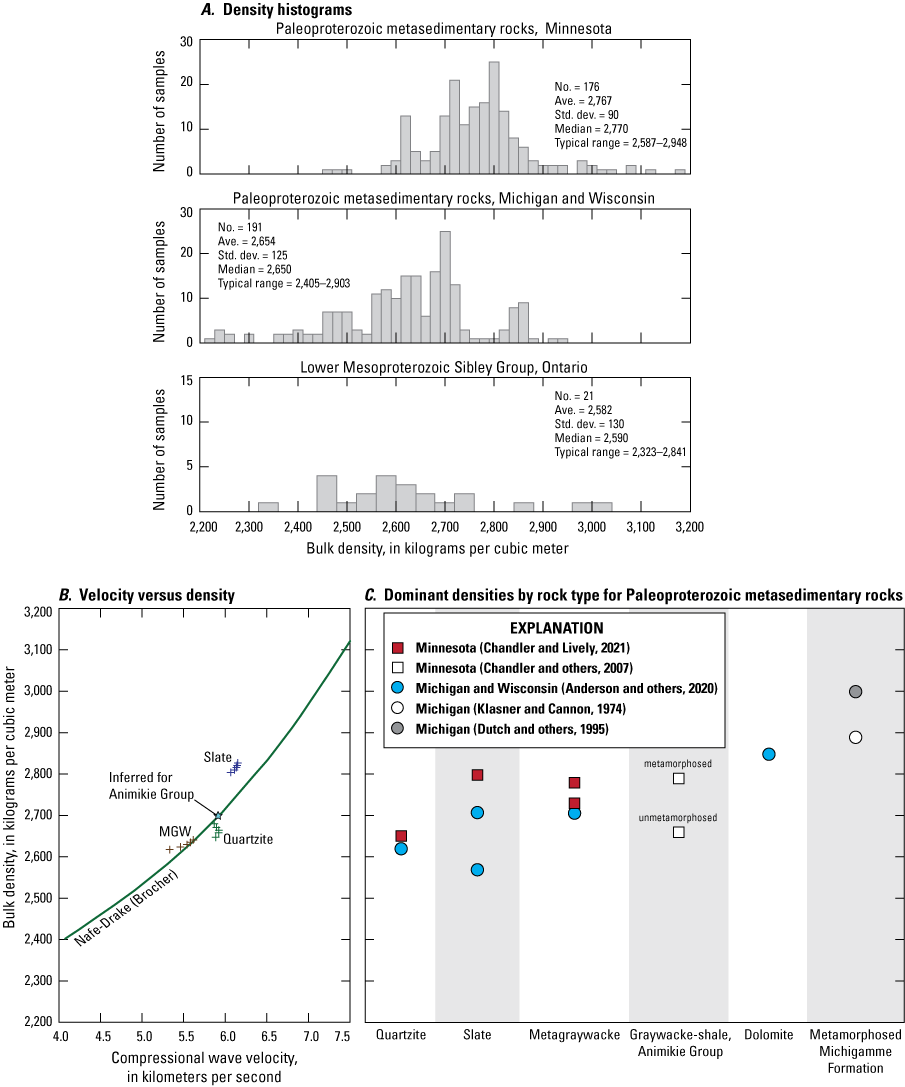
Velocity-density relations and density histograms relevant to metasedimentary and sedimentary rocks that predate the Midcontinent Rift System in the Lake Superior region. In A, frequency histograms of density measurements are shown for Paleoproterozoic metasedimentary rocks from Minnesota (Chandler and Lively, 2021), Michigan and Wisconsin (Anderson and others, 2020), and Lower Mesoproterozoic sedimentary rocks (Sibley Group) from Ontario (Rainsford and others, 2018). Selection criteria and outliers removed before statistical analysis are described in appendix 1, table 1.2. Typical range was determined from the average plus and minus two standard deviations. In B, the Nafe-Drake curve of Brocher (2005) (eq. 2) is plotted against global mean values for slate, metagraywacke (MGW) and quartzite at depths of 5, 10, 15, 20, and 25 kilometers (km) from Christensen and Mooney (1995). Inferred value for the Paleoproterozoic Animikie Group from Minnesota is from Halls and West (1971), explained in the text. In C, dominant densities are plotted for common Paleoproterozoic metasedimentary rock types (quartzite, slate, metagraywacke, graywacke-shale, dolomite) and metamorphosed Michigamme Formation. Michigamme Formation, in the Marquette Range Supergroup, is a heterogenous mixture of metasedimentary rock types. For the Chandler and Lively (2021) and Anderson and others (2020) data, shown in A, the dominant densities are determined from the median of each rock type population or by the median plus the mode for bimodal populations. The density points from the other data sources are average values. No., number of samples used for statistics; Ave., average; Std. dev., standard deviation.
The histograms of measured densities for Paleoproterozoic metasedimentary rocks show wide variation (fig. 17A). This heterogeneity is underscored by the different spread of values displayed by the histograms for Minnesota compared to the one for Michigan and Wisconsin and by the multiple peaks in the histogram plots. The multiple peaks can be partially explained by dissimilar densities for the different metasedimentary lithologies, as demonstrated by the plot of medians or means of subpopulations separated out by rock type (fig. 17C). A predominance of quartzite or metagraywacke can explain density peaks near 2,650 kg/m3 or 2,750 kg/m3, respectively, but the spread of densities for other rock types is large. Moreover, the densities of the Lake Superior rocks differ from those of comparable rock types in the global compilation of Christensen and Mooney (1995; fig. 17B), except for quartzite. The differences in density by rock type raise questions about how representative the rock types used by Christensen and Mooney (1995) are and confirm how the classification of rock types commonly fails to capture the heterogeneity of mineralogy, texture, and the degree of metamorphism that is important for determining physical properties
Faced with heterogeneous density data to compare to a paucity of velocity data, the Nafe-Drake curve is a reasonable choice for representing the Paleoproterozoic metasedimentary rocks. The marine setting of the rocks sampled for the Nafe-Drake curve matches the marine sedimentary environments common during Penokean cratonic margin basin formation (Schulz and Cannon, 2007). Use of the Nafe-Drake curve is buoyed by its proximity to velocity-density points for the inferred Animikie Group and metagraywacke and quartzite from the global compilation (fig. 17B).
Choosing one of the established velocity-density equations for use with the data-poor Sibley Group by comparing geologic settings breaks down because the Sibley Group includes a wide variety of depositional environments, including fluvial, lacustrine, sabkha, delta, and eolian (Rogala and others, 2007). In this case, the Nafe-Drake curve is a practical choice because it matches the relation used for the Paleoproterozoic rocks and thus provides a continuum between all the sedimentary and metasedimentary rocks older than the Midcontinent Rift System.
The wide range of densities for the older metasedimentary and sedimentary rocks of the Midcontinent Rift System makes identifying objective, quantifiable associations between density and velocity challenging. Despite this uncertainty, using the Nafe-Drake curve to represent these rocks helps visualize the range of physical properties that can be expected in relation to other rock types.
Summary of Velocity-Density Relations
Empirical velocity-density relations for the Lake Superior region can be simplified to specific equations and velocity-density criteria based on geologic unit or rock suite. These measures are for ease of use and should be used as guidelines for geophysical modeling. The equations or criteria for each of the groups are summarized in table 11 along with the expected velocity and density ranges. Equations could not be developed for felsic igneous rocks, which may be present in significant volumes at depth under the lake, or for surficial deposits, which cover wide areas. Instead, only target densities and velocities for these materials and for those of the upper mantle are listed. Moreover, two alternate guidelines are presented for crystalline crust: one that relies heavily on accurate velocity information and assumes a certain progression of rock types with depth, and another that views the crust as three discrete layers.
Table 11.
Summary of velocity-density relations chosen to represent rock suites in the Lake Superior region.[Expected ranges are determined by inspection of averages compiled in previous tables or as described. The utility of the chosen velocity-density relations are tested by comparing the expected densities to densities computed from the velocity-density equation using the expected velocity range. Where velocity range is shown in parentheses, velocity can only be estimated by computing the velocity-density equation using the expected density range. All values are rounded to the nearest tenth for velocity and nearest multiple of 50 for density. Crystalline crust is represented by two alternate models, one represented by a single curve, and one represented by multiple layers of the crust. km/s, kilometers per second; kg/m3, kilograms per cubic meter; —, not applicable; MPa, megapascals; >, greater than; km, kilometers]
| Rock suite or geologic group | Velocity-density equation | Expected velocity range (km/s) | Expected density range (kg/m3) | Computed density range (kg/m3) | Comment |
|---|---|---|---|---|---|
| Unconsolidated surficial deposits, saturated | — | 1.4–1.9 | 1,500–2,500 | — | Expected velocity range is from averages from table 4 except that the minimum value reflects the velocity of lake sediments (1.425 km/s) inferred by Johnson (1980). Density range from Kearey and Brooks (1991). |
| Units overlying the Oronto Group | Nafe-Drake curve of Onizawa and others, (eq. 1) | 3.0–4.5 | 2,150–2,550 | 2,200–2,500 | Expected ranges from table 2 and table 5. Anomalous values of well indurated Jacobsville Sandstone are not included. |
| Argillaceous rocks of the Oronto Group | Gardner’s relation (eq. 3) | 3.3–4.5 | 2,350–2,550 | 2,350–2,550 | Expected ranges from table 3 and table 6, except the minimum velocity was chosen to reflect the 3.23 km/s refraction velocity (rounded up) possibly representative of the Freda Sandstone (fig. 9). Likely a continuum with arenaceous Oronto Group rocks |
| Arenaceous rocks of the Oronto Group | Gardner’s relation (eq. 3) | 4.5–5.9 | 2,600–2,700 | 2,550–2,700 | Expected ranges from table 3 and table 6; likely a continuum with argillaceous Oronto Group rocks |
| Basalt of the Keweenawan Supergroup | Halls line (eq. 11) | 5.1–6.8 | 2,650–3,000 | 2,650–3,000 | From table 9 |
| Diabase related to the Midcontinent Rift System | Halls line (eq. 11) | 5.9–7.0 | 2,700–3,100 | 2,800–3,050 | From table 9 and figure 15, except that the velocity maximum is based on the range of 6.85–6.98 km/s measured for diabase from Sudbury, Ontario, at 1,000 MPa (Birch, 1960) to account for depths >8 km. |
| Gabbro related to the Midcontinent Rift System | Gabbro line (eq. 13) | 6.7–7.4 | 2,750–3,150 | 2,850–3,050 | From table 9 and figure 15, except that the maximum velocity is based on the range of 7.11–7.36 km/s measured for gabbro of Mellen Intrusive Complex at 1,000 MPa by Birch (1960) to account for depths >8 km |
| Felsic igneous rocks related to the Midcontinent Rift System | — | 6.0–6.4 | 2,600–2,700 | — | Range of values estimated from velocity-density plots of granitic rock types (fig. 14) |
| Older sedimentary and metasedimentary rocks | Nafe-Drake curve of Brocher (eq. 2) | (3.4–6.9) | 2,300–2,950 | — | Range of densities for all areas estimated from figure 17, then velocity range determined from eq. 2 |
| Crystalline crust represented as average petrology | Crust of average petrology (eq. 9) | 5.8–7.0 | 2,650–3,100 | 2,650–3,150 | Range of values at 0–40 km depth from figure 5 |
| Crystalline crust represented as layers: Upper crust | — | 6.0–6.4 | 2,700 | — | Velocity range estimated from table 10; density from common value observed from figure 10 |
| Crystalline crust represented as layers: Middle crust | — | 6.4–6.8 | 2,870 | — | Ranges of velocities and single density estimated from table 10 |
| Crystalline crust represented as layers: Lower crust | — | 6.6–7.3 | 3,000 | — | Ranges of velocities and single density estimated from table 10 |
| Upper mantle | — | 8.0–8.3 | 3,300–3,350 | — | Ranges of values from table 10 |
The graphical view of the velocity-density relations (fig. 18) underscores the dissimilarities of relations between the rock suites and geologic groups as well as the overlaps in velocity and density ranges. This view of the relations and the expected ranges for each group from table 11 can help guide geophysical modeling and geologic interpretation of seismic and gravity data. For example, if a velocity of 5.5 km/s is observed, the most likely candidates based on velocity range (table 11) and their corresponding densities would be basalt if 2,730 kg/m3, Oronto Group if 2,670 kg/m3, or older metasedimentary or sedimentary rocks if 2,620 kg/m3. The possibilities could presumably be tested by gravity modeling. The ranges of velocity and density also can be used to determine the most likely candidates for geologic interpretation. For example, if velocities are greater than 7.0 km/s, the most likely candidate is gabbro. If the velocities are less than 3.3 km/s or densities less than 2,300 kg/m3, the most likely candidate is one of the units overlying the Oronto Group. Velocities greater than 5.9 km/s are not likely related to Keweenawan sedimentary rocks.
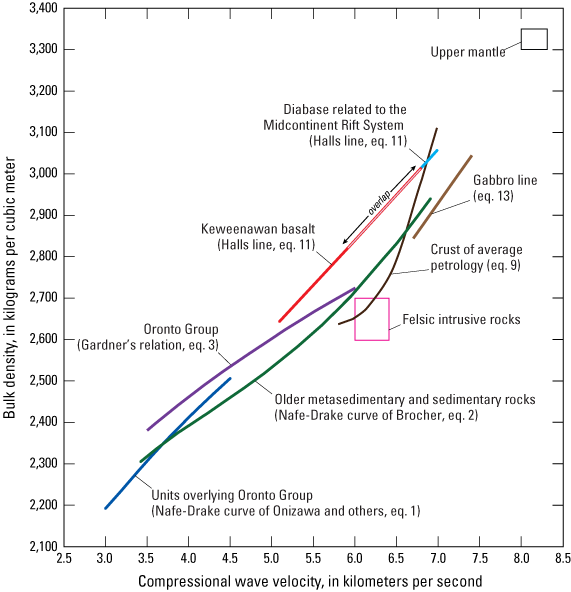
Velocity-density relations from table 11 summarized graphically for all rock suites except unconsolidated deposits and the layered model of crystalline crust. Gardner’s relation (eq. 3) is from Gardner and others (1974); the Halls line (eq. 11) is from Halls (1969); the two Nafe-Drake curves (eqs. 1 and 2) are defined separately for different velocity ranges by Onizawa and others (2002) and Brocher (2005), respectively; and the relation for the crust of average petrology (eq. 9; fig. 5) was derived from the data of Christensen and Mooney (1995).
Discussion
This section presents discussions on two topics. One topic concentrates on the uncertainties underlying the inferred velocity-density relations and the avenues for future work that could improve these uncertainties. Another topic focuses on the implications of the current results for seismic interpretation related to correlating seismic velocity to geology.
Uncertainties in the Inferred Velocity-Density Relations
The guides presented herein are intended to be useful as representations of the physical properties of the different rock suites, but the representations are limited for several reasons. First, there is not a one-to-one correspondence between geologic units and density or velocity. For example, sedimentary units commonly vary in lithology, grain size, and degree of induration or compaction over a wide geographic area, even if they are of similar age. An example from the Lake Superior area comes from the St. Amour well near Munising, Michigan (fig. 3), wherein the stratigraphy below the Freda Sandstone could not be correlated with Oronto Group known elsewhere (Ojakangas and Dickas, 2002). Another example are the anomalous, well-indurated samples of Jacobsville Sandstone that were collected near Sault Ste. Marie that are discussed in the section on velocity-density relations for sedimentary rocks of the Keweenawan Supergroup. This problem is a fundamental limitation to geophysical modeling of geologic units and is not unique to this study.
Second, the lack of velocity information limits the ability to confidently determine velocity-density relations, especially for metasedimentary and sedimentary rocks. For example, the limited velocity data for the units overlying the Oronto Group leads to tentative conclusions about velocity-density relations and prevents investigation of differences between the formations. As another example, the expected velocity and density ranges for metasedimentary and sedimentary rocks older than the Midcontinent Rift System span almost the entire ranges of all rock types combined. These substantial ranges are in large part due to the wide variety of rock types and degree of metamorphism within the rock suite. Moreover, in the velocity range of 5.8–6.9 km/s, the velocity-density relation inferred to represent the older rocks is similar to that of the model of crystalline crust estimated from average petrology. There is enough uncertainty in both models that crust composed of crystalline versus metasedimentary rock cannot be confidently distinguished using these guidelines.
Finally, how well velocity and density measurements from rock samples represent the bulk physical properties of large volumes measured by geophysical methods is unclear. Samples collected only from outcrops may not provide an adequate representation of variability with depth. Moreover, velocity varies within one basalt flow (Christensen and Wilkens, 1982; Planke and others, 2000), which begs the question of whether (1) enough samples are present to represent the breadth of this variation, (2) if this variability is maintained at depth, and (3) how the variability translates into a bulk average at depth when geophysical methods cannot resolve the variations. Velocity also can vary due to microfractures or seismic anisotropy without an accompanying difference in density (Mavko and others, 2020). Variations in average velocity or density with depth also may be due to mixtures of rock types rather than variability within one type or may be due to rock types that are not anticipated from our current understandings.
Additional velocity measurements on rock samples and perhaps short-range seismic refraction experiments where geology is well known could help reduce the shortage of velocity data. Rock types having the least data are felsic igneous rocks and anorthosite related to the Midcontinent Rift System as well as older metasedimentary and sedimentary rocks. Although sufficient density data are available for the Paleoproterozoic rocks, additional velocity measurements need to be tied directly to measured density to make sense of velocity-density relations. An investigation into the physical properties of the Jacobsville Sandstone samples found near Sault Ste. Marie could help understand why they are anomalous, but probably would have to be accompanied by detailed study of lithologic variations of the formation. Finally, the unique properties and presence of anorthosite, both within layers of the Duluth Complex and as separate bodies brought to the surface as xenoliths, may warrant further investigation.
Implications for Seismic Interpretation
The table summarizing typical velocity ranges by rock type (table 11) can be used to address the differences in interpretation of basalt versus gabbro between earlier seismic refraction and reflection studies (presented in the “Introduction” section). Basalt, diabase, and gabbro have expected velocity ranges of 5.1–6.8, 5.9–7.0, and 6.7–7.4 km/s, respectively, which overlap. Using these ranges, velocities of 6.6–6.9 km/s consistently found for depths from approximately 10 km down to the Moho across Lake Superior from earlier seismic refraction studies (Berry and West, 1966; Smith and others, 1966; O’Brien, 1968; Ocola and Meyer, 1973; Luetgert and Meyer, 1982) could be interpreted as average velocities over large volumes of basalt, diabase, and gabbro. Basalt, possibly mixed with diabase, is more likely where these velocities correspond to strong, semihorizontal layering in the GLIMPCE seismic-reflection sections (Cannon and others, 1989; Green and others, 1989). However, velocities of 6.9–7.1 km/s associated with similar layered intervals at depths of 10–20 km for GLIMPCE Line A (fig. 3) are too high to represent basalt, as was presented by Tréhu and others (1991) and Shay and Tréhu (1993). The velocities are more consistent with an interpretation of diabase and gabbro. Metamorphism of basalt at these depths can only explain velocities as high as 6.9 km/s, assuming basalt in this region metamorphoses through amphibole replacement and velocity increases with greater amphibole content (Halls, 1969). If so, the maximum velocity for metamorphosed basalt would be represented by the velocity of amphibolite, which ranges from 6.7 to 6.9 km/s at depths of 10–20 km (Christensen and Mooney, 1995). Alternatively, basalt flows that are thick enough to develop a pegmatitic internal zone may resemble diabase, as Huber (1973, 1975) observed for several basalt flows on Isle Royale. If so, perhaps the coarse-grained layers would increase basalt velocities to 6.9–7.0 km/s without complete replacement by amphibole.
Thus, geologic interpretations of layered intervals with velocities greater than 6.9 km/s in seismic-reflection profiles may need to be reassessed. If the intervals represent mafic intrusions rather than basalt, then their layered character becomes significant and lacks current explanation. If they represent amphibolite in places, the metamorphic history is poorly understood, because amphibolite is not observed in outcrop.
Geologic interpretation of the seismic refraction study of Mooney and others (1970a, 1970b) could be reassessed as well. Overlaps in velocities between Freda Sandstone and Bayfield Group and between Copper Harbor Conglomerate and basalt led to misinterpretation of geologic units for at least one of their refraction models in the Lake Superior region (fig. 9). These ambiguities may have affected additional interpretations in their study area farther to the southwest.
Conclusions
Compressional-wave seismic velocity (velocity) and bulk density (density) data were compiled from previous work for several rock suites that are significant for geophysical modeling of the Midcontinent Rift System in the Lake Superior region. Representative velocity-density relations were developed for each rock suite by comparing the observed data to previously established velocity-density relations, laboratory data for similar rock types from elsewhere, global crustal models, and previously published geophysical analyses. The graphical representations of the resulting relations provide a way to easily understand how velocity and density differ between tectonic setting and by rock type, as exemplified by differences between Archean crust, mafic igneous rocks, and sedimentary units. Several observations from the velocity-density relations and expected ranges of values can be made:
-
• Using the velocity-density relations instead of one velocity and one density to characterize a geologic unit allows for a more comprehensive understanding of the natural variability within one rock type and accommodates variations of physical properties with depth.
-
• Measured seismic velocities or densities determined from gravity modeling can be quickly assessed to determine which rock suites are most appropriate for geologic interpretation and which can be ruled out.
-
• Overlaps in velocity or density ranges between geologic units are significant and have important implications for geologic interpretation of the geophysical data. Density differences between the suites that have overlapping velocity ranges provide a rationale for using gravity models to distinguish between them. Important instances of these overlaps include the following:
-
◦ Argillaceous rocks of the Oronto Group (mainly Freda Sandstone) have velocities similar to those of units overlying the Oronto Group in the range of 3.3–4.5 kilometers per second (km/s), but argillaceous Oronto Group rocks have higher densities and may be significantly thicker.
-
◦ Arenaceous rocks of the Oronto Group (mainly Copper Harbor Conglomerate) have velocities similar to those of basalt of the Keweenawan Supergroup in the range of 5.1–5.9 km/s, but the basalt has higher densities.
-
◦ Diabase has similar densities to those of gabbro in the range of 2,750–3,100 kilograms per cubic meter (kg/m3), but gabbro has higher velocities.
-
-
• Basalt, diabase, and gabbro have expected velocity ranges of 5.1–6.8, 5.9–7.0, and 6.7–7.4 km/s, respectively, which overlap. Velocities on the order of 6.8–6.9 km/s at depths of 10–20 km cannot be explained by metamorphosed basalt of the Keweenawan Supergroup unless the basalt has been completely altered to amphibolite or basalt flows are sufficiently thick to have pegmatitic interiors. Gabbro is the only mafic igneous rock type that has measured velocities greater than 7.0 km/s.
-
• Several previous seismic-reflection studies interpret intervals with well-defined layering and refraction velocities of 6.9–7.1 km/s as basalt. These velocities are more consistent with an interpretation of diabase or gabbro, which may warrant reanalysis of these lines.
The inferred velocity-density relations and expected ranges of velocities and densities for the Lake Superior region presented herein are simple guidelines best used for interpreting seismic and gravity data at basin-wide scales. The equations and graphical views of the relations provide a simplified perspective of how the velocities and densities of different rock suites are related to each other for interpretative purposes. They can also be used to derive density from velocity or vice versa to develop initial models. The guides are valuable for the Lake Superior area, where data from a number of offshore seismic refraction and seismic-reflection studies—as well as regional gravity and other geophysical data—are available and new concepts of the Midcontinent Rift System continue to develop.
References Cited
Allen, D.J., and Chandler, V.W., 1993, Magnetic properties of the Midcontinent rift volcanics at Osseo, Minnesota—Clues to the origin of aeromagnetic anomalies [abs.], in Institute on Lake Superior Geology, 39th Annual Meeting, Eveleth, Minn., May 5–8, 1993, Proceedings part 1—Program and abstracts: Evelith, Minn., 39th Institute on Lake Superior Geology, v. 39, p. 2–3, accessed July 17, 2020, at https://digitalcollections.lakeheadu.ca/exhibits/show/ilsg/item/2915.
Allen, D.J., Hinze, W.J., Dickas, A.B., and Mudrey, M.G., Jr., 1997, Integrated geophysical modeling of the North American Midcontinent Rift System—New interpretations for western Lake Superior, northwestern Wisconsin, and eastern Minnesota, in Ojakangas, R.W., Dickas, A.B., and Green, J.C., eds., Middle Proterozoic to Cambrian rifting, central North America: Boulder, Colo., Geological Society of America, Geological Society of America Special Paper 312, p. 47–72. [Also available at https://doi.org/10.1130/0-8137-2312-4.47.]
Anderson, E.D., Drenth, B.J., Woodruff, L.G., Cannon, W.F., and Schulz, K.J., 2020, Density and magnetic susceptibility measurements on Precambrian rocks in the Iron Mountain-Menominee region, Michigan-Wisconsin: U.S. Geological Survey data release, accessed January 12, 2021, at https://doi.org/10.5066/P9NE2ACV.
Anderson, E.D., and Grauch, V.J.S., 2018, Updated aeromagnetic and gravity anomaly compilations and elevation-bathymetry models over Lake Superior: U.S. Geological Survey data release, accessed October 2, 2018, at https://doi.org/10.5066/F7F18X8S.
Annells, R.N., 1974, Keweenawan volcanic rocks of Michipicoten Island, Lake Superior, Ontario—An eruptive centre of Proterozoic age: Geological Survey of Canada Bulletin, v. 218, 156 p., accessed April 12, 2019, at https://doi.org/10.4095/103500.
Barton, P.J., 1986, The relationship between seismic velocity and density in the continental crust—A useful constraint?: Geophysical Journal International, v. 87, no. 1, p. 195–208, accessed July 15, 2020, at https://doi.org/10.1111/j.1365-246X.1986.tb04553.x.
Baumann, S.D.J., Cory, A.B., and Dylka, S.K., 2016, Lithostratigraphic interpretation and redefinition of the sedimentary clastic assemblage (Bayfield Group, and Jacobsville Sandstone) in Michigan and Wisconsin, USA and Ontario, Canada: Stratigraphy, v. 13, no. 3, p. 163–181, accessed August 28, 2017, at https://doi.org/10.29041/strat.13.3.163-181.
Bedrosian, P.A., 2016, Making it and breaking it in the Midwest—Continental assembly and rifting from modeling of EarthScope magnetotelluric data: Precambrian Research, v. 278, p. 337–361, accessed August 5, 2016, at https://doi.org/10.1016/j.precamres.2016.03.009.
Bedrosian, P.A., 2019, Multi-scale AEM and MT mapping of the Precambrian in Upper Michigan, Northern Wisconsin, and Eastern Minnesota, in Puumala, M., ed., Institute on Lake Superior Geology, 65th Annual Meeting, Terrace Bay, Ontario, May 8–9, 2019, Proceedings part 1—Program and abstracts: Terrace Bay, Ontario, 65th Institute on Lake Superior Geology, v. 65, p. 6–7, accessed May 30, 2021, at https://digitalcollections.lakeheadu.ca/exhibits/show/ilsg/item/2943.
Berry, M.J., and West, G.F., 1966, An interpretation of the first-arrival data of the Lake Superior experiment by the time-term method: Bulletin of the Seismological Society of America, v. 56, no. 1, p. 141–171, accessed March 31, 2017, at https://doi.org/10.1785/BSSA0560010141.
Bickford, M.E., Wooden, J.L., Bauer, R.L., and Schmitz, M.D., 2007, Paleoarchean gneisses in the Minnesota River Valley and northern Michigan, USA, in Van Kranendonk, M.J., Smithies, R.H., and Bennett, V.C., eds., Earth’s oldest rocks (1st ed.): Boston, Elsevier Science, Developments in Precambrian Geology, v. 15, p. 731–750.
Birch, F., 1954, Thermal conductivity, climatic variation, and heat flow near Calumet, Michigan: American Journal of Science, v. 252, no. 1, p. 1–25, accessed October 23, 2019, at https://doi.org/10.2475/ajs.252.1.1.
Birch, F., 1960, The velocity of compressional waves in rocks to 10 kilobars—Part 1: Journal of Geophysical Research, v. 65, no. 4, p. 1083–1102, accessed April 13, 2017, at https://doi.org/10.1029/JZ065i004p01083.
Birch, F., 1961, The velocity of compressional waves in rocks to 10 kilobars—Part 2: Journal of Geophysical Research, v. 66, no. 7, p. 2199–2224, accessed April 13, 2017, at https://doi.org/10.1029/JZ066i007p02199.
Boyd, O.S., 2020, Calibration of the U.S. Geological Survey National Crustal Model: U.S. Geological Survey Open-File Report 2020–1052, 23 p., accessed September 24, 2021, at https://doi.org/10.3133/ofr20201052.
Brocher, T.M., 2005, Empirical relations between elastic wavespeeds and density in the Earth’s crust: Bulletin of the Seismological Society of America, v. 95, no. 6, p. 2081–2092, accessed August 19, 2016, at https://doi.org/10.1785/0120050077.
Cannon, W.F., 1994, Closing the Midcontinent rift—A far-field effect of Grenvillian compression: Geology, v. 22, no. 2, p. 155–158, accessed July 20, 2017, at https://doi.org/10.1130/0091-7613(1994)022<0155:COTMRA>2.3.CO;2.
Cannon, W.F., Green, A.G., Hutchinson, D.R., Lee, M., Milkereit, B., Behrendt, J.C., Halls, H.C., Green, J.C., Dickas, A.B., Morey, G.B., Sutcliffe, R., and Spencer, C., 1989, The North American Midcontinent rift beneath Lake Superior from GLIMPCE seismic reflection profiling: Tectonics, v. 8, no. 2, p. 305–332, accessed October 24, 2014, at https://doi.org/10.1029/TC008i002p00305.
Cannon, W.F., and Hinze, W.J., 1992, Speculations on the origin of the North American Midcontinent rift: Tectonophysics, v. 213, no. 1–2, p. 49–55, accessed September 13, 2013, at https://doi.org/10.1016/0040-1951(92)90251-Z.
Cannon, W.F., and Nicholson, S.W., 1992, Revisions of stratigraphic nomenclature within the Keweenawan Supergroup of northern Michigan: U.S. Geological Survey Bulletin, v. 1970–A, p. A1–A8, accessed June 29, 2021, at https://doi.org/10.3133/b1970AB.
Cannon, W.F., and Nicholson, S.W., 1996, Middle Proterozoic Midcontinent rift system, in Sims, P.K., and Carter, L.M.H., eds., Archean and Proterozoic geology of the Lake Superior region, U.S.A., 1993: U.S. Geological Survey Professional Paper 1556, p. 60–67. [Also available at https://pubs.er.usgs.gov/publication/pp1556.]
Cannon, W.F., and Nicholson, S.W., 2001, Geologic map of the Keweenaw Peninsula and adjacent area, Michigan, U.S. Geological Survey Geologic Investigations Series Map I-2696, scale 1:100,000, accessed March 9, 2015, at https://doi.org/10.3133/i2696.
Cannon, W.F., Nicholson, S.W., Woodruff, L.G., Hedgman, C.A., and Schulz, K.J., 1995, Geologic map of the Ontonagon and part of the Wakefield 30ʹ × 60ʹ quadrangles, Michigan: U.S. Geological Survey Miscellaneous Investigations Map I–2499, scale 1:100,000, accessed April 22, 2015, at https://doi.org/10.3133/i2499.
Cannon, W.F., Schulz, K.J., Ayuso, R.A., and Mroz, T.H., 2018, Archean and Paleoproterozoic geology of the Felch District, Central Dickinson County, Michigan, in Stewart, E., ed., Institute on Lake Superior Geology, 64th Annual Meeting, Iron Mountain, Mich., May 15–18, 2018, Proceedings part 2—Field trip guidebooks: Iron Mountain, Mich., 64th Institute on Lake Superior Geology, v. 64, p. 1–38. [Also available at https://digitalcollections.lakeheadu.ca/exhibits/show/ilsg/item/2942].
Cannon, W.F., Schulz, K.J., and Drenth, B.J., 2019, The Dickinson Group in the central Upper Peninsula of Michigan—Part 1—Age and tectonic setting based on new geophysical, geochronological, and geochemical data, in Puumala, M., ed., Institute on Lake Superior Geology, 65th Annual Meeting, Terrace Bay, Ontario, May 8–9, 2019, Proceedings part 1—Program and abstracts: Terrace Bay, Ontario, 65th Institute on Lake Superior Geology, v. 65, p. 22–23, accessed October 5, 2019, at https://digitalcollections.lakeheadu.ca/exhibits/show/ilsg/item/2943.
Cannon, W.F., Woodruff, L.G., Nicholson, S.W., and Hedgman, C.A., 1996, Bedrock geologic map of the Ashland and the northern part of the Ironwood 30ʹ × 60ʹ quadrangles, Wisconsin and Michigan: U.S. Geological Survey Scientific Investigations Map I–2566, scale 1:100,000, accessed March 26, 2014, at https://doi.org/10.3133/i2566.
Card, K.D., 1990, A review of the Superior Province of the Canadian Shield, a product of Archean accretion: Precambrian Research, v. 48, no. 1–2, p. 99–156, accessed May 26, 2021, at https://doi.org/10.1016/0301-9268(90)90059-Y.
Castagna, J.P., Batzle, M.L., and Kan, T.K., 1993, Rock physics—The link between rock properties and AVO response, in Castagna, J.P., and Backus, M., eds., Offset-dependent reflectivity—Theory and practice of AVO analysis: Society of Exploration Geophysicists, Investigations in Geophysics, v. 8, p. 135–171.
Chandler, V.W., 2002, Geophysical characteristics of the Duluth Complex and associated rocks, in Miller, J.D., Jr., Green, J.C., Severson, M.J., Chandler, V.W., Hauck, S.A., Peterson, D.M., and Wahl, T.E., Geology and mineral potential of the Duluth Complex and related rocks of northeastern Minnesota: Minnesota Geological Survey Report of Investigations 58, p. 52–75, accessed March 31, 2017, at https://conservancy.umn.edu/handle/11299/58804.
Chandler, V.W., Boerboom, T.J., and Jirsa, M.A., 2007, Penokean tectonics along a promontory-embayment margin in east-central Minnesota: Precambrian Research, v. 157, no. 1–4, p. 26–49, accessed March 26, 2014, at https://doi.org/10.1016/j.precamres.2007.02.009.
Chandler, V.W., and Jirsa, M.A., 2021, Three-dimensional geologic mapping of Precambrian rocks in Minnesota—The creation of “removeable” geologic layers using gravity and magnetic data interpretation, in Institute on Lake Superior Geology, 67th Annual Meeting [virtual events], May 11, 14, 18, and 21, 2021, Proceedings part 1—Program and abstracts: 67th Institute on Lake Superior Geology, v. 67, p. 9–10, accessed May 5, 2021, at https://digitalcollections.lakeheadu.ca/exhibits/show/ilsg/item/3063.
Chandler, V.W., and Lively, R.S., 1998, Gravity and magnetic modeling of the Duluth Complex in the Allen 7.5 minute quadrangle, St. Louis County, Minnesota: Minnesota Geological Survey Miscellaneous Map Series Map M–90, accessed April 23, 2021, at https://conservancy.umn.edu/handle/11299/56999.
Chandler, V.W., and Lively, R.S., 2021, Rock properties database, updated 2021—Density, magnetic susceptibility, and natural remanent magnetization of rocks in Minnesota: Minnesota Geological Survey database, accessed November 4, 2021, at https://doi.org/10.13020/D63S3D.
Christensen, N.I., and Fountain, D.M., 1975, Constitution of the lower continental crust based on experimental studies of seismic velocities in granulite: Geological Society of America Bulletin, v. 86, no. 2, p. 227–236, accessed February 16, 2021 at https://doi.org/10.1130/0016-7606(1975)86<227:COTLCC>2.0.CO;2.
Christensen, N.I., and Mooney, W.D., 1995, Seismic velocity structure and composition of the continental crust—A global view: Journal of Geophysical Research, v. 100, no. B6, p. 9761–9788, accessed May 27, 2020, at https://doi.org/10.1029/95JB00259.
Christensen, N.I., and Salisbury, M.H., 1975, Structure and constitution of the lower oceanic crust: Reviews of Geophysics, v. 13, no. 1, p. 57–86, accessed December 19, 2020, at https://doi.org/10.1029/RG013i001p00057.
Christensen, N.I., and Wilkens, R.H., 1982, Seismic properties, density, and composition of the Icelandic crust near Reydarfjördur: Journal of Geophysical Research, v. 87, no. B8, p. 6389–6395, accessed January 12, 2021, at https://doi.org/10.1029/JB087iB08p06389.
Craddock, J.P., Rainbird, R.H., Davis, W.J., Davidson, C., Vervoort, J.D., Konstantinou, A., Boerboom, T., Vorhies, S., Kerber, L., and Lundquist, B., 2013, Detrital zircon geochronology and provenance of the Paleoproterozoic Huron (~2.4–2.2 Ga) and Animikie (~2.2–1.8 Ga) basins, southern Superior province: The Journal of Geology, v. 121, no. 6, p. 623–644, accessed May 30, 2021, at https://doi.org/10.1086/673265.
Daniels, P.A., Jr., 1982, Upper Precambrian sedimentary rocks—Oronto Group, Michigan-Wisconsin, chap. 7C of Wold, R.J., and Hinze, W.J., eds., Geology and tectonics of the Lake Superior basin: Boulder, Colo., Geological Society of America, Geological Society of America Memoir 156, p. 107–133. [Also available at https://doi.org/10.1130/MEM156-p107.]
Daniels, P.A., Jr., 1999, Stratigraphy and lithology of Keweenawan sedimentary rocks penetrated by the Terra-Patrick #7–22 borehole, Bayfield County, Wisconsin, chap. 7 of Dickas, A.B., and Mudrey, M.G., Jr., eds., Terra-Patrick #7–22 deep hydrocarbon test, Bayfield County, Wisconsin—Investigations and final report: Wisconsin Geological and Natural History Survey Miscellaneous Paper 97–1, p. 75–86.
Dell, C.K., 1975, Relationships of till to bed rock in the Lake Superior region: Geology, v. 3, no. 10, p. 563–564. [Also available at https://doi.org/10.1130/0091-7613(1975)3<563:ROTTBR>2.0.CO;2.]
Dickas, A.B., 1986, Comparative Precambrian stratigraphy and structure along the Midcontinent Rift: American Association of Petroleum Geologists Bulletin, v. 70, no. 3, p. 225–238, accessed July 11, 2016, at https://doi.org/10.1306/9488566A-1704-11D7-8645000102C1865D.
Dickas, A.B., 1999, Exploration for hydrocarbon along the Midcontinent Rift System trend of Wisconsin and the Lake Superior basin—1983–92, chap. 5 of Dickas, A.B., and Mudrey, M.G., Jr., eds., Terra-Patrick #7-22 deep hydrocarbon test, Bayfield County, Wisconsin: Wisconsin Geological and Natural History Survey Miscellaneous Paper 97–1, p. 45–63.
Drenth, B.J., Cannon, W.F., Schulz, K.J., and Ayuso, R.A., 2021, Geophysical insights into Paleoproterozoic tectonics along the southern margin of the Superior Province, central Upper Peninsula, Michigan, USA: Precambrian Research, v. 359, article 106205, accessed April 21, 2021, at https://doi.org/10.1016/j.precamres.2021.106205.
Dutch, S.I., Boyle, R.C., Jones-Hoffbeck, S.K., and Vandenbush, S.M., 1995, Density and magnetic susceptibility of Wisconsin rock: Geoscience Wisconsin, v. 15, p. 53–70, accessed November 17, 2016, at https://wgnhs.wisc.edu/catalog/publication/000232/resource/gs15a05.
Gardner, G.H.F., Gardner, L.W., and Gregory, A.R., 1974, Formation velocity and density—The diagnostic basics for stratigraphic traps: Geophysics, v. 39, no. 6, p. 770–780. [Also available at https://doi.org/10.1190/1.1440465.]
Grauch, V.J.S., Anderson, E.D., Heller, S.J., Stewart, E.K., and Woodruff, L.G., 2020, Integrated geophysical analysis provides an alternate interpretation of the northern margin of the North American Midcontinent Rift System, central Lake Superior: Interpretation, v. 8, no. 4, p. SS63–SS85. [Also available at https://doi.org/10.1190/INT-2019-0262.1.]
Grauch, V.J.S., and Heller, S.J., 2021, Integration of geophysical evidence indicates that anorthosite composes a significant portion of Grand Marais ridge, an inferred basement high in western Lake Superior, in Institute on Lake Superior Geology, 67th Annual Meeting [virtual events], May 11, 14, 18, and 21, 2021, Proceedings part 1—Program and abstracts: 67th Institute on Lake Superior Geology, v. 67, p. 29–30, accessed June 1, 2021, at https://digitalcollections.lakeheadu.ca/items/show/3063.
Green, A.G., Cannon, W.F., Milkereit, B., Hutchinson, D.R., Davidson, A., Behrendt, J.C., Spencer, C., Lee, M.W., Morel-à-l’Huissier, P., and Agena, W.F., 1989, A “GLIMPCE” of the deep crust beneath the Great Lakes, in Mereu, R.F., Mueller, S., and Fountain, D.M., eds., Properties and processes of Earth’s lower crust: Washington, D.C., American Geophysical Union, Geophysical Monograph Series 51, p. 65–80. [Also available at https://doi.org/10.1029/GM051p0065.]
Green, J.C., 1982, Geology of Keweenawan extrusive rocks, chap. 5 of Wold, R.J., and Hinze, W.J., eds., Geology and tectonics of the Lake Superior basin: Boulder, Colo., Geological Society of America, Geological Society of America Memoir 156, p. 47–55. [Also available at https://doi.org/10.1130/MEM156-p47.]
Green, J.C., 1983, Geological and geochemical evidence for the nature and development of the middle Proterozoic (Keweenawan) Midcontinent rift of North America: Tectonophysics, v. 94, no. 1–4, p. 413–437, accessed July 9, 2019, at https://doi.org/10.1016/0040-1951(83)90027-6.
Green, J.C., 1989, Physical volcanology of mid-Proterozoic plateau lavas—The Keweenawan North Shore Volcanic Group, Minnesota: Geological Society of America Bulletin, v. 101, no. 4, p. 486–500, accessed May 31, 2021, at https://doi.org/10.1130/0016-7606(1989)101<0486:PVOMPP>2.3.CO;2.
Green, J.C., 2002, Volcanic and sedimentary rocks of the Keweenawan Supergroup in northeastern Minnesota, in Miller, J.D., Jr., Green, J.C., Severson, M.J., Chandler, V.W., Hauck, S.A., Peterson, D.M., and Wahl, T.E., Geology and mineral potential of the Duluth Complex and related rocks of northeastern Minnesota: Minnesota Geological Survey Report of Investigations 58, p. 94–105, accessed March 31, 2017, at https://conservancy.umn.edu/handle/11299/58804.
Green, J.C., Bornhorst, T.J., Chandler, V.W., Mudrey, M.G., Jr., Meyers, P.E., Pesonen, L., and Wilband, J.T., 1987, Keweenawan dykes of the Lake Superior region—Evidence for evolution of the Middle Proterozoic Midcontinent rift of North America, in Halls, H.C., and Fahrig, W.F., eds., Mafic dyke swarms: St. John’s, Newfoundland, Canada, Geological Association of Canada, Geological Association of Canada Special Paper 34, p. 289–302.
Green, J.C., and Fitz, T.J., III, 1993, Extensive felsic lavas and rheoignimbrites in the Keweenawan Midcontinent rift plateau volcanics, Minnesota—Petrographic and field recognition: Journal of Volcanology and Geothermal Research, v. 54, no. 3–4, p. 177–196, accessed May 31, 2021, at https://doi.org/10.1016/0377-0273(93)90063-W.
Griffin, W.L., O’Reilly, S.Y., Abe, N., Aulbach, S., Davies, R.M., Pearson, N.J., Doyle, B.J., and Kivi, K., 2003, The origin and evolution of Archean lithospheric mantle: Precambrian Research, v. 127, no. 1–3, p. 19–41, accessed February 10, 2021, at https://doi.org/10.1016/S0301-9268(03)00180-3.
Halls, H.C., 1969, Compressional wave velocities of Keweenawan rock specimens from the Lake Superior region: Canadian Journal of Earth Sciences, v. 6, p. 555–568, accessed March 31, 2017, at https://doi.org/10.1139/e69-056. [Supplemental material received January 21, 2021, from the Canadian Federal Science Library.]
Halls, H.C., and West, G.F., 1971, A seismic refraction survey in Lake Superior: Canadian Journal of Earth Sciences, v. 8, no. 6, p. 610–630, accessed September 22, 2016, at https://doi.org/10.1139/e71-061.
Hart, T.R., and MacDonald, C.A., 2007, Proterozoic and Archean geology of the Nipigon Embayment—Implications for emplacement of the Mesoproterozoic Nipigon diabase sills and mafic to ultramafic intrusions: Canadian Journal of Earth Sciences, v. 44, no. 8, p. 1021–1040, accessed March 31, 2017, at https://doi.org/10.1139/e07-026.
Hinze, W.J., Allen, D.J., Braile, L.W., and Mariano, J., 1997, The Midcontinent Rift System—A major Proterozoic continental rift, in Ojakangas, R.W., Dickas, A.B., and Green, J.C., eds., Middle Proterozoic to Cambrian rifting, central North America: Boulder, Colo., Geological Society of America, Geological Society of America Special Paper 312, p. 7–35. [Also available at https://doi.org/10.1130/0-8137-2312-4.7.]
Hinze, W.J., Allen, D.J., Fox, A.J., Sunwood, D., Woelk, T., and Green, A.G., 1992, Geophysical investigations and crustal structure of the North American Midcontinent Rift System: Tectonophysics, v. 213, no. 1–2, p. 17–32, accessed January 16, 2017, at https://doi.org/10.1016/0040-1951(92)90248-5.
Hinze, W.J., Braile, L.W., and Chandler, V.W., 1990, A geophysical profile of the southern margin of the Midcontinent Rift System in western Lake Superior: Tectonics, v. 9, no. 2, p. 303–310, accessed October 6, 2014, at https://doi.org/10.1029/TC009i002p00303.
Hinze, W.J., and Chandler, V.W., 2020, Reviewing the configuration and extent of the Midcontinent Rift System: Precambrian Research, v. 342, article 105668, 18 p., accessed February 16, 2022, at https://doi.org/10.1016/j.precamres.2020.105688.
Hinze, W.J., Wold, R.J., and O’Hara, N.W., 1982, Gravity and magnetic anomaly studies of Lake Superior, chapter 10 of Wold, R.J., and Hinze, W.J., eds., Geology and tectonics of the Lake Superior basin: Boulder, Colo., Geological Society of America, Geological Society of America Memoir 156, p. 203–222. [Also available at https://doi.org/10.1130/MEM156-p203.]
Hodgin, E.B., Swanson-Hysell, N.L., DeGraff, J.M., Kylander-Clark, A.R.C., Schmitz, M.D., Turner, A.C., Zhang, Y., and Stolper, D.A., 2022, Final inversion of the Midcontinent rift during the Rigolet phase of the Grenvillian orogeny: Geology, v. 50, p. 547–551, accessed March 7, 2022, at https://doi.org/10.1130/G49439.1.
Hollings, P., Hart, T., Richardson, A., and MacDonald, C.A., 2007, Geochemistry of the Mesoproterozoic intrusive rocks of the Nipigon Embayment, northwestern Ontario—Evaluating the earliest phases of rift development: Canadian Journal of Earth Sciences, v. 44, no. 8, p. 1111–1129, accessed January 15, 2019, at https://doi.org/10.1139/e06-128.
Hollings, P., Smyk, M., Heaman, L.M., and Halls, H., 2010, The geochemistry, geochronology and paleomagnetism of dikes and sills associated with the Mesoproterozoic Midcontinent Rift near Thunder Bay, Ontario, Canada: Precambrian Research, v. 183, no. 3, p. 553–571, accessed March 31, 2017, at https://doi.org/10.1016/j.precamres.2010.01.012.
Hubbard, H.A., 1975, Geology of the Porcupine Mountains in Carp River and White Pine quadrangles, Michigan: Journal of Research of the U.S. Geological Survey, v. 3, p. 519–528. [Also available at https://pubs.usgs.gov/journal/1975/vol3issue5/report.pdf].
Huber, N.K., 1973, Geologic map of Isle Royale National Park, Keweenaw County, Michigan: U.S. Geological Survey Miscellaneous Investigations Map I-796, scale 1:62,500. [Also available at https://doi.org/10.3133/i796].
Huber, N.K., 1975, The geologic story of Isle Royale National Park: U.S. Geological Survey Bulletin 1309, 66 p. [Also available at https://doi.org/10.3133/b1309.]
Hughes, D.S., and Maurette, C., 1957, Variation of elastic wave velocities in basic igneous rocks with pressure and temperature: Geophysics, v. 22, no. 1, p. 23–31, accessed April 13, 2017, at https://doi.org/10.1190/1.1438332.
Hutchinson, D.R., White, R.S., Cannon, W.R., and Schulz, K.J., 1990, Keweenaw hot spot—Geophysical evidence for a 1.1 Ga mantle plume beneath the Midcontinent Rift System: Journal of Geophysical Research, v. 95, no. B7, p. 10,869–10,884, accessed March 27, 2018, at https://doi.org/10.1029/JB095iB07p10869.
Jirsa, M.A., Boerboom, T.J., and Chandler, V.W., 2012, Geologic map of Minnesota—Precambrian bedrock geology: Minnesota Geological Survey State Map S–22, scale 1:500,000, accessed December 5, 2019, at https://conservancy.umn.edu/handle/11299/154540.
Johnson, T.C., 1980, Late-glacial and postglacial sedimentation in Lake Superior based on seismic-reflection profiles: Quaternary Research, v. 13, no. 3, p. 380–391, accessed September 12, 2021, at https://doi.org/10.1016/0033-5894(80)90064-2.
Kaban, M.K., Tesauro, M., Mooney, W.D., and Cloetingh, S.A.P.L., 2014, Density, temperature, and composition of the North American lithosphere—New insights from a joint analysis of seismic, gravity, and mineral physics data—1. Density structure of the crust and upper mantle: Geochemistry, Geophysics, Geosystems, v. 15, no. 12, p. 4781–4807, accessed February 5, 2021, at https://doi.org/10.1002/2014GC005483.
Kalliokoski, J., 1982, Jacobsville Sandstone, chap. 7E of Wold, R.J., and Hinze, W.J., eds., Geology and tectonics of the Lake Superior basin: Boulder, Colo., Geological Society of America, Geological Society of America Memoir 156, p. 147–155. [Also available at https://doi.org/10.1130/MEM156-p147.]
Klasner, J.S., and Cannon, W.F., 1974, Geologic interpretation of gravity profiles in the western Marquette District, northern Michigan: Geological Society of America Bulletin, v. 85, no. 2, p. 213–218, accessed December 30, 2020, at https://doi.org/10.1130/0016-7606(1974)85<213:GIOGPI>2.0.CO;2.
Lightfoot, P.C., Sutcliffe, R.H., and Doherty, W., 1991, Crustal contamination identified in Keweenawan Osler Group tholeiites, Ontario—A trace element perspective: The Journal of Geology, v. 99, no. 5, p. 739–760, accessed February 10, 2019, at https://doi.org/10.1086/629536.
Lindblom, R.G., 1999, Review and analysis of wireline logs—The Terra-Patrick #7-22 borehole, chap. 10 of Dickas, A.B., and Mudrey, M.G., Jr., eds., Terra-Patrick #7-22 deep hydrocarbon test, Bayfield County, Wisconsin—Investigations and final report: Wisconsin Geological and Natural History Survey Miscellaneous Paper 97–1, p. 107–116.
Lineback, J.A., Dell, C.I., and Gross, D.L., 1979, Glacial and postglacial sediments in Lakes Superior and Michigan: Geological Society of America Bulletin, v. 90, no. 8, p. 781–791, accessed September 12, 2021, at https://doi.org/10.1130/0016-7606(1979)90<781:GAPSIL>2.0.CO;2.
Luetgert, J.H., and Meyer, R.P., 1982, Structure of the western basin of Lake Superior from cross structure refraction profiles, chap. 13 of Wold, R.J., and Hinze, W.J., eds., Geology and tectonics of the Lake Superior basin: Boulder, Colo., Geological Society of America, Geological Society of America Memoir 156, p. 245–256. [Also available at https://doi.org/10.1130/MEM156-p245.]
Maceira, M., and Ammon, C.J., 2009, Joint inversion of surface wave velocity and gravity observations and its application to central Asian basins shear velocity structure: Journal of Geophysical Research, v. 114, no. B2, article B02314, 18 p., accessed June 25, 2020, at https://doi.org/10.1029/2007JB005157.
MacTavish, A., Smyk, M., Good, D., and McBride, J., 2019, Field trip 6—Geology of the Coldwell alkaline complex, in MacTavish, A., and Hollings, P., eds., Institute on Lake Superior Geology, 65th Annual Meeting, Terrace Bay, Ontario, May 8–9, 2019, Proceedings part 2—Field trip guidebooks: Terrace Bay, Ontario, 65th Institute on Lake Superior Geology, v. 65, p. 75–104. [Also available at https://digitalcollections.lakeheadu.ca/exhibits/show/ilsg/item/2943.]
Magistrale, H.S., Clayton, R.W., and Graves, R., 2000, The SCEC Southern California reference three-dimensional seismic velocity model version 2: Bulletin of the Seismological Society of America, v. 90, no. 6B, p. S65–S76. [Also available at https://doi.org/10.1785/0120000510.]
Mariano, J., and Hinze, W.J., 1994, Gravity and magnetic models of the Midcontinent Rift in eastern Lake Superior: Canadian Journal of Earth Sciences, v. 31, no. 4, p. 661–674, accessed September 13, 2013, at https://doi.org/10.1139/e94-059.
Mavko, G., Mukerji, T., and Dvorkin, J., 2020, The rock physics handbook (3d ed.): Cambridge University Press, 727 p. [Also available at https://doi.org/10.1017/9781108333016.]
Merk, G.P., and Jirsa, M.A., 1982, Provenance and tectonic significance of the Keweenawan interflow sedimentary rocks, chap. 7B of Wold, R.J., and Hinze, W.J., eds., Geology and tectonics of the Lake Superior basin: Boulder, Colo., Geological Society of America, Geological Society of America Memoir 156, p. 97–105. [Also available at https://doi.org/10.1130/MEM156-p97.]
Miller, J.D., Jr., and Chandler, V.W., 1997, Geology, petrology, and tectonic significance of the Beaver Bay Complex, northeastern Minnesota, in Ojakangas, R.W., Dickas, A.B., and Green, J.C., eds., Middle Proterozoic to Cambrian rifting, central North America: Boulder, Colo., Geological Society of America, Geological Society of America Special Paper 312, p. 73–96. [Also available at https://doi.org/10.1130/0-8137-2312-4.73.]
Miller, J.D., Jr., and Green, J.C., 2002, Geology of the Beaver Bay Complex and related hypabyssal intrusions, in Miller, J.D., Jr., Green, J.C., Severson, M.J., Chandler, V.W., Hauck, S.A., Peterson, D.M., and Wahl, T.E., Geology and mineral potential of the Duluth Complex and related rocks of northeastern Minnesota: Minnesota Geological Survey Report of Investigations 58, p. 144–163, accessed March 31, 2017, at https://conservancy.umn.edu/handle/11299/58804.
Miller, J.D., Jr., Green, J.C., Severson, M.J., Chandler, V.W., and Peterson, D.M., 2001, Geologic map of the Duluth Complex and related rocks, northeastern Minnesota: Minnesota Geological Survey Miscellaneous Map Series M-119, 2 sheets, scale 1:200,000, accessed January 30, 2018, at https://conservancy.umn.edu/handle/11299/183.
Miller, J.D., Jr., and Severson, M.J., 2002, Geology of the Duluth Complex, in Miller, J.D., Jr., Green, J.C., Severson, M.J., Chandler, V.W., Hauck, S.A., Peterson, D.M., and Wahl, T.E., Geology and mineral potential of the Duluth Complex and related rocks of northeastern Minnesota: Minnesota Geological Survey Report of Investigations 58, p. 73–143, accessed March 31, 2017, at https://conservancy.umn.edu/handle/11299/58804.
Mooney, H.M., Craddock, C., Farnham, P.R., Johnson, S.H., and Volz, G., 1970a, Refraction seismic investigations of the northern Midcontinent gravity high: Journal of Geophysical Research, v. 75, no. 26, p. 5056–5086, accessed April 7, 2015, at https://doi.org/10.1029/JB075i026p05056.
Mooney, H.M., Farnham, P.R., Johnson, S.H., Volz, G., and Craddock, C., 1970b, Seismic studies over the Midcontinent gravity high in Minnesota and northwestern Wisconsin: Minnesota Geological Survey Report of Investigations 11, 191 p., accessed March 9, 2018, at https://conservancy.umn.edu/handle/11299/60391.
Mooney, W.D., and Kaban, M.K., 2010, The North American upper mantle—Density, composition, and evolution: Journal of Geophysical Research, v. 115, no. B12, article B12424, 24 p., accessed July 18, 2020, at https://doi.org/10.1029/2010JB000866.
Mooney, W.D., Prodehl, C., and Pavlenkova, N.I., 2002, Seismic velocity structure of the continental lithosphere from controlled source data: International Geophysics, v. 81, part A, p. 887–910, accessed July 18, 2020, at https://doi.org/10.1016/S0074-6142(02)80261-3.
Morey, G.B., 1977, Revised Keweenawan subsurface stratigraphy, southeastern Minnesota: Minnesota Geological Survey Report of Investigations 16, 67 p., accessed July 8, 2020, at https://conservancy.umn.edu/handle/11299/60420.
Morey, G.B., 1996, Continental margin assemblage, in Sims, P.K., and Carter, L.M.H., eds., Archean and Proterozoic geology of the Lake Superior region, U.S.A., 1993: U.S. Geological Survey Professional Paper 1556, p. 30–44. [Also available at https://pubs.er.usgs.gov/publication/pp1556.]
Morgan, N.A., 1969, Physical properties of marine sediments as related to seismic velocities: Geophysics, v. 34, no. 4, p. 529–545, accessed September 28, 2021, at https://doi.org/10.1190/1.1440029.
Morrison, D.A., Ashwal, L.D., Phinney, W.C., Shih, C., and Wooden, J.L., 1983, Pre-Keweenawan anorthosite inclusions in the Keweenawan Beaver Bay and Duluth Complexes, northeastern Minnesota: Geological Society of America Bulletin, v. 94, no. 2, p. 206–221, accessed June 9, 2020, at https://doi.org/10.1130/0016-7606(1983)94<206:PAIITK>2.0.CO;2.
Musacchio, G., White, D.J., Asudeh, I., and Thomson, C.J., 2004, Lithospheric structure and composition of the Archean western Superior Province from seismic refraction/wide-angle reflection and gravity modeling: Journal of Geophysical Research, v. 109, no. B3, article B03304, 28 p., accessed February 11, 2021, at https://doi.org/10.1029/2003JB002427.
Nicholson, S.W., Cannon, W.F., Woodruff, L.G., and Dicken, C.L., 2006, Bedrock geologic map of the Port Wing, Solon Springs, and parts of the Duluth and Sandstone 30ʹ × 60ʹ quadrangles, Wisconsin and Minnesota: U.S. Geological Survey Scientific Investigations Map 2869, scale 1:100,000. [Also available at https://doi.org/10.3133/sim2869].
Nicholson, S.W., Schulz, K.J., Shirey, S.B., and Green, J.C., 1997, Rift-wide correlation of 1.1 Ga Midcontinent Rift System basalts—Implications for multiple mantle sources during rift development: Canadian Journal of Earth Sciences, v. 34, no. 4, p. 504–520, accessed November 1, 2018, at https://doi.org/10.1139/e17-041.
Nitescu, B., Cruden, A.R., and Bailey, R.C., 2006, Crustal structure and implications for the tectonic evolution of the Archean Western Superior craton from forward and inverse gravity modeling: Tectonics, v. 25, no. 1, article TC1009, 16 p., accessed April 2, 2021, at https://doi.org/10.1029/2004TC001717.
O’Brien, P.N.S., 1968, Lake Superior crustal structure—A reinterpretation of the 1963 Seismic Experiment: Journal of Geophysical Research, v. 73, no. 8, p. 2669–2689, accessed July 5, 2017, at https://doi.org/10.1029/JB073i008p02669.
Ocola, L.C., and Meyer, R.P., 1973, Central North American Rift System—1. Structure of the axial zone from seismic and gravimetric data: Journal of Geophysical Research, v. 78, no. 23, p. 5173–5194, accessed February 4, 2022, at https://doi.org/10.1029/JB078i023p05173.
Ojakangas, R.W., and Dickas, A.B., 2002, The 1.1-Ga Midcontinent Rift System, central North America—Sedimentology of two deep boreholes, Lake Superior region: Sedimentary Geology, v. 147, no. 1–2, p. 13–36, accessed September 13, 2013, at https://doi.org/10.1016/S0037-0738(01)00185-3.
Ojakangas, R.W., Morey, G.B., and Green, J.C., 2001a, The Mesoproterozoic Midcontinent Rift System, Lake Superior region, USA: Sedimentary Geology, v. 141–142, p. 421–442, accessed September 13, 2013, at https://doi.org/10.1016/S0037-0738(01)00085-9.
Ojakangas, R.W., Morey, G.B., and Southwick, D.L., 2001b, Paleoproterozoic basin development and sedimentation in the Lake Superior region, North America: Sedimentary Geology, v. 141–142, p. 319–341, accessed November 26, 2019, at https://doi.org/10.1016/S0037-0738(01)00081-1.
Onizawa, S., Mikada, H., Watanabe, H., and Sakashita, S., 2002, A method for simultaneous velocity and density inversion and its application to exploration of subsurface structure beneath Izu-Oshima volcano, Japan: Earth, Planets, and Space, v. 54, p. 803–817, accessed July 15, 2020, at https://doi.org/10.1186/BF03352074.
Percival, J.A., Skulski, T., Sanborn-Barrie, M., Stott, G.M., Leclair, A.D., Corkery, M.T., and Boily, M., 2012, Geology and tectonic evolution of the Superior Province, Canada, chap. 6 of Percival, J.A., Cook, F.A., and Clowes, R.M., eds., Tectonic Styles in Canada—The LITHOPROBE perspective: St. John’s, Newfoundland, Canada, Geological Association of Canada, Geological Association of Canada Special Paper 49, p. 321–378.
Perry, H.K.C., Eaton, D.W.S., and Forte, A.M., 2002, LITH5.0—A revised crustal model for Canada based on Lithoprobe results: Geophysical Journal International, v. 150, no. 1, p. 285–294, accessed February 4, 2021, at https://doi.org/10.1046/j.1365-246X.2002.01712.x.
Petersen, T., 2001, Seismic refraction velocities in Minnesota: Minnesota Department of Natural Resources, Groundwater and Climatology Section, accessed September 15, 2021, at https://files.dnr.state.mn.us/waters/groundwater_section/geophysics/reports/seismic_refraction.pdf.
Peterson, D.E., Bedrosian, P.A., and Finn, C.A., 2021, 3-D modeling of the Duluth Complex from geophysical data, in Institute on Lake Superior Geology, 67th Annual Meeting [virtual events], May 11, 14, 18, and 21, 2021, Proceedings part 1—Program and abstracts: 67th Institute on Lake Superior Geology, v. 67, p. 52–53, accessed May 5, 2021, at https://digitalcollections.lakeheadu.ca/exhibits/show/ilsg/item/3063.
Peterson, D.M., and Severson, M.J., 2002, Archean and Paleoproterozoic rocks that form the footwall of the Duluth Complex, chap. 4 of Miller, J.D., Jr., Green, J.C., Severson, M.J., Chandler, V.W., Hauck, S.A., Peterson, D.M., and Wahl, T.E., Geology and mineral potential of the Duluth Complex and related rocks of northeastern Minnesota: Minnesota Geological Survey Report of Investigations 58, p. 76–93, accessed March 31, 2017, at https://conservancy.umn.edu/handle/11299/58804.
Planke, S., Symonds, P.A., Alvestad, E., and Skogseid, J., 2000, Seismic volcanostratigraphy of large-volume basaltic extrusive complexes on rifted margins: Journal of Geophysical Research, v. 105, no. B8, p. 19,335–19,351, accessed March 10, 2017, at https://doi.org/10.1029/1999JB900005.
Pollitz, F.F., and Mooney, W.D., 2016, Seismic velocity structure of the crust and shallow mantle of the Central and Eastern United States by seismic surface wave imaging: Geophysical Research Letters, v. 43, no. 1, p. 118–126, accessed August 29, 2021, at https://doi.org/10.1002/2015GL066637.
Rainsford, D.R.B., Carter-McAuslan, A., and Ashick-Stinson, L.C., 2018, Ontario specific gravity data for bedrock samples acquired from 1970 to 2014: Ontario Geological Survey, Miscellaneous Release—Data 371, accessed November 13, 2019, at http://www.geologyontario.mndmf.gov.on.ca/mndmaccess/mndm_dir.asp?type=pub&id=MRD371.
Rogala, B., Fralick, P.W., Heaman, L.M., and Metsaranta, R., 2007, Lithostratigraphy and chemostratigraphy of the Mesoproterozoic Sibley Group, northwestern Ontario, Canada: Canadian Journal of Earth Sciences, v. 44, no. 8, p. 1131–1149, accessed March 30, 2018, at https://doi.org/10.1139/e07-027.
Schön, J.H., 2015a, Density, chap. 4 of Schön, J.H., ed., Physical properties of rocks—Fundamentals and principles of petrophysics: Developments in Petroleum Science, v. 65, p. 109–118. [Also available at https://doi.org/10.1016/B978-0-08-100404-3.00004-4.]
Schön, J.H., 2015b, Elastic properties, chap. 6 of Schön, J.H., ed., Physical properties of rocks—Fundamentals and principles of petrophysics: Developments in Petroleum Science, v. 65, p. 167–268. [Also available at https://doi.org/10.1016/B978-0-08-100404-3.00006-8.]
Schulz, K.J., and Cannon, W.F., 2007, The Penokean orogeny in the Lake Superior region: Precambrian Research, v. 157, no. 1–4, p. 4–25, accessed March 26, 2014, at https://doi.org/10.1016/j.precamres.2007.02.022.
Sexton, J.L., and Henson, H., Jr., 1994, Interpretation of seismic reflection and gravity profile data in western Lake Superior: Canadian Journal of Earth Sciences, v. 31, no. 4, p. 652–660, accessed September 13, 2013, at https://doi.org/10.1139/e94-058.
Shay, J., and Tréhu, A., 1993, Crustal structure of the central graben of the Midcontinent Rift beneath Lake Superior: Tectonophysics, v. 225, no. 4, p. 301–335, accessed March 31, 2017, at https://doi.org/10.1016/0040-1951(93)90303-2.
Shen, W., Ritzwoller, M.H., and Schulte-Pelkum, V., 2013, Crustal and uppermost mantle structure in the central U.S. encompassing the Midcontinent Rift: Journal of Geophysical Research—Solid Earth, v. 118, no. 8, p. 4325–4344, accessed March 12, 2014, at https://doi.org/10.1002/jgrb.50321.
Silver, M.L., and Lineback, J.A., 1972, Velocity of sound in sediments cored from southern Lake Michigan: Illinois State Geological Survey Circular 475, 18 p., accessed September 12, 2021, at https://babel.hathitrust.org/cgi/pt?id=uiuo.ark:/13960/t7zk6jj86&view=1up&seq=1.
Sims, P.K., 1996, Minnesota River Valley subprovince (Archean gneiss terrane), in Sims, P.K., and Carter, L.M.H., eds., Archean and Proterozoic geology of the Lake Superior region, U.S.A., 1993: U.S. Geological Survey Professional Paper 1556, p. 14–23. [Also available at https://pubs.er.usgs.gov/publication/pp1556.]
Sims, P.K., and Day, W.C., 1993, The Great Lakes Tectonic Zone—Revisited: U.S. Geological Survey Bulletin 1904, 20 p. [Also available at https://doi.org/10.3133/b1904S.]
Sims, P.K., and Schulz, K.J., 1996, Wisconsin magmatic terranes, in Sims, P.K., and Carter, L.M.H., eds., Archean and Proterozoic geology of the Lake Superior region, U.S.A., 1993: U.S. Geological Survey Professional Paper 1556, p. 51–57. [Also available at https://pubs.er.usgs.gov/publication/pp1556.]
Smith, T.J., Steinhart, J.S., and Aldrich, L.T., 1966, Lake Superior crustal structure: Journal of Geophysical Research, v. 71, no. 4, p. 1141–1172. [Also available at https://doi.org/10.1029/JZ071i004p01141.]
Soller, D.R., 1992, Text and references to accompany map showing the thickness and character of Quaternary sediments in the glaciated United States east of the Rocky Mountains: U.S. Geological Survey Bulletin 1921, 54 p. [Also available at https://doi.org/10.3133/b1921.]
Soller, D.R., 1998, Map showing the thickness and character of Quaternary sediments in the glaciated United States east of the Rocky Mountains—Northern Great Lakes states and central Mississippi Valley states, the Great Lakes, and southern Ontario (80°31ʹ to 93° west longitude): U.S. Geological Survey Miscellaneous Investigations Series Map I-1970-B, scale 1:1,000,000. [Also available at https://doi.org/10.3133/i1970B.]
Soller, D.R., Packard, P.H., and Garrity, C.P., 2012, Database for USGS Map I-1970—Map showing the thickness and character of Quaternary sediments in the glaciated United States east of the Rocky Mountains: U.S. Geological Survey Data Series 656, accessed September 8, 2021, at https://pubs.usgs.gov/ds/656.
Southwick, D.L., 1996, Archean Superior Province, in Sims, P.K., and Carter, L.M.H., eds., Archean and Proterozoic geology of the Lake Superior region, U.S.A., 1993: U.S. Geological Survey Professional Paper 1556, p. 6–13. [Also available at https://doi.org/10.3133/pp1556.]
Sowers, T., and Boyd, O.S., 2019, Petrologic and mineral physics database for use with the U.S. Geological Survey National Crustal Model: U.S. Geological Survey Open-File Report 2019–1035, 17 p., accessed June 25, 2020, at https://doi.org/10.3133/ofr20191035.
Stein, C.A., Kley, J., Stein, S., Hindle, D., and Keller, G.R., 2015, North America’s Midcontinent rift—When rift met LIP: Geosphere, v. 11, no. 5, p. 1607–1616, accessed September 29, 2015, at https://doi.org/10.1130/GES01183.1.
Stewart, E.K., and Mauk, J.L., 2017, Sedimentology, sequence-stratigraphy, and geochemical variations in the Mesoproterozoic Nonesuch Formation, northern Wisconsin, USA: Precambrian Research, v. 294, p. 111–132, accessed April 25, 2017, at https://doi.org/10.1016/j.precamres.2017.03.023.
Suszek, T., 1997, Petrography and sedimentation of the middle Proterozoic (Keweenawan) Nonesuch Formation, western Lake Superior region, Midcontinent Rift System, in Ojakangas, R.W., Dickas, A.B., and Green, J.C., eds., Middle Proterozoic to Cambrian rifting, central North America: Boulder, Colo., Geological Society of America, Geological Society of America Special Paper 312, p. 195–210. [Also available at https://doi.org/10.1130/0-8137-2312-4.195.]
Talwani, M., Sutton, G.H., and Worzel, J.L., 1959, A crustal section across the Puerto Rico Trench: Journal of Geophysical Research, v. 64, no. 10, p. 1545–1555, accessed April 19, 2021, at https://doi.org/10.1029/JZ064i010p01545.
Tassara, A., 2006, Factors controlling the crustal density structure underneath active continental margins with implications for their evolution: Geochemistry, Geophysics, Geosystems, v. 7, no. 1, article Q01001, 21 p., accessed December 23, 2020, at https://doi.org/10.1029/2005GC001040.
Tesauro, M., Kaban, M.K., Mooney, W.D., and Cloetingh, S., 2014, NACr14—A 3D model for the crustal structure of the North American continent: Tectonophysics, v. 631, p. 65–86, accessed February 11, 2021, at https://doi.org/10.1016/j.tecto.2014.04.016.
Thiel, E.C., 1956, Correlation of gravity anomalies with the Keweenawan geology of Wisconsin and Minnesota: Geological Society of America Bulletin, v. 67, no. 8, p. 1079–1100, accessed August 6, 2019, at https://doi.org/10.1130/0016-7606(1956)67[1079:COGAWT]2.0.CO;2.
Thomas, M.D., and Teskey, D.J., 1994, An interpretation of gravity anomalies over the Midcontinent Rift, Lake Superior, constrained by GLIMPCE seismic and aeromagnetic data: Canadian Journal of Earth Sciences, v. 31, no. 4, p. 682–697, accessed September 13, 2013, at https://doi.org/10.1139/e94-061.
Tréhu, A., Morel-à-l’Huissier, P., Meyer, R., Hajnal, Z., Karl, J., Mereu, R., Sexton, J., Shay, J., Chan, W.-K., Epili, D., Jefferson, T., Shih, X.-R., Wendling, S., Milkereit, B., Green, A., and Hutchinson, D., 1991, Imaging the Midcontinent Rift beneath Lake Superior using large aperture seismic data: Geophysical Research Letters, v. 18, no. 4, p. 625–628, accessed December 29, 2016, at https://doi.org/10.1029/91GL00826.
Van Schmus, W.R., 1992, Tectonic setting of the Midcontinent Rift System, in Ziegler, P.A., ed., Geodynamics of rifting, volume 2, Case history studies on rifts—North and South American and Africa: Tectonophysics, v. 213, p. 1–15, accessed September 13, 2013, at https://doi.org/10.1016/B978-0-444-89912-5.50026-0.
Van Schmus, W.R., and Hinze, W.J., 1985, The Midcontinent Rift System: Annual Review of Earth and Planetary Sciences, v. 13, no. 1, p. 345–383, accessed July 5, 2017, at https://doi.org/10.1146/annurev.ea.13.050185.002021.
Weiblen, P.W., 1982, Keweenawan intrusive igneous rocks, chap. 6 of Wold, R.J., and Hinze, W.J., eds., Geology and tectonics of the Lake Superior basin: Boulder, Colo., Geological Society of America, Geological Society of America Memoir 156, p. 57–82. [Also available at https://doi.org/10.1130/MEM156-p57.]
White, W.S., 1960, The Keweenawan lavas of Lake Superior, an example of flood basalts: American Journal of Science, v. 258-A, p. 367–374, accessed November 27, 2018, at https://earth.geology.yale.edu/~ajs/BradleyVol.html.
White, W.S., 1966b, Tectonics of the Keweenawan Basin, Western Lake Superior region: U.S. Geological Survey Professional Paper 524-E, 23 p. [Also available at https://doi.org/10.3133/pp524E.]
White, W.S., 1972, The base of the Upper Keweenawan, Michigan and Wisconsin: U.S. Geological Survey Bulletin, v. 1354-F, p. F1–F23. [Also available at https://doi.org/10.3133/b1354F.]
Wisconsin Geological and Natural History Survey [WGNHS], 2009, wiscLITH—A digital lithologic and stratigraphic database of Wisconsin Geology (version 3): Wisconsin Geological and Natural History Survey Open-File Report 2009–03, accessed February 24, 2021, at https://wgnhs.wisc.edu/catalog/publication/000889/resource/wofr200903.
Wisconsin Geological and Natural History Survey [WGNHS], 2019, WGNHS data viewer: Wisconsin Geological and Natural History Survey web application, accessed February 18, 2021, at https://data.wgnhs.wisc.edu/data-viewer.
Wold, R.J., Hutchinson, D.R., and Johnson, T.C., 1982, Topography and surficial structure of Lake Superior bedrock as based on seismic reflection profiles, chap. 14 of Wold, R.J., and Hinze, W.J., eds., Geology and tectonics of the Lake Superior basin: Boulder, Colo., Geological Society of America, Geological Society of America Memoir 156, p. 257–272. [Also available at https://doi.org/10.1130/MEM156-p257.]
Woodruff, L.G., Schulz, K.J., Nicholson, S.W., and Dicken, C.L., 2020, Mineral deposits of the Mesoproterozoic Midcontinent Rift system in the Lake Superior region—A space and time classification: Ore Geology Reviews, v. 126., article 103716, 21 p., accessed August 26, 2020, at https://doi.org/10.1016/j.oregeorev.2020.103716.
Zhang, H., van der Lee, S., Wolin, E., Bollmann, T.A., Revenaugh, J., Wiens, D.A., Frederiksen, A.W., Darbyshire, F.A., Aleqabi, G.I., Wysession, M.E., Stein, S., and Jurdy, D.M., 2016, Distinct crustal structure of the North American Midcontinent Rift from P wave receiver functions: Journal of Geophysical Research—Solid Earth, v. 121, no. 11, p. 8136–8153, accessed November 22, 2016, at https://doi.org/10.1002/2016JB013244.
Appendix 1. Supporting Data and Information
Table 1.1.
Bulk densities compiled for rock types older than the Midcontinent Rift System in the Lake Superior region.[Densities are reported by geographic area and general rock type. Rock types are grouped by crystalline (igneous and metamorphic) versus sedimentary or metasedimentary origin and silica content (from felsic to ultramafic compositions) except where only one or two rock types were sampled in the data source. Data were limited to locations within the study area before analysis. —, information is unavailable; kg/m3, kilograms per cubic meter]
| Rock type | Province or domain1 | Average (kg/m3) | Range of densities (kg/m3)2 | Number of samples or averages3 | Data source |
|---|---|---|---|---|---|
| Metasedimentary rocks (Marquette Range Supergroup) | Penokean domain | 2,654 | 2,300–2,950 | 191 samples | Anderson and others (2020; actual range of values) |
| Metasedimentary rocks (Michigamme Slate) |
Penokean domain | 3,000 | 2,180–3,720 | 98 samples | Dutch and others (1995) |
| Metasedimentary rocks (Marquette Range Supergroup, including iron formations) |
Penokean domain | 3,010 | 2,650–3,560 | 5 averages | Klasner and Cannon (1974) |
| Metasedimentary and metavolcanic rocks | Penokean domain | 2,720 | 2,350–3,030 | — | Klasner and others (1979) |
| Felsic igneous and metamorphic rocks, undifferentiated | Penokean domain | 2,662 | 2,580–2,744 | 135 samples | Anderson and others (2020) |
| Granite | Penokean domain | 2,690 | 2,630–2,740 | 114 samples | Dutch and others (1995) |
| Felsic metavolcanic rocks | Penokean domain | 2,670 | 2,550–2,770 | 7 samples | Dutch and others (1995) |
| Intermediate igneous and metamorphic rocks, undifferentiated | Penokean domain | 2,783 | 2,620–2,947 | 50 samples | Anderson and others (2020) |
| Mafic igneous and metamorphic rocks, undifferentiated | Penokean domain | 2,862 | 2,639–3,086 | 107 samples | Anderson and others (2020) |
| Mafic metavolcanic rocks | Penokean domain | 2,950 | 2,700–3,060 | 58 samples | Dutch and others (1995) |
| Ultramafic igneous and metamorphic rocks | Penokean domain | 2,975 | 2,722–3,228 | 97 samples | Anderson and others (2020) |
| Felsic igneous and metamorphic rocks | Superior Province | 2,683 | 2,478–2,888 | 67 samples | Anderson and others (2020) |
| Granite, granite gneiss, migmatite, and pegmatite | Superior Province | 2,680 | 2,500–2,800 | — | Klasner and others (1979) |
| Gneiss and granite | Superior Province | 2,640 | 2,610–2,730 | 15 samples | Dutch and others (1995) |
| Mafic igneous and metamorphic rocks, undifferentiated | Superior Province | 2,980 | 2,970–3,000 | 4 samples | Anderson and others (2020; actual range of values) |
| Mafic gneiss and metagabbro | Superior Province | 2,920 | 2,800–3,330 | — | Klasner and others (1979) |
| Archean rocks, undivided | Superior Province | 2,700 | 2,550–3,050 | 71 samples | Anderson and others (2020; actual range of values) |
| Slate | Animikie basin | 2,792 | 2,720–2,864 | 54 samples | Chandler and Lively (2021) |
| Metagraywacke | Animikie basin | 2,744 | 2,668–2,820 | 44 samples | Chandler and Lively (2021) |
| Quartzite | Animikie basin | 2,696 | 2,580–2,940 | 35 samples | Chandler and Lively (2021; actual range of values) |
| Schist | Animikie basin | 2,875 | 2,690–3,090 | 16 samples | Chandler and Lively (2021; actual range of values) |
| Metasedimentary and sedimentary rocks | Wawa subprovince | 2,756 | 2,731–2,780 | 3 averages; 92 samples | Chandler (2002) |
| Felsic igneous and metamorphic rocks | Wawa subprovince | 2,686 | 2,613–2,742 | 7 averages; 176 samples | Chandler (2002) |
| Mafic and intermediate igneous and metamorphic rocks | Wawa subprovince | 2,790 | 2,695–2,888 | 4 averages; 96 samples | Chandler (2002) |
| Ultramafic rocks | Wawa subprovince | 2,942 | 2,916–2,962 | 3 averages; 43 samples | Chandler (2002) |
| Sandstone, siltstone, shale | Sibley Group | 2,624 | 2,320–3,030 | 23 samples | Rainsford and others (2018; actual range of values) |
| Metasedimentary rocks, undivided | Superior Province | 2,761 | 2,543–2,979 | 164 samples | Rainsford and others (2018) |
| Felsic igneous and metamorphic rocks | Superior Province | 2,709 | 2,517–2,902 | 1,823 samples | Rainsford and others (2018) |
| Tonalitic gneiss | Superior Province | 2,710 | — | 20 samples | Thomas and Teskey (1994) |
| Intermediate igneous and metamorphic rocks | Superior Province | 2,772 | 2,535–3,008 | 860 samples | Rainsford and others (2018) |
| Mafic igneous and metamorphic rocks | Superior Province | 2,943 | 2,712–3,174 | 1,978 samples | Rainsford and others (2018) |
| Ultramafic rocks | Superior Province | 2,923 | 2,660–3,186 | 123 samples | Rainsford and others (2018) |
Archean or Proterozoic province, subprovince, or other tectonic domain as indicated on figure 1 in the main report.
Statistics reported for Anderson and others (2020), Chandler and Lively (2021), and Rainsford and others (2018) are derived directly from their respective digital databases. Because minimum and maximum values are commonly population extrema, the range of values are instead reported as the average ± 2 standard deviation, except where noted. Specific gravity values from Rainsford and others (2018) were converted to density by assuming a water density of 1,000 kg/m3.
Where both the number of averages and the number of samples are noted, the listed average value and range are the average and range of the averages reported by the data source. In these cases, the number of samples are the total number that were used in the data source to compute the averages. Total number of rock samples that were analyzed by Klasner and others (1979) is greater than 70, but how many samples were measured for each rock type is unknown.
Table 1.2.
Criteria used for selection of data used in histograms of density measurements and associated statistical reports.[Criteria used for first-order sorting in the database is translated from abbreviations provided by each reference for column headings. Rock types or geologic units are listed only if they were used as selection criteria. Terms match what is used in the database(s). All data were limited to the geographic extents of the study area (fig. 1) before selection. Data for outlier samples were removed before statistical analysis. <, less than; >, greater than; kg/m3, kilograms per cubic meter; intr, intrusive; sed, sedimentary; undef, undefined; volc, volcanic]
| Histogram title and figure | Database citation | First-order criteria | Rock type or rock unit criteria | Outliers removed |
|---|---|---|---|---|
| Superior Province, Ontario (fig. 10A) | Rainsford and others (2018) | Age=Archean;Geologic Province=Superior | Felsic rocks: feldspar porphyry, felsic intr, felsic tuff, felsic undef, felsic volc,
gneiss biotitic, gneiss other, gneiss tonalitic, granite, granodiorite, latite, migmatite,
rhyolite, schist felsic, schist quartzitic, schist sericitic, syenite, tonalite, trachyte,
trondhjemite, tuff cherty, tuff lapilli, tuff crystal Intermediate rocks: andesite, dacite, diorite, intermediate intr, intermediate tuff, intermediate volc, monzodiorite, monzogranite, monzonite, schist intermediate, syenogranite Mafic rocks: amphibolite, anorthosite, basalt, diabase, gabbro, gabbronorite, mafic igneous, mafic volc, schist mafic, tholeiite Ultramafic rocks: hornblendite, komatiite, peridotite, pyroxenite, ultramafic intr, ultramafic volc Metasedimentary rocks: baritic sed, carbonate sed, chert, conglomerate, greywacke, limestone, mudstone, pelite, quartzite, sandstone, schist biotitic, schist chloritic, sediment other, shale, siltstone |
2 samples <2,300 kg/m3 and 8 samples >3,300 kg/m3 |
| Superior Province, Minnesota (fig. 10B) | Chandler and Lively (2021) | Major divisions=Quetico and Wawa subprovinces | All rock types listed that report density values | 3 samples <2,300 kg/m3 and 20 samples >3,300 kg/m3 |
| Superior Province, Wisconsin-Michigan (fig. 10C) | Anderson and others (2020) | Age=Archean | All rock types listed that report density values | None |
| Paleoproterozoic crystalline rocks, Wisconsin-Michigan (fig. 10D) | Anderson and others (2020) | Age=Paleoproterozoic | Badwater Greenstone, Beecher Formation1, Humboldt Granite1, mafic metavolcanic rocks, Marinette Quartz Diorite, McAllister Formation, metagabbro, Newingham Tonalite, Peavy Pond Complex, Pembine ophiolite, Pemene Formation, porphyritic red granite, pyroxenite, Quinnesec Formation, Spikehorn Creek Granite, Twelve Foot Falls Quartz Diorite | None |
| Diabase (fig. 15A) | Chandler and Lively (2021) | Major division=Midcontinent Rift | Diabase, including rocks from Beaver Bay Complex, Carlton County dike swarm, Endion sill, Grand Portage dike swarm, Hat Point dike, Hovland sill, Lester River sill, intrusions in North Shore Volcanic Group, Northland sill, Stony Point-Knife Island sill, and unspecified rock units | 1 sample <2,450 kg/m3 |
| Gabbro, troctolite and troctolitic gabbro (fig. 15B) | Chandler and Lively (2021) | Major division=Midcontinent Rift | Gabbro, including rocks from Beaver Bay Complex, intrusions in North Shore Volcanic
Group or Keweenawan lavas, Duluth Complex, and unspecified rock units Troctolite, including rocks from intrusions in the North Shore Volcanic Group, Duluth Complex, and unspecified rock units Troctolitic gabbro from the Duluth Complex and an intrusion in the North Shore Volcanic Group |
None |
| Paleoproterozoic metasedimentary rocks, Minnesota (fig. 17A) | Chandler and Lively (2021) | Major division=Penokean-Yavapai orogens | Denham Formation, Pokegama Quartzite, Thomson Formation, Virginia Formation | 3 samples <2,500 kg/m3 and 5 samples >3,100 kg/m3 |
| Paleoproterozoic metasedimentary rocks, Michigan and Wisconsin (fig. 17B) | Anderson and others (2020) | Age=Paleoproterozoic | Brier Slate1; Felch Formation; Fern Creek Formation; Michigamme Formation in Calumet trough, at Peavy Pond, and at Menominee Iron Range; Randville Dolomite; Sturgeon Quartzite | 11 samples <2,300 kg/m3 |
| Lower Mesoproterozoic Sibley Group, Ontario (fig. 17C) | Rainsford and others (2018) | Age=Proterozoic; Geologic Province= Southern-NW |
Sandstone, siltstone, shale | 1 extrema <2,460 kg/m3 and 2 extrema >2,860 kg/m3 |
Table 1.3.
Measured ranges of density and velocity for basalts of the Keweenawan Supergroup and equivialents from Halls (1969), by geologic unit, locality, and sample type.[Laboratory measurements of velocity are reported for a confining pressure of 193 megapascals from the supplemental data of Halls (1969). Densities were measured with no confining pressure. Geologic units reported by Halls (1969) were updated to those of figure 4 by comparing the location descriptions to geologic maps of Cannon and others (1995), Miller and others (2001), Cannon and Nicholson (2001), and Jirsa and others (2012). km/s, kilometers per second; kg/m3, kilograms per cubic meter]
Conversion Factors
International System of Units to U.S. customary units
Datum
Vertical coordinate information is referenced to the North American Vertical Datum of 1988 (NAVD 88).
Horizontal coordinate information is referenced to the North American Datum of 1983 (NAD 83).
Abbreviations
DSDP
Deep-Sea Drilling Program
Fm
formation
Ga
giga-annum [billions of years]
GLIMPCE
Great Lakes International Multidisciplinary Program on Crustal Evolution
MGW
metagraywacke
MRS
Midcontinent Rift System
NAD 83
North American Datum of 1983
USGS
U.S. Geological Survey
WGNHS
Wisconsin Geological and Natural History Survey
Disclaimers
Any use of trade, firm, or product names is for descriptive purposes only and does not imply endorsement by the U.S. Government.
Although this information product, for the most part, is in the public domain, it also may contain copyrighted materials as noted in the text. Permission to reproduce copyrighted items must be secured from the copyright owner.
Suggested Citation
Grauch, V.J.S., 2023, Compressional-wave seismic velocity, bulk density, and their empirical relations for geophysical modeling of the Midcontinent Rift System in the Lake Superior region: U.S. Geological Survey Scientific Investigations Report 2023–5061, 60 p., https://doi.org/10.3133/sir20235061.
ISSN: 2328-0328 (online)
Study Area
| Publication type | Report |
|---|---|
| Publication Subtype | USGS Numbered Series |
| Title | Compressional-wave seismic velocity, bulk density, and their empirical relations for geophysical modeling of the Midcontinent Rift System in the Lake Superior region |
| Series title | Scientific Investigations Report |
| Series number | 2023-5061 |
| DOI | 10.3133/sir20235061 |
| Publication Date | July 19, 2023 |
| Year Published | 2023 |
| Language | English |
| Publisher | U.S. Geological Survey |
| Publisher location | Reston, VA |
| Contributing office(s) | Crustal Geophysics and Geochemistry Science Center, Geology, Geophysics, and Geochemistry Science Center |
| Description | viii, 60 p. |
| Country | Canada, United States |
| Other Geospatial | Lake Superior |
| Online Only (Y/N) | Y |